Field Test and Analysis of Energy-Saving Effects of Energy-Recovery Ventilators on Heat-Pump Electricity Consumption in a Classroom


Department of Architecture, Inha University, Incheon 22212, Korea
*
Author to whom correspondence should be addressed.
Sustainability 2019, 11(7), 2069; https://doi.org/10.3390/su11072069
Submission received: 16 March 2019
/
Revised: 2 April 2019
/
Accepted: 3 April 2019
/
Published: 8 April 2019
(This article belongs to the Collection Green Building Technologies)
Abstract
:Energy-recovery ventilators (ERVs) are regarded as important energy-saving systems in buildings. It has been reported that they have high energy-saving rates compared with conventional ventilators that operate without energy recovery, but the saving rates have been obtained typically by employing chamber tests and simulations. In this work, a field-test method is proposed that uses a single test room but alternates the tested ventilation modes hourly. This proposed method is useful because an additional comparison room is not always available and can be a source of uncertainty for field tests. The test is performed in a classroom during a heating period, and the results are calibrated to account for different experimental conditions during the test period. The calibrated energy-saving rates indicate the effectiveness of the ERV; however, they are lower in the early hours of the system operation, for two reasons: (1) the maximum power control schemes of the heat pumps are applied for cases where the indoor temperatures are far lower than the set-point temperature; (2) the ventilation load seemingly represents a decreasing proportion of the total heating load in early hours owing to the thermal-capacity effects for the building, which was cooled for many hours. The findings are verified via a chamber test and simulations. As a consequence, it is important to account for actual system characteristics affected by the thermal behaviors of classrooms when the overall performance of a system is evaluated.
1. Introduction
As buildings become highly insulated, the proportion of ventilation loads to total building loads is increasing [1,2]. Therefore, efficient management of the heat loss due to ventilation is important for zero-energy or passive buildings [3,4,5,6]. In many countries, it is difficult to perform natural ventilation, because of the large amount of pollution, such as fine dust, in outdoor air [7,8,9]. For such reasons, energy-recovery ventilators (ERVs) have been installed in buildings to recover the energy in the controlled indoor air and to filter out pollution. By recovering energy from the exhaust air, the ventilation load can be reduced [10,11,12].
Several studies have been conducted to evaluate the energy-saving performance of ERV systems. The main methodology involves chamber tests and simulations [13,14,15]. Chamber tests can provide accurate results but under controlled conditions, particularly steady-state conditions. The purpose of the chamber test is typically to compare the nominal performance among devices. Simulations are useful for evaluating the performance of systems during different seasons, with varying conditions. For instance, Liu et al. conducted simulation tests to evaluate the energy performance of an ERV system in summer and winter for apartments in different local climates. Choi et al. analyzed the heating-energy demand during the heating season by using a variable heat-exchange efficiency of the ERV for residential buildings, which was also used to evaluate the proportion of the ventilation load. However, in simulations, many unknown values must be set in a deterministic manner or according to personal experience, resulting in errors and variations in the results [16].
Field measurements can be effective for evaluating the realistic energy-saving performance of an ERV. As current ERV systems have two ventilation modes, the energy-saving performance can be evaluated by alternating the modes. One is the energy-recovery ventilation mode, and the other is the bypass mode without recovery. To evaluate the energy-saving effects of the ERV, test and comparison rooms are needed to compare the energy consumption under the different ventilation modes. However, identical conditions between the rooms cannot be guaranteed in most field tests, because the rooms are occupied. Additionally, even though the rooms may appear similar, the thermal properties and system performances cannot be the same, because of various uncertainties in the construction and maintenance phases. Thus, conventional comparison methods using both test and comparison rooms may yield erroneous results, particularly for field measurements. Thus far, most studies have employed such approaches. One solution is to use a single test room and alternate the target ERV modes. For instance, Fan et al. [17] measured the mean energy consumption of heat pumps for an entire building with respect to the ERV modes, which were changed daily. Because no calibration method was applied, only the mean energy-saving rate over a long test period may be meaningful. In their study, the test was performed over a year. In most cases, it is difficult to run field tests for such a long period.
In classrooms, ventilation is important for comfort and thus successful education [18,19]. The required ventilation rates are high for a high density of students. A coupled electric heat pump (EHP) and ERV system is common for heating, cooling, and ventilation of classrooms in Korea. This coupled system is controlled in a combined manner. The ERV mode is used for reducing the ventilation loads in periods with dominant heating or cooling, and the bypass mode can be used during inter-season periods and in summer for special control, such as night purging [20,21]. The energy-saving effects of the ERV mode in classrooms were reported to be similar to those in other buildings; however, these results were obtained via chamber tests or simulations. In classrooms, the ERV and EHP operate only for 6 to 8 h per day; thus, unsteady-state thermal behaviors occur more often than in residential buildings. It is important to understand the energy-consumption pattern of the EHP and evaluate the energy-saving effects of the ERV mode for further developments in control.
Herein, we propose a field-test methodology applicable to classrooms. This may help understanding actual system characteristics affected by the thermal behaviors of classrooms. The method can be employed with a short test period, as a calibration method is also provided. This is done by the fact that shorter test periods are much favored for occupied buildings since occupants’ activities are bothered by instruments installed for field tests. To verify the calibrated results, a typical chamber test and simulations are conducted, anticipating that the pattern of the calibrated energy-saving rates may match the chamber test and simulation results. In this work, the chamber test is achieved to directly investigate the energy-saving effects of the tested ERV and the transient variations of the effects under controlled environments. On the other hand, simulations are useful to verify that the pattern found in the field test is valid under dynamic conditions.
2. Description of Test Classroom
2.1. Classroom Equipped with EHP and ERV
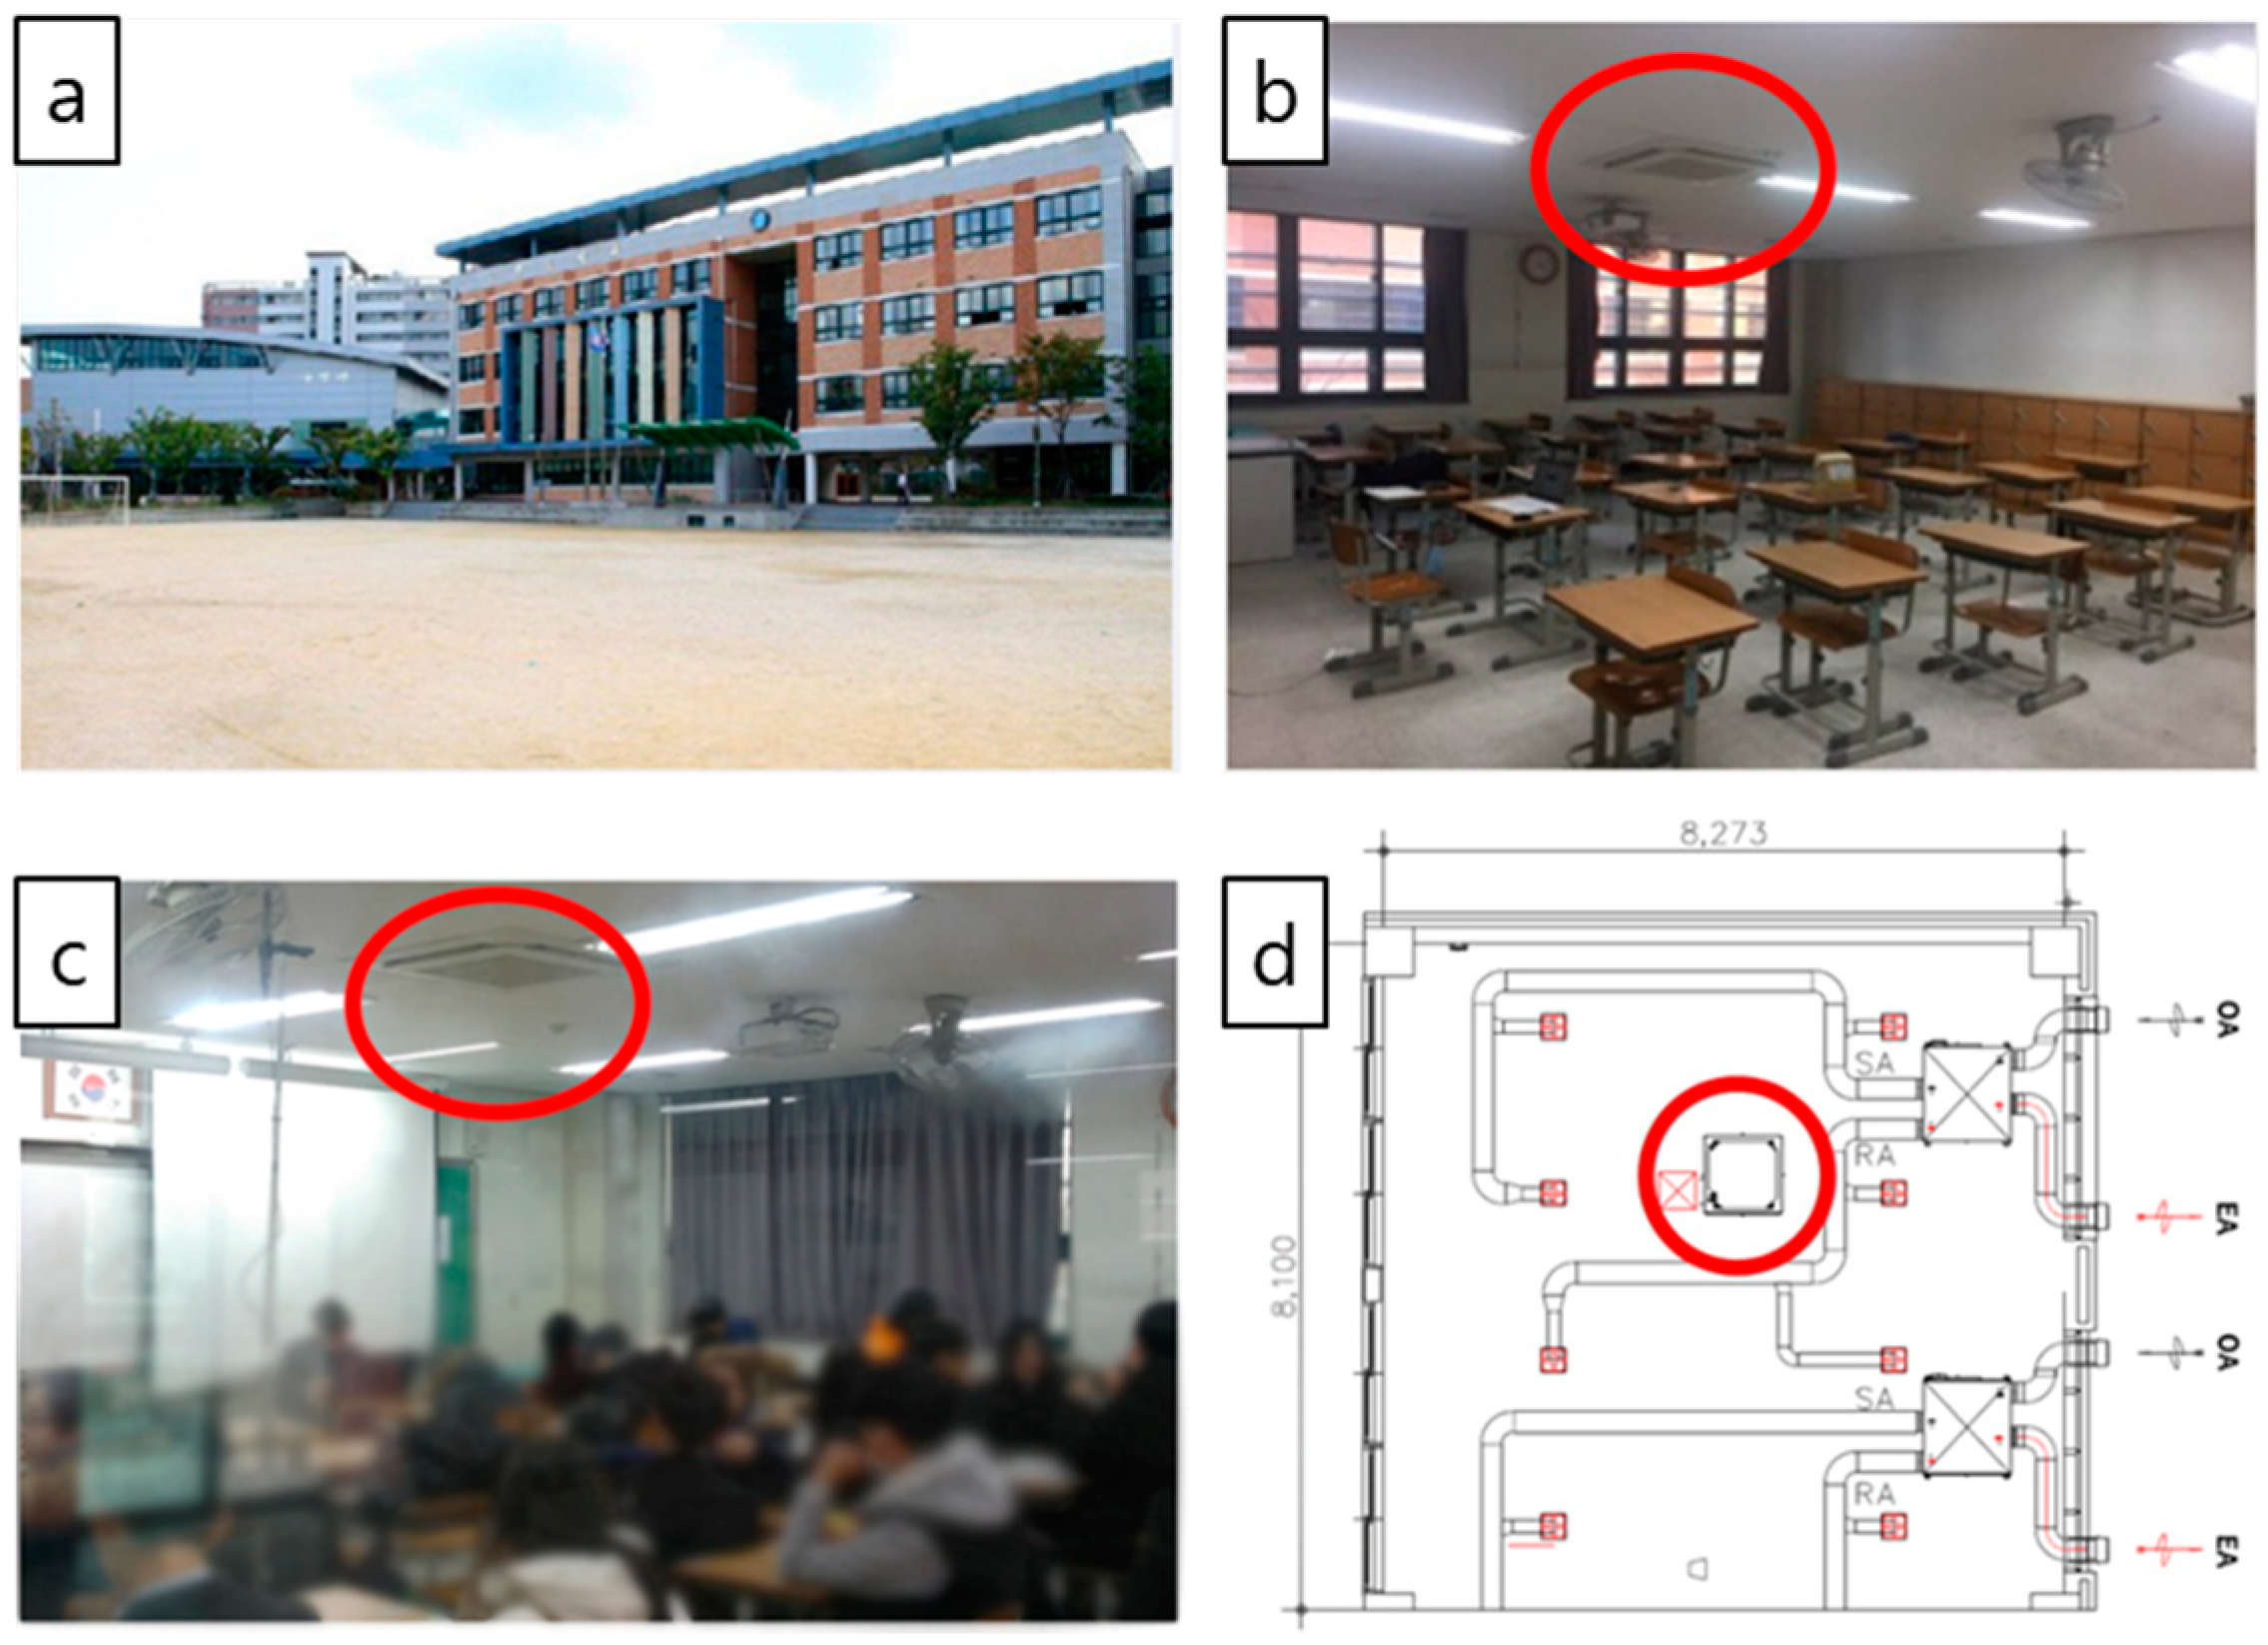
Field tests were conducted at a middle school in Seoul, Korea. The school building was constructed 20 years ago; however, the test classroom was located on an attached building constructed four years ago. The constructed building is described in Table 1. The classrooms in the building had an EHP and ERV, and the classrooms and hallway areas were well-insulated. The school facility and details regarding the EHP and ERV system in the test classroom are shown in Figure 1.
One EHP and two ERVs were installed in the test classroom. The EHP, which was used for heating and cooling, was located in the middle of the classroom, as indicated by the red circles in Figure 1. The ERVs were inside the ceiling, near the outdoor area. One of the ERVs served both the test classroom and adjacent classrooms. However, the two ERVs were operated identically according to the control signal from the test classroom. One ERV was connected to three pairs of supply and exhaust ducts, and the other ERV was connected to a single set of ducts for the test classroom, as shown in the bottom-right of Figure 1. Detailed specifications of the EHP and ERV are presented in Table 2. As the field tests were performed during winter, the specifications correspond to the heating case. The EHP was a multi-type system that employed a single outdoor unit (ODU) connected to four indoor units (IDUs). The air flow rate (expressed in cubic meter per hour (CMH), which is equal to m3/h) was higher in the ODU than in the IDU. Thus, it is important to estimate a proper proportion of ODU consumption for the test classroom. The measurement method is detailed in the following section.
2.2. Measurement of Power Consumption of EHP
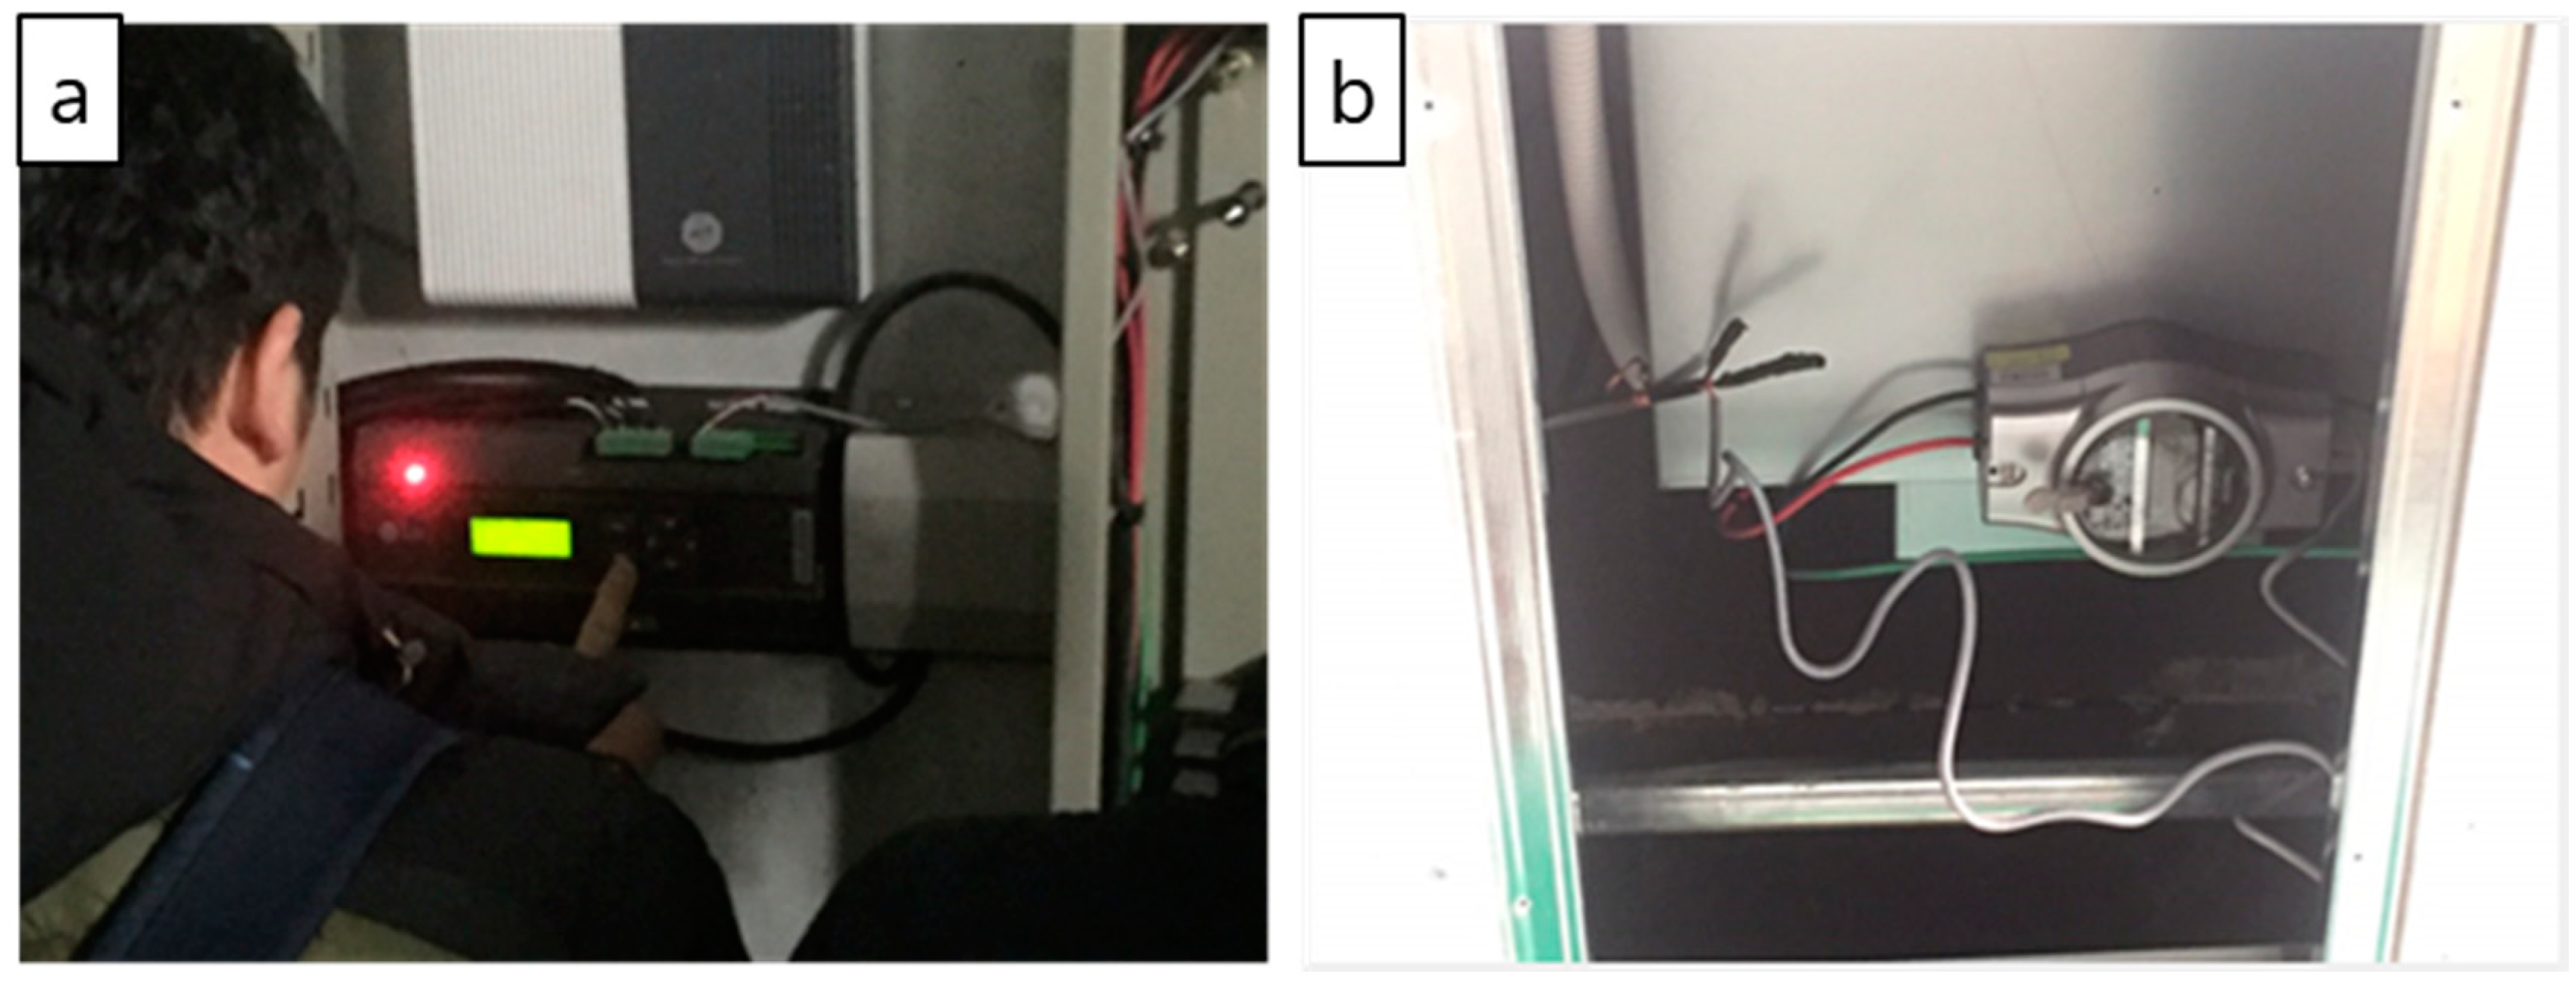
As explained previously, the ODU was connected to multiple IDUs in different classrooms. Therefore, it was necessary to distribute the energy consumption of the ODU among the IDUs. A power-distribution indicator (PDI) allocated the total consumption of the ODU to the IDUs. A PDI was installed in an electrical power system (EPS) room located on each floor, as shown in Figure 2. Each ERV and IDU employed a watt-hour meter, as shown in Figure 2, to measure the consumption. The PDI transmitted the hourly cumulative energy of all the systems to a control platform.
2.3. Chamber Test for Energy-Saving Rates of ERV and EHP Systems
Obviously, the EHP coupled with the ERV consumes more energy in the bypass mode than in the ERV mode. Typically, the energy-saving rates can be evaluated using a chamber test; however, the values are obtained under steady-state conditions. Thus, the set-point temperature and outside temperature of the chamber were kept constant. Using a chamber test, the energy consumptions of the EHP in the different ERV modes were compared. The test conditions are presented in Table 3 and are in accordance with the national regulations of KS B 6879 [22]. The set-point temperature of the classroom was 20 °C in the field test while it was 22 °C for this chamber test. It was because the temperature sensor mounted on the intake air side of the EHP was used for the chamber test while the room thermostat sensor was used for the classroom test. Since the temperature gradient was typically found within a room when the EHP operated, a similar set-point temperature was used for both cases.
3. Measurement and Calibration Methods
3.1. Proposed Field-Test Method for Evaluating Energy-Saving Rates
As discussed in the Introduction, we measured the energy-saving rates for the same classroom with the alternation of the ventilation modes. Because the EHP energy consumption can vary according to several factors, it is important to keep the test conditions unchanged during the measurement. The indoor set-point temperature was kept constant during the test, and the test classroom was preheated for 2 h before the measurement. This was due to the fact that classroom conditions couldn’t be controlled during these early hours particularly before the first class for different activities of students and frequent opening of doors. In addition, this was related to the control algorithm of the EHP. At early hours, the indoor temperatures were significantly lower than the set-point temperature during winter; thus, the EHP was operated at the maximum power regardless of the heating load (which included the ventilation load). Thus, it was useless to measure the EHP consumption while changing the ventilation mode. In addition, the number of students and classroom conditions cannot be controlled during these early hours particularly before the first class for different activities of students and frequent door opening.
To maintain the test conditions over time, the test was performed on a day when the outdoor temperatures remained relatively unchanged. The energy consumption was compared on an hourly basis, as the duration of a class is 45 min, and 15 min is allocated for a break. Therefore, the ventilation mode was changed every hour. The energy-saving rates were obtained by comparing the results for subsequent hours. Within an hour, the heating loads may not vary, as the weather conditions do not change significantly. Thus, the assumption of the test method was that the heating loads were only a function of the ventilation modes over subsequent hours, and the conditions of the test room were maintained to the greatest extent possible.
3.2. Calibration Method
Typically, field tests involve uncontrollable conditions. In this study, the number of students in the classroom was such a condition. The classroom was occupied by different numbers of students over time, as classes were held in various places. Because people are heat sources, the number of students was considered for the comparison. To adjust the measured energy consumption for the same conditions, a calibration method was required. We employed the energy-balance equation set to calculate the temperature of the indoor air. In Equation (1), the time-variable indoor temperatures are balanced by the sum of the rates of heat transfer due to ventilation (Qv) through the building envelope (Qs), from the internal heat source (Qi), and from the heating system (). The final factor represents the EHP power consumption; thus, it is converted into heat via multiplication by a coefficient of performance (COP). When the measured consumption is compared only with the subsequently measured , the Qs and COP can be regarded as quasi-constant. This is because the indoor and outdoor temperatures change slowly. Thus, when the indoor conditions remain the same, the consumption difference () between subsequent measurements is only a function of difference in the ventilation load (), as indicated by Equation (2).
One factor that can vary over the measuring time-steps is the internal heat source. Qi represents the heat emitted by students. In this study, Qi was calculated by multiplying the number of students by the sensible heat emitted per person. For the latter, a value of 65 W, corresponding to a seated and light-working case, was used, as recommended ASHRAE [23]. The proposed calibration equation is Equation (3). The measured energy consumption is calibrated to by the second term on the right-hand side of Equation (3). This term is obtained from Equation (1) but can also be deduced from a common energy-balance relationship. The total number of students in the test classroom was 31, corresponding to . When the number of students is reduced during a measurement interval, the difference between and can lead to a lower value of compared with . The energy-saving rate was evaluated using this calibrated energy consumption, as indicated by Equation (4). The calibrated results for adjacent intervals were used, in accordance with the aforementioned assumptions.
4. Simulation Analysis for Validating Field-Test Results
The field test was performed in a single classroom for a limited period; thus, it is worthwhile to compare the results of the field test with those of simulations for various conditions and periods. Additionally, simulations can be used to validate the proposed calibration method.
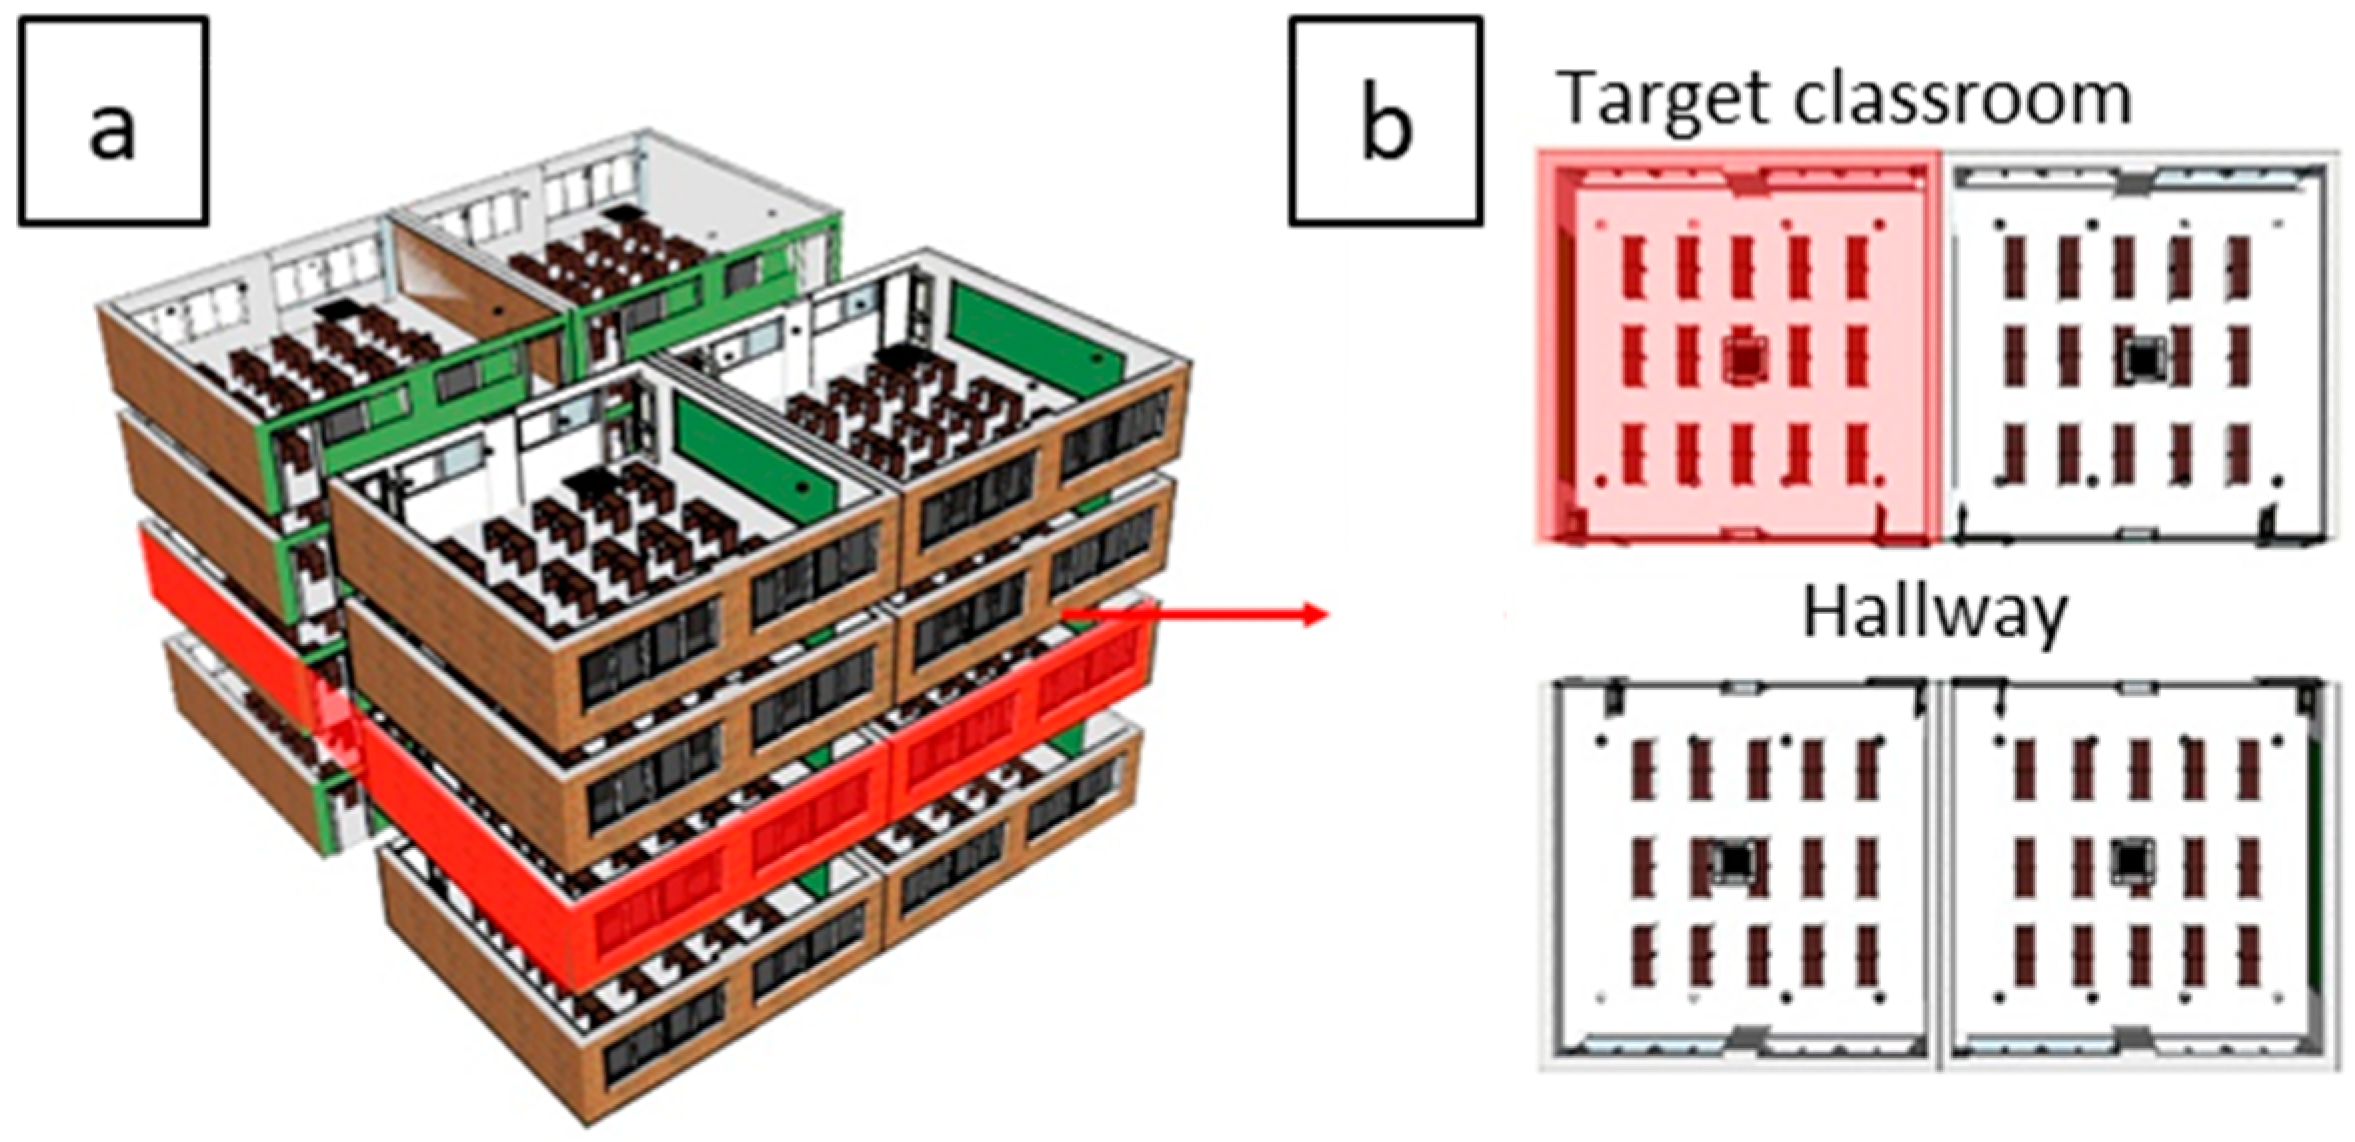
A simulation was performed using TRNSYS [24]. The classrooms were modeled using construction documents, and the physical properties of the building components were set according to these documents. The purpose of the simulation was not to obtain accurate values of the energy-saving rates but to understand the variation of the energy-saving rates over a long period under the ERV and bypass modes. Figure 3 shows the entire building model. The target classroom (marked in red) was on the second floor. Other classrooms were also modeled under similar system operations, to examine the thermal effects of adjacent classrooms. Table 4 presents the simulation conditions. The operating schedule of the ERV and EHP system was defined according to the classes in a common middle school.
The EHP and ERV systems were modeled using the catalogue provided by the manufacturers. The ERV was modeled using a heat-exchanger model in TRNSYS, and the heat-exchange efficiency was set as given in Table 4. The EHP characteristics, such as the power input (PI) and the amount of heat (TC), were employed to measure the energy consumption of the EHP according to the energy provided. The PI and TC were functions of the indoor and outdoor temperatures. In this study, rather than using a heat-pump model, simple regression equations were employed (Equations (5) and (6)). Here, indicates the indoor temperatures, represents the outdoor dry-bulb temperatures, and in Equation (6) represents the TC value obtained from Equation (5). The coefficients (a1, a2, …, d2, d3) were obtained via optimization using values for various measurement points provided by the manufacturer. The values provided by the manufacturer ranged from −19.8 to 15 °C for the outdoor temperature and from 16 to 24 °C for the indoor temperature.
5. Results
5.1. Field Test and Calibration Results
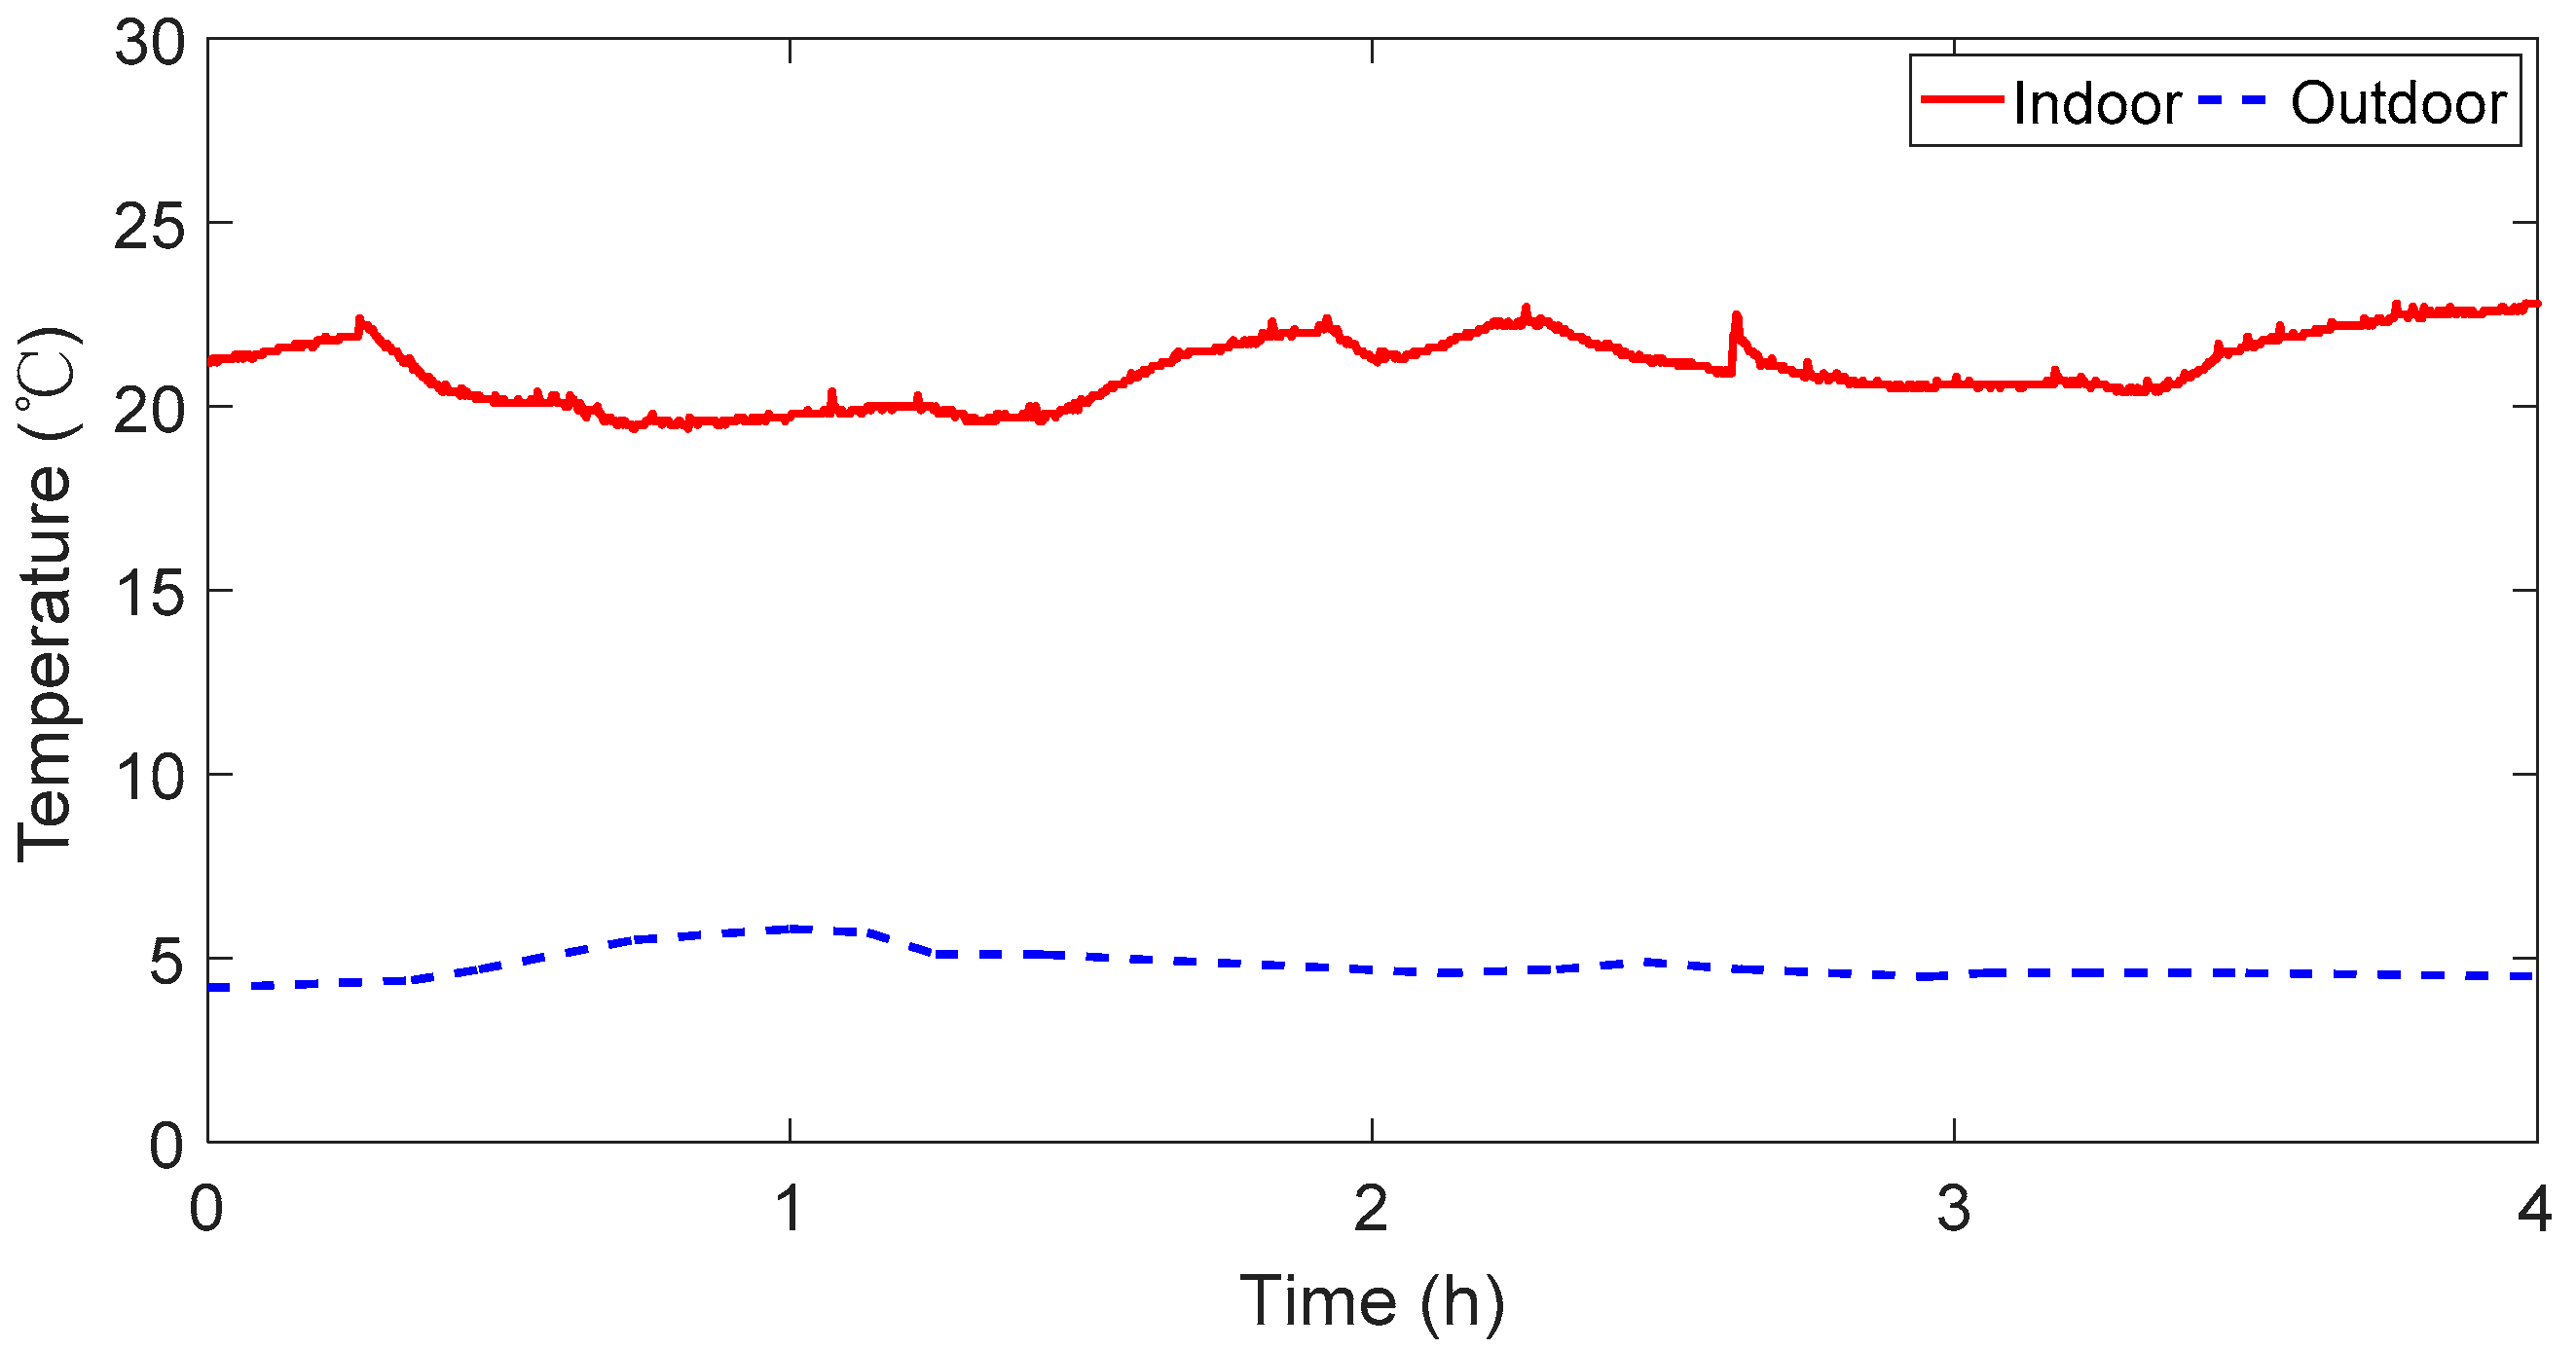
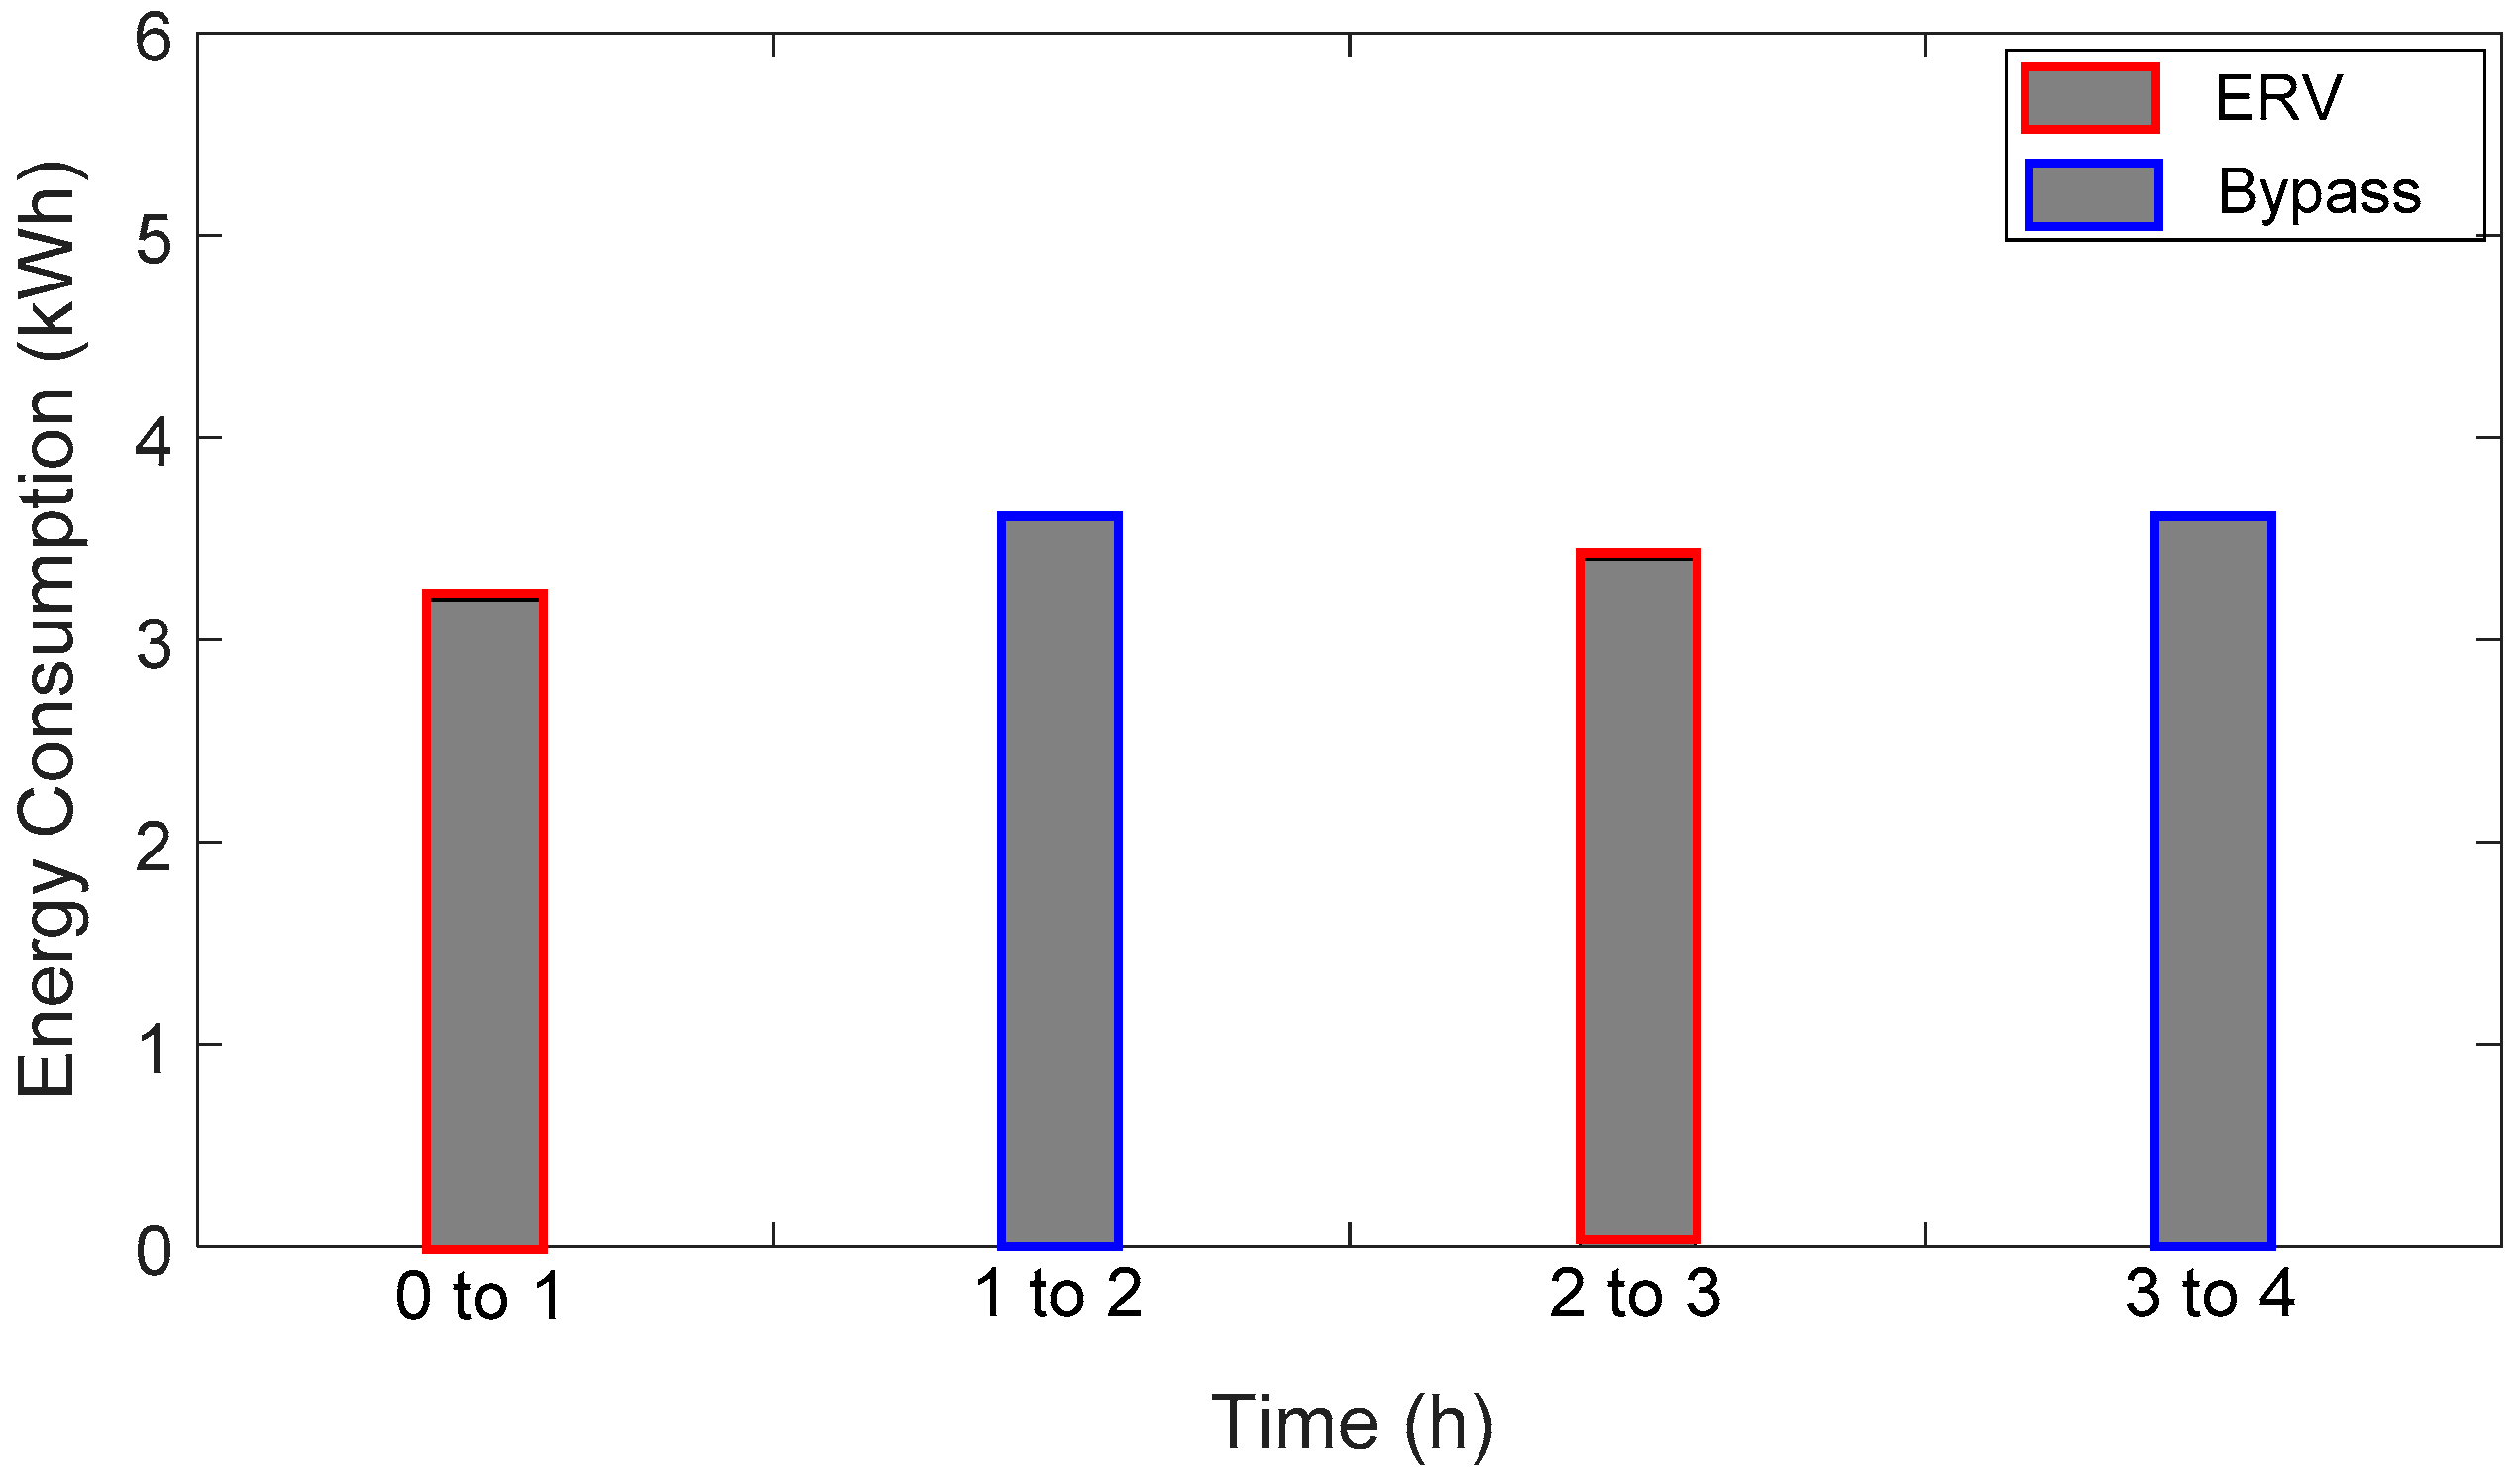
Figure 4 shows the indoor and outdoor temperatures measured during the field test. The outdoor temperatures remained almost unchanged (approximately 5 °C), and the indoor temperatures fluctuated around the set-point temperature. Figure 5 shows the measured energy consumption of the EHP for each interval under different ventilation modes. The results in Figure 5 are not calibrated. The number of students changed over the test period; thus, calibration using Equation (3) was required.
Table 5 presents the measured and calibrated energy consumptions. In the first hour, the classroom was ventilated under the ERV mode, and in the second hour, the bypass mode was applied. The mode was changed every hour, as shown in Figure 5. For the first and third time intervals of the ERV mode, the calibrated energy consumptions were reduced owing to the reduced number of students. Only half of the reference number of students occupied the classroom during the first hour, and no students were found in the classroom during the third interval, because of a gym class. For the bypass hours, the number of students in the classroom was equal to the reference number.
The energy-saving rates for two consecutive hours were calculated and compared, as shown in Table 6. Before the calibration, the energy-saving rates were calculated as 11% for the first cycle and 5.6% for the second and third cycles. After the calibration, they became 18.06% and were maintained at 19.44%. According to the calibrated results, the ERV mode was effective for reducing the energy consumption. Additionally, the energy-saving rates appeared to increase slightly and then level off over time. This behavior is investigated in the following sections.
5.2. Chamber-Test Results
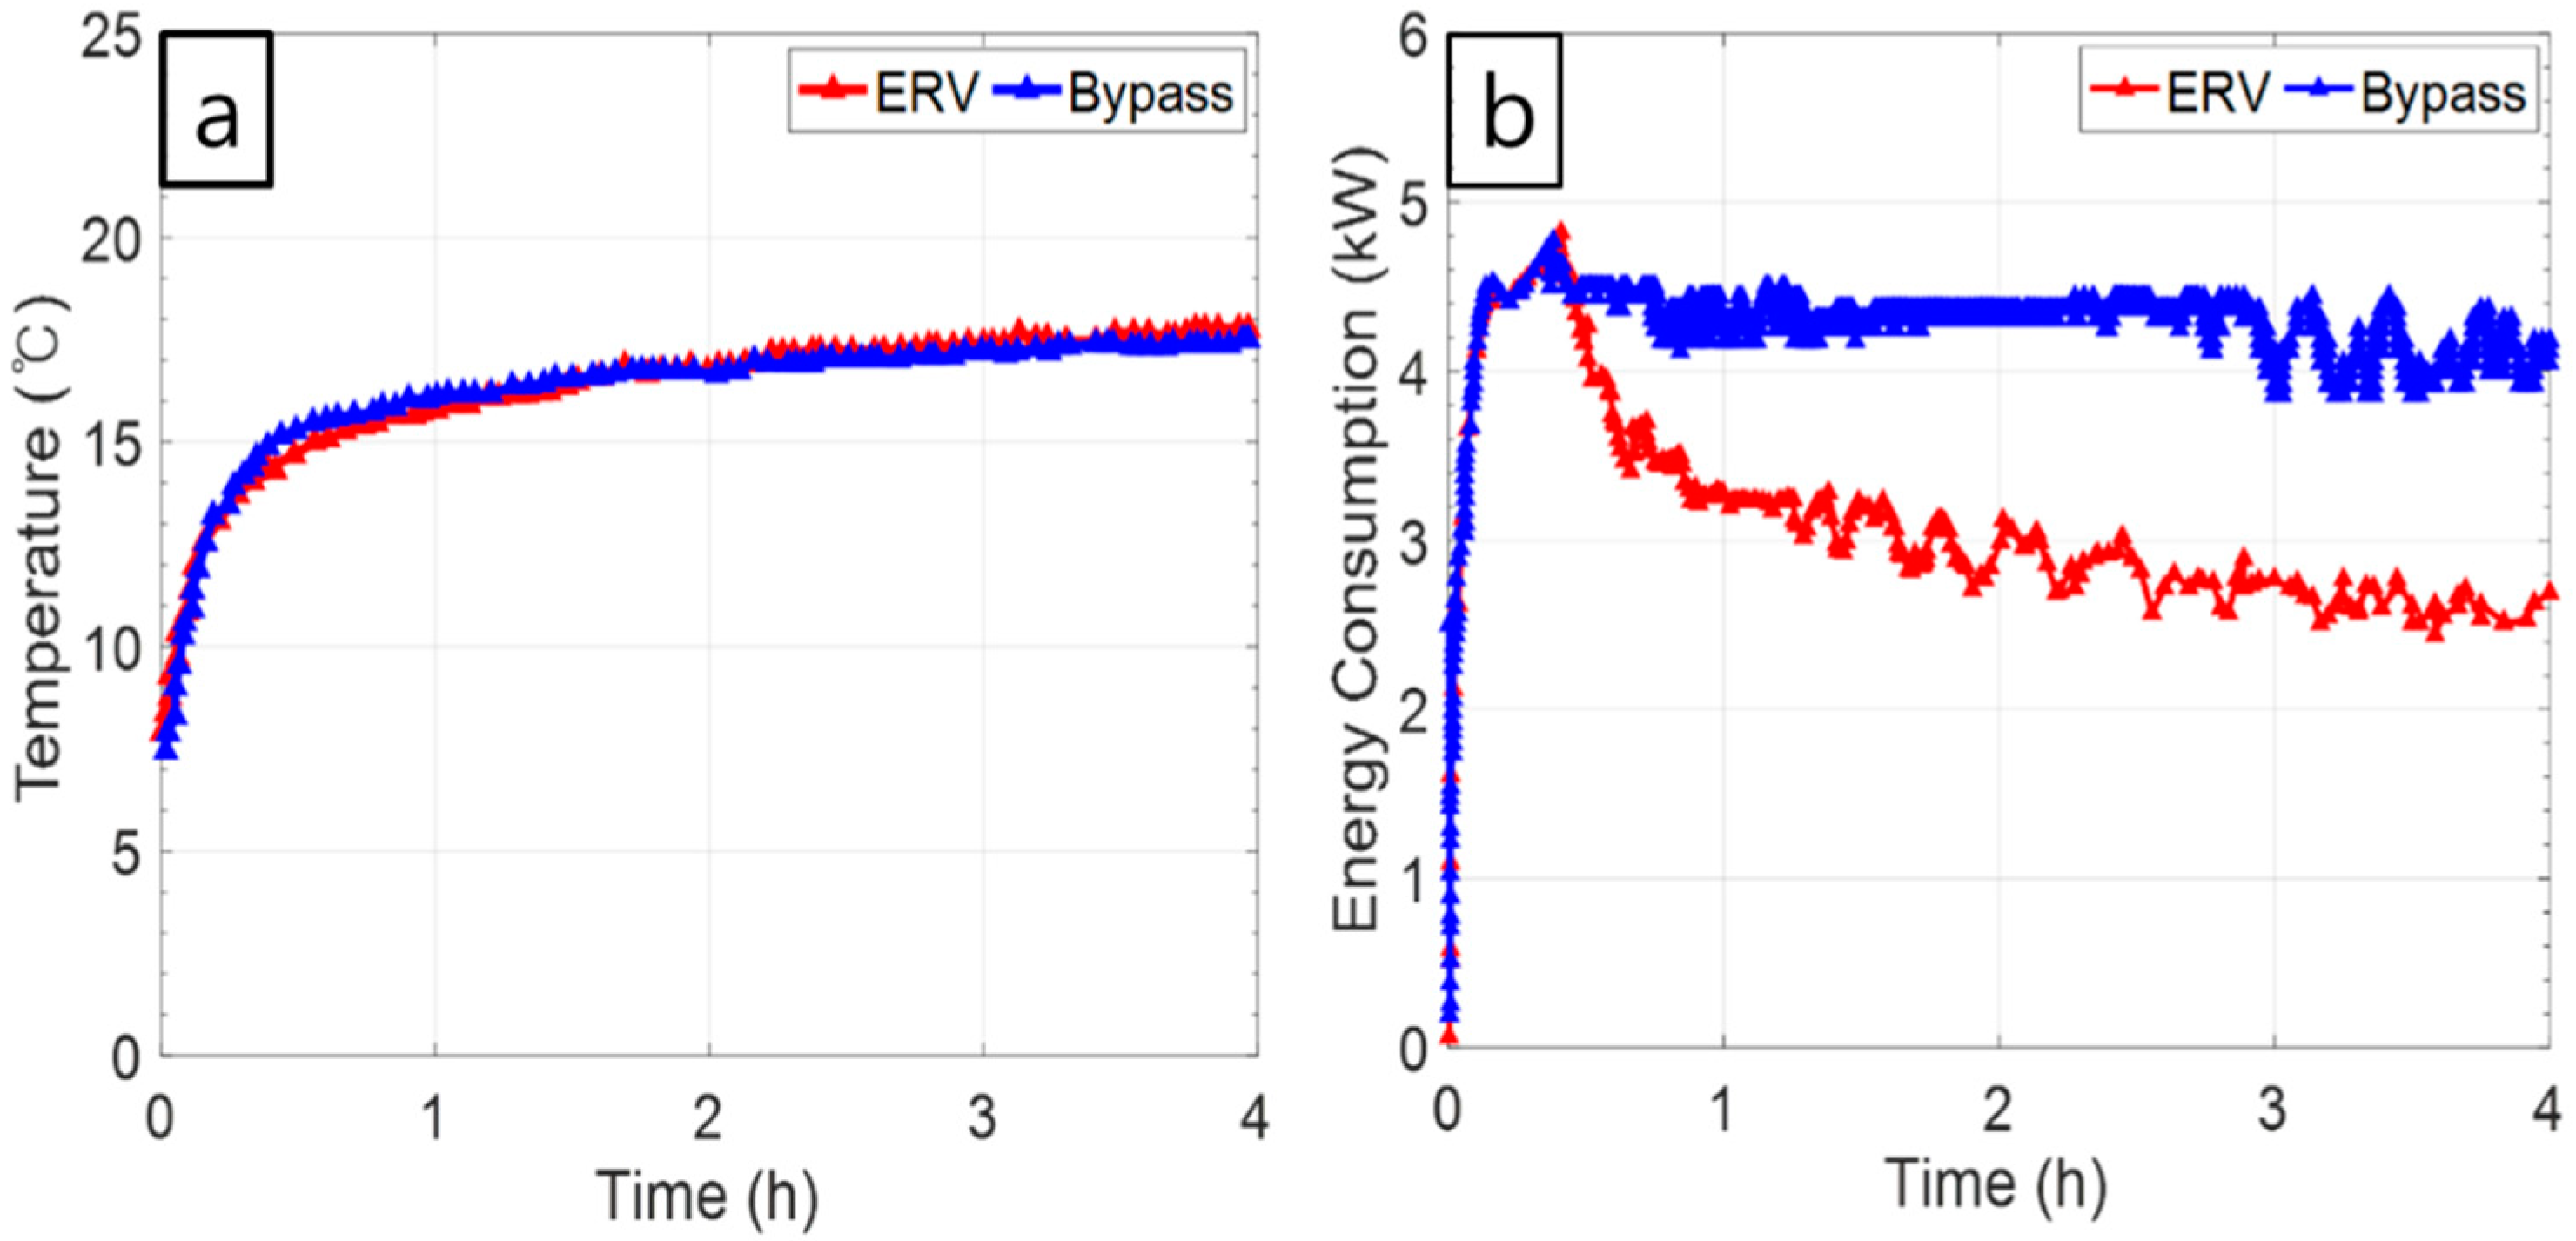
The EHP and ERV used in the field test were mounted in a test chamber. One ventilation mode was tested for a certain period, and the same test was repeated for the other ventilation mode. Figure 6 shows the indoor temperatures and energy consumptions during the test period for the ERV and bypass modes. In the initial minutes, the indoor temperatures rapidly increased in both cases, and the EHP was clearly operated at the maximum power during this time, as shown in the right frame of Figure 6. Subsequently, the temperatures increased slowly, suggesting proportional control. Over time, the energy-consumption patterns became distinct, and the EHP energy consumption in the ERV mode decreased.
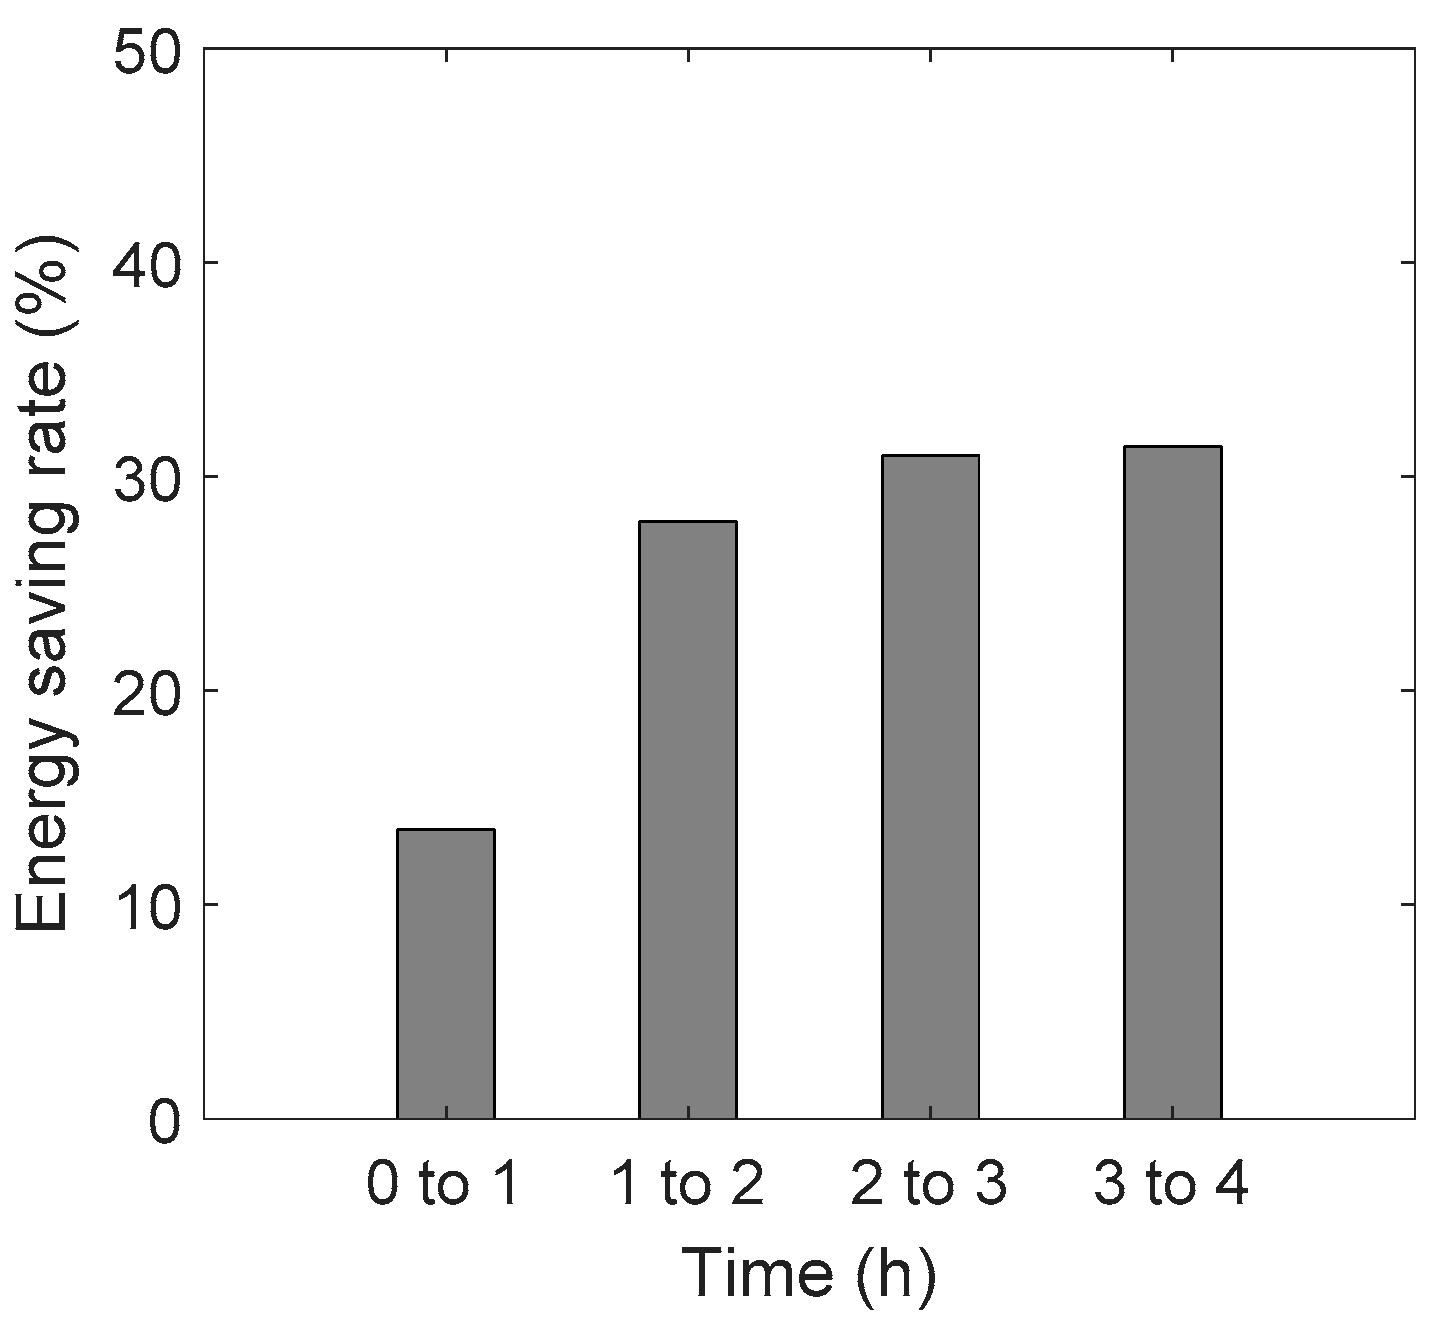
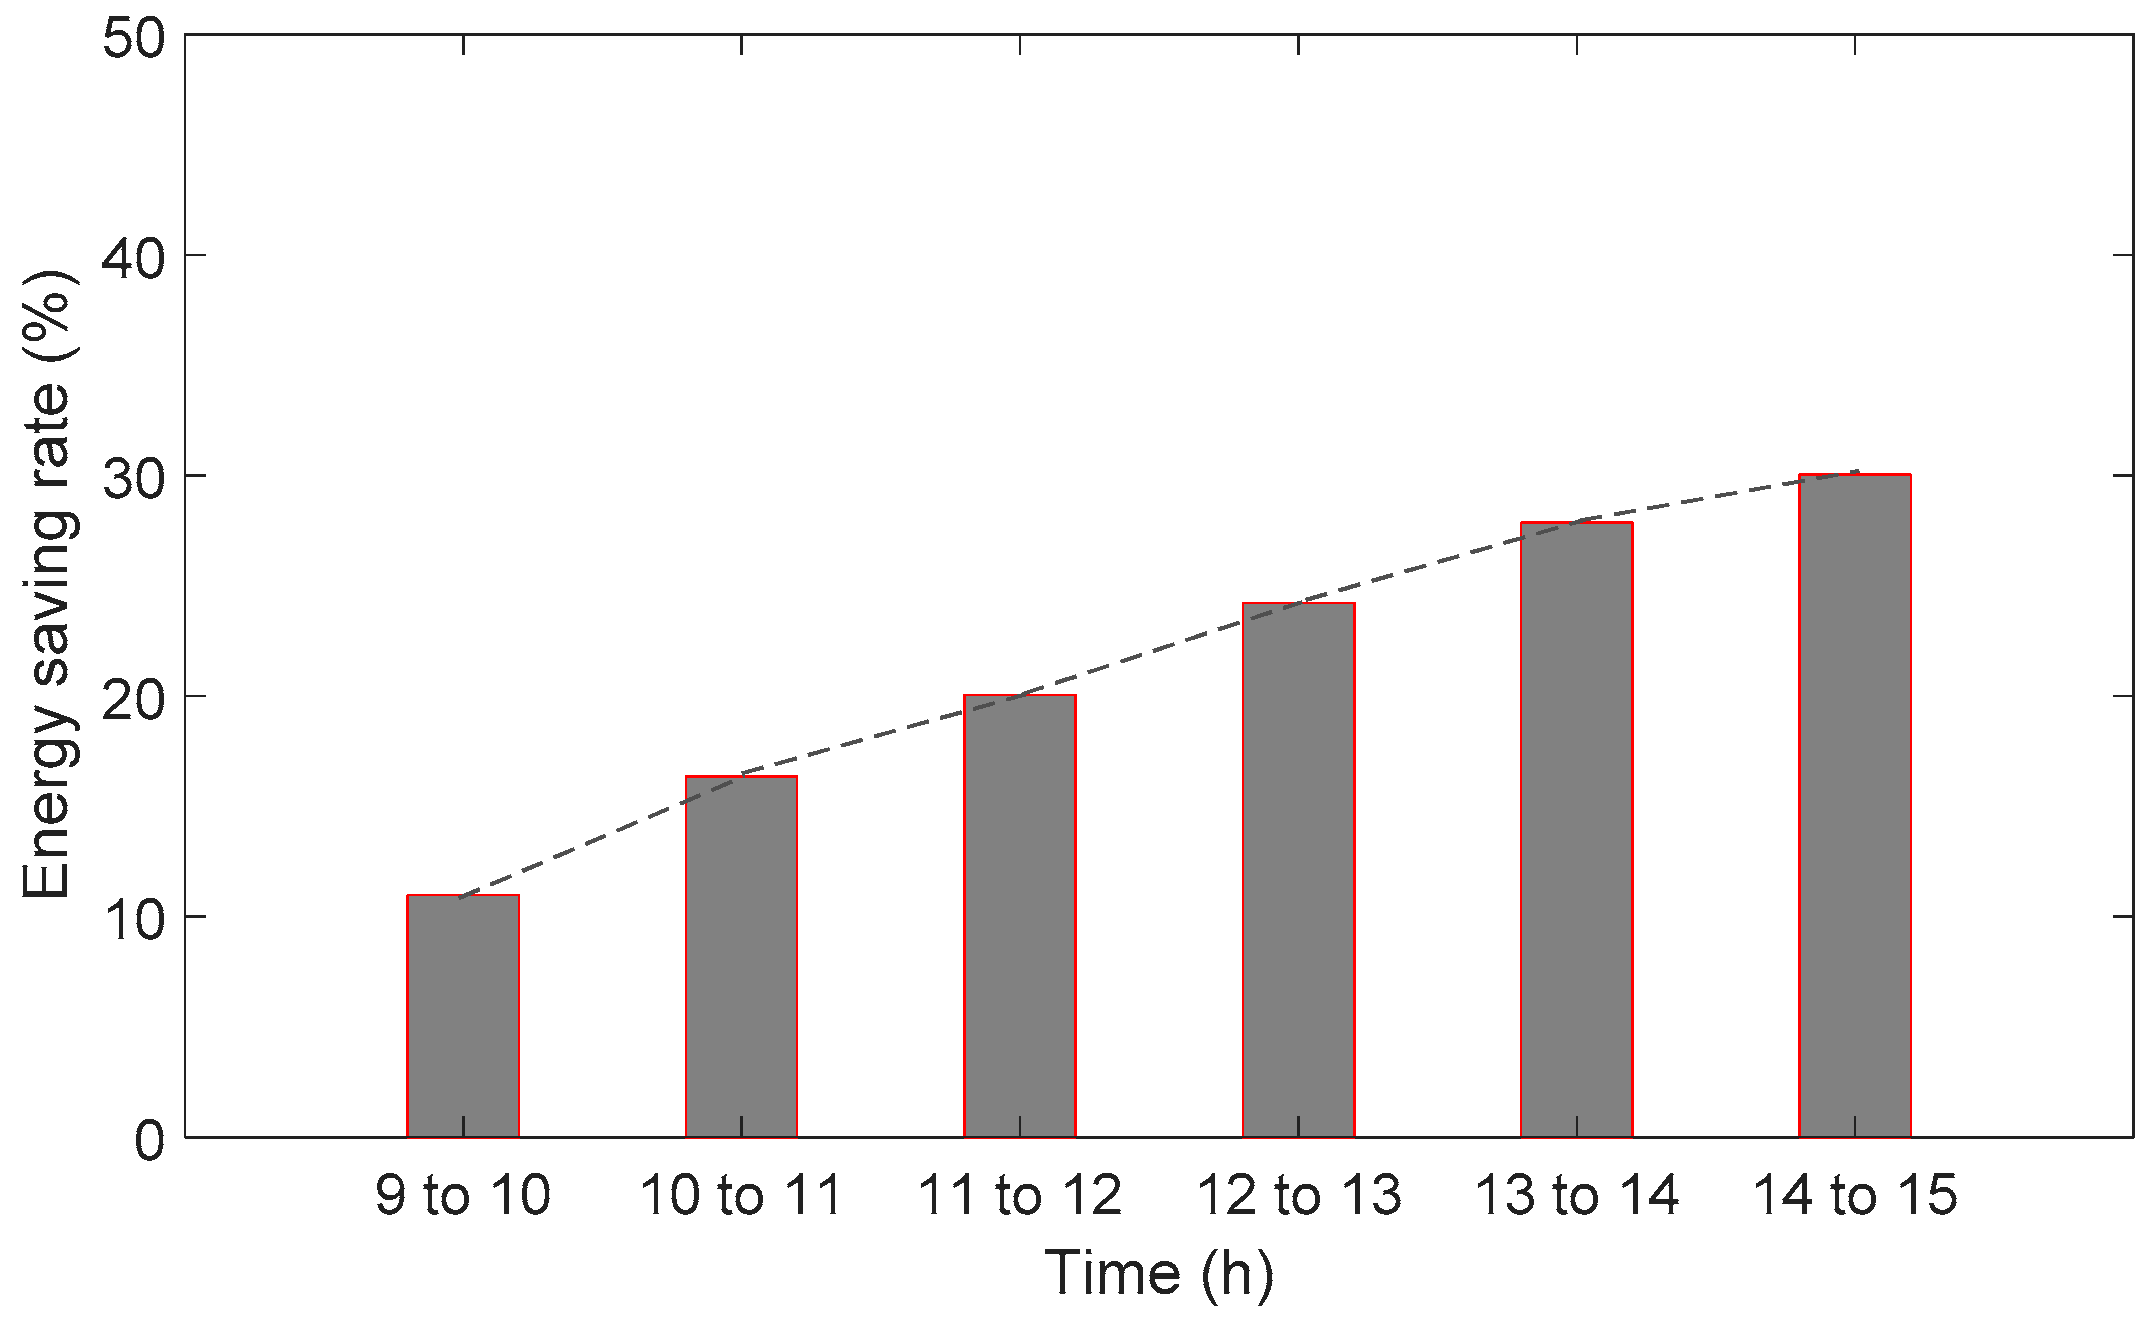
Figure 7 shows the energy-saving rates for the different intervals. The pattern of the energy-saving rates in the last 3 h matches the calibrated field-test results shown in Table 6. The energy-saving rate increased over time and became steady after a few hours. The ventilation loads remained the same over the test period for both modes, indicating that the proportion of the ventilation loads to the total heating loads may have increased during the test period. For instance, a portion of the energy supplied by the EHP could have been used for heating the chamber structure in the early hours, as the chamber was left at a low temperature of 2 °C before the test.
5.3. Simulation Results
To verify the results of the chamber and field tests, a simulation was performed. Similar to the chamber test, the ERV and bypass modes were simulated under the same conditions. Additionally, the energy-saving rates were evaluated in a dynamic condition. Because the EHP consumption and the corresponding energy supplied to the classroom are important factors for evaluating the energy-saving rates, the regression coefficients in Equations (5) and (6) were obtained via optimization. Particle swarm optimization (PSO) [25,26,27] was employed in the simulation, and the particleswarm function in Matlab was used. This method distributes a group of arbitrary values (swarm size) within the parameter bounds, and the minimum error area is iteratively searched over a given time (max time). The swarm size was set as 3000, the max time was set as 2000 s, and large lower and upper bounds were used. Table 7 shows the results of the PSO simulations, which matched the tabulated data provided by the manufacturer. The PSO-optimized coefficients agreed well with the manufacturer data for all the cases, with root-mean-square errors of 0.2521 and 0.0495 kW for the TC and PI, respectively.
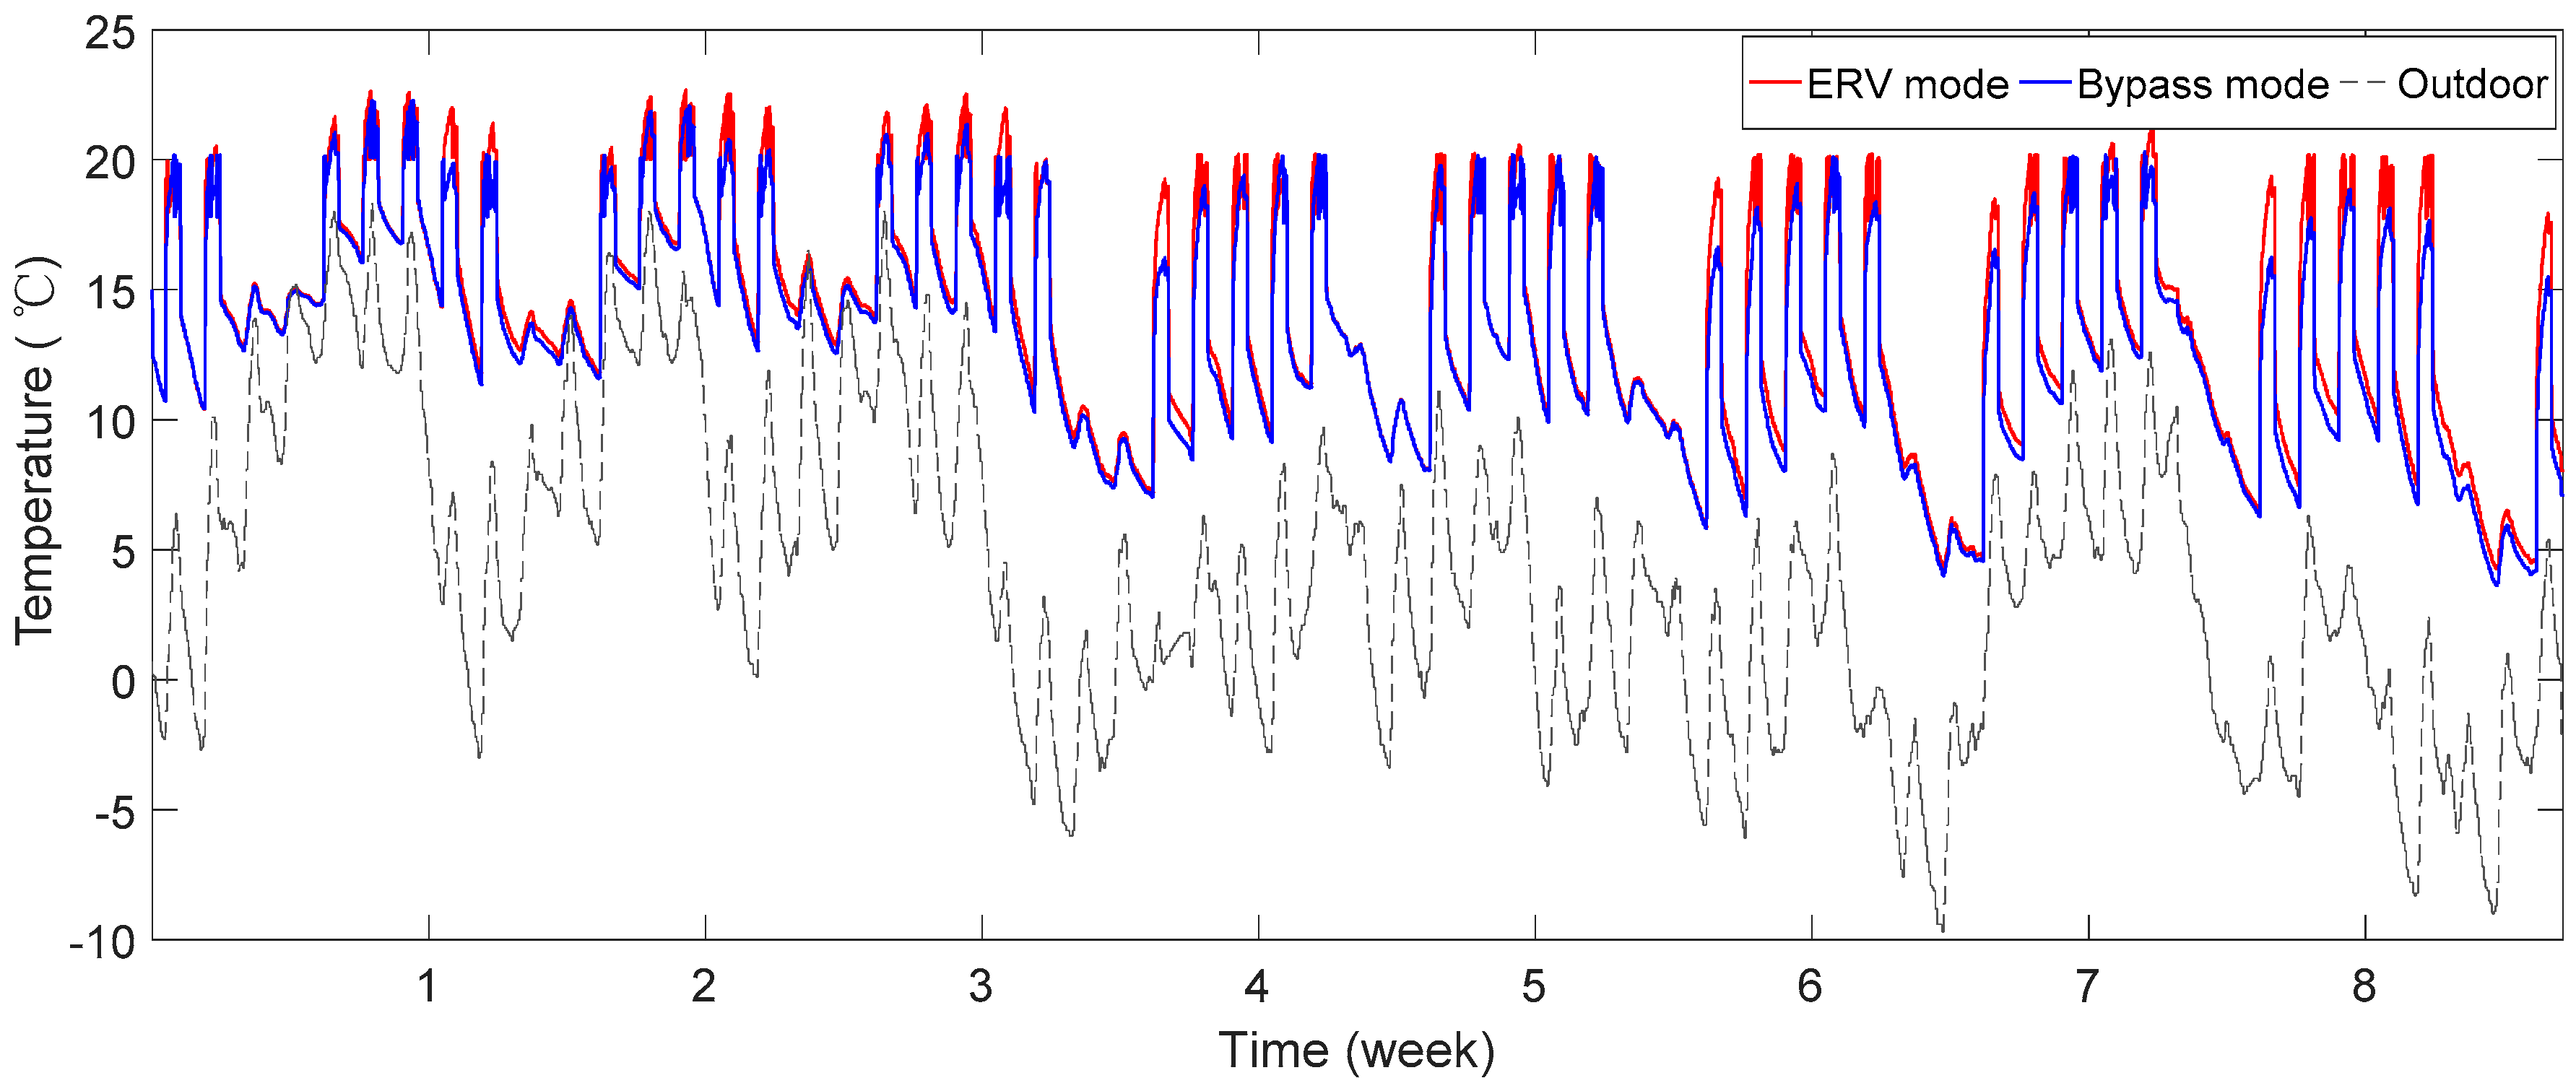
Figure 8 shows the TRNSYS simulation results obtained using the given EHP and classroom models. Over a heating period of two months, the outdoor temperatures fluctuated significantly from −10 to 20 °C, and the systems were operated only on weekdays and during class hours. The patterns of the indoor temperature were similar for the two ventilation modes, but the temperatures deviated when the outdoor temperatures were low (8th week). These results indicate the effectiveness of the ERV for reducing the ventilation load. Additionally, the deviation was apparent on the first day after weekends (middle parts of the x-axis grids). This indicates the thermal-capacity effects of the classroom, which were observed in the previous experiments. When the classroom was cooled during the weekend, the EHP could not provide sufficient energy to heat the indoor air to the set-point temperature. The capacity of the EHP appears to be insufficient, but this is not important, as the purpose of the simulation was to compare the energy-saving rates for a dynamic condition during the course of a day.
Figure 9 shows the average energy-saving rates over the simulation period for each hour of the day. As expected, the energy-saving rates for the ERV mode were higher than those for the bypass mode. Because the difference in the ventilation loads between the ERV and bypass modes was maintained over the test period, the difference in the energy-saving rates is ascribed to different proportions of the ventilation load to the total heating load, mainly due to the thermal effects of the building structure.
6. Conclusions
It is difficult to evaluate the energy-saving effects of an ERV via field tests. A field test can indicate the realistic performance of the system, but in many cases, the experimental conditions cannot be controlled. In this study, in contrast to the conventional test method where two similar classrooms are used for comparison, a single classroom was employed to evaluate the energy-saving effects. A method that involves alternating the ventilation modes on an hourly basis was used. To calibrate the results obtained with different indoor conditions over hours, a model-based calibration method was employed. This is also a novel approach that permits a short-period field test while existing methods alternate the ventilation mode on a daily basis. As daily weather conditions are variable, such a test must be performed for a long test period to get mean energy-saving rates.
In contrast to the calibrated results, the non-calibrated results of the field test were not in accordance with chamber-test and simulation results, indicating the validity of the proposed test and calibration methods. According to the chamber-test results, the ERV was not effective for energy saving of the EHP during the initial periods, when there were large differences between the set-point and indoor temperatures. This is because the EHP was operated at the maximum capacity, in accordance with its control scheme. As the indoor temperatures approached the set-point temperature, the EHP started to be proportionally controlled. Here, the ERV mode became effective for energy saving, but the energy-saving magnitude was smaller in the early periods of operation than in the late periods. This is attributed to variations in the proportion of the ventilation load to the total heating load. After the building structure was cooled during the periods when the classroom was unoccupied, heating of the structure was required, decreasing the proportion of the ventilation load. This was verified by TRNSYS simulations. The work shows the importance of field tests for evaluating the in situ performance of test systems.
Smaller energy-saving rates were found at early hours, mainly because classrooms were occupied intermittently. In other words, the findings indicate that the ERV mode is less effective to reduce the EHP electricity consumption for buildings that are very intermittently occupied, regardless of occupants’ comfort.
Author Contributions
Both authors contributed to performing the field tests, developing the calibration methods, and proposing the analysis methods. J.-S.C. drafted the manuscript, and E.-J.K. revised it. Both authors approved the current manuscript.
Acknowledgments
This work was supported by an Inha University Research Grant. Additionally, the authors thank LG Electronics for the technical support.
Conflicts of Interest
The authors declare no conflicts of interest.
Nomenclature
| Air density (kg/m3) | |
| c | Heat capacity of air (J/kg∙°C) |
| V | Volume of the classroom (m3) |
| Qv | Heat transfer rate by ventilation (kW) |
| Qs | Heat transfer rate through building envelop (kW) |
| Qi | Internal heat gain source (kW) |
| COP | Coefficient of performance |
| PEHP | Energy consumption of electric heat pump (kWh) |
| P′EHP | Calibrated energy consumption of electric heat pump (kWh) |
| TC | Total heat capacity of EHP (kW) |
| PI | Power input of EHP (kW) |
References
- Sharma, A.; Shukla, A.; Kant, K. Heating Ventilation and Air-Conditioning Systems for Energy-Efficient Buildings. In Sustainability through Energy-Efficient Buildings; CRC Press: Boca Raton, FL, USA, 2018; pp. 165–180. [Google Scholar]
- Orme, M. Estimates of the Energy Impact of Ventilation and Associated Financial Expenditures. Energy Build. 2001, 33, 199–205. [Google Scholar] [CrossRef]
- Wu, W.; Skye, H.M.; Domanski, P.A. Selecting HVAC Systems to Achieve Comfortable and Cost-Effective Residential Net-Zero Energy Buildings. Appl. Energy 2018, 212, 577–591. [Google Scholar] [CrossRef]
- Ng, L.C.; Payne, W.V. Energy use Consequences of Ventilating a Net-Zero Energy House. Appl. Therm. Eng. 2016, 96, 151–160. [Google Scholar] [CrossRef] [PubMed]
- Cao, X.; Dai, X.; Liu, J. Building Energy-Consumption Status Worldwide and the State-of-the-Art Technologies for Zero-Energy Buildings during the Past Decade. Energy Build. 2016, 128, 198–213. [Google Scholar] [CrossRef]
- Badescu, V.; Sicre, B. Renewable Energy for Passive House Heating: Part I. Building Description. Energy Build. 2003, 35, 1077–1084. [Google Scholar] [CrossRef]
- Oh, I.; Lee, J.; Ahn, K.; Kim, J.; Kim, Y.; Sim, C.S.; Kim, Y. Association between Particulate Matter Concentration and Symptoms of Atopic Dermatitis in Children Living in an Industrial Urban Area of South Korea. Environ. Res. 2018, 160, 462–468. [Google Scholar] [CrossRef]
- Ohura, T.; Amagai, T.; Shen, X.; Li, S.; Zhang, P.; Zhu, L. Comparative Study on Indoor Air Quality in Japan and China: Characteristics of Residential Indoor and Outdoor VOCs. Atmos. Environ. 2009, 43, 6352–6359. [Google Scholar] [CrossRef]
- Chen, B.; Hong, C.; Kan, H. Exposures and Health Outcomes from Outdoor Air Pollutants in China. Toxicology 2004, 198, 291–300. [Google Scholar] [CrossRef] [PubMed]
- Qiu, S.; Li, S.; Wang, F.; Wen, Y.; Li, Z.; Li, Z.; Guo, J. An Energy Exchange Efficiency Prediction Approach Based on Multivariate Polynomial Regression for Membrane-Based Air-to-Air Energy Recovery Ventilator Core. Build. Environ. 2019, 149, 490–500. [Google Scholar] [CrossRef]
- Gjennestad, M.A.; Aursand, E.; Magnanelli, E.; Pharoah, J. Performance Analysis of Heat and Energy Recovery Ventilators using Exergy Analysis and Nonequilibrium Thermodynamics. Energy Build. 2018, 170, 195–205. [Google Scholar] [CrossRef]
- Liu, D.; Zhao, F.; Tang, G. Active Low-Grade Energy Recovery Potential for Building Energy Conservation. Renew. Sustain. Energy Rev. 2010, 14, 2736–2747. [Google Scholar] [CrossRef]
- Liu, J.; Li, W.; Liu, J.; Wang, B. Efficiency of Energy Recovery Ventilator with various Weathers and its Energy Saving Performance in a Residential Apartment. Energy Build. 2010, 42, 43–49. [Google Scholar] [CrossRef]
- Choi, Y.; Song, D.; Seo, D.; Kim, J. Analysis of the Variable Heat Exchange Efficiency of Heat Recovery Ventilators and the Associated Heating Energy Demand. Energy Build. 2018, 172, 152–158. [Google Scholar] [CrossRef]
- Dodoo, A.; Gustavsson, L.; Sathre, R. Primary Energy Implications of Ventilation Heat Recovery in Residential Buildings. Energy Build. 2011, 43, 1566–1572. [Google Scholar] [CrossRef]
- Torcellini, P.; Deru, M.; Griffith, B.; Long, N.; Pless, S.; Judkoff, R.; Crawley, D.B. Lessons Learned from Field Evaluation of Six High-Performance Buildings. 2004. Available online: http://citeseerx.ist.psu.edu/viewdoc/download?doi=10.1.1.134.8399&rep=rep1&type=pdf (accessed on 2 April 2019).
- Fan, Y.; Kameishi, K.; Onishi, S.; Ito, K. Field-Based Study on the Energy-Saving Effects of CO2 Demand Controlled Ventilation in an Office with Application of Energy Recovery Ventilators. Energy Build. 2014, 68, 412–422. [Google Scholar] [CrossRef]
- Branco, P.; Alvim-Ferraz, M.; Martins, F.G.; Sousa, S. Children’s Exposure to Indoor Air in Urban Nurseries-Part I: CO2 and Comfort Assessment. Environ. Res. 2015, 140, 1–9. [Google Scholar] [CrossRef] [PubMed]
- Satish, U.; Mendell, M.J.; Shekhar, K.; Hotchi, T.; Sullivan, D.; Streufert, S.; Fisk, W.J. Is CO2 an Indoor Pollutant? Direct Effects of Low-to-Moderate CO2 Concentrations on Human Decision-Making Performance. Environ. Health Perspect. 2012, 120, 1671–1677. [Google Scholar] [CrossRef] [PubMed]
- Solgi, E.; Fayaz, R.; Kari, B.M. Cooling Load Reduction in Office Buildings of Hot-Arid Climate, Combining Phase Change Materials and Night Purge Ventilation. Renew. Energy 2016, 85, 725–731. [Google Scholar] [CrossRef]
- Short, C.A.; Cook, M.; Lomas, K.J. Delivery and Performance of a Low-Energy Ventilation and Cooling Strategy. Build. Res. Inf. 2009, 37, 1–30. [Google Scholar] [CrossRef]
- KS B 6879: 2017 Heating-Recovery Ventilators. KSSN. Available online: https://standard.go.kr/KSCI/standardIntro/getStandardSearchView.do?pageIndex=1&pageUnit=10&ksNo=KSB6879&tmprKsNo=KSB6879&reformNo=19&menuId=919&topMenuId=502&upperMenuId=503 (accessed on 2 April 2019).
- ASHRAE Handbook-Fundamentals Chapter 18; American Society of Heating, Refrigerating and Air-Conditioning Engineers: Atlanta, GA, USA, 2001.
- Rasouli, M.; Ge, G.; Simonson, C.J.; Besant, R.W. Uncertainties in Energy and Economic Performance of HVAC Systems and Energy Recovery Ventilators due to Uncertainties in Building and HVAC Parameters. Appl. Therm. Eng. 2013, 50, 732–742. [Google Scholar] [CrossRef]
- Mirjalili, S.; Hashim, S.Z.M.; Sardroudi, H.M. Training Feedforward Neural Networks using Hybrid Particle Swarm Optimization and Gravitational Search Algorithm. Appl. Math. Comput. 2012, 218, 11125–11137. [Google Scholar] [CrossRef]
- Wang, Z.; Yang, R.; Wang, L. Multi-Agent Control System with Intelligent Optimization for Smart and Energy-Efficient Buildings. In Proceedings of the IECON 2010 36th Annual Conference on IEEE Industrial Electronics Society, Glendale, AZ, USA, 7–10 November 2010; pp. 1144–1149. [Google Scholar]
- Shi, Y. Particle Swarm Optimization: Developments, Applications and Resources. In Proceedings of the 2001 Congress on Evolutionary Computation (IEEE Cat. No. 01TH8546), Seoul, Korea, 27–30 May 2001; pp. 81–86. [Google Scholar]
Figure 1.
Layout of the test classroom, indicating the locations of the EHP and ERVs: (a) school building, (b,c) test classroom, (d) ductwork and locations of the systems.
Figure 1.
Layout of the test classroom, indicating the locations of the EHP and ERVs: (a) school building, (b,c) test classroom, (d) ductwork and locations of the systems.

Figure 2.
Equipment used for the energy-consumption measurement (a) PDI installed in an EPS room; (b) watt-hour meter.
Figure 2.
Equipment used for the energy-consumption measurement (a) PDI installed in an EPS room; (b) watt-hour meter.

Figure 3.
Test school building (a) and plan of the classrooms and hallway (b).

Figure 4.
Indoor and outdoor temperatures measured during the field test.

Figure 5.
Measured energy consumption of the EHP before calibration.

Figure 6.
Results for the indoor temperatures (a) and energy consumptions (b) under different ventilation modes (chamber test).
Figure 6.
Results for the indoor temperatures (a) and energy consumptions (b) under different ventilation modes (chamber test).

Figure 7.
Energy-saving rates (chamber test).

Figure 8.
Simulated indoor temperatures for the different ventilation modes.

Figure 9.
EHP energy-saving rates for different hours of the day.


Table 1.
Building information.
| Description | |
|---|---|
| Building location | Seoul, Korea |
| Building type and stories | Middle school, 4 stories |
| Floor area and height | 16.2 m × 19.6 m, floor-to-floor height: 2.5 m |
| Zone (classroom) area | 8.1 m × 8.2 m |
| Zone height | 2.4 m |
Table 2.
Specifications of the EHP and ERV.
| System | Description | Value | ||
|---|---|---|---|---|
| EHP | IDU | Heating performance | 6 kW | |
| Power consumption | 0.03 kW | |||
| Air blower | Air flow | 840 CMH | ||
| Consumption | 60 W | |||
| ODU (coupled to IDUs) | Heating performance | 25.9 kW | ||
| Power consumption | 7.8 kW | |||
| Air blower | Air flow | 12,600 CMH | ||
| Consumption | 750 W | |||
| ERV 1 | Ventilation rate | Supply | 800 CMH | |
| Exhaust | 720 CMH | |||
| Number of diffusers | Supply | 3 | ||
| Exhaust | 3 | |||
| Energy-recovery rate | 0.65 | |||
| ERV 2 (operating for two classrooms) | Ventilation rate | Supply | 500 CMH | |
| Exhaust | 450 CMH | |||
| Number of diffusers | Supply | 1 | ||
| Exhaust | 1 | |||
| Energy-recovery efficiency | 0.65 | |||
Table 3.
Chamber-test conditions and energy-performance specifications.
| Condition | Value |
|---|---|
| Test period | 4 h |
| Set-point temperature | 22 °C |
| Temperature outside the chamber | 5 °C |
| EHP power characteristics | 380 V, 60 Hz |
| EHP heating capacity | 6 kW |
| Tested ERV ventilation mode | ERV/bypass |
Table 4.
Simulation conditions.
| Description | |
|---|---|
| Building location (weather) | Seoul, Korea |
| Building type and stories | Middle school, 4 stories (test classroom on 2nd floor) |
| Typical floor area and height | 16.2 m × 19.6 m, floor-to-floor height: 2.5 m |
| Zone (classroom) area | 8.1 m × 8.2 m |
| Zone height | 2.4 m |
| Simulation period | 2 months (heating season) |
| EHP | Heating set-point temperature: 20.0 °C |
| ERV | Sensible heat-exchange efficiency of ERV: 0.65 |
| Heat gains Operating schedule | Occupants: 31 persons Activity level: seated, very light writing Emitted heat: 65 W/person Monday to Friday (09:00–15:00) |
Table 5.
Calibrated energy consumption.
| Time (h) | Ventilation Mode | Number of Students | COP | ||
|---|---|---|---|---|---|
| 0 to 1 | ERV | 15 | 3 | 3.2 | 2.95 |
| 1 to 2 | Bypass | 31 | 3 | 3.6 | 3.60 |
| 2 to 3 | ERV | 0 | 3 | 3.4 | 2.9 |
| 3 to 4 | Bypass | 31 | 3 | 3.6 | 3.60 |
Table 6.
Energy-saving rates before and after the calibration.
| Energy-Saving Rate (%) | ||
|---|---|---|
| Before Calibration | After Calibration | |
| 1st cycle | 11.10 | 18.06 |
| 2nd cycle | 5.56 | 19.44 |
| 3rd cycle | 5.56 | 19.44 |
Table 7.
Optimized coefficients.
| TC | PI | ||
|---|---|---|---|
| Coefficient | Value | Coefficient | Value |
| 6.1369 | 49.5018 | ||
| 0.2095 | −0.1213 | ||
| −0.012 | 0.0061 | ||
| 0.000121 | −0.0001 | ||
| 0.018173 | −0.0866 | ||
| −0.00238 | −0.0007 | ||
| 0.00006645 | 0.0001 | ||
| −23.2270 | |||
| 3.7584 | |||
| −0.1984 | |||
© 2019 by the authors. Licensee MDPI, Basel, Switzerland. This article is an open access article distributed under the terms and conditions of the Creative Commons Attribution (CC BY) license (http://creativecommons.org/licenses/by/4.0/).
Share and Cite
MDPI and ACS Style
Choi, J.-S.; Kim, E.-J. Field Test and Analysis of Energy-Saving Effects of Energy-Recovery Ventilators on Heat-Pump Electricity Consumption in a Classroom. Sustainability 2019, 11, 2069. https://doi.org/10.3390/su11072069
AMA Style
Choi J-S, Kim E-J. Field Test and Analysis of Energy-Saving Effects of Energy-Recovery Ventilators on Heat-Pump Electricity Consumption in a Classroom. Sustainability. 2019; 11(7):2069. https://doi.org/10.3390/su11072069
Chicago/Turabian StyleChoi, Jae-Sol, and Eui-Jong Kim. 2019. "Field Test and Analysis of Energy-Saving Effects of Energy-Recovery Ventilators on Heat-Pump Electricity Consumption in a Classroom" Sustainability 11, no. 7: 2069. https://doi.org/10.3390/su11072069
Note that from the first issue of 2016, this journal uses article numbers instead of page numbers. See further details here.