Trends, Costs, and Benefits of Green Certification of Office Buildings: A Polish Perspective


Institute of Construction Management Cracow University of Technology, Warszawska 24, 31-155 Kraków, Poland
*
Author to whom correspondence should be addressed.
Sustainability 2019, 11(8), 2359; https://doi.org/10.3390/su11082359
Submission received: 21 March 2019
/
Revised: 13 April 2019
/
Accepted: 16 April 2019
/
Published: 19 April 2019
(This article belongs to the Collection Green Building Technologies)
Abstract
:Green buildings may become the solution to the problem of high energy consumption, including those that are subject to verification by the relevant institutions issuing green certificates. The aim of the paper is an analysis and a brief discussion of trends related to the certification of office buildings in Poland. At the end of 2017, almost 9.7 million m2 of modern office space was available in Poland, of which 62% was a certified area. This constitutes a five percent increase in the share of certified office space in relation to the total modern office space available during 2017. In order to compare the costs and benefits of certified buildings, the costs of an office building and a certified building were simulated. The comparison was made using the idea of costs in the life cycle and calculating the Life Cycle Cost. The difference between the base building and the green one was mainly based on obtaining higher Net Present Value with lower investment expenditures for the green building. There was also a clear difference between the beginning of investment profitability for the different levels of rent.
1. Introduction
High energy consumption which characterizes the construction sector is one of the reasons for the increased interest of investors in the subject of sustainable development and ecological construction. According to commonly available analyses and estimates, buildings are responsible for about 40% of global CO2 emissions, and in the European Union, around 36% of CO2 emissions [1]. Green buildings may become the solution to the problem of high energy consumption, including those that are subject to verification by the relevant institutions issuing green certificates [2]. The advantages of green buildings are easily noticed by investors and users; they include, for instance, reduced carbon dioxide emission, lower operating costs, better comfort and hygiene at work, and thus lower employee absenteeism in “green” office buildings [3,4]. However, obtaining a certificate as well as adapting the building to ecological standards mean an increase in the investment costs.
The aim of the paper is an analysis and a brief discussion of trends related to the certification of office buildings in Poland, as well as to present a case-study analysis of the benefits and costs that a certificate brings for the investor.
2. Literature Review
The construction industry has a significant share of the negative impact on the environment [5]; therefore, the concept of the green building has gained wide recognition. Since the commonly used construction regulations may not take into account the extensive list of green building requirements, systems for assessing sustainable buildings have been created. As a result, numerous international building assessment tools have been developed, which are a measure of the ecological efficiency of buildings. In building evaluation systems, different criteria are used to assess an ecological building, which has become the basis for creating various assessment systems (Green Building Rating Systems—GBRS), for instance the Building Research Establishment Environmental Assessment Method (BREEAM), Leadership in Energy and Environmental Design (LEED), (Deutsche Gesellschaft für Nachhaltiges Bauen e.V) DGNB, WELL, Haute Qualité Environmentale (HQE), Comprehensive Assessment System for Built Environment Efficiency (CASBEE), Green Star NZ, and ITACA.
Certification of buildings is performed according to specific criteria that take into account the most important features of sustainable buildings, namely, ecological efficiency, effective water management, reduction of waste, and environmental quality for building users. It is difficult to create a unified system for all countries. There are common approaches and guidelines for assessing the analyzed real estates, which does not change the fact that a direct comparison of the building classification assessment is very complex [6]. The reasons for the existence of such a large number of systems include: climate and social diversity, the level of economic development of the country, and often legal and political conditions, which are responsible for the existence of mandatory standards for buildings in terms of their sustainability [7].
Ecological evaluation programs and systems can be created specifically for particular regions, such as Estidama (Arabic “sustainable”) and GSAS (Global Sustainability Assessment System) developed specifically for the Gulf region [8]. The LEED and BREEAM standards are closely reflected by the ecological requirements of the building regulations in Estonia [9]. The existing research is mainly focused on the ecological aspect of green buildings, but it omits other elements such as the social one [10]. The first system that focuses only on the health and well-being of building users is the WELL system.
Since the most popular systems are BREEAM and LEED, many analyses focus on the comparison of these systems to other less popular ones, such as HQE, CASBEE, GBTool [11]; the DGNB system [12], the LBC system (Living Building Challenge) [13]; to CASBEE, Green Star and HK-BEAM [14]; to Hong Kong Building Environmental Assessment Method (HK-BEAM) [15]; to CASBEE, Green Star, ITACA [16]. The LEED system was compared with ITACA using the example of residential buildings. Although these two procedures give different meanings to different areas, the analysis shows the proportionality between the corresponding normalized final result for the two buildings tested [17]. Based on the results of research [18] which aimed to assess a model office building in Japan performed by means of the BREEAM, LEED, and CASBEE methods, the authors showed the similarity of results, especially in terms of energy savings. The comparison of LEED and BREEAM with GRIHA (Green Rating for Integrated Habitat Assessment) in India allowed to state that in developing countries such as India, tools for assessing sustainable development should include a tool that takes into account the health and well-being of society [19].
The search for solutions to urban problems led to the emergence of efforts to apply the concept of sustainability to cities, and hundreds of assessment tools have been developed to assess the sustainability of buildings and neighborhoods at the urban scale. Neighborhood Sustainability Assessment (NSA) tools, which examine buildings together with their environments and evaluate topics such as society, land usage, transportation, water, air, energy, and biologic diversity as a whole economically, environmentally, and socially, have been presented in recent years and are starting to be recognized and used. However, it was discovered that different systems (e.g., LEED, BREEAM) revealed issues at the neighborhood level of sustainability in different ways. First of all, the expression of sustainability concerns are different in each system. For example, issues related to energy were expressed under the main categories of green infrastructure and buildings in LEED, resource and energy in BREEAM, economic quality in DGNB, environmental quality in CASBEE, and energy efficiency in Green Star [20]. In one study [21], seven tools from Australia, Europe, Japan, and the United States were selected and analyzed with the aim of providing insights into current sustainability issues, highlighting the strengths, weaknesses, successes, and failures, and making recommendations for future improvements. The results of this study indicated that most of the tools do not perform well regarding their coverage of social, economic, and institutional aspects of sustainability; there are ambiguities and shortcomings in weighting, scoring, and rating; in most cases, there is no mechanism for local adaptability and participation; and, only those tools which are embedded within the broader planning framework are doing well with regard to applicability. Reference [22] developed a “Neighborhood Sustainability Assessment” tool and compared it to the sustainability levels in Ipoh, Malaysia. The results reveal insights and evidence for policymakers, planners, development agencies, and researchers; advocate for further studies on neighborhood-level sustainability analysis; and emphasize the need for collective efforts and an effective process in achieving neighborhood sustainability and sustainable city formation.
Research has also shown that BREEAM is currently the only tool that can assess all sustainability factors [23]. Analyses of LEED, BREEAM, Estidama, and GSAS systems were also conducted in terms of the tenets of sustainable development [24]. The limitations in the application of systems developed at the national level to local and regional conditions are described by Suzer [25]. For three systems, LEED, BREEAM and Green Star, a computational simulation using IES Virtual Environment software was used to conduct a quantified comparison of the energy performance assessment of buildings [26]. Many authors emphasize the need to develop a common international framework for the ecological assessment of buildings [26,27].
Several computer programs have already been created for the ecological assessment of buildings. A comparative analysis of the results of the building assessment using three different computer programs (Tas, EnergyPlus, and IES) showed that various simulation tools yielded different energy consumption values, but they had only a small impact on the BREEAM or LEED energy efficiency scores [28]. Moreover, increasingly the design of green buildings, including certified ones, employ building information modelling (BIM) technology [29,30]. Ecological building assessment systems require new tools, yet clearly there has not been much research done on establishing a baseline to develop new assessment tools [31].
While the energy certification of buildings is already a well-known practice in the market, urban certification is a novelty. Certifications allow not only to verify a certain standard of an urban plan, but also constitute a relatively simple tool for comparing urban planning according to arbitrarily set criteria, using the same tools, such as LEED and BREEAM [20,22,32].
Due to the popularity of the BREEAM and LEED systems in Poland, they are briefly presented in this paper. The cost calculations presented in this article have also been made for these two systems.
3. The LEED and BREEAM Systems
In practice, three types of green certification systems of buildings can be distinguished. The first of these are compulsory energy certificates, in which the assessment is limited to the energy efficiency of the building. They mainly refer to flats and residential buildings. The next are voluntary ecological certificates, the most popular of which are provided by the LEED (Leadership in Energy and Environmental Design) and BREEAM (Building Research Establishment Environmental Assessment Method) systems. These certifications mainly concern commercial buildings, and the scope of the assessment covers the overall ecological characteristics of the building, which is possible due to the relatively large number of assessment criteria. The final type is voluntary comprehensive certification systems which have been implemented only in a few countries. The assessment, which basically concerns only residential buildings and houses, is quite broad as it includes more than just ecological aspects.
The multi-criteria certification in the American LEED system was developed by the US Green Building Council (USGBC) and provides building owners and managers with all tools to identify and implement appropriate solutions for the ecological design, construction, and operation of buildings [33,34]. The other popular system dealing with multi-criteria classification of buildings is the British BREEAM awarded by BRE—Building Research Establishment [35]. It involves the assessment of the quality and direct impact of buildings on the natural environment. The beginning of these systems dates back to 1990, when the BREEAM system was introduced, then in 1996 the French HQE system was developed, and in 2000 the American LEED.
In order to indicate the degree of the application of building certifications in Poland and the popularity of the previously described BREEAM and LEED systems, the authors decided to analyze the number of certified buildings and certificates in the last few years (mainly in the period 2016–2018). The results of these analyses are presented in the next chapter.
4. Certification Systems in Poland
The building energy certification system was introduced in Poland in January 2009. The first certificate granted in Poland was LEED (January 2010), then half a year later the first building was awarded the BREEAM certificate. The other systems were introduced in 2015 (HQE), 2016 (DGNB), and 2017 (WELL). Since 2016, there has been a dynamic increase in sustainable construction in Poland (a 25% increase in the number of certified facilities during a year). There are currently five international systems of multi-criteria certification in the country: BREEAM, LEED, HQE, DGNB, and WELL [36].
The main factors stimulating future activities in the field of green buildings in Poland include: lower costs in 10 years (32% of respondents), market changes (35%), customer requirements (28%), healthier construction (28%), market requirements (19%), awareness that this is the right thing to do (19%), environmental regulations (12%), high value of buildings (2%), and internal corporate commitment (6%) [37].
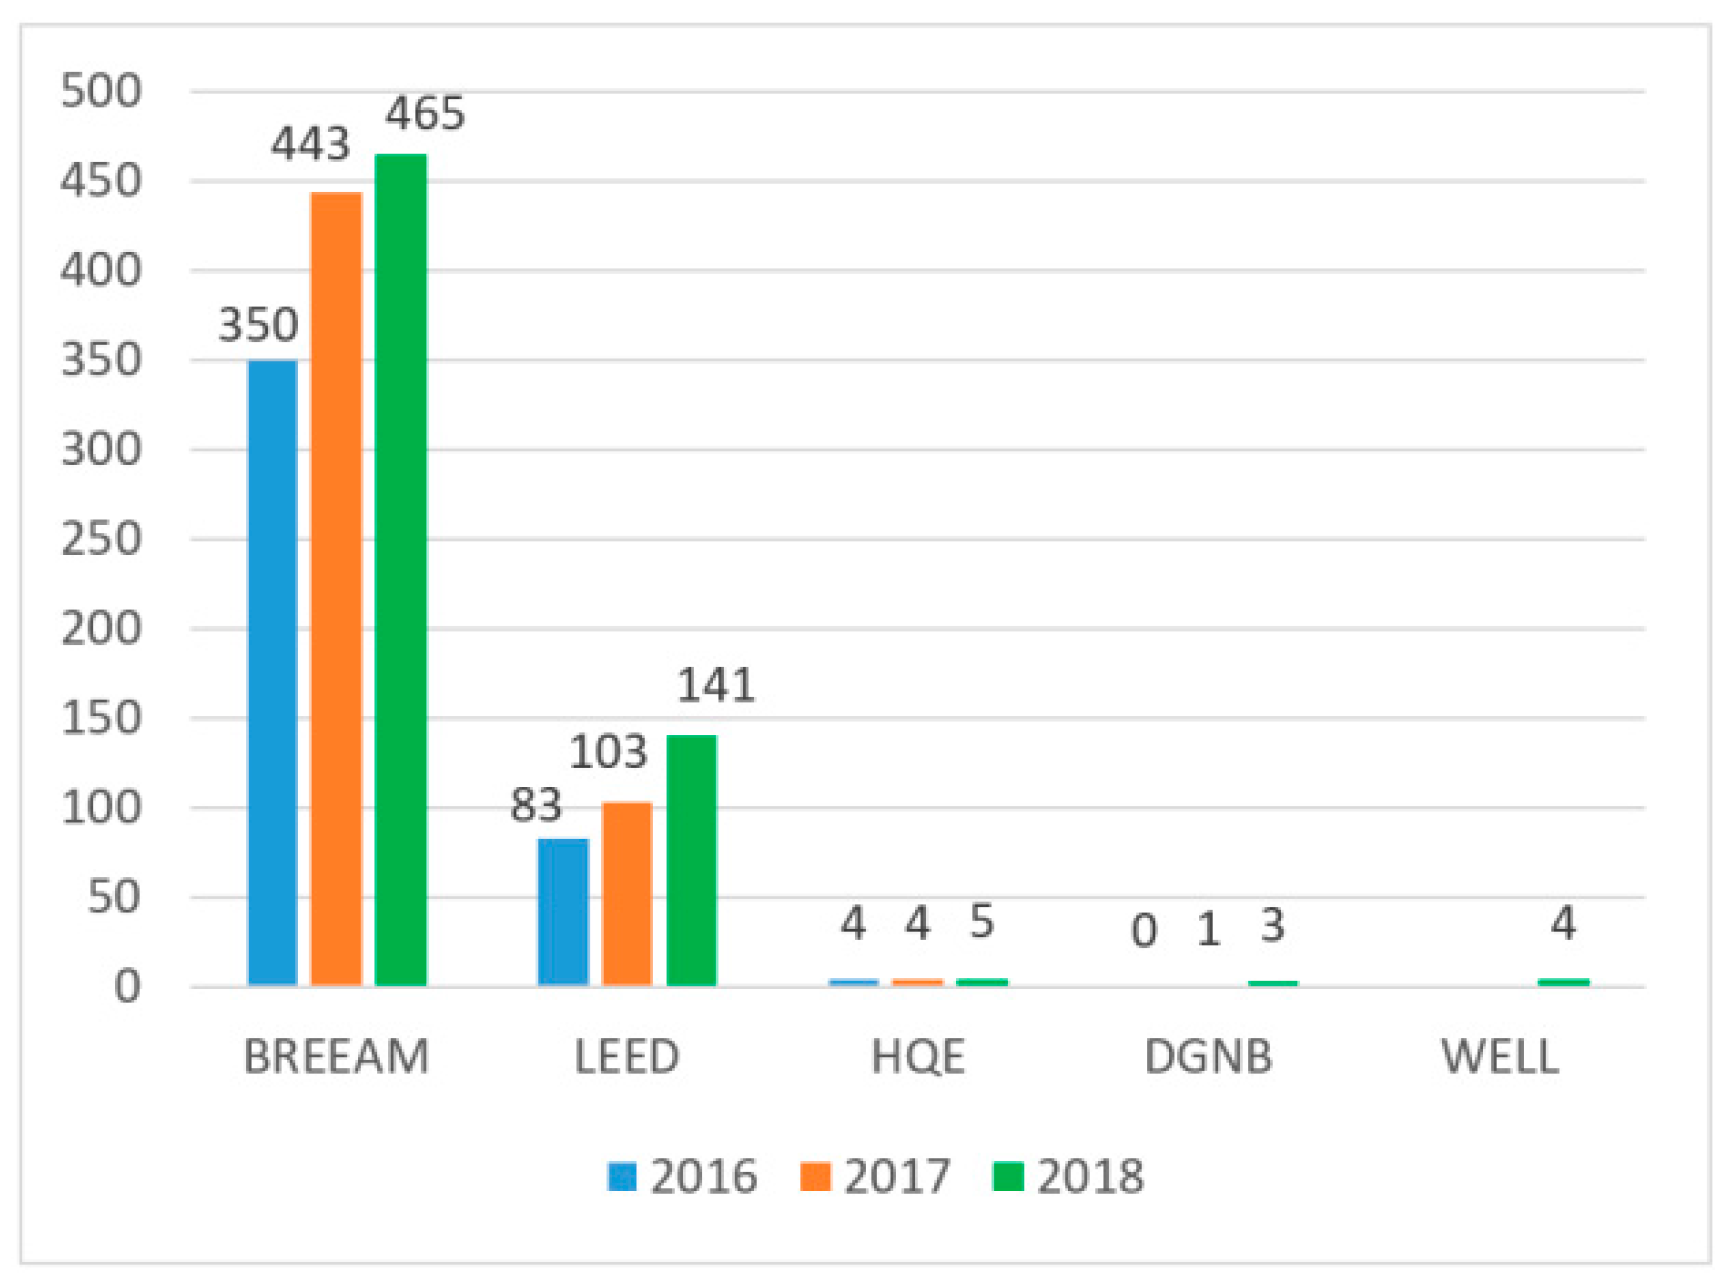
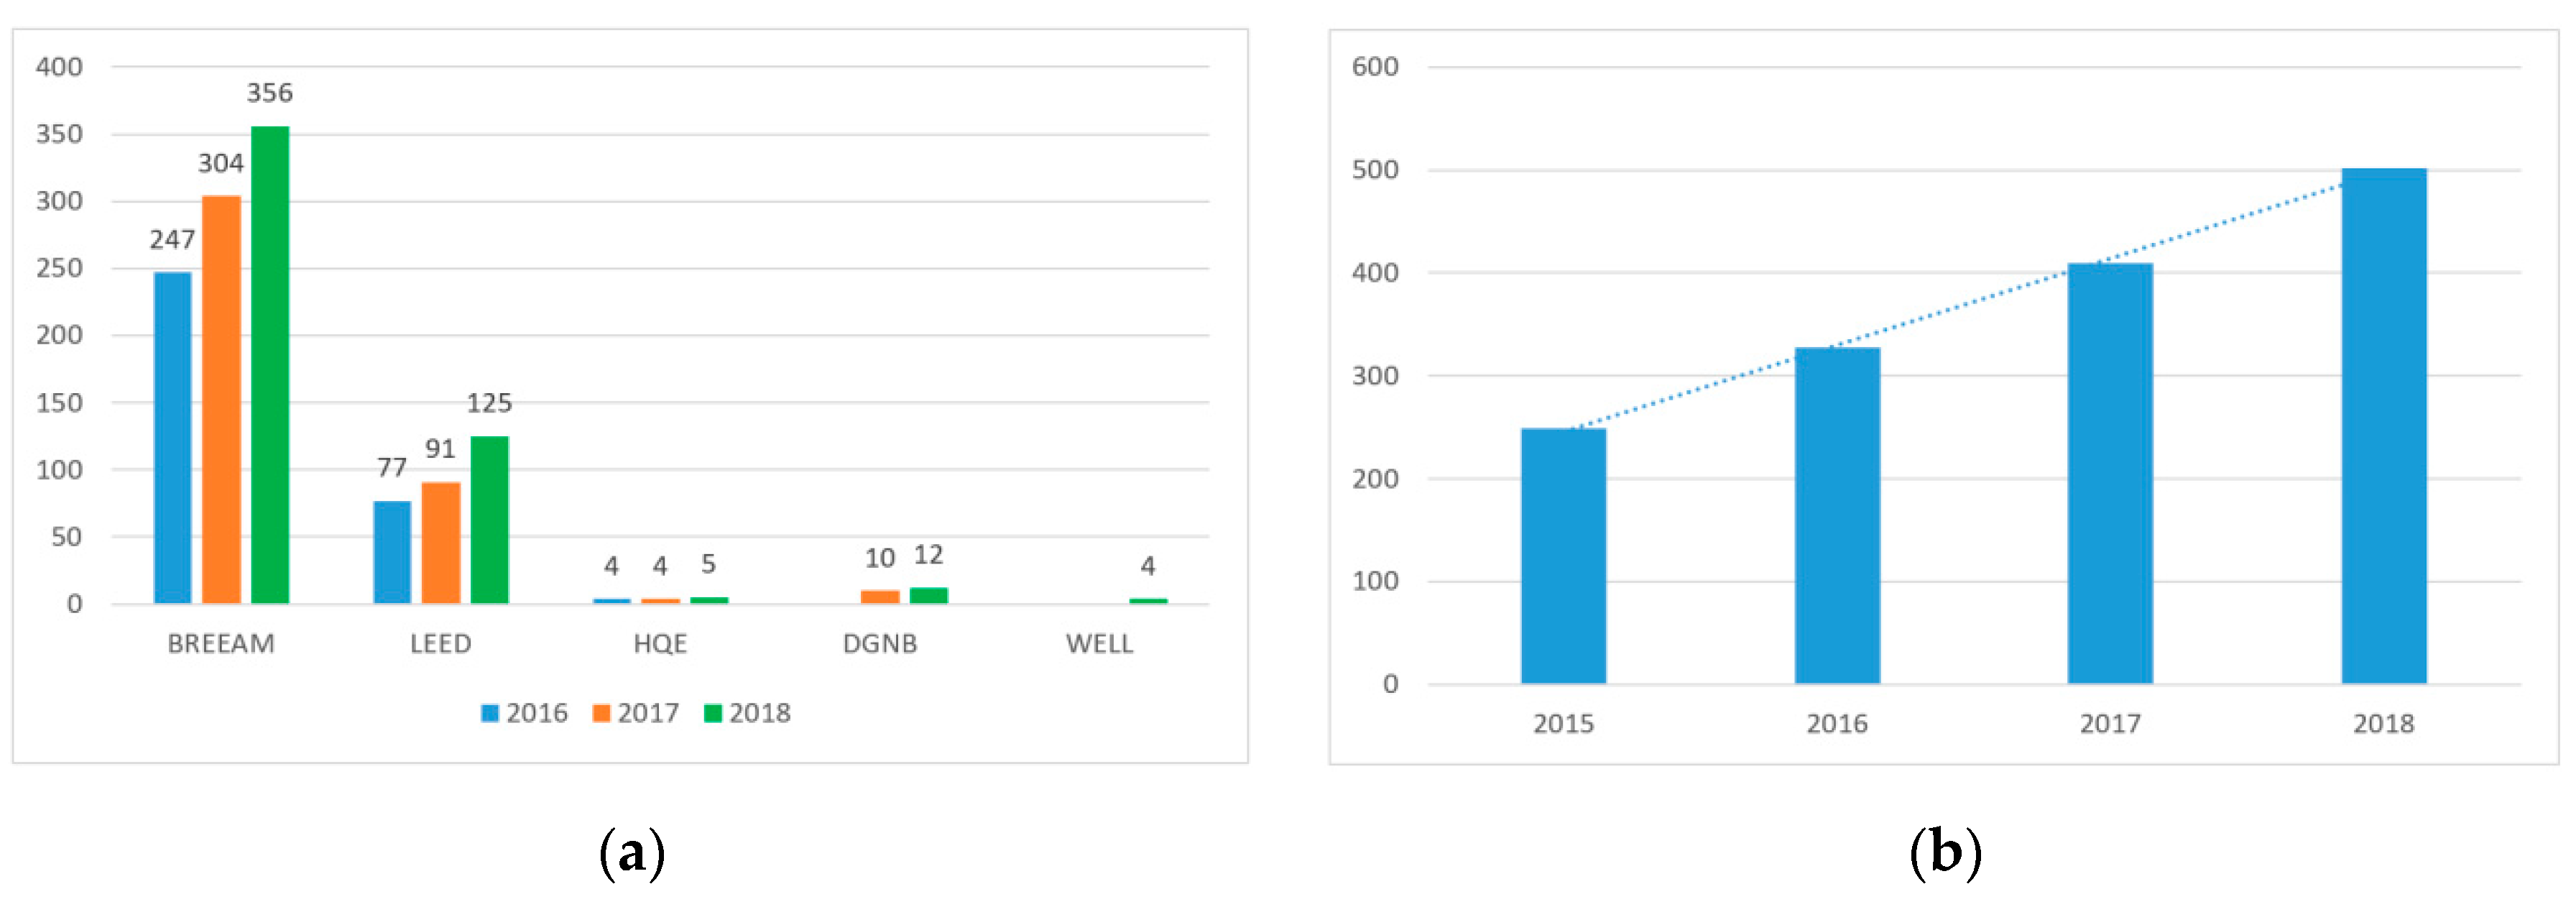
The Polish Green Building Council (PLGBC) publishes the report: “Certification of Green Buildings in Numbers”. The third edition of the report was published in mid-2018. The report reveals that in March 2018 there were 502 certified buildings in Poland. The largest share belongs to BREEAM (356, 71.1%) and LEED (125, 24.8%) certificates. The remaining buildings were certified according to the rules of DGNB (12, 2.4%), WELL (4, 0.8%), and HQE (5, 1%). Figure 1 shows the number of certificates granted in Poland. The number of certified buildings between 2016 and 2018 are presented in Figure 2a,b. However, it needs to be emphasized that the number of certificates granted does not correspond to the number of certified buildings, because it may happen that one building possesses several certificates.
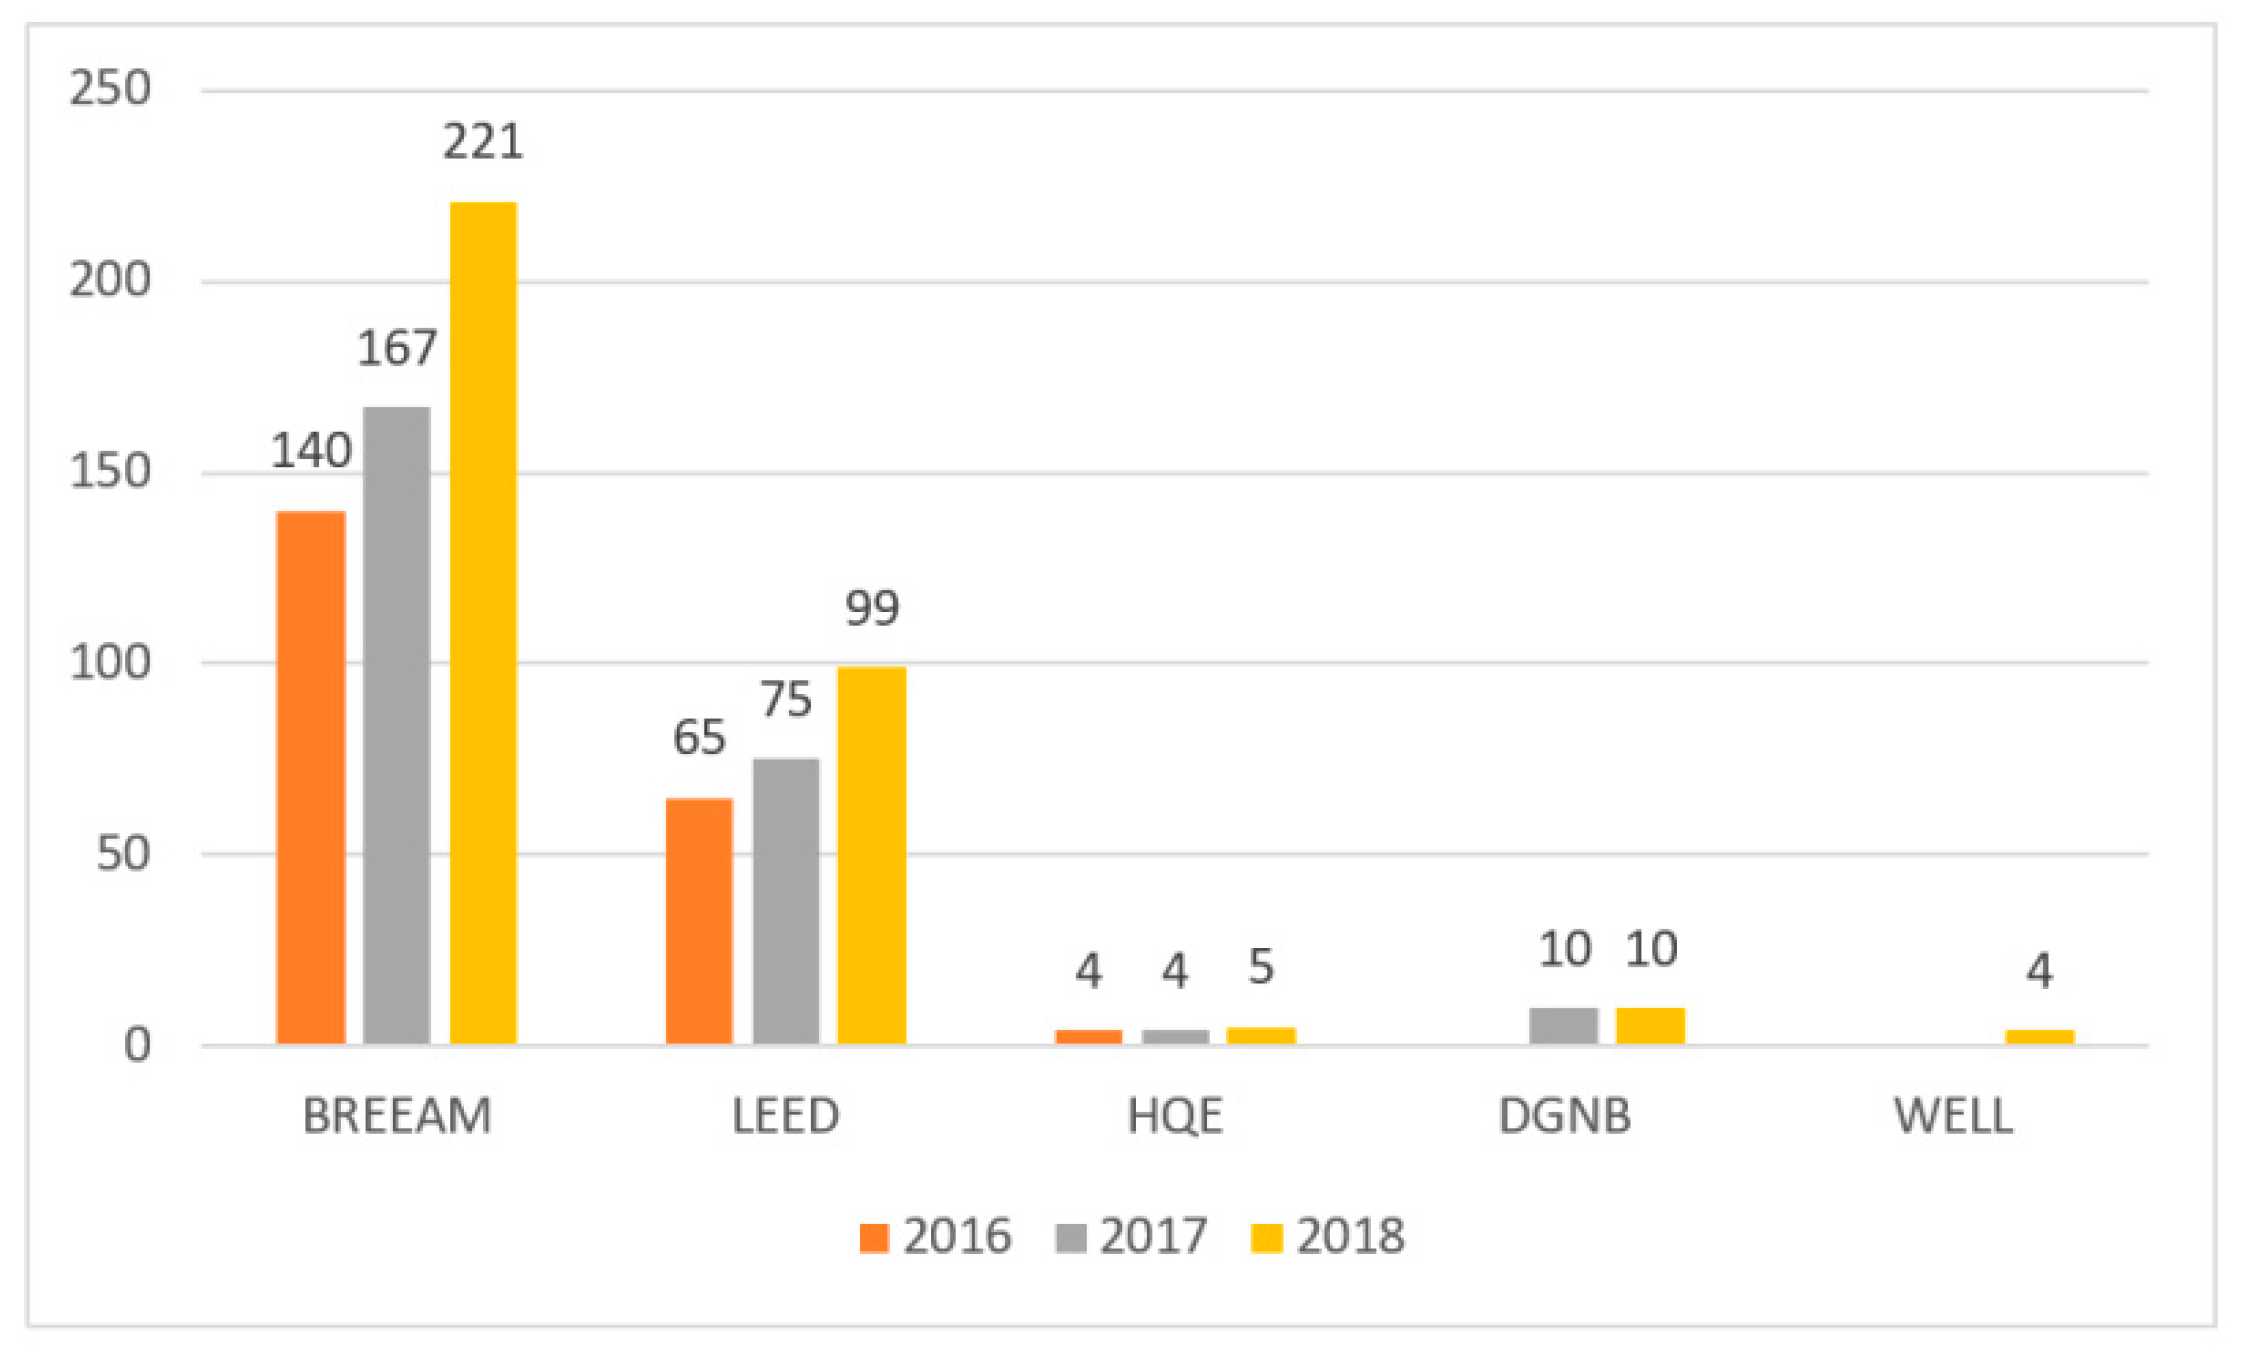
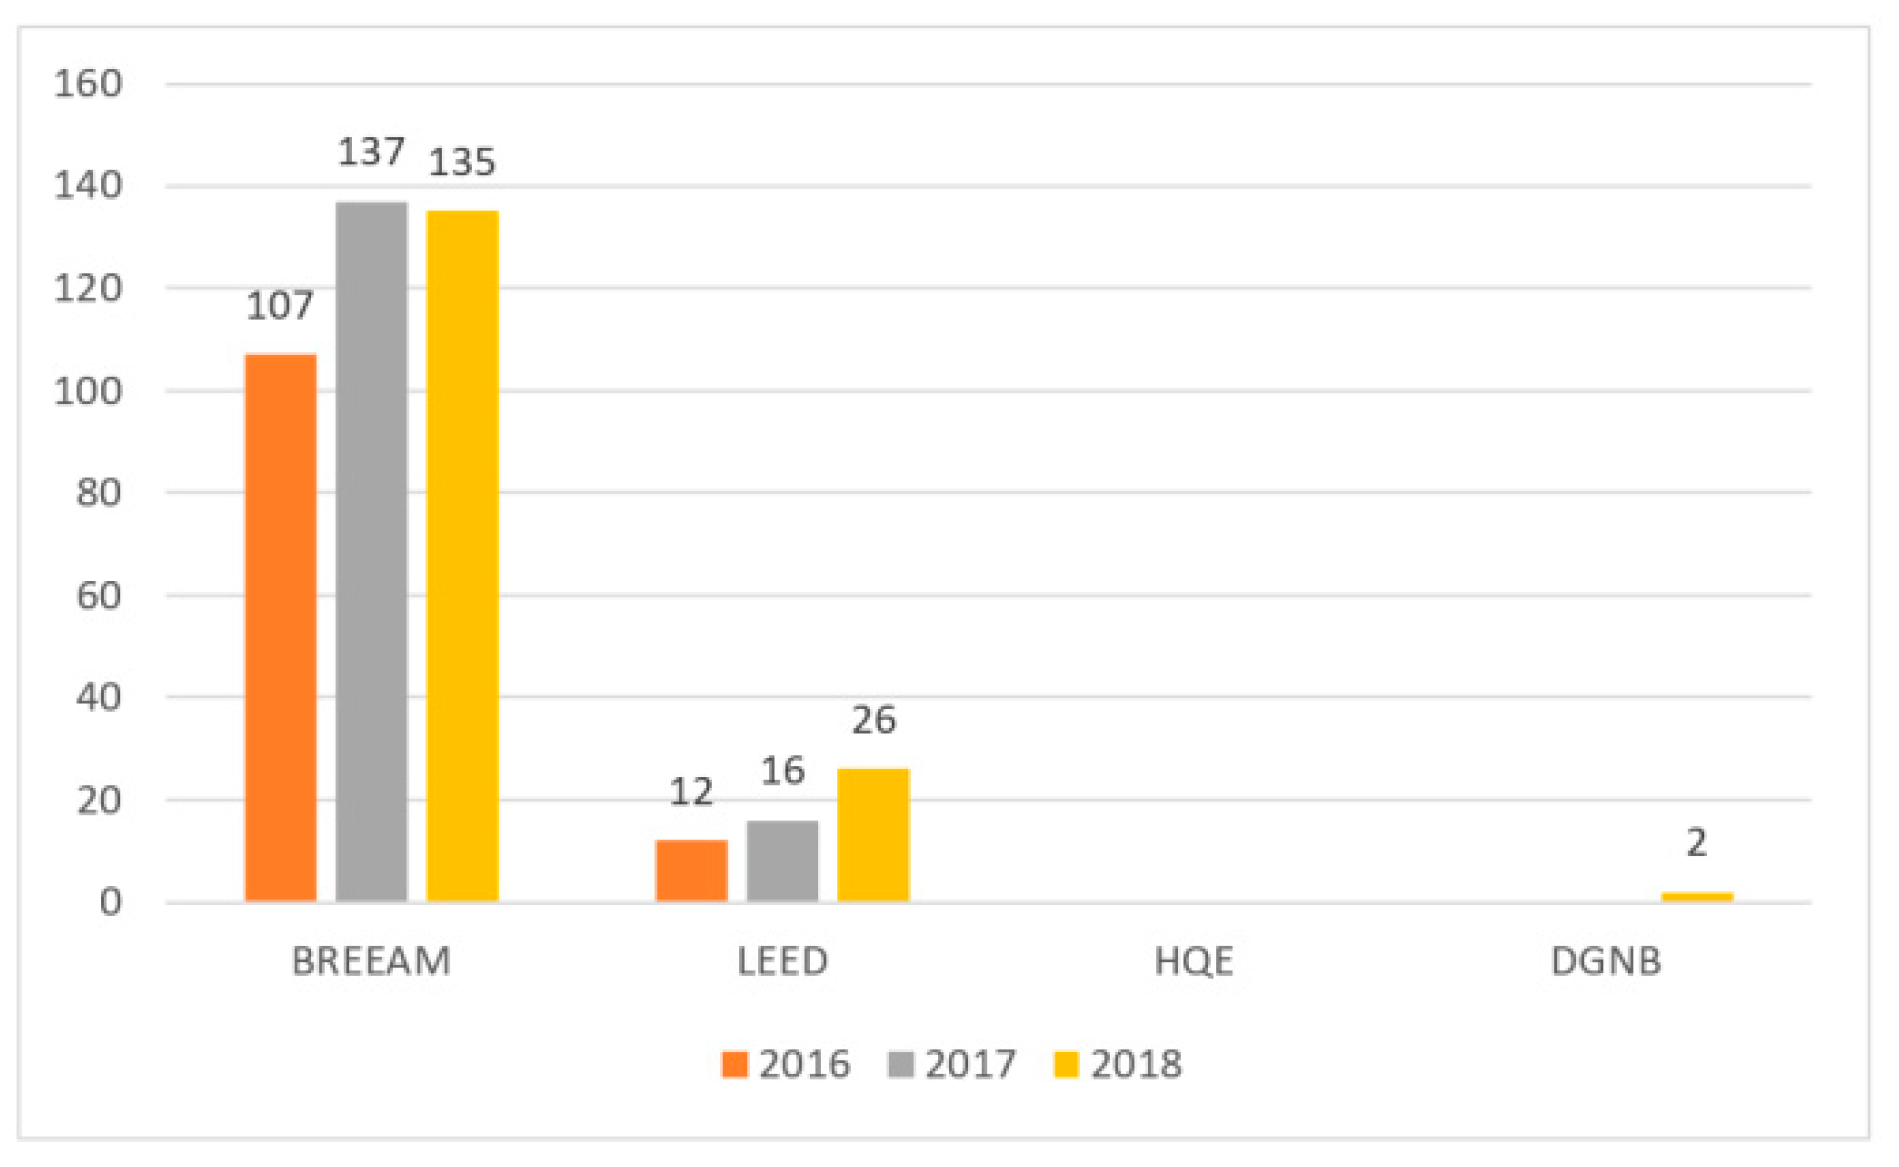
The annual increase in the number of new certified buildings tended to increase by 13%, 22%, and 32% accordingly (Figure 3). A completely different trend occurred in existing buildings. Annual growth in 2017 was 29% compared to 2016, and only 7% in 2018 (Figure 4). The most certificates were granted in the BREEAM system.
The total usable area of all buildings certified in all systems amounted to almost 12 million m2, of which the largest share belongs to those with the BREEAM certificate (Figure 5, Figure 6 and Figure 7) [36].
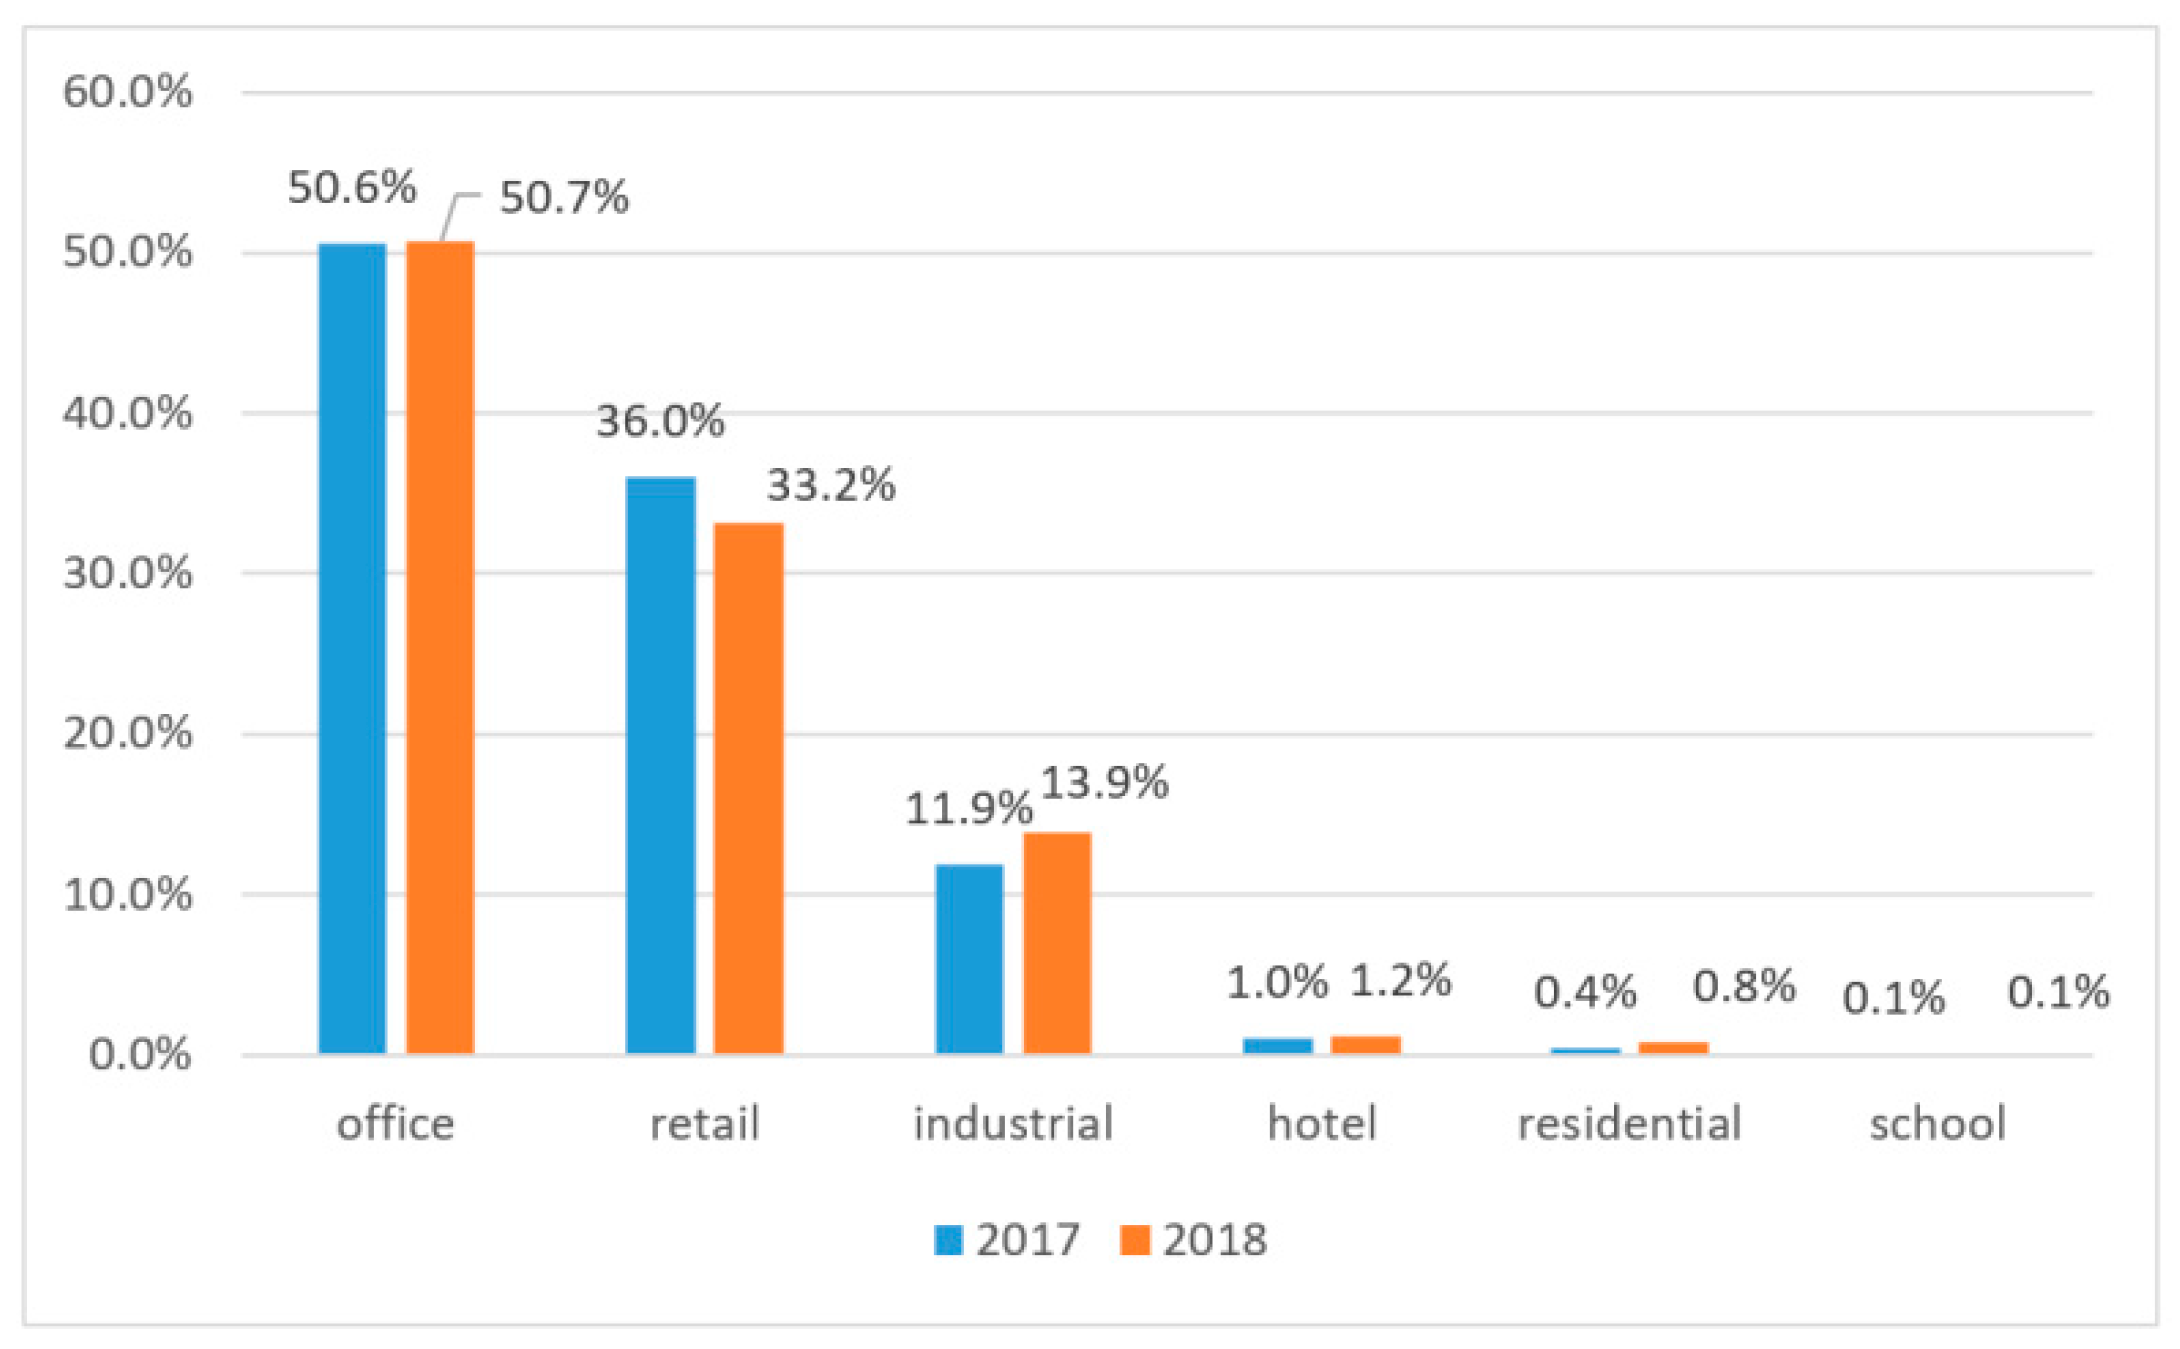
Figure 7 shows the usable floor area of certified buildings by sector, and as shown in the comparison, the office area sector accounts for 51% of the certified area. At the end of 2016 in Poland, 9 million m2 of modern office area was available, 57% of which was certified. At the end of 2017, almost 9.7 million m2 of modern office space was available in Poland, of which 62% was a certified area. This constitutes a five percent increase in the share of certified office space in relation to the total of modern office space during 2017.
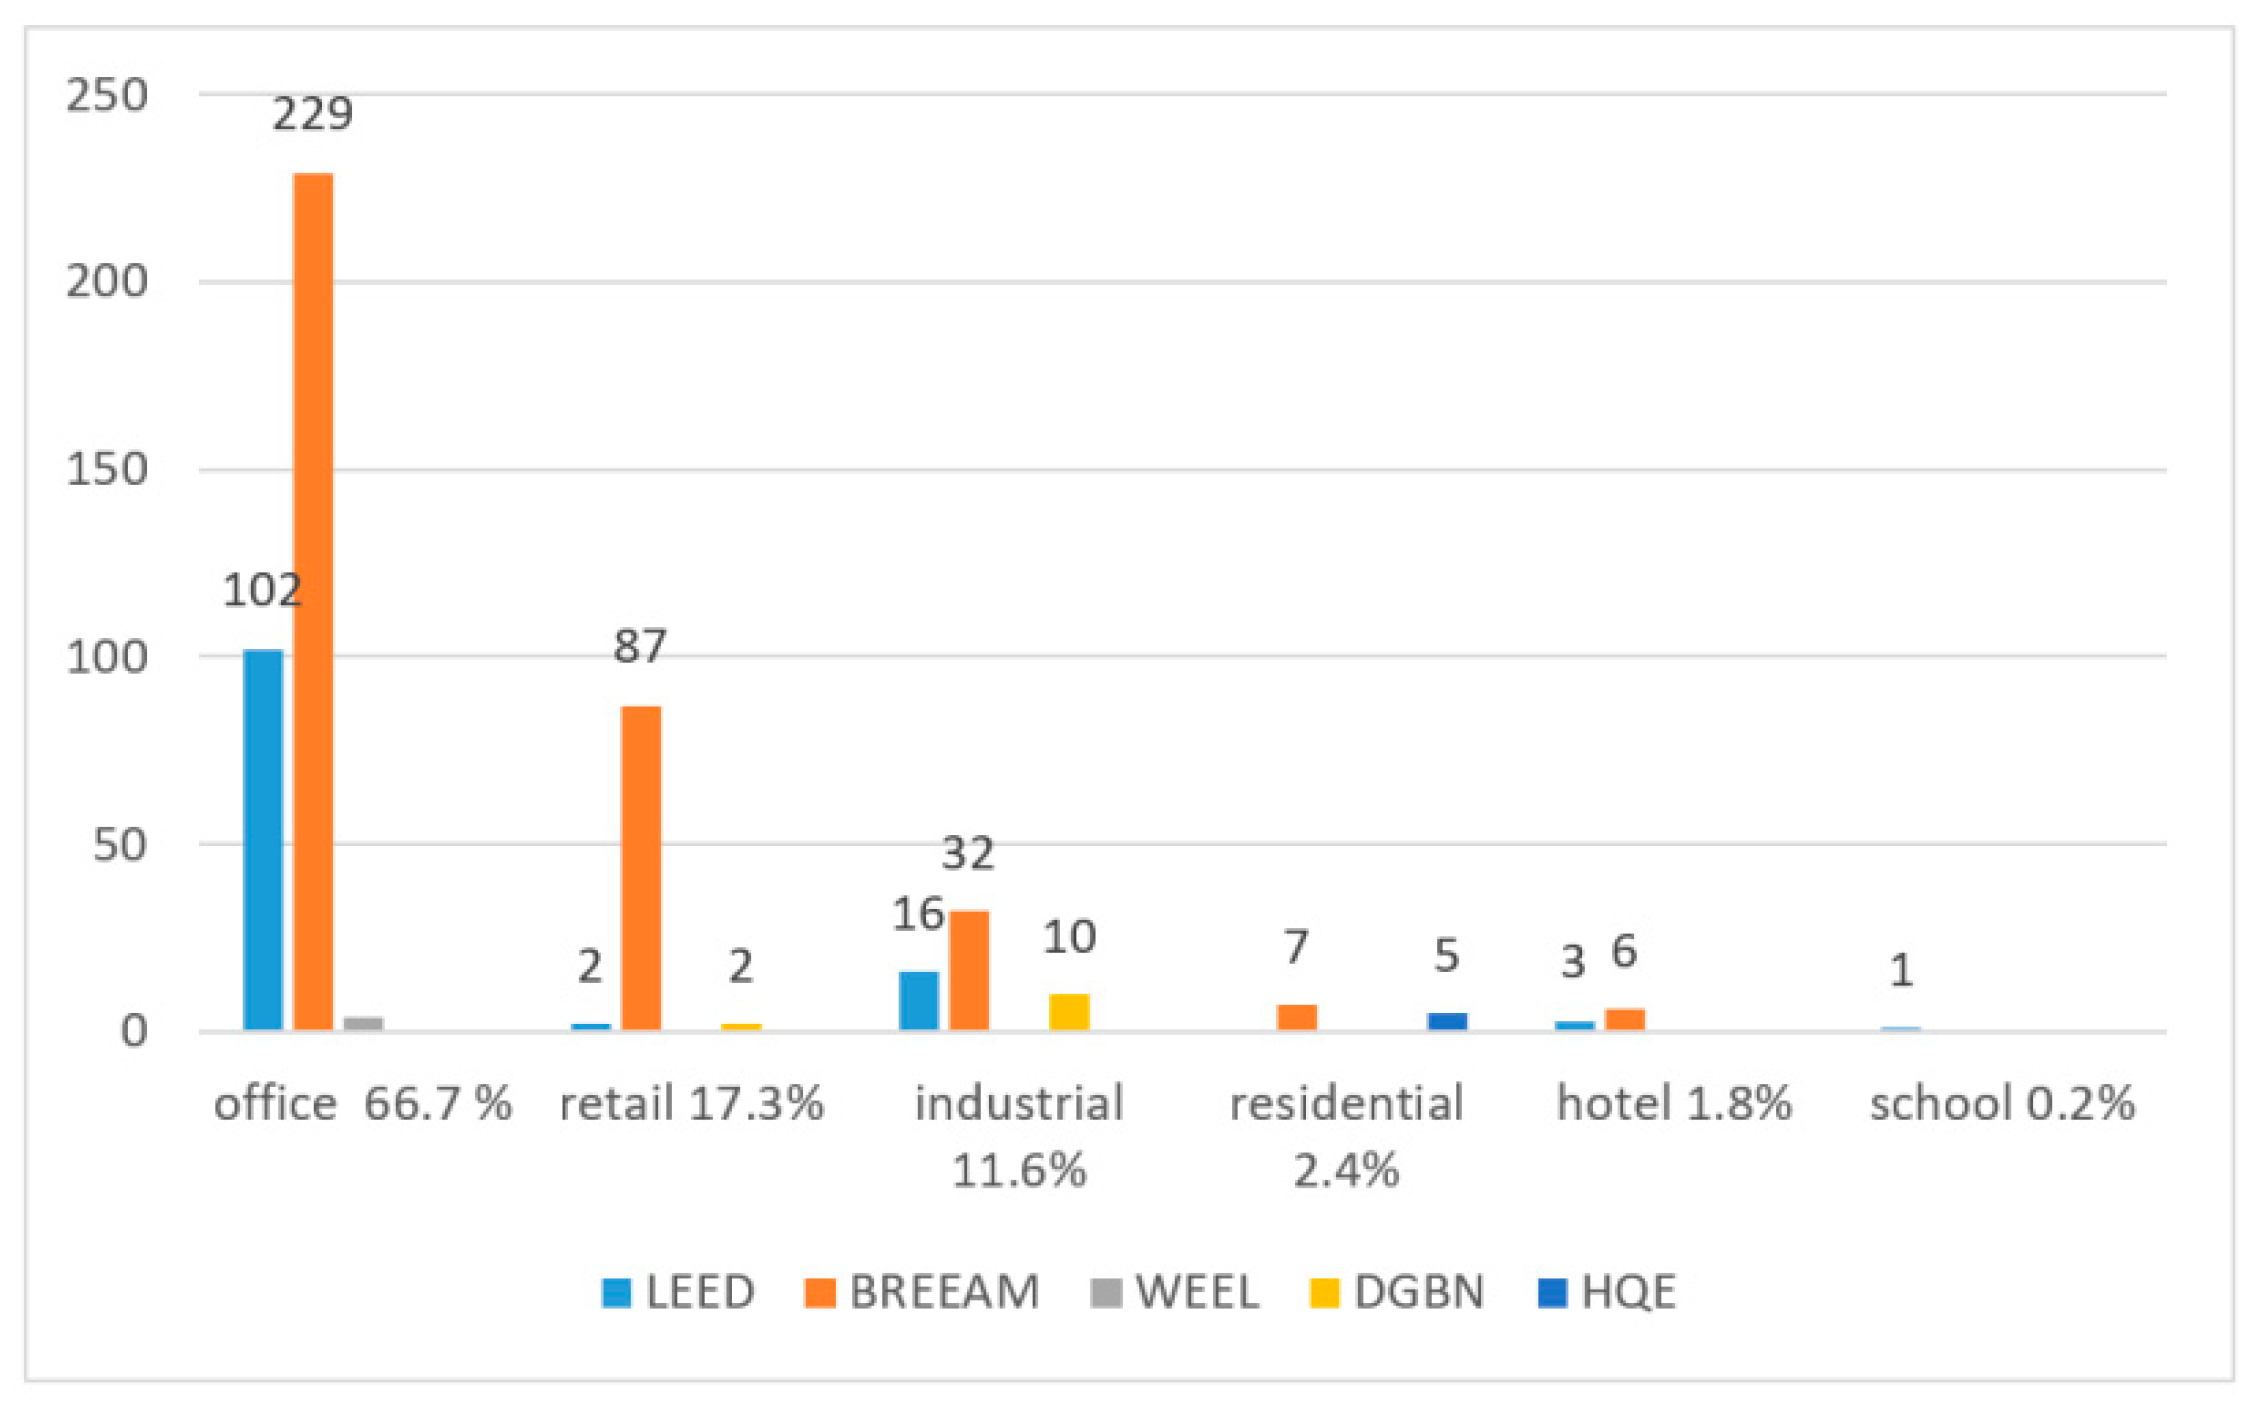
Figure 8 presents the business division of certified buildings in 2018. Office area sector leads the way in the division with regard to the function of the building (and this is a global trend). Second place is occupied by commercial buildings, and the third by industrial (11.6%). In 2018, the share of certified office buildings remained practically at the same level, reaching almost 67% (in comparison with 2017). Commercial properties recorded a 4% decrease (the probable reason is that some shopping centers did not renew BREEAM In-Use certificates). The number of buildings for industrial use increased by 2%, and housing by more than 1%. Hotel and school facilities (in particular: one certified school) remained at the same level [36].
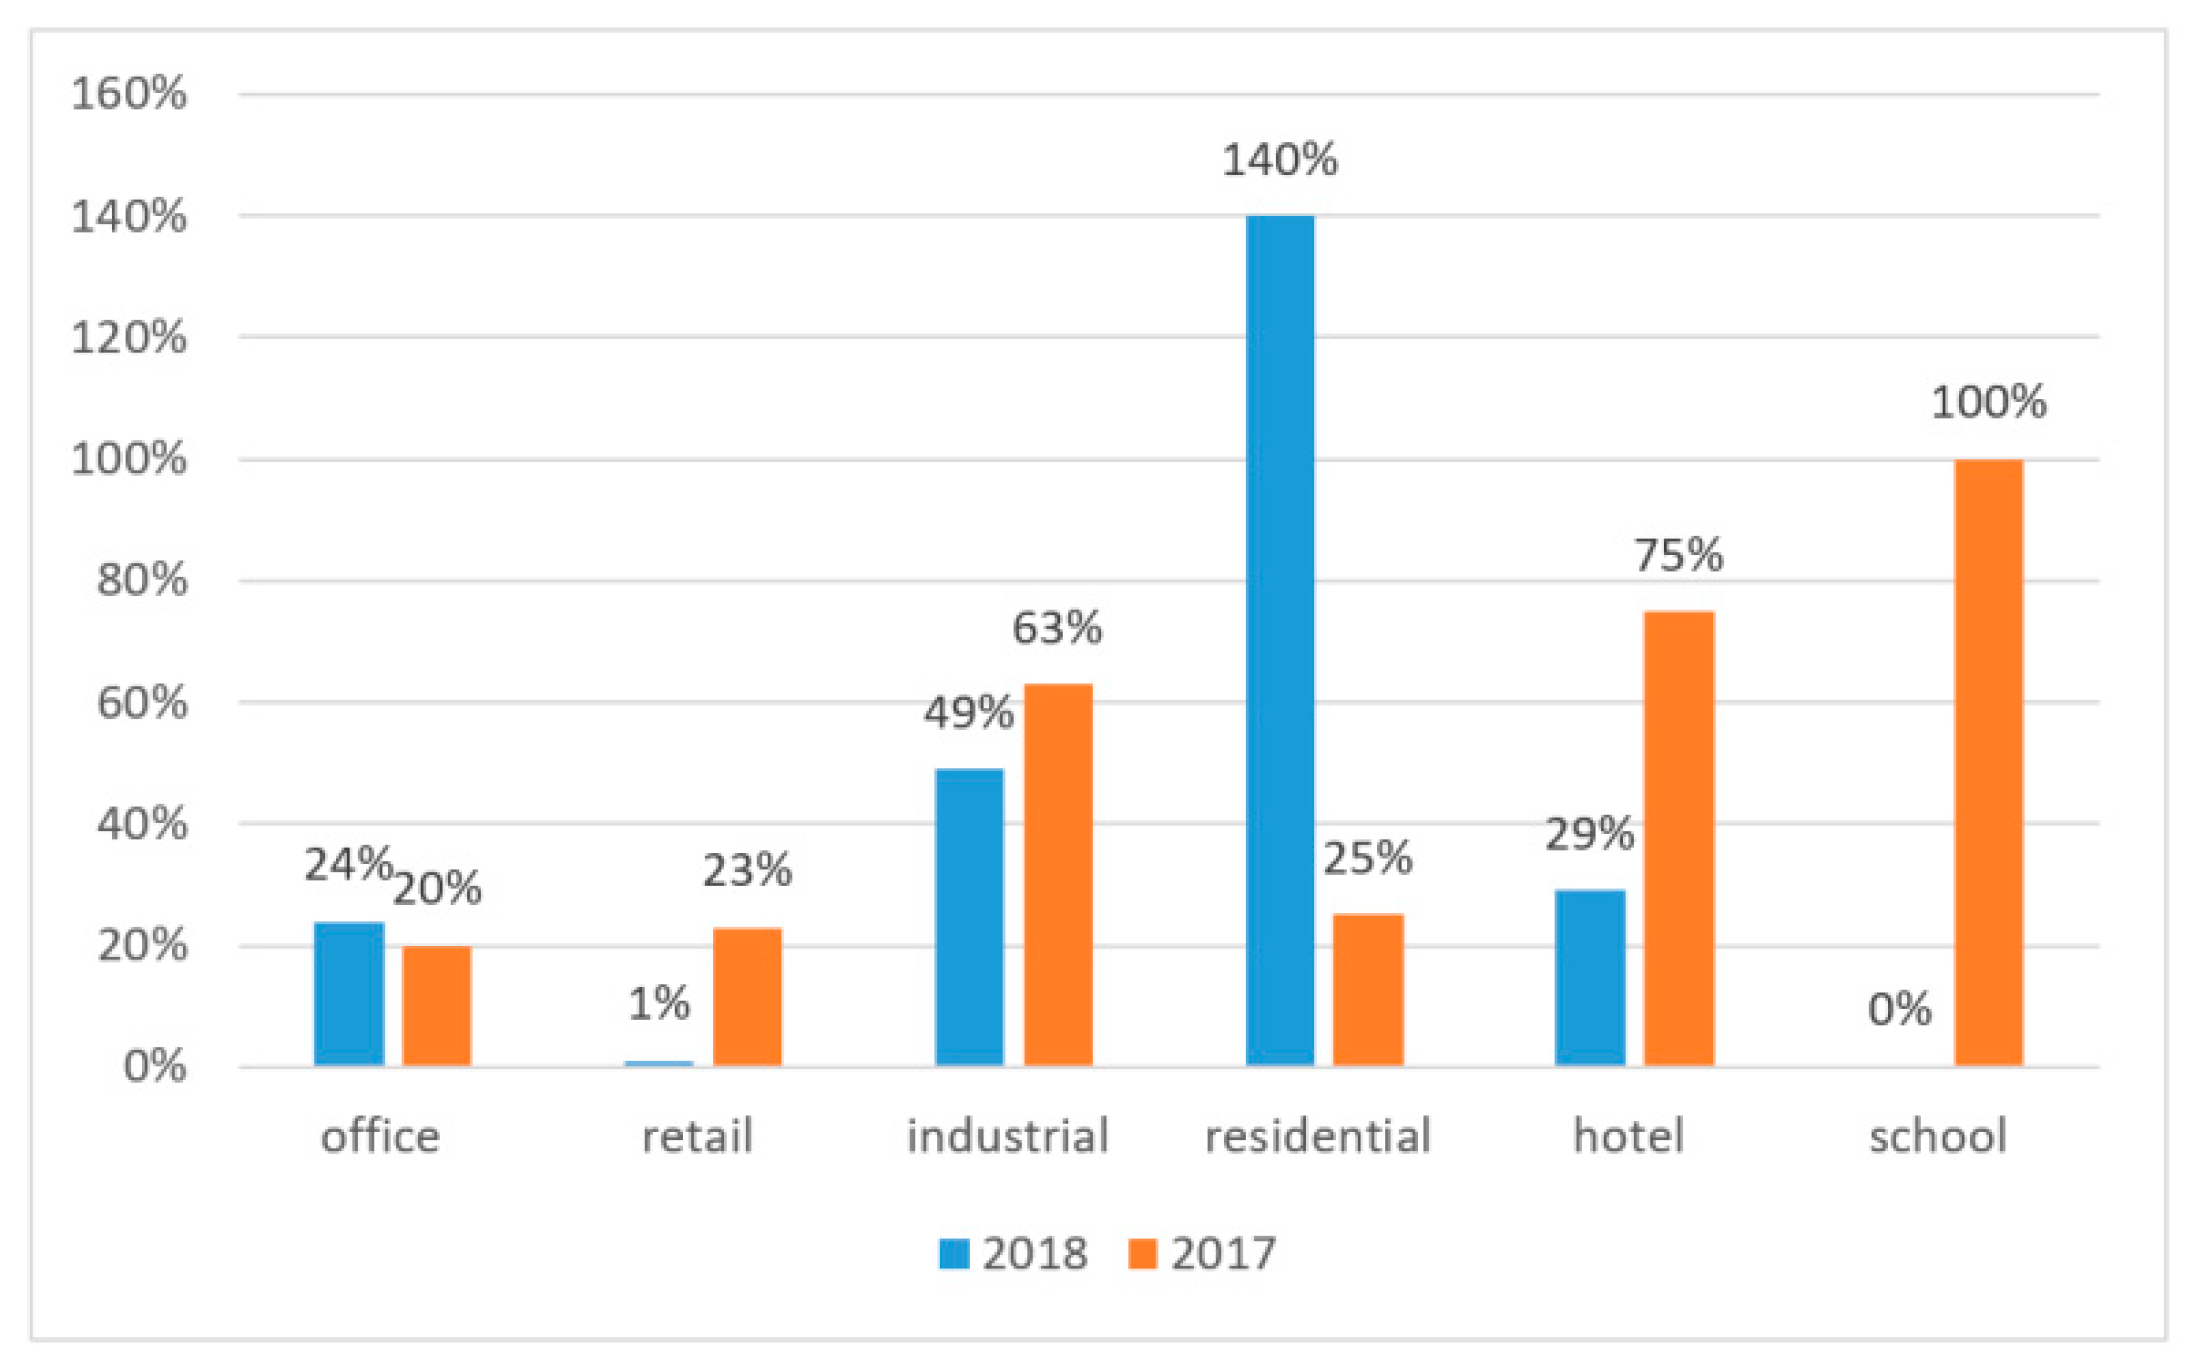
The dynamics of the annual increase in the number of buildings in particular sectors, presented in Figure 9, differs significantly in comparison to the previous year. The most spectacular increase in 2018 in percentage can be observed in the residential sector—about 140%. The office building sector grew at a rate of 24% (about 4% better than in 2017). The growth in the commercial sector was low, at the level of 1%. For comparison, in 2017 it was 23% [36].
5. Costs of a Certified Building in Relation to One without a Certificate
As Figure 8 reveals, the most numerous group of buildings that are trying to obtain a multicriteria certificate are office buildings. The situation is similar in most countries around the world, mainly due to the necessity to document the class of the building and its compliance with environmental and utility requirements before the informed (mostly corporate) tenants [38]. This is the main reason why the analysis of the costs and benefits resulting from the certificate will be performed on the example of an office building.
The LCNPV (life cycle net present value) is an example of a method allowing for the analysis of the effectiveness of a construction investment, determined on the basis of discounted cash flows taking into account environmental issues. This method makes it possible to evaluate investments based on the building life costs, and at the same time, it allows to compare and select one of the alternative investments that meets both the economic and ecological criteria of the undertaking. The LCNPV value is calculated according to the following formula:
where: CFi —cash flow in i-th year, i—subsequent year, r—discount rate.
According to the ISO 15686-5:2008 [39], the scope of costs included in the analysis of the costs in the life cycle are: construction; operation, maintenance, end of Life. The LCC (life cycle cost) refers only to the costs incurred in the life cycle. If non-construction costs are added to LCC, as well as revenues, then the aggregate value is collectively defined as WLC (whole life cost). It is important that the value of life cycle costs also take into account environmental issues (including, for example, energy consumption and utilities).
In the case of office buildings, special attention should be paid to the calculation of costs and maintenance fees. In commercial real estate, operating costs are transferred to tenants in whole or in part in the form of operating fees and/or re-invoices for utilities.
The costs of utility consumption mainly include electricity costs (60–70% of the total) and the costs of heat, gas, water, and sewage disposal. The next component involves property taxes. The tax covers land, buildings, and structures. The amount of property tax is calculated on the basis of rates per m2 of land area and building area (depending on the type of business), and in the case of buildings, as a percentage of its initial value. In office buildings it is necessary to incur costs related to the service of all technical installations in the building and the costs of technical service performed by a permanent staff and/or mobile service. Another cost component is the cost of the reception service and the employment of security staff. The protection work is supported by CCTV systems, an access control card system, and increasingly often, a rotary gate system.
Real estate management includes comprehensive activities aimed at maintaining real estate in a non-deteriorated condition and administration, including tenant and owner services, cost optimization, and supervision over broadly understood technical security of the real estate. It is necessary to pay the costs of service, including cleaning of common areas in the building, garages, and outdoor areas, as well as materials needed for its implementation. The annual fee for perpetual usufruct of land depends on the value of the land and its intended use (3% for land used for commercial purposes and 1% for land used for non-commercial purposes). The value of the land is subject to periodic updating, but not more often than once every three years. Insurance costs include property insurance, including terror and disaster, as well as civil liability insurance.
The group of costs which is the most diverse and difficult to estimate precisely is the one which includes recurring and predictable costs (purchase of current services, such as garbage collection, façade cleaning, and greenery maintenance), costs incurred at several-year intervals (such as five-year inspections and measurements), and costs emerging periodically (for example, repairs and snow removal).
The amount of operating costs per square meter of rentable space depends on many factors. These include, for instance: location, size of the building, technical progress, geographic location, form of land ownership, and the degree of its wear. It is also not possible to ignore the influence of current market trends (such as the expected increase in electricity prices) or changing legal conditions (for example, in perpetual usufruct).
The costs and operating fees in office buildings are published, among others, by Knight Frank. Knight Frank manages commercial real estates in Poland with a joint area of 1.3 million m2. In 2018, it published information prepared on the basis of a portfolio of office and office-and-service buildings located in various regions of Poland. To analyze the costs and maintenance fees, A/A+ and B/B+ class properties were chosen, located in Warsaw, Poznań, Wrocław, Kraków, Trójmiasto, and Łódź, built after 1998. The analysis covers the years 2011–2017.
Table 1 summarizes the average values of costs related to renting office space in the region in 2017.
According to the 2018 Colliers International report “The Largest Office Buildings in Poland Market Insights”, rents for office space have remained at a similar level in Poland for several quarters. In modern projects, tenants have to pay from 13.2 to 15.5 EUR/m2/month. In older buildings, the rates are lower by around 3 EUR per m2.
When analyzing the costs incurred for certification, three types can be distinguished [40]:
- -
- costs related directly to certification (regarding the certifying authority);
- -
- costs related to the project (introduction of appropriate solutions to the project documentation, additional analyses and studies, consulting);
- -
- costs related to the implementation and construction of a certified facility (related to the introduction of ecological solutions in implementation).
As far as LEED is concerned, the amount of fees depends on whether you are a member of the US Green Building Council. For projects exceeding 50,000 square feet (4645.0 m2), affiliates must pay USD 0.04 per square foot (around EUR 0.42 per m2), while non-members pay USD 0.055 per square foot (around EUR 0.51 per m2) for design and construction inspections in one. Thus, the fee for LEED certification in the office building with an area of 10,000 m2 would amount to, in total, from 4.8 thousand up to 5.9 thousand USD (3.7–4.5 thousand EUR). An express tariff of 10,000 is provided for the impatient, amounting to 10,000 USD (7678 EUR), regardless of the usable area. As far as BREEAM is concerned, the fees have not been made public. However, it can be said that for a similar sized office building, the registration fee is 900 GBP (about 1072 EUR), for the certification at the design stage one has to pay 1.8 thousand GBP (about 2.056 EUR), for the final certificate 900 GBP (~1028 EUR) and a fee of 1.5 thousand GBP (1713 EUR) is collected at both stages of the registration process, which is a total of 6.6 thousand GBP (7923 EUR). As in the case of LEED, DGNB imposes other fees on affiliates and non-affiliates. For projects exceeding 4000 m2, but less than 20,000 m2, a fee of 2 thousand EUR plus 0.35 EUR per m2 is levied on members, while non-affiliates must pay 3,000 EUR plus 0.75 EUR per m2. This means that the developer of an office building with an area of 10,000 m2 would have to spend from 5500 to 10,500 thousand EUR on fees. However, fees for certification systems are only part of the costs.
The costs should also include the expenses related to the introduction of BREEAM to project documentation, as well as the implementation of additional analyses and studies, that is all costs related to the project and the costs associated directly with the implementation and construction of the certified facility. It is estimated that the highest costs should be spent on consultancy fees which depend on the type of building, dimensions, repeatability of floors, the level of certification, and the experience of the consultant. It is assumed that in the case of the highest BREEAM Interim Excellent rating, the building costs can increase up to a maximum of 10% compared to a non-certified building [40].
According to specialists, the largest costs (among non-material costs) that developers incur are related to fees for consultations. In this field, prices are harder to determine, as they depend on such factors as: type of building and its dimensions, repeatability of floor layout, desired level of certification, number of competitors on the market, and consultant’s experience; this means that prices may be different in various countries. The BREEAM has gained an advantage in the region. There are 30 companies in Poland, each of which has many BREEAM assessors. For comparison, there are 65 accredited LEED consultants, 38 of whom are accredited professionals, and only 32 who are active. Table 2 indicates the costs of obtaining the LEED certificate and Table 3 presents additional certification costs resulting from the process characteristics.
In addition to the costs related to obtaining the certificates, design costs should be added. They include: consulting and ecological consulting, preparation of LEED documentation for the SLL review, preparation of LEED documentation for the full certification process, additional costs of the basic documentation due to the implementation of LEED solutions, and energy analyses necessary in the building certification [40]. It should be assumed that the value of design/consulting services ranges from 1.5 to 3.1% of the investment value (Table 4).
Implementation costs in a certified building, compared to the costs of a standard investment, are higher depending on the level of the certificate obtained (Table 5).
In the case of the BREEAM certificate, the sum of costs incurred, similarly as in the case of LEED certification, depends on the amount of the grade for which the project is applied, but also on the advancement of the applied solutions. The attempt to obtain the highest rating is associated with additional costs that will be compensated for in the future by savings in the costs of building use. Also, in the case of this certificate other fees are imposed on affiliated and non-affiliated entities.
When trying to estimate the implementation costs to be carried in the building certification, additional safeguards and materials are taken into account, such as straw in cubes arranged along the fence to prevent the spread of pollution from the construction site, and segregation and recycling of construction waste. It should be remembered that some of the costs are not borne by the general contractor, only the subcontractors are charged with them, such as the costs related to appropriate securing or storage of materials at the construction site.
Data published in the US indicate a reduction in operating costs of green buildings by an average of 8–9% compared to conventional buildings, a 7.5% increase in the value of real estate, and an increase in the investment profitability rate of 6.6% [41]. In green commercial buildings in the United States, there is an average of 3.5% increase in rented space, and the rent is higher by 3%.
According to the US Green Building Council, maintenance costs in green buildings are nearly 20% lower compared to ordinary commercial buildings. Also, in the case of buildings under modernization, already in the first-year, cost reduction may amount to as much as 10%, which means that the period of reimbursement of the costs incurred for improvement is closed within 7 years. What is more, the value of a real estate with the appropriate certificate increases on average from 4% to even 7.5% and decreases at a significantly lower rate. It is also much easier to rent or simply to sell such a building [42].
Table 6 presents comparison and basic differences in costs between the certified and non-certified building.
It is noteworthy that “green buildings” are causing a number of environmental benefits or reduced sickness absences due to the offered higher comfort. In view of the scope of the paper, these issues are not discussed in detail.
6. Cost Analysis: A Case Study
In order to compare the costs and benefits of certified buildings, the costs of a non-certified and a certified office building were simulated. The comparison was made using the idea of costs in the life cycle and calculating the LCC.
The object of analysis is the administrative-office building, a 6-story one with a basement. The detailed description of the building comes from the BCO Bulletin, Sekocenbud, first quarter of 2018 (No. 1220-101). The building area is 372 m2, usable area 1716 m2 (taking into account 6 stories of a building), while the total price of the building completion amounts to 1,419,413 EUR.
Two variants of the building were adopted: the base one, in accordance with the standard data presented in the previous paragraph, and the “green” one, taking into account the costs and benefits resulting from the building certification. In both cases, the costs related to the acquisition of a development plot, project fees, implementation costs, costs of operation, and investor’s profits resulting from rent payments were taken into account.
The building area is 372 m2, it was therefore assumed that the minimum area of the development plot was 500 m2. According to market data, the average price per m2 of an investment plot with an off-center location is 39.53 EUR. The cost of design documentation for the analyzed building was assumed at 5.9% of the building completion price. The operating costs for the base building were assumed at 4.70 EUR/m2 per month, while the rent was 16 EUR/m2, assuming that 70% (base building) and 80% (“green” building) of the usable area of the building would be rented.
Formula (1) and the cost range given in Table 7 were used to calculate the LCC. Therefore, for the “green” building, the costs of the project documentation were increased to 7.9% of the construction works costs and an additional 3000 EUR was added as additional costs related to certification. The costs of implementation were higher by 8% compared to the base building. Operating costs were defined as 8% lower, while rent was 3% higher. The assumptions are presented in Table 7.
According to literature analysis (e.g., [43]), it can be concluded that the most often accepted time of operation in the LCC analysis is 5-50 years, while the interest rate is 4–9%. Such data was adopted to determine the costs in the analyses. Formula (1) and the cost range given in Table 7 were used to calculate the LCC.
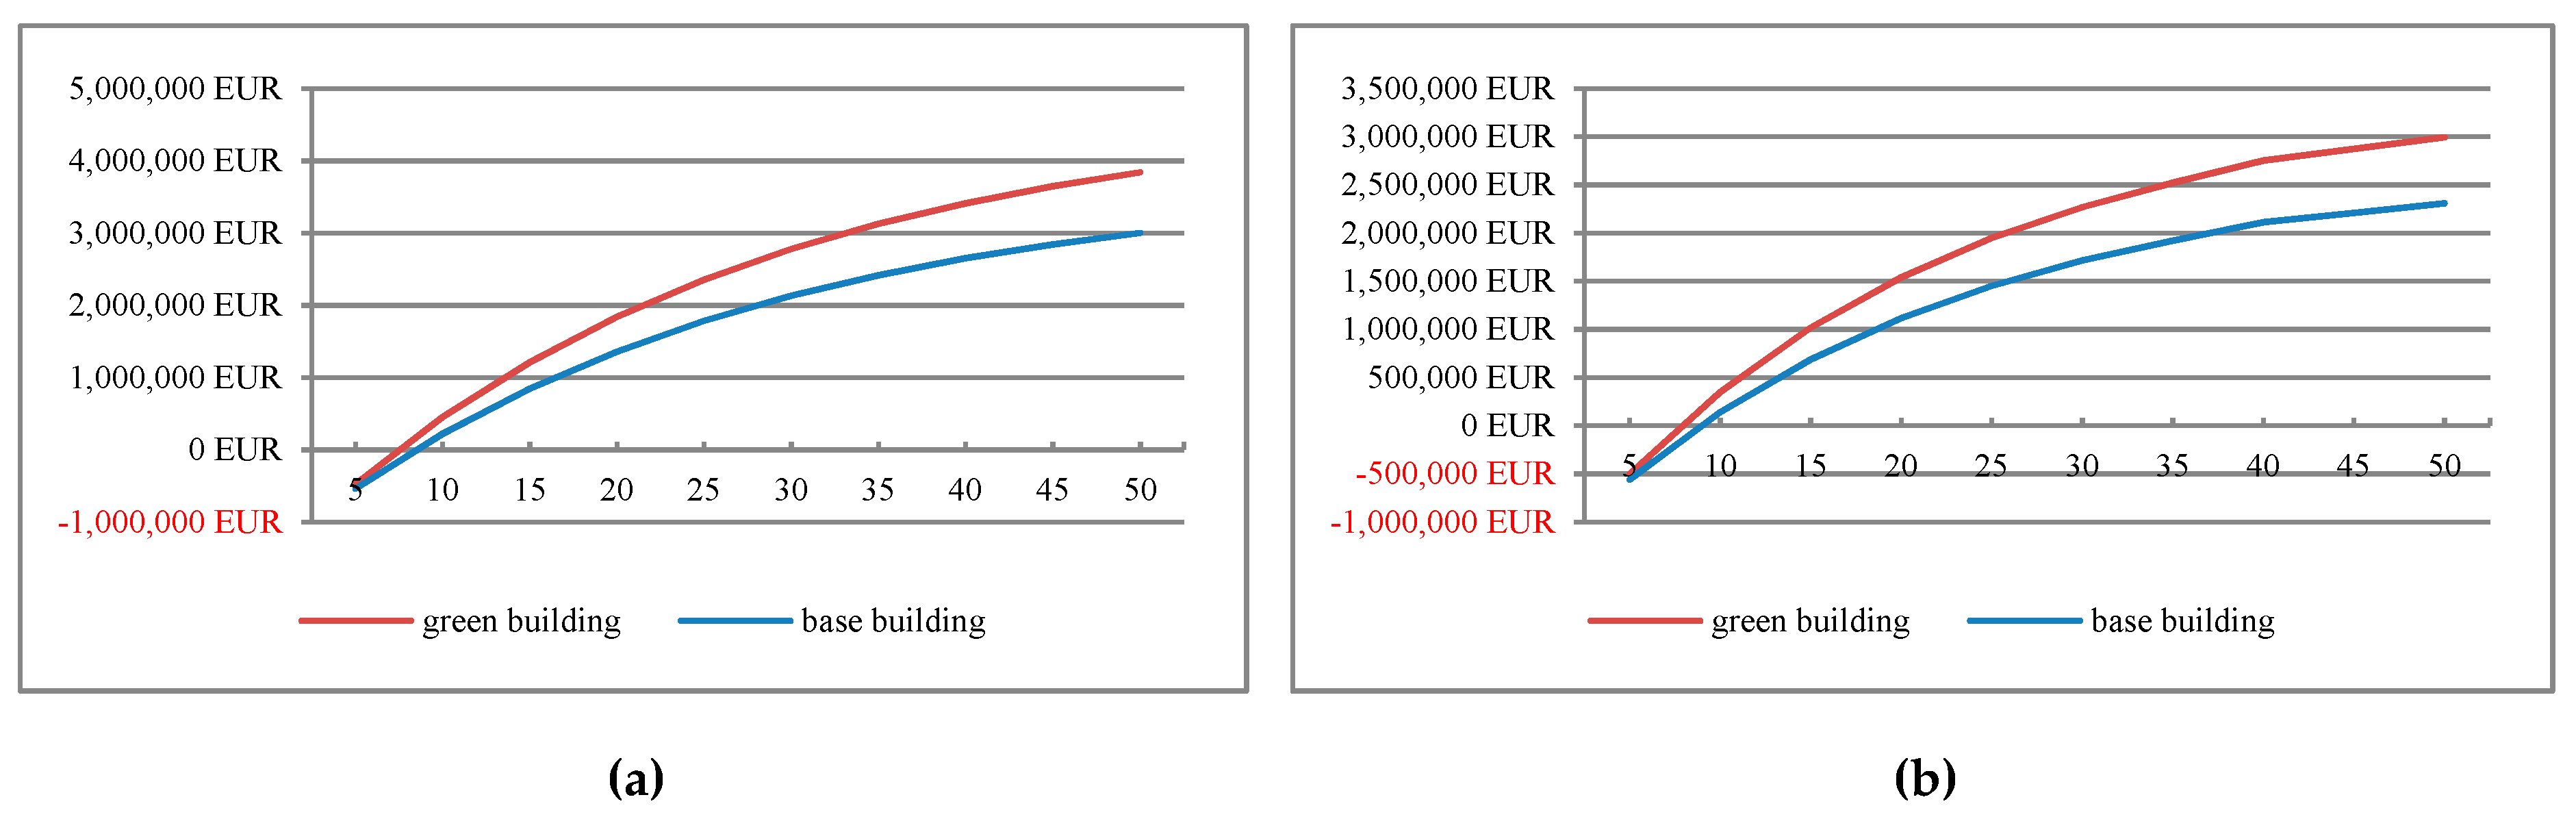
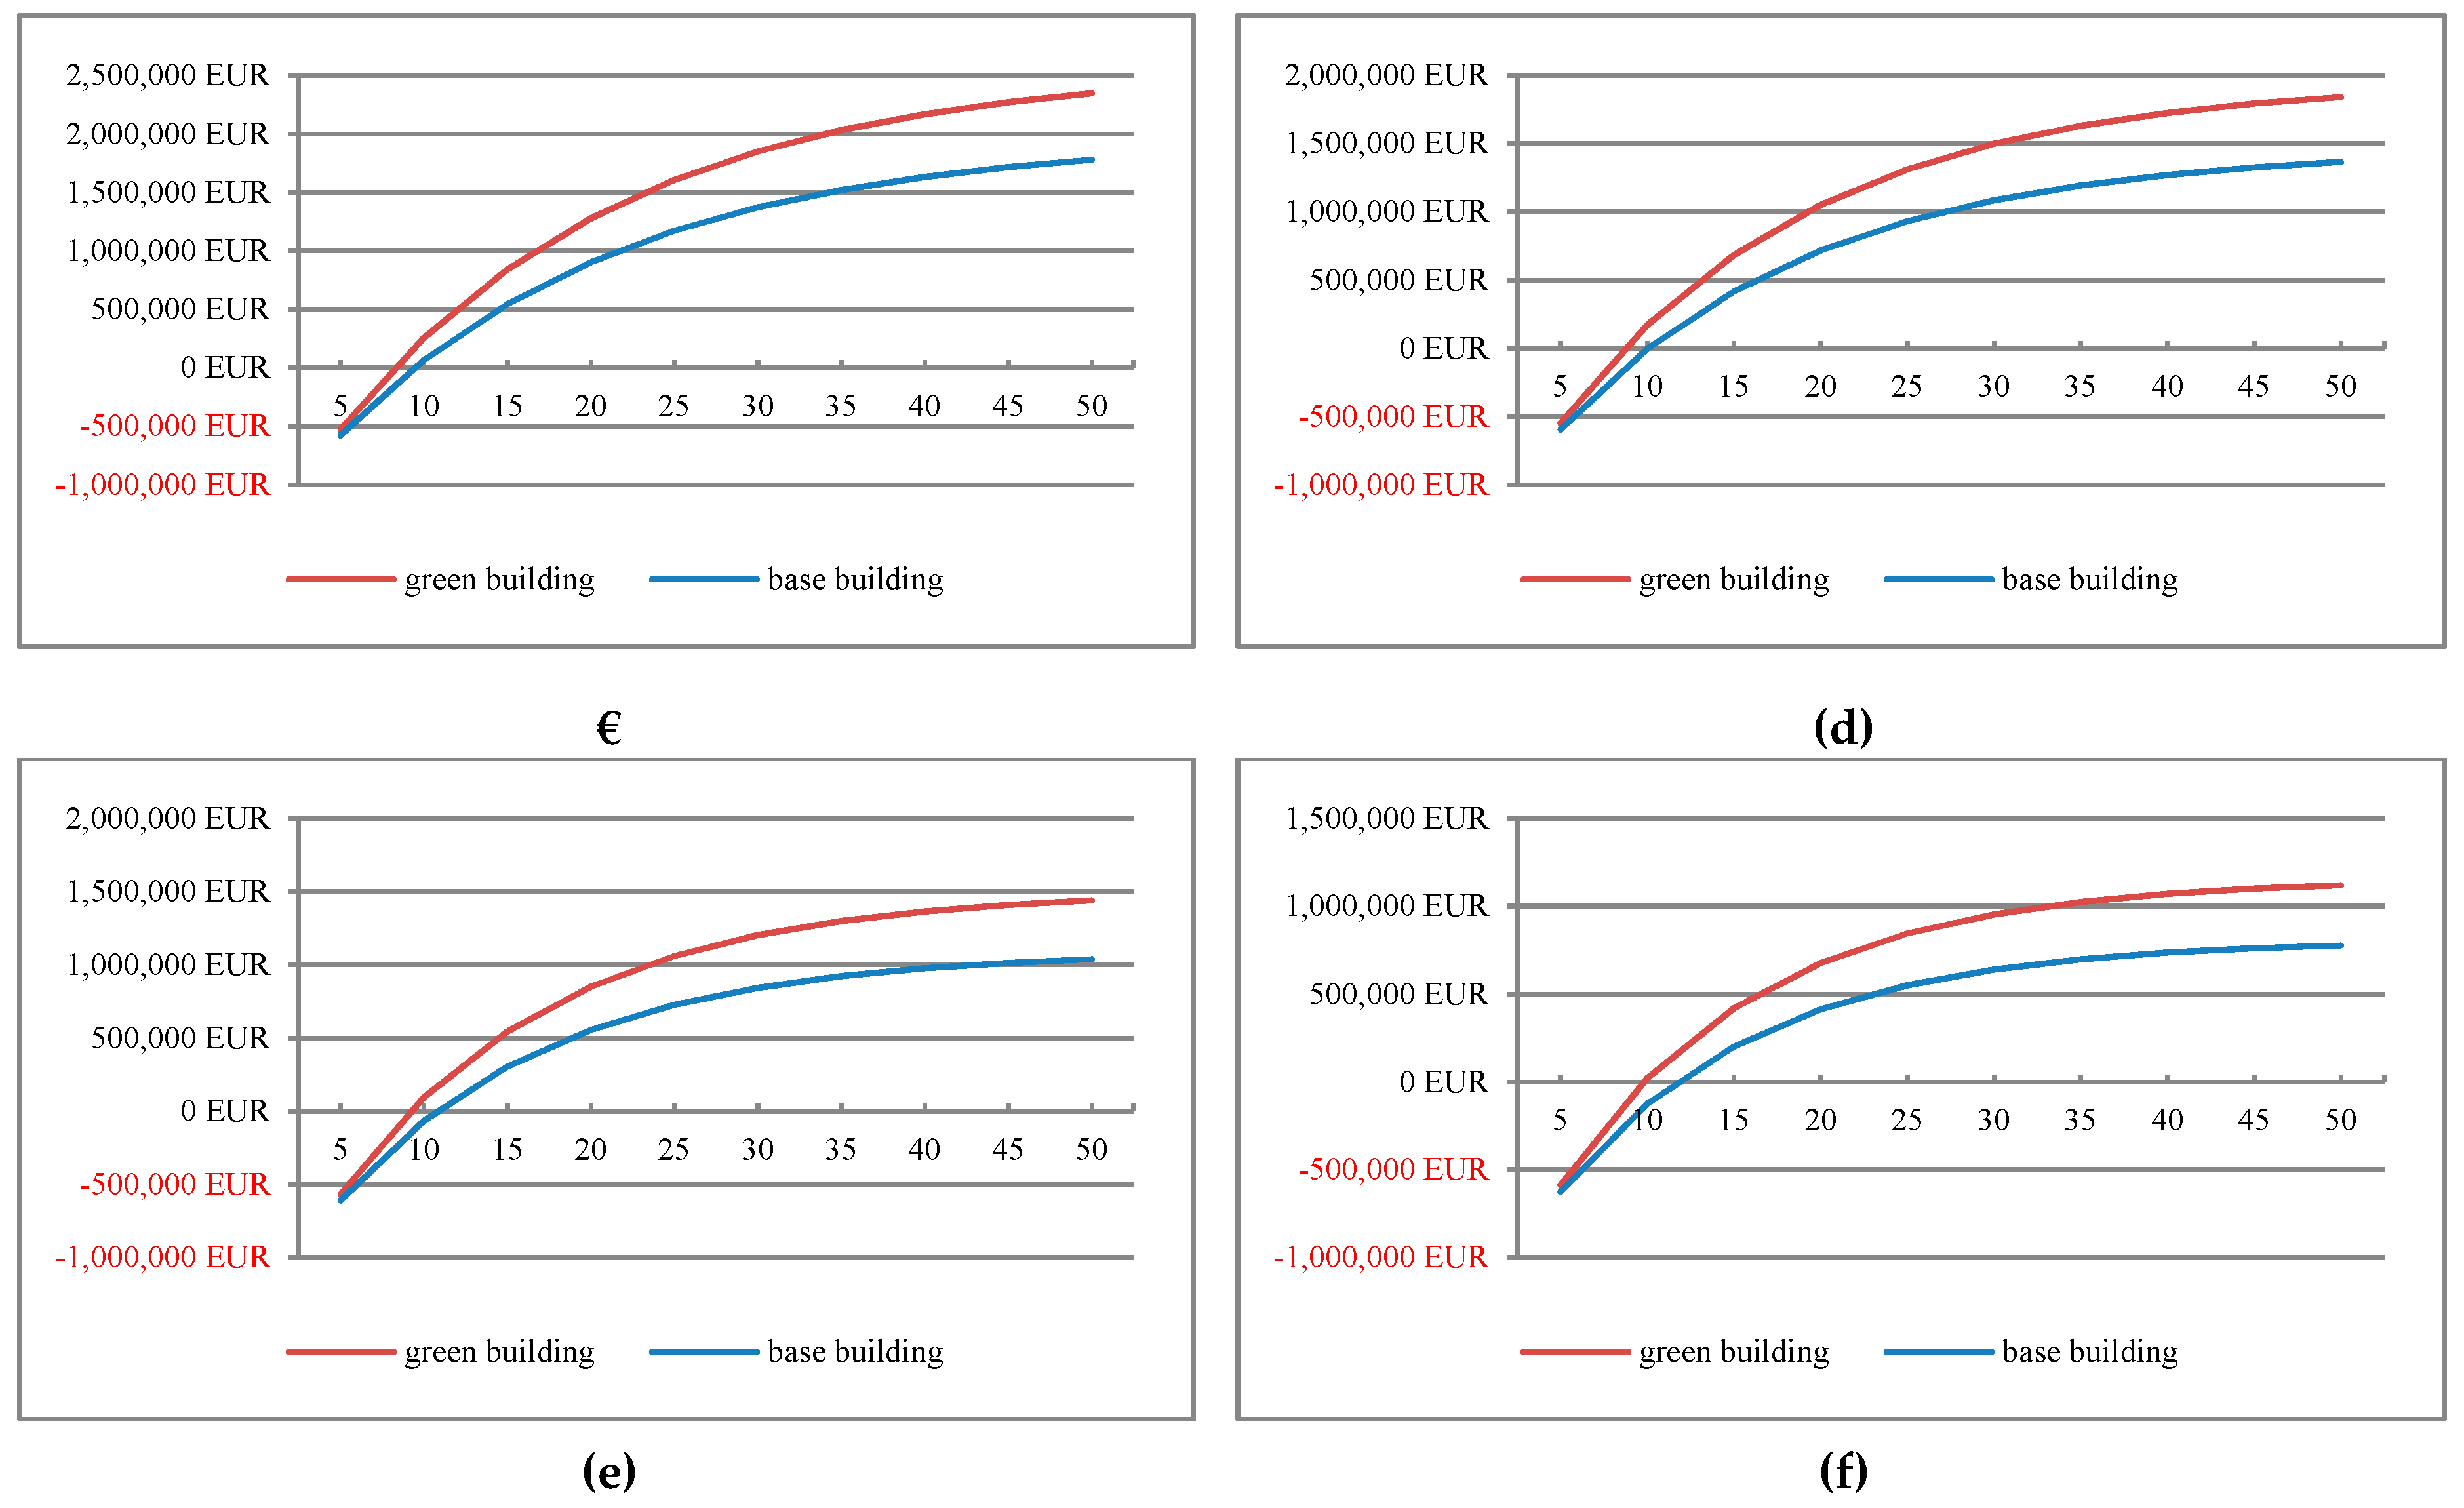
For such assumptions, the LCC was determined taking into account the change in the time of operation from 5 to 50 years and for the changeable interest rate of 4–9% (Figure 10).
Figure 10 show a strong dependence of investment profitability on the discount rate adopted. Assuming the 4% rate, the investment starts to be profitable after about seven years, while at the 9% rate after about 12 years. The difference between the base building and the green one is mainly based on obtaining higher LCC values with lower investment expenditures for the green building. The time, however, when the investment becomes profitable is the same for both buildings.
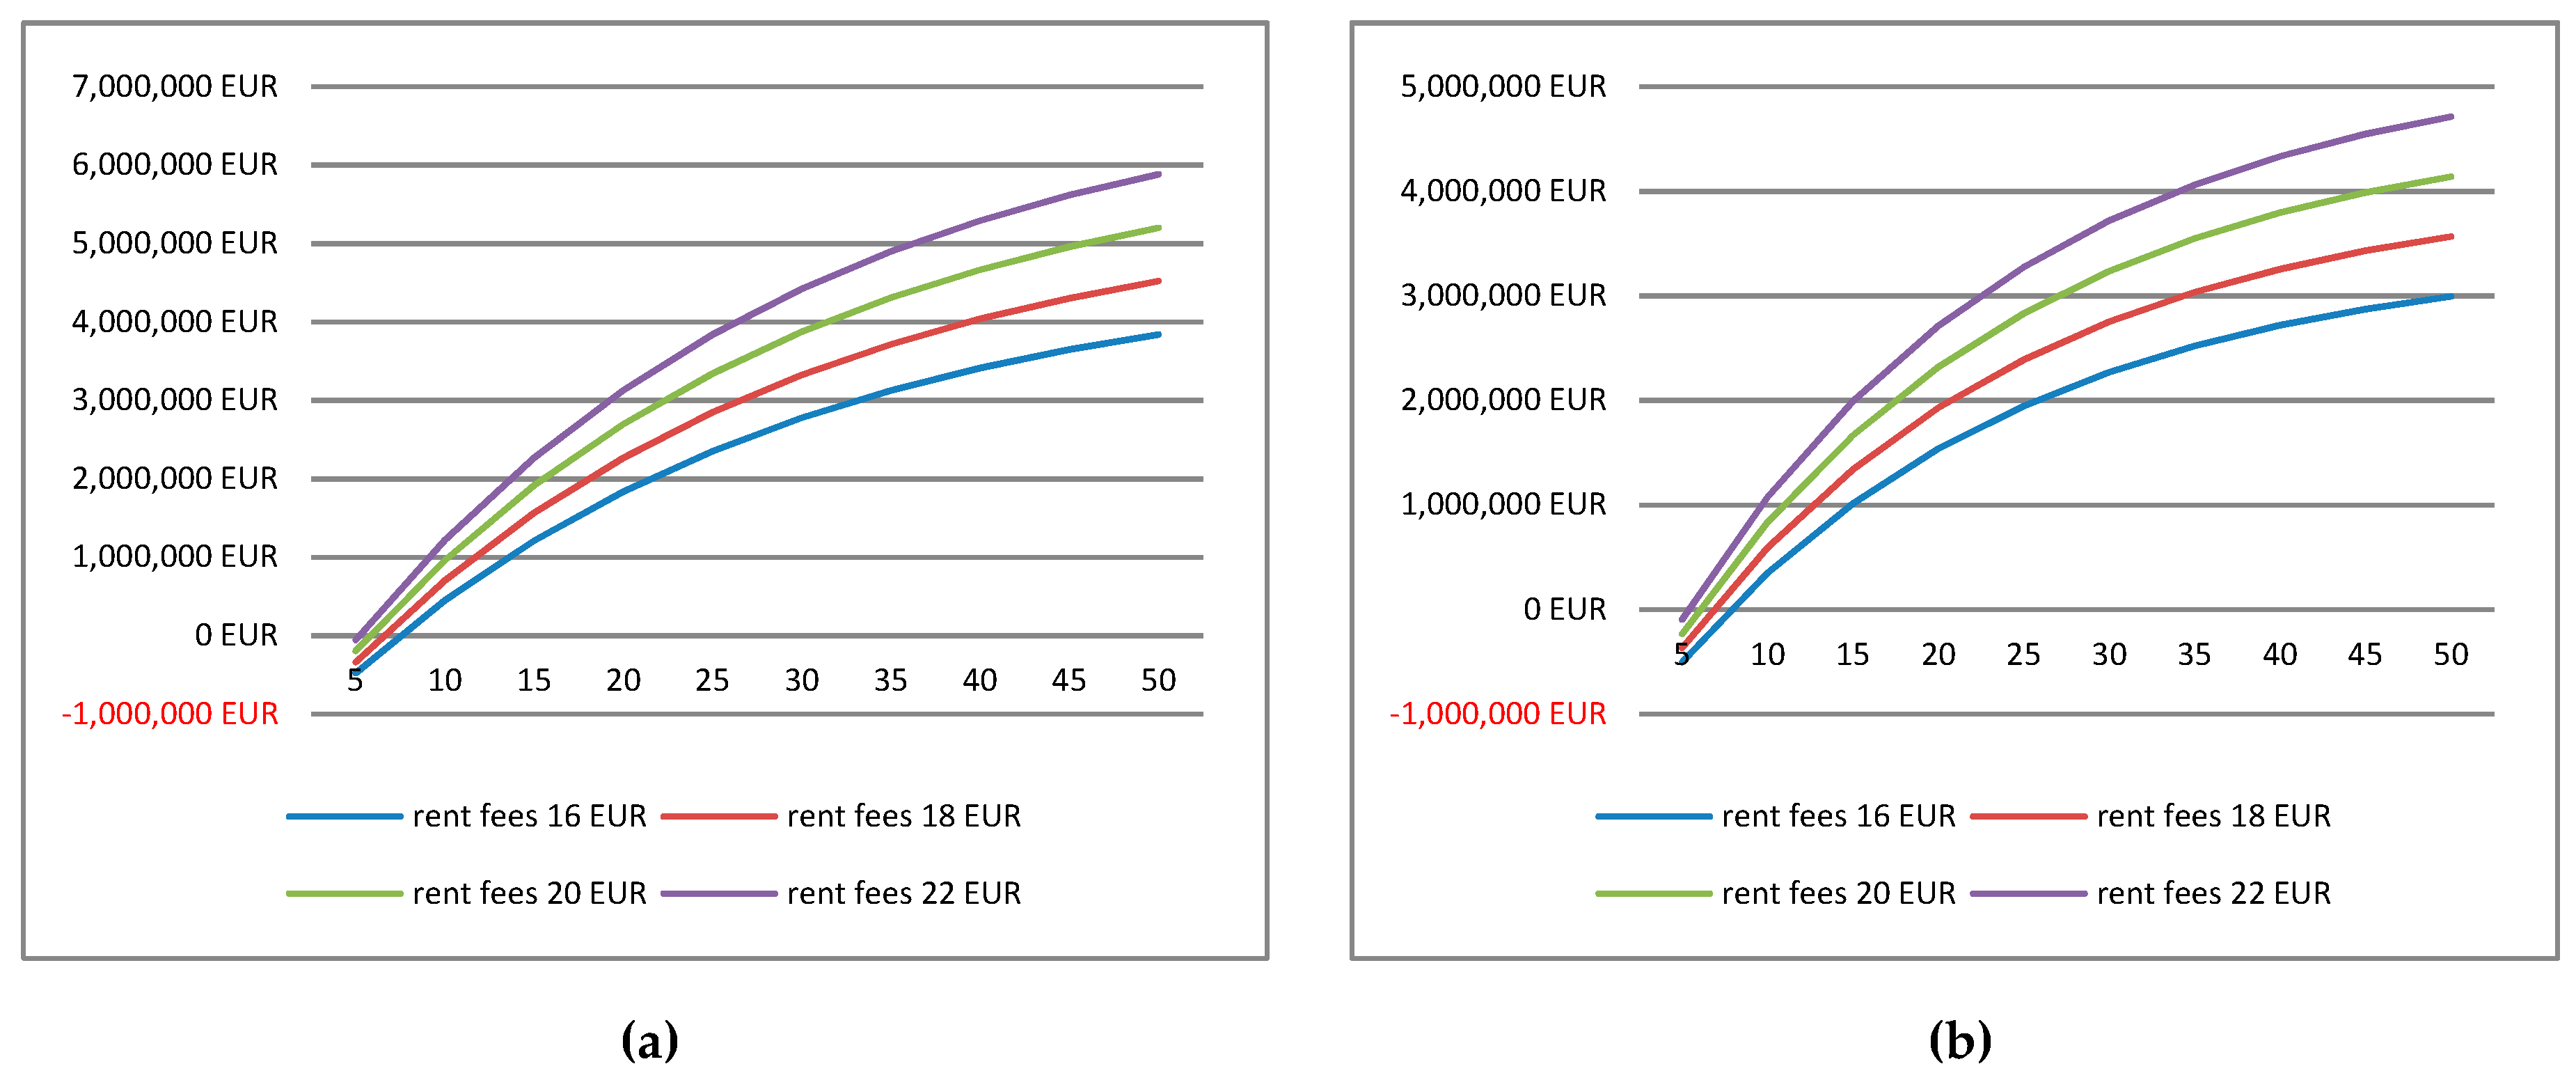
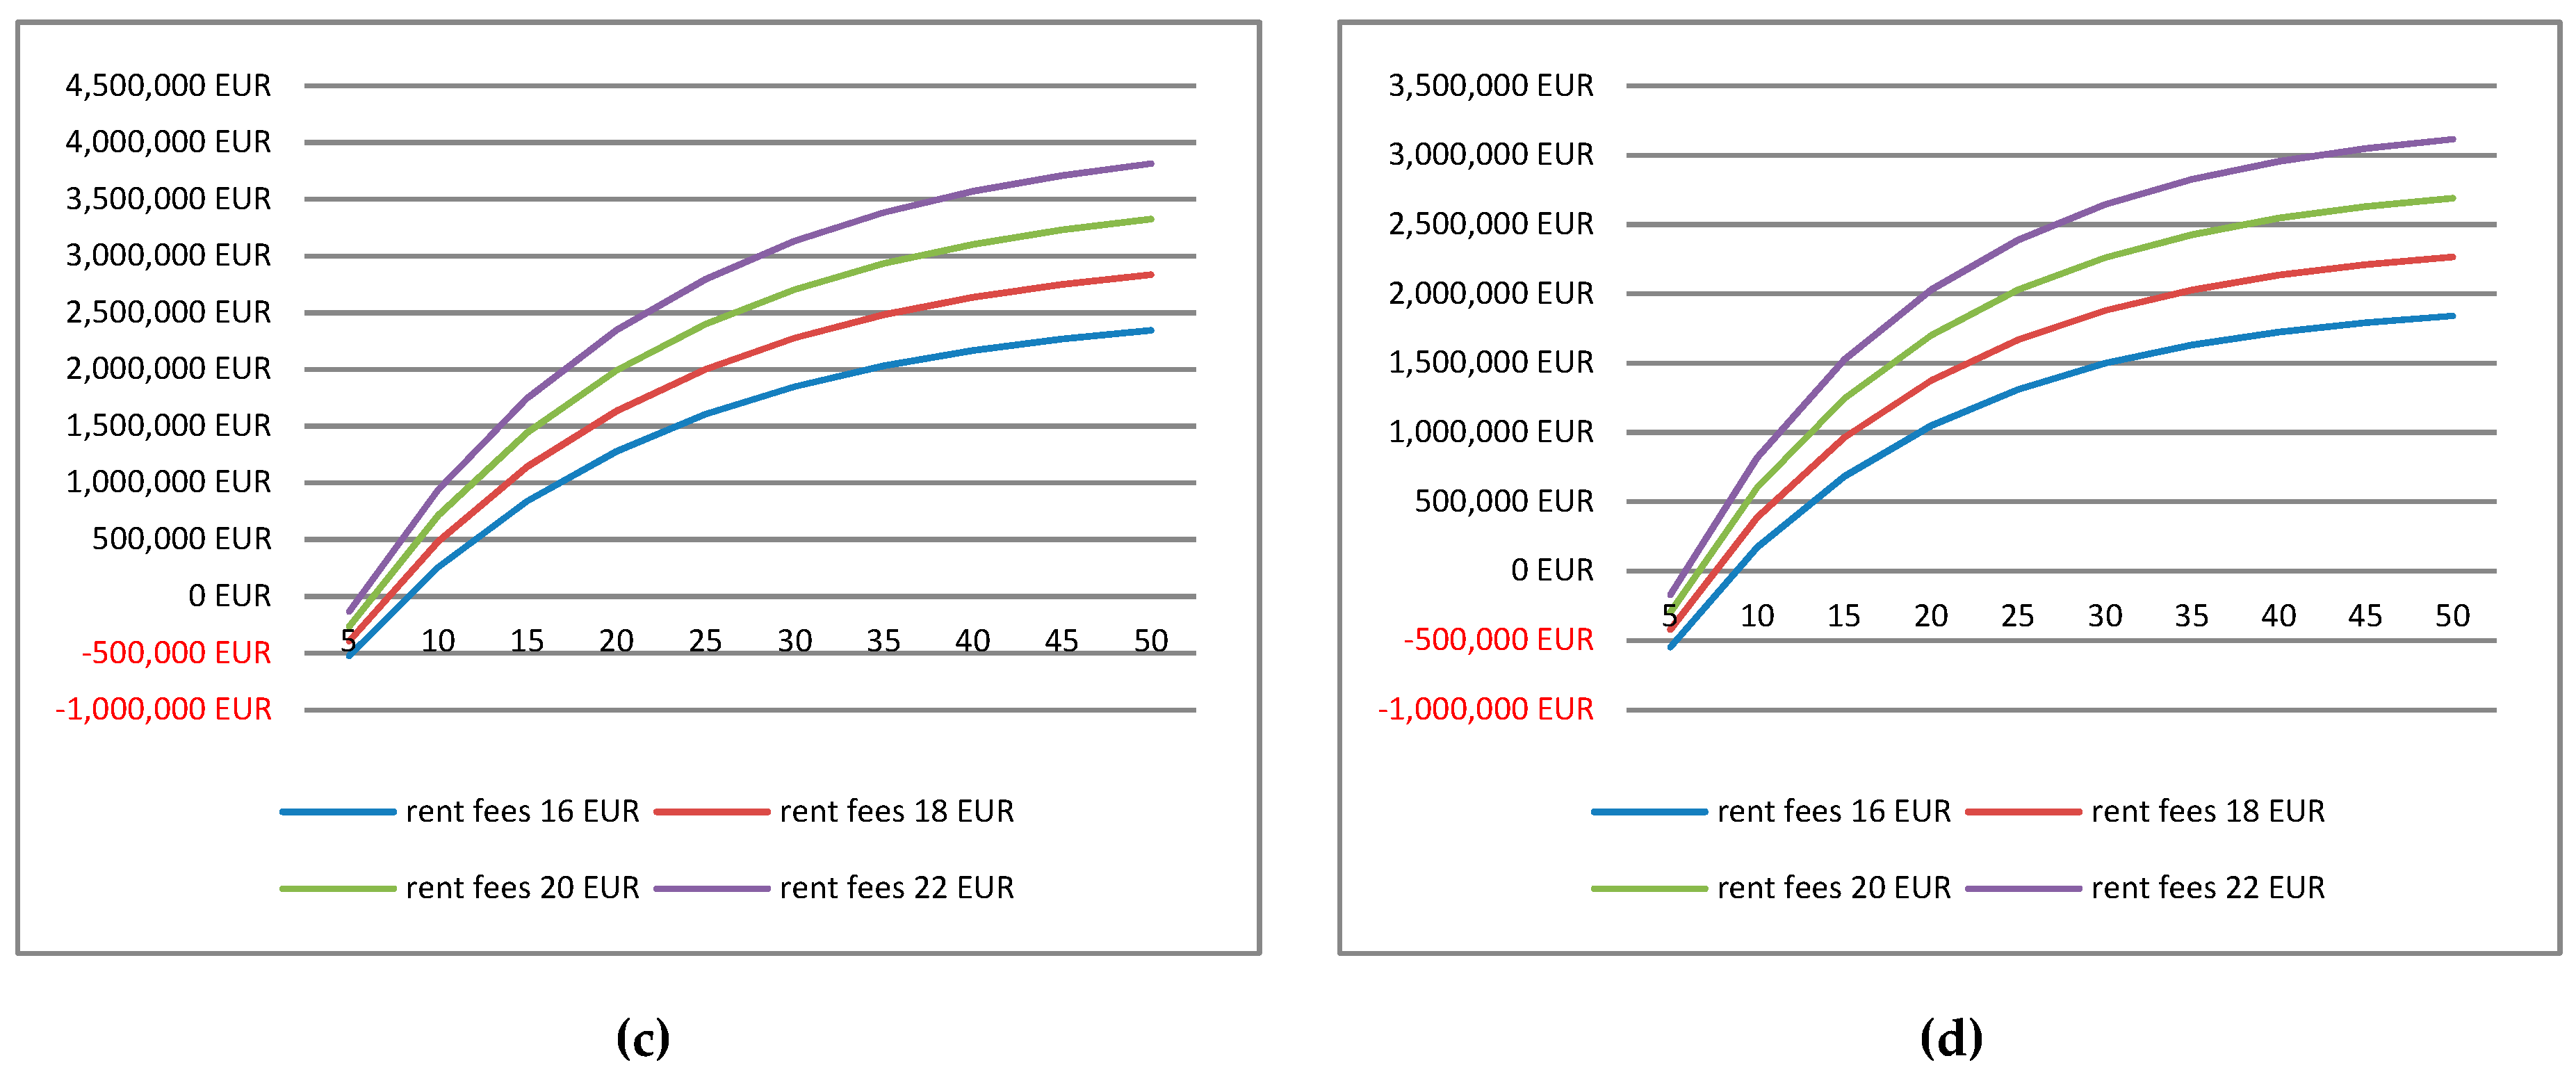
Further simulations concern the change of rent rates in the “green” building. The LCC was determined for rent fees 16; 18; 20; and 22 EUR, for r = 4–7% (Figure 11).
In the variant with a 4% rate of return, the LCC difference for extreme rent values after 50 years of use is 680,551 EUR, and in the variant with 7% it amounts to 424,947 EUR, that is about 60%. There is also a clear difference between the beginning of investment profitability for the different levels of rent. For the 7% interest rate, the profitability for the lowest and the highest rental rate is about 6–9 years, while for the 4% rate it is only 5–7 years.
7. Conclusions
From the point of view of sustainability of investment, the economic benefits it generates are as important as the consideration of the social aspect and respect for the natural environment during the construction and operation of the building. Therefore, one cannot talk about a truly balanced building if its functioning is not more economical, that is clearly cheaper than similar but conventional buildings.
In Anglo-Saxon countries, research has been performed for many years to determine the measurable benefits that green buildings bring. The issue of economic benefits is considered there widely, taking into account not only the lower costs of the building itself, but also lower sickness absences and the resulting greater profitability of companies, higher productivity of employees, and interestingly, but quite different from Polish realities, higher percentages of employees with higher qualifications working in sustainable buildings.
The most obvious issues are the lower costs of utilities: electricity, heat, gas, water, and sewage, related to the ongoing operation of the building. These savings can be calculated by comparing the actual building with the reference building, namely, a building of the same shape, size, and function, but with standard solutions in the field of energy and water management. Savings can reach the tens of percent. Thus, close attention should be to the standard of the reference building, because the reference level will be different for the reference building in the LEED certification system, and different in the BREEAM.
In recent years, Poland has seen a decisive upward trend not only in the number of buildings but also in their usable area. The majority of certified facilities in Poland are office buildings, in second place are retail buildings, in third place industrial buildings. Number of certified residential buildings, schools or hotels, when compared to the overall number of certified buildings, is insignificant for now. Despite the upward trend, the overall number of certified buildings in Poland is still very low. Future years will bring the answer to whether this trend will turn into a boom, similar to the one observed in the United States between 2000 and 2017.
The BREEM and LEED certification systems are the most popular in Poland, which should not be surprising because they have an established position. The vast majority of objects belong to these two systems. However, it should be noted that there appear individual objects certified in other systems.
In order to compare the costs and benefits of certified buildings, the costs of a non-certified and a certified office building were simulated. The comparison was made using the idea of costs in the life cycle and calculating the LCC, on the example of a 6-storey office building. The results revealed that strong dependence of investment profitability on the discount rate adopted. Assuming the 4% rate, the investment starts to be profitable after about seven years, while at the 9% rate after about 12 years. Further simulations concern the change of rent rates in the “green” building. The results may be availed by the potential owners or operators of office buildings in decision-making processes regarding the level of rents paid by the tenants.
The authors intend to continue research on the comparison between certified and non-certified buildings. Analyses of costs incurred for specific building solutions required to obtain different types of certificates and at various levels are planned. Thanks to this, it will be possible to confirm the thesis about the financial efficiency of the implementation of green buildings. This paper is mainly concerned with cost comparisons. The potential benefits of green buildings, other than financial ones, require further research (e.g., impact on environment and working conditions for employees in the office building).
Author Contributions
The individual contribution and responsibilities of the authors were as follows: E.P.: methodology, data curation, formal analysis; M.J.: conceptualization, resources, literature review, writing—original draft preparation, writing—review and editing; R.K.: formal analysis, investigation, writing – review and editing, visualization; literature review.
Funding
This research received no external funding.
Conflicts of Interest
The authors declare no conflict of interest.
References
- Graziano, S.; Masera, G.; Sesana, M.M. Italian local codes for energy efficiency of buildings: Theoretical definition and experimental application to a residential case study. Renew. Sustain. Energy Rev. 2015, 42, 1245–1259. [Google Scholar]
- An Energy-Saving Mortgage for Europe. Overview of the Polish Market. Available online: https://plgbc.org.pl/wp-content/uploads/2018/03/EeMAP_Energooszczedna-hipoteka-dla-Europy_PL.pdf (accessed on 10 February 2019).
- Chethana, I.M.S.; Vivian, W.Y.; Khoa, N. Cost premium and the life cycle cost of green building implementation in obtaining green star rating in Australia. In Proceedings of the Building for the Future a Global Dilemma: Pacific Association of Quantity Surveyors Congress 2016, Christchurch, New Zealand, 20–24 May 2014. [Google Scholar]
- Fan, K.; Chan, E.H.W.; Chau, C.K. Costs and Benefits of Implementing Green Building Economic Incentives: Case Study of a Gross Floor Area Concession Scheme in Hong Kong. Sustainability 2018, 10, 2814. [Google Scholar] [CrossRef]
- Ding, G. Sustainable construction—The role of the environmental assessment tools. J. Environ. Manag. 2008, 86, 451–464. [Google Scholar] [CrossRef] [PubMed]
- Wilkinson, S.J.; Reed, R.; Bilos, A.; Schulte, K.-W. APlease consider this suggested change to the title. Comparison of International Sustainable Building Tools—An Update. In Proceedings of the 17th Annual Pacific Rim Real Estate Society Conference, Gold Coast, Australia, 16–19 January 2011. [Google Scholar]
- Przesmycka, N. Systemy Certyfikacji Budownictwa Zrównoważonego—Breeam i CSH. Teka Komisji Architektury, Urbanistyki i Studiów Krajobrazowych 2011, 7, 108–116. (In Polish) [Google Scholar]
- Saleh, A.H.; Rezgui, Y.; Kwan, A. Developing Sustainable Building Assessment Scheme for Saudi Arabia: Delphi Consultation Approach. Renew. Sustain. Energy Rev. 2013, 27, 43–54. [Google Scholar]
- Seinre, E.; Kurnitski, J.; Voll, H. Building Sustainability Objective Assessment in Estonian Context and a Comparative Evaluation with LEED and BREEAM. Build. Environ. 2014, 82, 110–120. [Google Scholar] [CrossRef]
- Zuo, J.; Zhao, Z.Y. Green Building Research-Current Status and Future Agenda: A Review. Renew. Sustain. Energy Rev. 2014, 30, 271–281. [Google Scholar] [CrossRef]
- Toudert, A.F. Towards Urban Sustainability: Trends and Challenges of Building Environmental Assessment Methods. 2007. Available online: http://www.irbnet.de/daten/iconda/CIB11746.pdf (accessed on 10 February 2019).
- Hamedani, A.Z.; Huber, F. A comparative study of DGNB, LEED and BREEAM certificate system in urban sustainability. In Sustainable City VII; WIT Press: Southampton, UK, 2012. [Google Scholar]
- Kudryashova, A.; Genkov, A.; Mo, T. Certification Schemes for Sustainable Buildings: Assessment of BREEAM, LEED and LBC from a Strategic Sustainable Development Perspective. 2015. Available online: http://bth.diva-portal.org/smash/get/diva2:839762/FULLTEXT02.pdf (accessed on 10 February 2019).
- Nguyen, B.K.; Altan, H. Comparative Review of Five Sustainable Rating Systems. Procedia Eng. 2011, 21, 376–386. [Google Scholar] [CrossRef] [Green Version]
- Lee, W.L.; Burnett, J. Benchmarking Energy Use Assessment of HK-BEAM, BREEAM and LEED. Build. Environ. 2008, 43, 1882–1891. [Google Scholar] [CrossRef]
- Mattoni, B.; Guattari, C.; Evangelisti, L.; Bisegna, F.; Gori, P.; Asdrubali, F. Critical Review and Methodological Approach to Evaluate the Differences among International Green Building Rating Tools. Renew. Sustain. Energy Rev. 2018, 82, 950–960. [Google Scholar] [CrossRef]
- Asdrubali, F.; Baldinelli, G.; Bianchi, F.; Sambuco, S. A Comparison between Environmental Sustainability Rating Systems LEED and ITACA for Residential Buildings. Build. Environ. 2015, 86, 98–108. [Google Scholar] [CrossRef]
- Aotake, N.; Ofuji, N.; Miura, M.; Shimada, N.; Niwa, H. Comparison among Results of Various Comprehensive Assessment Systems—A Case Study for a Model Building Using CASBEE, BREEAM and LEED. In Proceedings of the Sustainable Building Conference (SB05), Tokyo, Japan, 27–29 September 2005; pp. 1734–1737. [Google Scholar]
- Elnokaly, A.; Vyas, M. A Cross Case Investigation of Sustainability Assessment Tools of the LEED, BREEAM and GRIHA. In Proceedings of the Transitions to Sustainable Societies: Designing Research and Policies for Changing Lifestyles and Communities (IAPS 23 Conference), Timisoara, Romania, 24–27 June 2014. [Google Scholar]
- Yilmaz, M.; Okulu, K.H.; Okulu, K.H.; Kivrak, S. Neighborhood Sustainability Assessment Tools and a Comparative Analysis of Five Different Assessment Tools. Planlama 2016, 26, 96–100. [Google Scholar]
- Ayyoob, S.; Murayama, A. A critical review of seven selected neighborhood sustainability assessment tools. Environ. Impact Assess. Rev. 2013, 38, 73–87. [Google Scholar]
- Yigitcanlar, T.; Teriman, S. Neighborhood Sustainability Assessment: Evaluating Residential Development Sustainability in a Developing Country Context. Sustainability 2015, 7, 2570–2602. [Google Scholar] [CrossRef] [Green Version]
- Doan, D.T.; Ghaffarianhoseini, A.; Naismith, N.; Zhang, T.; Ghaffarianhoseini, A.; Tookey, J. A Critical Comparison of Green Building Rating Systems. Build. Environ. 2017, 123, 243–260. [Google Scholar] [CrossRef]
- Awadh, O. Sustainability and Green Building Rating Systems: LEED, BREEAM, GSAS and Estidama Critical Analysis. J. Build. Eng. 2017, 11, 25–29. [Google Scholar] [CrossRef]
- Suzer, O. A Comparative Review of Environmental Concern Prioritization: LEED vs Other Major Certification Systems. J. Environ. Manag. 2015, 154, 266–283. [Google Scholar] [CrossRef]
- Roderick, Y.; Mcewan, D.; Alonso, C. Comparison of Energy Performance Assessment between LEED, Breeam and Green Star. In Proceedings of the Building Simulation: Eleventh International IBPSA Conference, Glasgow, UK, 27–30 July 2009; pp. 1167–1176. [Google Scholar]
- Poston, A.; Rohinton, E.; Thomson, C. Developing Holistic Frameworks for the Next Generation of Sustainability Assessment Methods for the Built Environment. In Proceedings of the 26th Annual ARCOM Conference, Leeds, UK, 6–8 September 2010; Egbu, C., Ed.; Association of Researchers in Construction Management: Leeds, UK, 2010; pp. 1487–1496. [Google Scholar]
- Schwartz, Y.; Raslan, R. Variations in Results of Building Energy Simulation Tools, and Their Impact on BREEAM and LEED Ratings: A Case Study. Energy Build. 2013, 62, 350–359. [Google Scholar] [CrossRef]
- Wong, K.; Fan, Q. Building Information Modelling (BIM) for Sustainable Building Design. Facilities 2013, 31, 138–157. [Google Scholar] [CrossRef]
- Wong, J.; Zhou, J. Enhancing Environmental Sustainability over Building Life Cycles through Green BIM: A Review. Autom. Constr. 2015, 57, 156–165. [Google Scholar] [CrossRef]
- Illankoon, I.M.; Tam, V.W.Y.; Le, K.N.; Shen, L. Key Credit Criteria among International Green Building Rating Tools. J. Clean. Prod. 2017, 164, 209–220. [Google Scholar] [CrossRef]
- Welch, A.; Benfield, K.; Raimi, M. A Citizen’s Guide to LEED for Neighborhood Development: How to Tell if Development Is Smart and Green; U.S. Green Building Council: New York, NY, USA, 2012; Available online: http://www.nrdc.org/cities/smartgrowth/files/citizens_guide_LEED-ND.pdf (accessed on 15 June 2015).
- Available online: http://www.ecosquad.pl/certyfikacja-wielokryterialna-leed--w-pigu-ce.-.html (accessed on 24 April 2017).
- Available online: https://plgbc.org.pl/certyfikacja-wielokryterialna/leed/ (accessed on 24 April 2017).
- Available online: https://plgbc.org.pl/certyfikacja-wielokryterialna/breeam/ (accessed on 24 April 2017).
- Available online: https://plgbc.org.pl/nowy-raport-plgbc-2018-certyfikacja-zielonych-budynkow-w-liczbach (accessed on 10 February 2019).
- Available online: http://plgbc.nazwa.pl/plgbc_new/wp-content/uploads/2015/04/Analiza_rynku_zrownowazonego_budownictwa_w_Polsce.pdf (accessed on 10 February 2019).
- Firląg, S. Sustainable Office Buildings; PWN: Warszawa, Poland, 2018. (In Polish) [Google Scholar]
- ISO 15686-5:2008. Buildings and Constructed Assets—Service Life Planning—Part 5: Life Cycle Costing; International Organization for Standardization: Geneva, Switzerland, 2008. [Google Scholar]
- Available online: https://leedonline.wordpress.com/2012/07/02/koszt-certyfikacji-i-wdrozenia-leed-nd/ (accessed on 5 June 2017).
- Available online: http://analyticsstore.construction.com/smartmarketreports/2016WorldGreen.html? sourcekey=PRESREL (accessed on 12 April 2017).
- Available online: https://www.usgbc.org/articles/world-green-building-trends-2018-business-benefits (accessed on 10 February 2019).
- Goh, B.H.; Sun, Y. The development of life-cycle costing for buildings. Build. Res. Inf. 2016, 44, 319–333. [Google Scholar] [CrossRef]
Figure 1.
The number of certificates granted in Poland. Authors’ own elaboration based on the Polish Green Building Council (PLGBC) data [36].
Figure 1.
The number of certificates granted in Poland. Authors’ own elaboration based on the Polish Green Building Council (PLGBC) data [36].

Figure 2.
(a) The number of certified buildings in Poland in various systems from March 2016–March 2018. (b) The entire number of certified buildings in Poland, as of March 2015–March 2018. Authors’ own elaboration based on PLGBC data [36].
Figure 2.
(a) The number of certified buildings in Poland in various systems from March 2016–March 2018. (b) The entire number of certified buildings in Poland, as of March 2015–March 2018. Authors’ own elaboration based on PLGBC data [36].

Figure 3.
New certified buildings in various systems. Own elaboration based on PLGBC data [36].
Figure 3.
New certified buildings in various systems. Own elaboration based on PLGBC data [36].

Figure 4.
Existing buildings in various systems. Authors’ own elaboration based on PLGBC data [36].
Figure 4.
Existing buildings in various systems. Authors’ own elaboration based on PLGBC data [36].

Figure 5.
Usable area in m2 of new certified buildings in various systems. Authors’ own elaboration based on PLGBC data [36].
Figure 5.
Usable area in m2 of new certified buildings in various systems. Authors’ own elaboration based on PLGBC data [36].

Figure 6.
Usable area in m2 of existing certified buildings in various systems. Authors’ own elaboration based on PLGBC data [36].
Figure 6.
Usable area in m2 of existing certified buildings in various systems. Authors’ own elaboration based on PLGBC data [36].

Figure 7.
The share of the usable floor area of certified buildings by sector in 2017 and 2018. Authors’ own elaboration based on PLGBC data [36].
Figure 7.
The share of the usable floor area of certified buildings by sector in 2017 and 2018. Authors’ own elaboration based on PLGBC data [36].

Figure 8.
Sector division of certified buildings 2018. Authors’ own elaboration based on PLGBC data [36].
Figure 8.
Sector division of certified buildings 2018. Authors’ own elaboration based on PLGBC data [36].

Figure 9.
Annual increase in the number of certified buildings by sector. Authors’ own elaboration based on PLGBC data [36].
Figure 9.
Annual increase in the number of certified buildings by sector. Authors’ own elaboration based on PLGBC data [36].

Figure 10.
LCC for green and base buildings for the interest rates of: (a) 4%; (b) 5%; (c) 6%; (d) 7%; (e) 8%; (f) 9%.
Figure 10.
LCC for green and base buildings for the interest rates of: (a) 4%; (b) 5%; (c) 6%; (d) 7%; (e) 8%; (f) 9%.


Figure 11.
The LCC for green buildings with different rent fee for the interest rate of: (a) 4%; (b) 5%; (c) 6%; (d) 7%.
Figure 11.
The LCC for green buildings with different rent fee for the interest rate of: (a) 4%; (b) 5%; (c) 6%; (d) 7%.


Table 1.
Cost related to the renting of office surfaces.
| Type of Costs | Average Value (PLN*/m2)/(month) |
|---|---|
| Utility consumption costs | 7.72 |
| Property tax | 2.66 |
| Service and maintenance costs | 2.0 |
| Protection | 2.55 |
| Property management | 1.17 |
| Cleaning of common areas | 1.02 |
| Taxes and perpetual usufruct | 1.07 |
| Insurance | 0.26 |
| Other | 1.85 |
| Total | 21.10 |
* PLN—Polish currency.
Table 2.
The costs of obtaining the Leadership in Energy and Environmental Design (LEED) certificate.
Table 2.
The costs of obtaining the Leadership in Energy and Environmental Design (LEED) certificate.
| Type of Costs | Value |
|---|---|
| Registration | 1500 USD (1282 EUR) |
| Verification of the fulfilment of basic Smart Location and Linkage (SLL) requirements | 2250 USD (1924 EUR) |
| Certification fee | 18,000 USD (15,389 EUR) for the first 20 acres; 350 USD (299 EUR) for another acre; 123,000 USD (105,159 EUR) for projects over 320 acres |
| In the case of multi-stage certification for each subsequent stage (optional) | 10,000 USD (8550 EUR) for the first 20 acres; 350 USD (299 EUR) for another acre; 115 000 USD (98,320 EUR) for projects over 320 acres |
Table 3.
Additional certification costs resulting from the process characteristics.
| Type of Costs | Value |
|---|---|
| Explanations of the certification body regarding general interpretations of individual LEED requirements and rules | 220 USD (188 EUR) for the issue |
| Verification by the certification body of the fulfilment of a specific requirement regardless of the certification process | 500 USD (428 EUR) for the issue |
| Verification of the selected criteria after granting the certificate in the appeal process | 500/1000/2000 USD (428/855/1710 EUR) |
Table 4.
The value of design services.
| Design Services | Average | Scope |
|---|---|---|
| Consulting | 0.5% | 0.4–0.6% |
| Project documentation | 1.0% | 0.5–1.5% |
| LEED documentary preparation | 0.7% | 0.5–0.9% |
| Energy analysis | 0.1% | 0.1% |
| 2.3% | 1.5–3.1% |
Table 5.
Implementation costs in a certified building depending on the level of the certificate obtained.
Table 5.
Implementation costs in a certified building depending on the level of the certificate obtained.
| The Level of the Certificate | Implementation Costs |
|---|---|
| LEED Certified | 0–2.5% |
| LEED Silver | 0–3.3% |
| LEED Gold | 0.3–5.0% |
| LEED Platinum | 4.5–8.5% |
Table 6.
Comparison of costs between a certified and non-certified building.
| Source of Cost | Cost of Certified Building in Comparison to Non-Certified Building |
|---|---|
| Design documents | Higher by 1.5–3.1% |
| Certification | For the floor area 10,000 m2 5.5–10.5 thousand EUR |
| Construction | Higher by 0.0–10.0% |
| Operation and maintenance | Lower by 8.0–20.0% |
| Rents | Higher (on average) by 3.0% |
Table 7.
Data for determining Life Cycle Cost.
| Investment Expenditures | Base Building | Green Building |
|---|---|---|
| Purchase of an improved investment plot | 372 m2 – building area – 39.53 EUR/m2 500 m2 = 19,765 EUR | 19,765 EUR |
| Design fees and other | 5.9% 1,419,413 EUR = 83,745 EUR | Additional 2%, i.e., 7.9% 1,419,413 EUR + 3000 EUR (cost of certificate) = 115,134 EUR |
| Building cost | 1,419,413 EUR | 8% higher 1,419,413 EUR 1.08 = 1,532,966 EUR |
| Operating costs (annually) | 4.70 EUR – 1716 m2 12 months = 8065.20 EUR | 8% lower 8065.20 EUR – 645.22 EUR = 7419.98 EUR |
| Profits (rent) (annually) | 0.7 – 1716 m2 – 15 EUR 12 months =216,216 EUR | 0.8 – 1716 m2 – 16 EUR 12 months = 263,578 EUR |
© 2019 by the authors. Licensee MDPI, Basel, Switzerland. This article is an open access article distributed under the terms and conditions of the Creative Commons Attribution (CC BY) license (http://creativecommons.org/licenses/by/4.0/).
Share and Cite
MDPI and ACS Style
Plebankiewicz, E.; Juszczyk, M.; Kozik, R. Trends, Costs, and Benefits of Green Certification of Office Buildings: A Polish Perspective. Sustainability 2019, 11, 2359. https://doi.org/10.3390/su11082359
AMA Style
Plebankiewicz E, Juszczyk M, Kozik R. Trends, Costs, and Benefits of Green Certification of Office Buildings: A Polish Perspective. Sustainability. 2019; 11(8):2359. https://doi.org/10.3390/su11082359
Chicago/Turabian StylePlebankiewicz, Edyta, Michał Juszczyk, and Renata Kozik. 2019. "Trends, Costs, and Benefits of Green Certification of Office Buildings: A Polish Perspective" Sustainability 11, no. 8: 2359. https://doi.org/10.3390/su11082359
Note that from the first issue of 2016, this journal uses article numbers instead of page numbers. See further details here.