To Be or Not to Be? Big Data Business Investment Decision-Making in the Supply Chain

School of Management, Tianjin University of Technology, Tianjin 300384, China
*
Author to whom correspondence should be addressed.
Sustainability 2019, 11(8), 2298; https://doi.org/10.3390/su11082298
Submission received: 12 March 2019
/
Revised: 6 April 2019
/
Accepted: 10 April 2019
/
Published: 17 April 2019
(This article belongs to the Special Issue How Better Decision-Making Helps to Improve Sustainability - Part II)
Abstract
:The development of Big Data technology initiates an emerging research question of whether and how to invest in Big Data business for supply chain members to establish sustainable competitive edge. The aim of our study was to assess investment in Big Data business and its sustainable effects on supply chain coordination. We considered a two-stage supply chain with one supplier and one retailer who may or may not invest in Big Data business. Five decision-making modes were proposed based on the investment portfolios. The impacts of Big Data business on the profit of the supply chain and its members were analyzed and it was confirmed that a coordination scheme could achieve supply chain coordination. The results indicated that when the Big Data cost met a certain threshold, the profit of the supply chain and its members would increase whether supply chain members choose to invest in Big Data business individually or jointly. A reasonable cost allocation of Big Data business between supply chain members was provided when both members invest in Big Data. In addition, after the members invested jointly, a revenue-sharing contract could be applied to perfectly coordinate the supply chain.
1. Introduction
In the era of Big Data, collected data has an increasingly indispensable role in many industries and businesses [1]. Therefore, they have more incentives to invest in collecting large amounts of data and extracting valuable information from them to gain various advantages [2]. Ford invested to operate a lab in Silicon Valley in 2013 to collect and analyze Big Data generated by 4 million cars to improve car performances (https://datafloq.com/read/ford-drives-direction-big-data/434), and HP made a plan in 2013 to invest $1 Billion on R&D and marketing for its Big Data software portfolio (https://www.crn.com/news/applications-os/240150181/hp-exec-were-investing-1-billion-in-big-data-this-year.htm). Not only in US, in China, leading companies in various industries such as Alibaba and Unicom also have regarded Big Data investment as critical part of investment strategy and made prominent progress (https://www.chinatechnews.com/2017/05/29/25081-big-data-is-part-of-china-unicoms-new-investment-strategy and http://www.timesofisrael.com/chinese-giant-alibaba-leads-investment-round-in-israel-big-data-startup/). In fact, according to IDC (International Data Corporation) estimates, the market for Big Data investments is set to grow from $16.55 billion in 2014 to about $41.52 billion in 2018, a compound annual growth rate of 26.24% (https://dailyreckoning.com/big-data-investments-opportunities-behind-buzz/).
From the perspective of supply chain and operations management, Big Data changes the way supply chains are designed and managed [3]. Enterprises in the supply chain can utilize Big Data to control inventories and optimize and improve production processes, which can help them reduce internal costs related to production, sales, and inventories [4]. Among the top three enterprises in an industry, those that practice data-driven decision-making are found to be more productive than their low-performing competitors [5]. Big Data technology also changes the business and profit models of enterprises so they can gain competitive advantage through differentiation, which also helps achieve rapid performance growth.
From the marketing perspective, Big Data can be applied to market segmentation, target market selection, and market positioning [6]. Assunção et al. [7] propose that Big Data analysis is the key to enterprises gaining competitive advantage by helping them understand consumer behavior, segment customer groups, provide customized services, and gain more potential customers. The experimental study of Sundsøy et al. [8] confirms that in mobile network marketing, operators use Big Data-driven methods to segment customers and achieve accurate marketing, which improves the conversion rates of potential customers. Enterprises can therefore identify these consumers and then increase consumer conversion rates through Big Data marketing, which in turn increases product sales. Although Big Data brings many advantages, enterprises can incur huge costs through building infrastructure and management, which, due to budget shortages limits, many enterprises. They can, however, choose to outsource their Big Data business to professional service providers, who use technology to provide valuable information. In this study, the investment of Big Data business is taken as a decision-making variable to investigate how the change between the cost of investment in the Big Data business and the profit after investing can be balanced.
The remainder of this paper is organized as follows. Section 2 provides a review of the relevant literature. In Section 3, the problem and the parameter setting are described, and the analytical model is formulated. An analysis of the supply chain profit model and investment decision-making in the four modes is given in Section 4. Section 5 provides a discussion of the condition, in which a revenue-sharing contract coordinates the supply chain when both supply chain members invest in Big Data business. Section 6 includes a numerical study to verify the results, and Section 7 concludes this study.
2. Literature Review
This paper focuses on supply chain coordination and the investment decision-making of Big Data businesses. In terms of the research into supply chain coordination, many studies have confirmed that supply chain coordination contracts can eliminate the double marginalization effect and can coordinate the supply chain. Several supply chain coordination contracts are widely used, such as buy-back contracts [9,10,11], revenue-sharing contracts [12,13], quantity discount contracts [14,15], and sales rebate contracts [16,17]. Of these, the revenue-sharing contract is effective and has been extensively studied. Cachon and Lariviere [12] confirm that by using a revenue-sharing contract, a two-stage supply chain can effectively coordinate the profit between supply chain members. Liu and Yi [18] study a case in which the supply chain members both invest in Big Data business, and use the revenue-sharing contract to coordinate the supply chain.
Second, most studies into the investment decision-making for Big Data business are qualitative or empirical, while some research uses analytical models to study Big Data investment decisions in the context of the supply chain. Liu and Yi [19] consider enterprises that invest in Big Data business in the supply chain, assuming that Big Data can help enterprises reduce their internal operations costs. They study the impact of Big Data business on the profit of the supply chain and its members in terms of decentralized and centralized decision-making supply chain separately and derive the cost threshold of Big Data business within the chain. They also demonstrate that supply chain members can achieve coordination effectively by a single quantity discount contract. This study extends the research and examines the impact of supply chain members investing alone or together in Big Data business on the profit of the supply chain and its members in a decentralized supply chain, and finds that the supply chain can use the revenue-sharing contract to perfectly coordinate the supply chain [18].
However, the above studies only consider that supply chain members can reduce the internal costs by investing in Big Data business without considering how enterprises can use Big Data analysis to achieve accurate marketing and, thus, potentially gain consumers and increase the potential market demand. To address this, both the internal costs reduction effect and potential market demand-increasing effect of Big Data business investment is considered and supply chain coordination under various investment modes is examined.
Our research problem also belongs to the research area of information technology investment in supply chain management. Information technology investment has a huge impact on supply chain management and operations management [20,21,22,23]. Tiwari et al. [24] investigate the research and application of big data analytics in supply chain management from 2010 to 2016, and point out that big data analytics is one of the best technologies to solve supply chain management problems. Bi and Cochran [25] point out that big data analysis (BDA) has been identified as a key technology for data collection, storage, and analysis in modern manufacturing data management systems. Wang and Alexander [26] demonstrate that big data can help realize the visualization of the entire supply chain, improve the operation efficiency of enterprises, and provide real-time insight to help enterprises make key decisions. Further, Arunachalam et al. [27] point out that many organizations have successfully used the ability of big data analysis (BDA) to improve their performance. Chen et al. [28] study the impact of big data analysis on value creation by enterprises in supply chain management and the key preconditions for the use of big data analysis. Similar, Cheng et al. [29] identify conditions for manufacturers and retailers to make better use of big data technology. Govindan et al. [30] explore big data analysis and its application in logistics and supply chain management by studying new methods, practices, and opportunities. They propose and analyze various opportunities to improve the big data analysis and application of logistics and supply chain management by exploring technology-driven tracking strategy, financial performance relationship with data-driven supply chain, implementation issues related to big data, and supply chain capability maturity.
Information technology investment can help enterprises in the supply chain to make more accurate decisions [23,31]. Choi et al. [23] investigate the real-world applications of big data analytics in top branded enterprises via case studies. Raman et al. [32] point out that adopting big data technology can create considerable value-added and monetary benefits for enterprises, and will soon become the standard for the whole industry. Zhao et al. [33] integrate data acquisition and data quality control of big data science in a multi-objective mathematical model for green supply chain management. Wu et al. [34] combine social media data with the firm’s financial and operational data. Moreover, the application of expert judgment has helped the LED industry to develop sustainability and strengthen their capabilities to mitigate risks and uncertainties. Chen et al. [35] take the secondary supply chain, composed of a single supplier and a single retailer, as the research object, in which the supplier is risk neutral and the retailer is risk averse. The research results show that enterprises in the supply chain can completely eliminate the mislaid problem of retailers by investing in RFID (Radio Frequency Identification) technology. Cheng et al. [29] use a Bayesian information updating approach to establish an analysis model to study the sustainable investment in a supply chain composed of a manufacturer and a retailer. The optimal sustainable investment level of the manufacturer and the optimal order quantity of the retailer are obtained. Comparing the results with and without big data technology, they find that when retailers adopt big data technology, whether manufacturers should make more sustainable investment depends on the service level of retailers. Interestingly, big data adoption by retailers is not always the best option. Probing the big data business analysis in the application of supply chain strategy and operations, Wang [36] suggests that big data business analysis can help enterprises to measure performance of the logistics and supply chain management part, help enterprise in the supply chain to implementation better business decisions, and by improving business processes for supply chain enterprise to bring huge benefits. Li et al. [37] show that, compared to the traditional supply chain management method, the performance of demand chain is much better when combined with the advantages of e-commerce and big data. Based on the resource-based view, Gunasekaran et al. [38] study the impact of big data and predictive analysis on supply chain performance and organizational performance, and the results show that the assimilation of big data and predictive analysis is positively correlated with supply chain performance and organizational performance, while Arunachalam et al. [27] also reached a similar conclusion. Ma et al. [39] consider the design of service systems, and they use M/G/1 queuing model to analyze how the uncertainty of demand information effects the capacity of a service system. A paper similar to ours is that of Liu and Yi [18], who study showed that, after the members of the supply chain jointly invest in the big data business, the revenue-sharing contract is used to coordinate the supply chain, so that the profit of the decentralized decision-making supply chain can reach the profit level of the centralized decision-making supply chain. In our work, we take the investment of enterprises in big data business in the supply chain as the research object and discuss how to use revenue-sharing contract to coordinate the profit of supply chain members after the joint investment of enterprises in big data business in the supply chain.
Our work is also relevant to the stream of literature studying digital twin technology. Digital twin technology refers to a digital replica of a living or non-living physical entity, which requires Big Data collection, storage, and processing as basic support. Recently, it has begun to attract increasing attention within the field of manufacturing systems [40]. For example, Singh et al. [41] study the challenges of applying digital twin technology in high-value manufacturing. Tao et al. [42] explore how digital twin technology affects product/service design. Only a few studies are concerned with the effects of digital twin technology in operations management and supply chain management. Ivanov et al. [43] examine the fundamental definitions of digital supply chains and operations and present digital technology classifications of SCOM in terms of the SCOR model. They also discuss decision-making support improvements in the digital SCOM framework from qualitative and quantitative perspectives. Bijlsma and Merkestejin [44] use digital twin technology to optimize warehouse layout analysis, supply chain design, as well as future scenario prediction. In contrast, we focus on the conditions under which investing Big Data business as the base of digital twin can be a feasible strategy for supply chain members and supply chain coordination achievement mechanism design under this circumstance.
A two-stage supply chain model including one manufacturer and one retailer is built. Here, the supplier is the leader of the Stackelberg game, and the retailer is the follower, considering that the supply chain members can reduce their internal costs and potentially gain customers to increase the market demand by investing in Big Data business. The impact of Big Data business on the profit of the supply chain and its members is discussed, when the supply chain members invest in the Big Data business individually or jointly in a decentralized decision-making supply chain. Thus, we can derive the cost threshold of the Big Data business, which can increase the profit of the supply chain and its members. The largest unit cost of Big Data business that the supply chain members are willing to undertake is derived. By using the revenue-sharing contract, the profit of the supply chain can be perfectly coordinated, so the profit of the decentralized decision-making supply chain can reach the level of the centralized decision-making supply chain, and the profit of the supply chain members can achieve Pareto improvement.
3. Problem Description and Model Setting
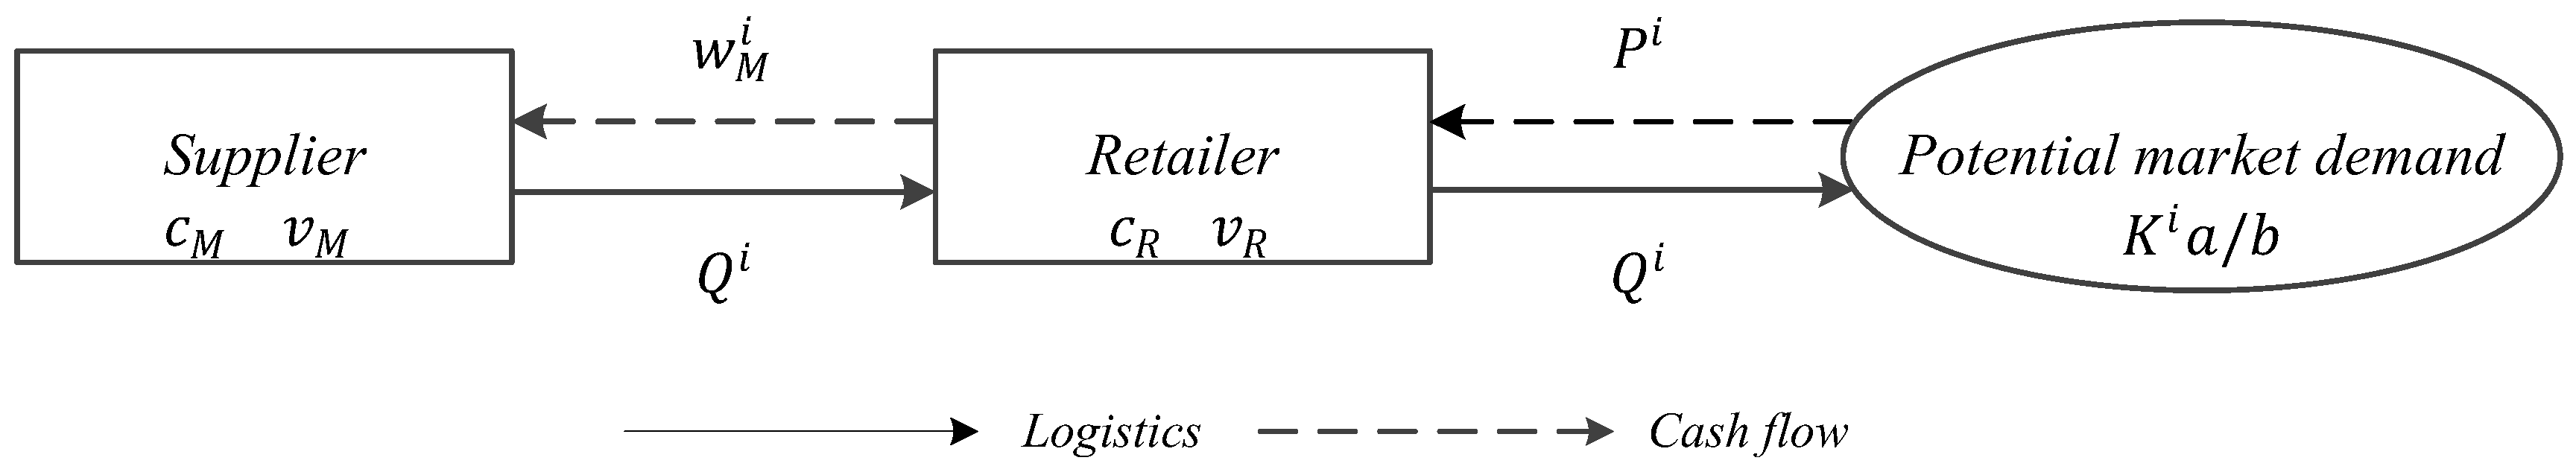
Consider a two-stage supply chain consisting of a supplier and a retailer , as shown in Figure 1. The supplier, as the Stackelberg leader, produces and sells products to the downstream retailer. The marginal unit production cost and wholesale price are , and , respectively. The retailer, as the follower, determines the ordering quantity based on the supplier’s wholesale price and its own forecast on market demand with unit cost of sales . The unit holding cost of the supplier and retailer are and , respectively, and . It is assumed that the supplier and the retailer are risk-neutral. The supplier has sufficient production capacity to meet the retailer’s ordering quantity, and the retailer only has one opportunity to order before the beginning of the selling season.
A price-dependent market demand function is considered, and the inverse demand function is , where and are both constant, and . When , the potential market demand is . We assume that the potential market demand will increase when the supplier or the retailer chooses to invest in Big Data business, which means that will increase, where , which represents the five investment modes of Big Data business. represents the mode that neither of the supply chain members invests in Big Data business, R (S) is the mode in which only the retailer (supplier) invests in Big Data business, and J (JR) represents both supply chain members investing in Big Data business without (with) a revenue-sharing contract. For this investment, the supply chain members can choose to outsource to service providers, who use Big Data technology to provide valuable information and charge service fees . According to the analysis, the supply chain members can obtain two types of profit by investing in Big Data business: First by gaining potential customers and increasing potential market demand to boost product sales. For example, when only the retailer invests in Big Data business, the potential market demand will be improved from to , where . In addition, it is assumed that the potential market demand across all modes satisfies Second, by reducing internal costs with the cost-reducing coefficient . When only the supplier invests in Big Data business, the marginal cost to make a product will be reduced from to . It is also assumed that holds for both members in all of the four modes of R, S, J and JR.
4. Big Data Investment Decision-Making Modes
The N mode is the benchmark mode, in which the retailer and the supplier make decisions to maximize their own profits. The profit functions of the retailer and the supplier are as follows:
In the R mode, only the retailer chooses to invest in Big Data business, and can reduce its own internal costs, including those of sales and inventory, while attracting potential customers to increase the potential market demand by investing in Big Data business. Therefore, the profit functions of the retailer and the supplier are
In the S mode, only the supplier chooses to invest in Big Data business, and it can reduce its own internal costs, including the marginal production cost and the inventory cost, and also indirectly help the retailer potentially gain customers to increase the potential market demand by this investment. Thus, we have,
In the J mode, the supply chain members choose to jointly invest in Big Data business. The costs that are undertaken by the retailer and the supplier are and , respectively, where . Likewise, both the supplier and the retailer can reduce their own internal costs, and the retailer can tap potential customers to increase potential market demand. Thus, we have
Using backward induction, the supplier’s optimal wholesale price, the retailer’s optimal ordering quantity, and the optimal retail price can be obtained as in Table 1.
Based on the results in Table 1, we now discuss the conditions under which the retailer and the supplier either alone or jointly invest in Big Data business.
Theorem 1.
In the R, S, and J modes, the conditions under which the retailer and the supplier invests in Big Data business alone or jointly are,, and, respectively.
Proof.
The supply chain members make decisions to maximize their own profits in the R, S, and J modes, respectively. To avoid supply chain disruption, the retailer’s ordering quantity and the profits of the supply chain members in the R, S, and J modes must meet , , , where . Thus, in the R, S, and J modes, we have:
In the R mode, .
In the S mode, .
In the J mode, . □
When the costs that the retailer and the supplier invest in Big Data business alone or jointly satisfy the above conditions, the retailer and the supplier can consider investing in Big Data business alone or jointly, because both supply chain members’ profits are positive. The members have made their own optimal decisions, and the supply chain can also operate normally, otherwise the retailer and the supplier cease investing because the cost of Big Data business is too high.
Corollary 1.
In the R mode, if, compared with the profits in the N mode, the retailer’s profit, the supplier’s profit, and the total profit of the supply chain increases, i.e.,,,, otherwise,,,.
Proof.
To study the impact on the retailer, the supplier, and the supply chain of the retailer’s investment in the Big Data business, we must compare their profits before and after the retailer chooses to invest in Big Data business alone, when , , and , so we find that . □
In the R mode, when the cost of the retailer’s investment in the Big Data business satisfies , then the retailer’s profit increases. This investment creates positive external effects, which increases the supplier’s and the supply chain’s profits, so the retailer is more likely to invest in Big Data business alone. Otherwise, the profit of the retailer, the supplier, and the supply chain decrease, and thus the retailer does not choose to invest in Big Data business alone. In addition, in the R mode, the maximum unit cost of the Big Data business that the retailer is willing to undertake is thus .
Corollary 2.
In the S mode, if, compared with the profits in the N mode, the supplier’s profit, the retailer’s profit, and the total profit of the supply chain increases, i.e.,,,; otherwise,,,.
Proof.
To examine the impact of the supplier’s investment in Big Data business on the supplier, the retailer, and the supply chain, compared with the N mode, the retailer’s, the supplier’s, and the supply chain’s profits before and after the supplier chooses to invest in Big Data business alone, when , , , we have . □
In the S mode, when the cost of the supplier’s investment in Big Data business satisfies , then the supplier’s profit increases, and the resulting investment creates positive external effects, which increases the profit of the retailer and the supply chain. Otherwise, the profit of the supplier, the retailer, and the supply chain decreases, and the supplier does not choose not to invest in Big Data business alone. In the S mode, the maximum unit cost of the Big Data business that the supplier is willing to undertake is .
Corollary 3.
In the J mode, if, compared with the profits in the N mode, the retailer’s profits, the supplier’s profits, and the total profit of the supply chain increase, i.e.,,,; otherwise,,,.
Proof.
To examine the impact of the supply chain members’ joint investment in the Big Data business on the supplier, the retailer, and the supply chain, we also need to compare the retailer’s, the supplier’s, and the supply chain’s profits in the J mode with those in the N mode, and when , , , we obtain . □
In the J mode, when the cost of the supply chain members’ investment in the Big Data business satisfies , the retailer’s and the supplier’s profit increase, and then obviously the supply chain’s profit would increase, which means both members can benefit from joint investment in the Big Data business; otherwise, the profit of the retailer, the supplier, and the supply chain decrease; thus, the supply chain member does not choose to invest jointly in Big Data business. In addition, in the J mode, the maximum unit cost of the Big Data business that the supply chain members are willing to share is .
Corollary 4.
In the R, S, and J modes, the maximum unit costs of the Big Data business (i.e.,,,) that the supply chain members are willing to undertake have a positive relationship with the potential market demand coefficients (i.e.,,,), and will have a negative relationship with the cost-reducing coefficient (i.e.,). In addition, the largest unit cost of the Big Data business isin the J mode.
Proof.
The unit cost of the Big Data business can be seen as increasing internal cost. By analyzing the maximum unit cost of the Big Data business (i.e., , , ), we find that this cost is an increasing function of the potential market demand coefficient (i.e., , , ; that is, the greater the potential market demand coefficient, the higher the maximum unit cost of the Big Data business in each investment mode. The maximum unit cost is a decreasing function of the cost-reducing coefficient (i.e., ); that is, the greater the cost-reducing coefficient, the lower the maximum unit cost of the Big Data business. When the potential market demand can be improved or the internal cost can be reduced, the supply chain members are willing to invest more in Big Data business. □
By comparing the maximum unit costs of Big Data business, , , , which the supply chain members are more likely to undertake in the R, S, and J modes, respectively, we find that the highest cost is in the J mode. Here, the supply chain members that invest in Big Data business can share the cost, which can help them reduce the investment risk. Second, the supply chain members investing in the Big Data business jointly reduce the internal costs of the supplier and the retailer, and thus can improve the overall efficiency of the supply chain rather than solely that of one member. Third, the supply chain members can potentially gain more consumers by jointly investing in Big Data business and can also better understand market demand information so that supply chain members can adjust production and sales strategies in a timely manner.
5. JR Mode: Revenue-Sharing Contract
In the JR mode, the supplier introduces a revenue-sharing contract to motivate the retailer’s ordering and investing decisions, and thus to coordinate the decentralized supply chain in the same way as the centralized one. We assume that the potential market demand is the same as in the centralized supply chain. In this situation, the retailer promises to transfer share of its profit back to the supplier, where . Thus, we have
Integrating into Equation (9), let ; then, for the first-order condition of the retailer’s profit function , we obtain
As a benchmark case, in the centralized supply chain a central decision-maker invests in the Big Data business. Then, the profit function of the whole supply chain is
Likewise, integrating into Equation (12), let ; then, for the first-order condition of the supply chain’s profit function , we have
Corollary 5.
In the JR mode, the revenue-sharing contract can coordinate the supply chain if the wholesale pricesatisfies, where.
Proof.
The profit of the decentralized supply chain is determined by the retailer’s ordering to ensure that it reaches the level of the centralized supply chain, so should be met, and thus we have .
In addition, let , and there is . Bringing into , we can obtain based on :
Based on , we have . □
In the JR mode, when the wholesale price satisfies , the supply chain can be coordinated by the revenue-sharing contract; that is, , which means the supplier can motivate the retailer’s ordering and inverting decisions in the Big Data business.
Corollary 6.
In the JR mode, when the unit cost of the Big Data business satisfies, the revenue-sharing contract can improve the supply chain, and vice versa.
Proof.
To study the impact of investing in the Big Data service on the profit of the supply chain under the revenue-sharing contract, we compare the profit in the JR mode with that in the N, R, S, and J modes.
If , .
If , .
If , .
If , . □
In the JR mode, when the unit cost of investment in Big Data business satisfies , the overall profit of the supply chain in the JR mode is higher than that in the N, R, S, and J modes, and so the revenue-sharing contract can effectively improve the supply chain performance. Otherwise, the overall profit of the supply chain will decrease, and the supplier will not choose to introduce the revenue-sharing contract to improve the supply chain.
Corollary 7.
In the JR mode, when the retailer’s profit sharesatisfies, the supply chain members can achieve a Pareto improvement.
Proof.
To ensure that the profits of the supplier and the retailer increase under the revenue-sharing contract, the following conditions must be satisfied.
We define , , , .
We have , that is, ; , that is, ; , that is, ; , that is, .
In addition, we have , that is, ; , that is ; , that is, ; , that is . □
In the JR mode, by using the revenue-sharing contract, when the retailer’s profit share satisfies , both the supplier’s and the retailer’s profit increase, which means that the overall benefits of the supply chain are higher than that in the N, R, S, or J modes. The revenue-sharing contract can effectively coordinate the supply chain, while the supply chain members can achieve a Pareto improvement. Otherwise, the profit of the supplier or the retailer decreases, and the supply chain cannot achieve a Pareto improvement.
6. Numerical Study
This section presents several numerical studies aimed at verifying the obtained analytical results, and the impacts of Big Data business investment on the profit of the supply chain and its members are examined. Based on the study of Liu and Yi [18], let . Note in this section, for the sake of easy exposition and comparison, we refer to some results of our previous work presented in Chinese.
In the N mode, it satisfies , where . Without loss of generality, let , and , . Thus, the profits of the supply chain and its members are .
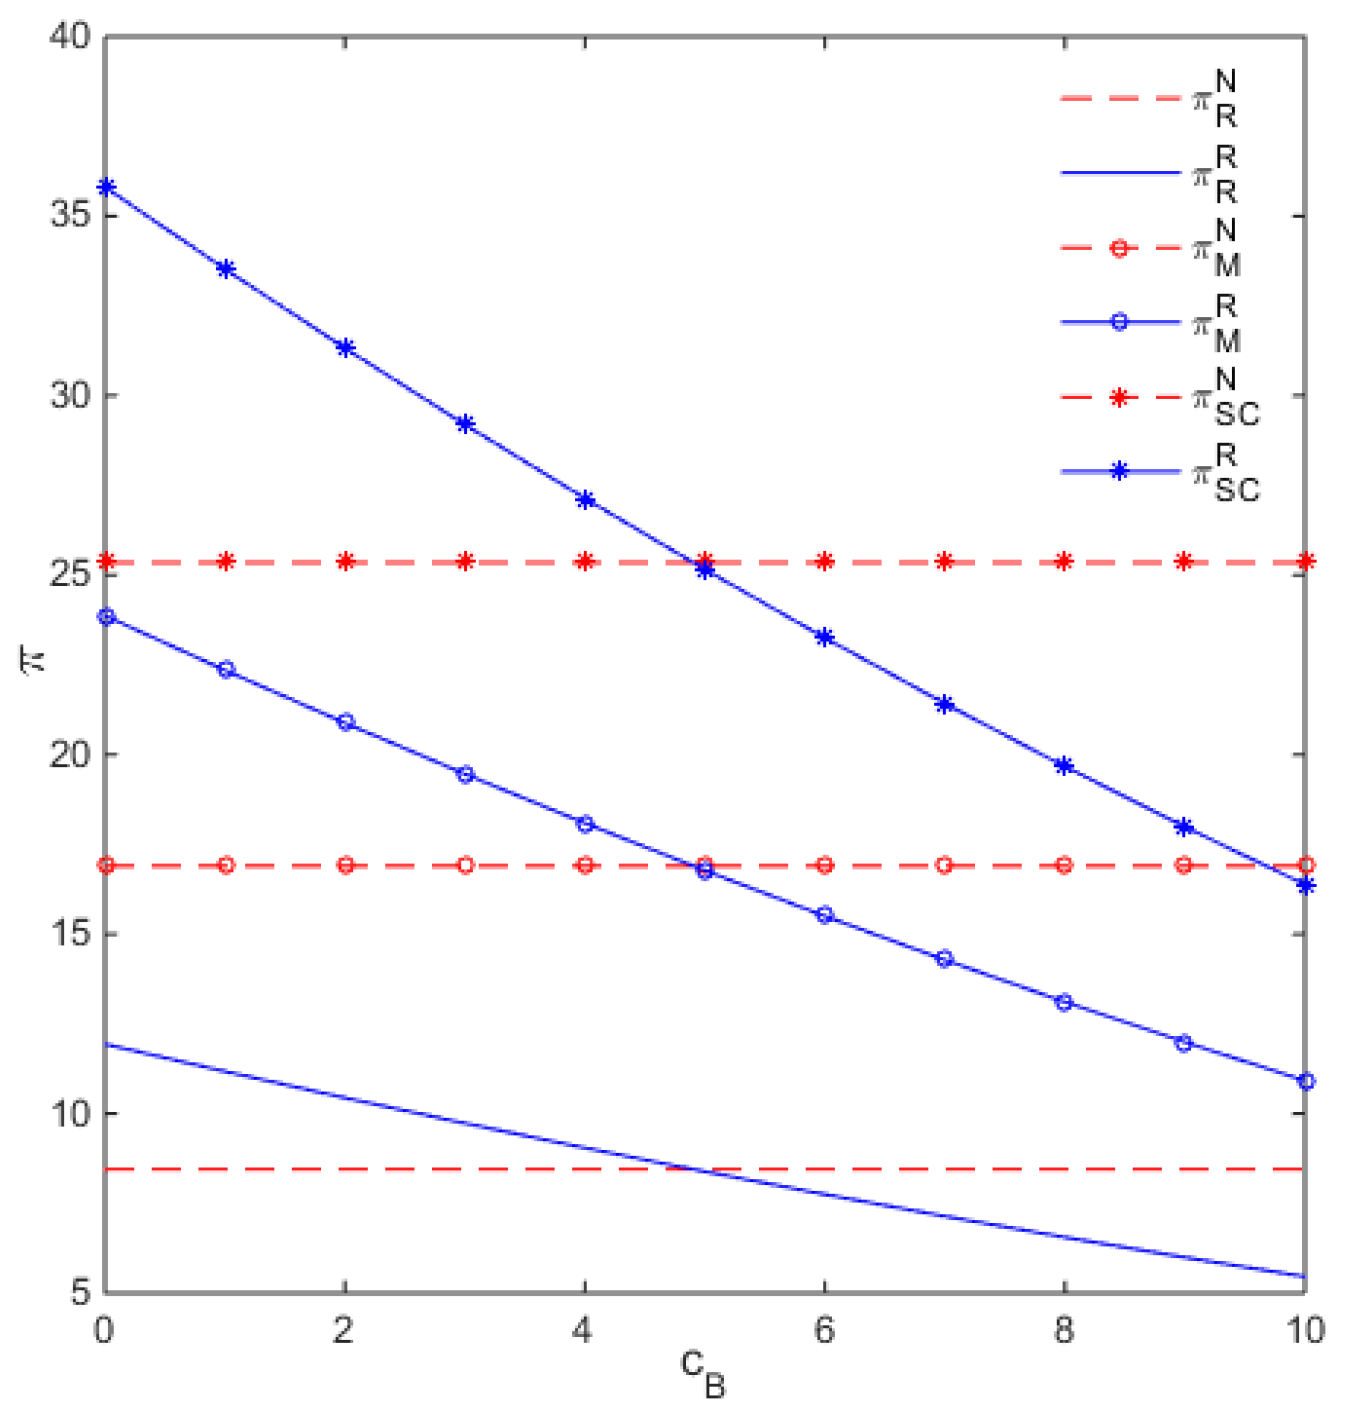
In the R mode, according to Theorem 1, , it also holds that , and . Without loss of generality, let , then we have , which indicates that . Therefore, the retailer would choose to invest in Big Data business alone, and Corollary 1 is verified. Figure 2 shows the impact of the retailer’s Big Data business investment on the profits of the whole supply chain and its members in the R mode.
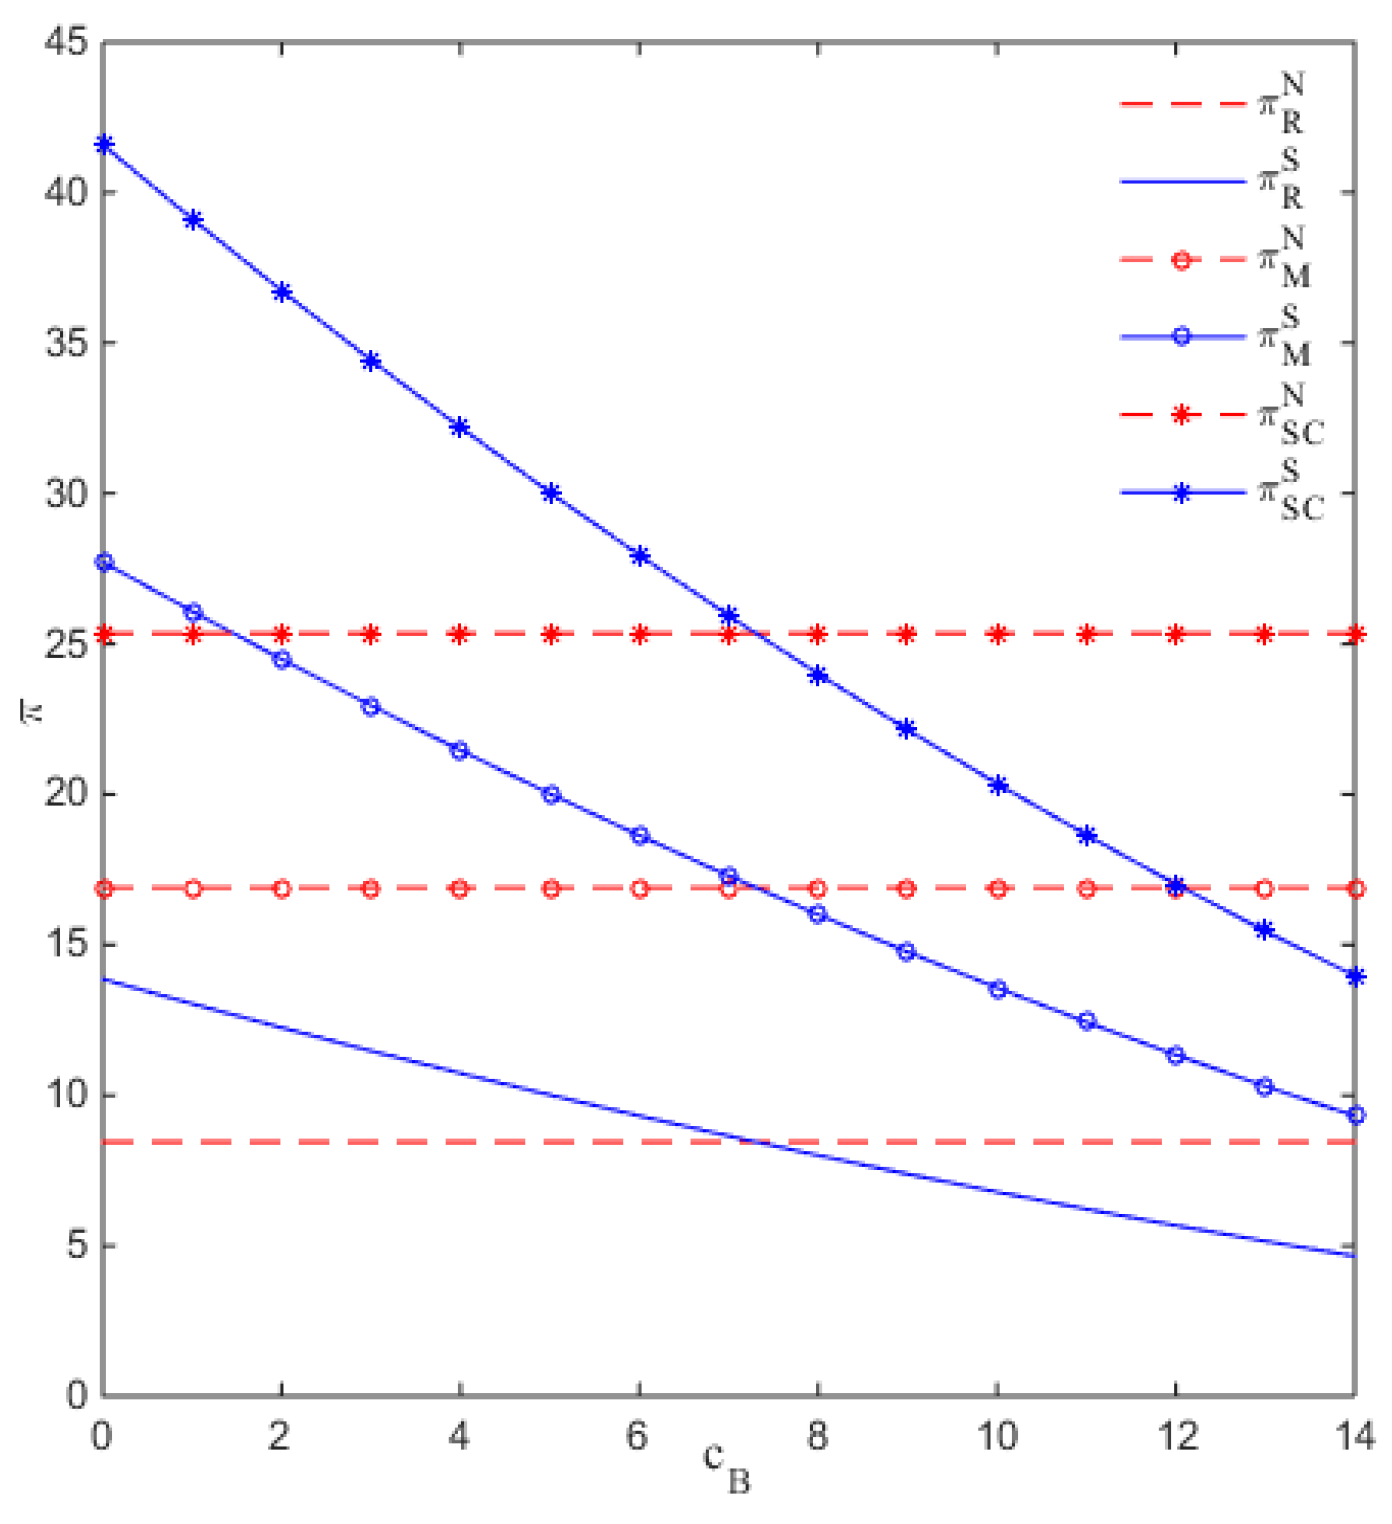
In the S mode, based on Theorem 1, , , and . Let ; then, we have . Thus, , , . Consequently, the supplier will choose to invest in Big Data business alone, which means that Corollary 2 is verified. Figure 3 shows the impact of the supplier’s Big Data business investment on the profit of the whole supply chain and its members in the S mode.
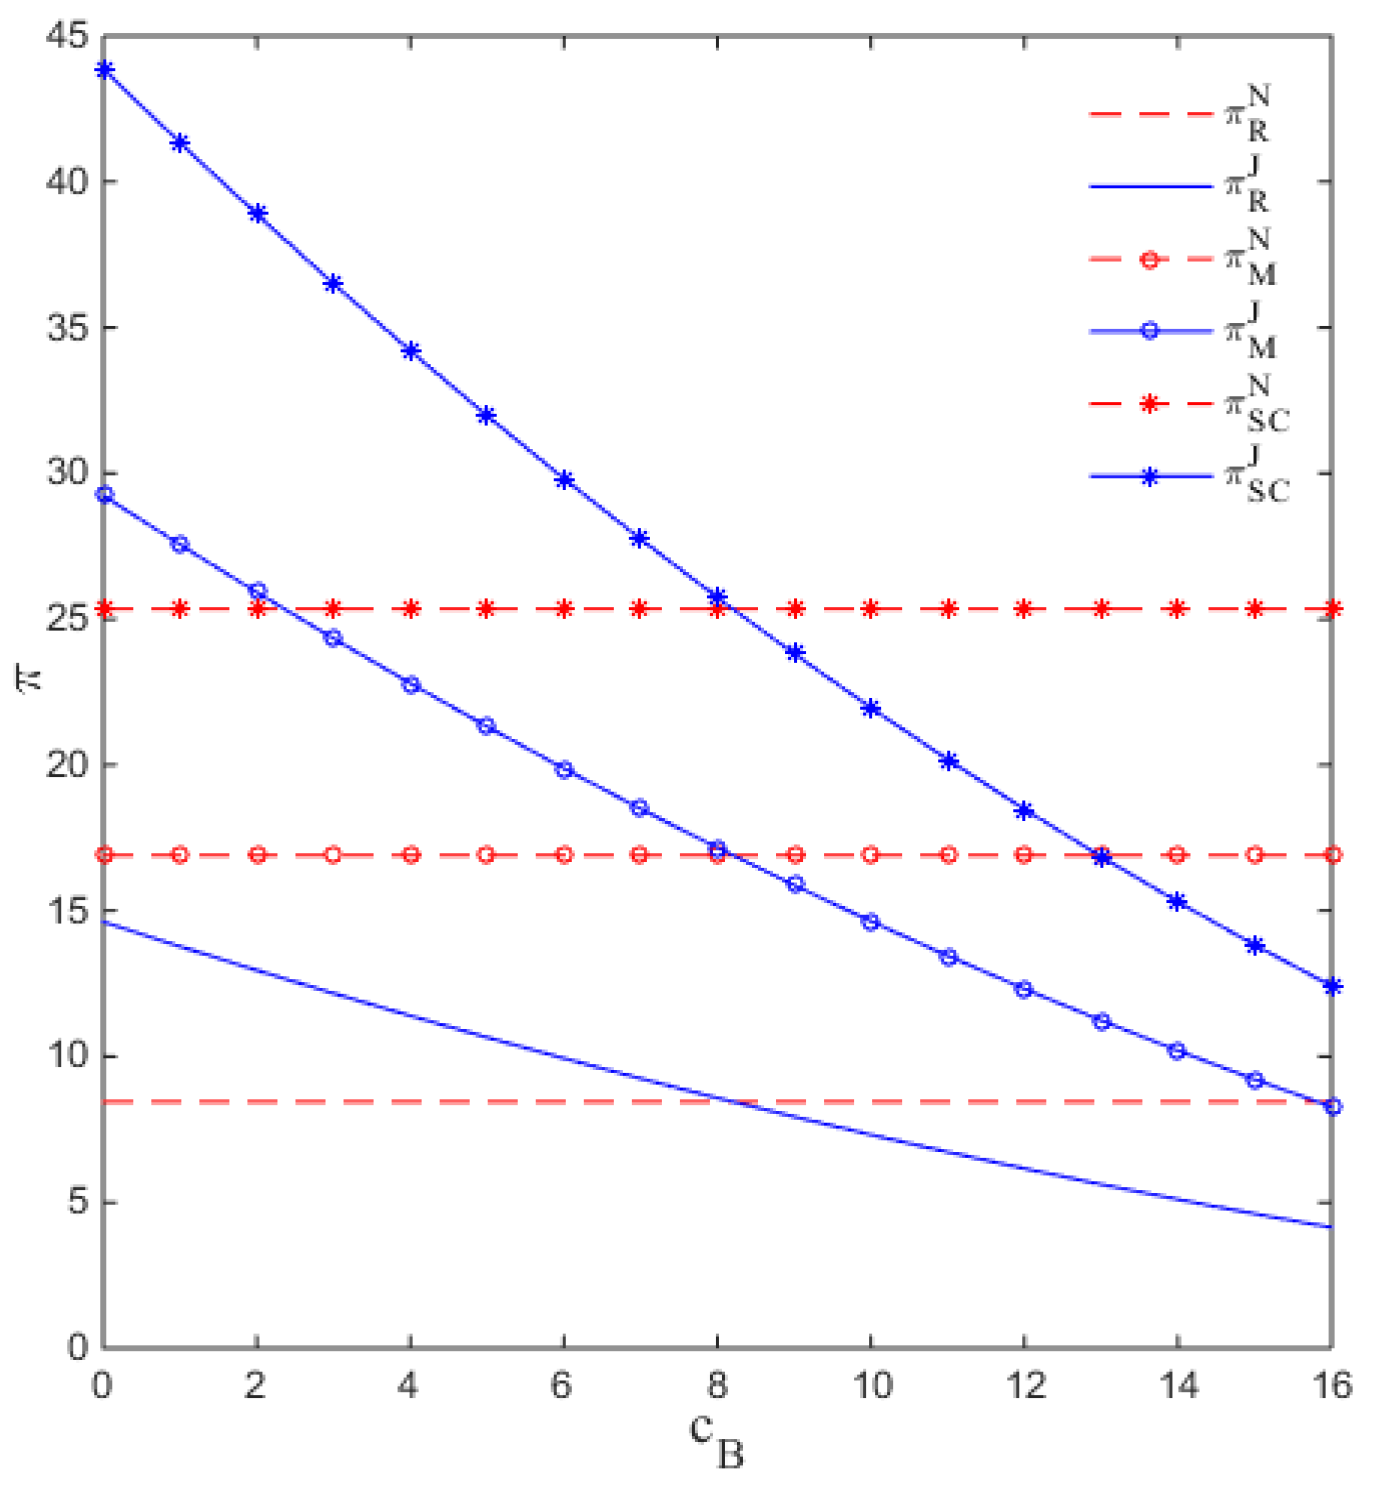
In the J mode, based on Theorem 1, , , and . Let ; then, we have . Obviously, , , . Therefore, both supply chain members will choose to invest in Big Data business, and Corollary 3 is verified. Figure 4 shows the impact of the supply chain members’ Big Data business investment on the profit of the whole supply chain and its members in the J mode.
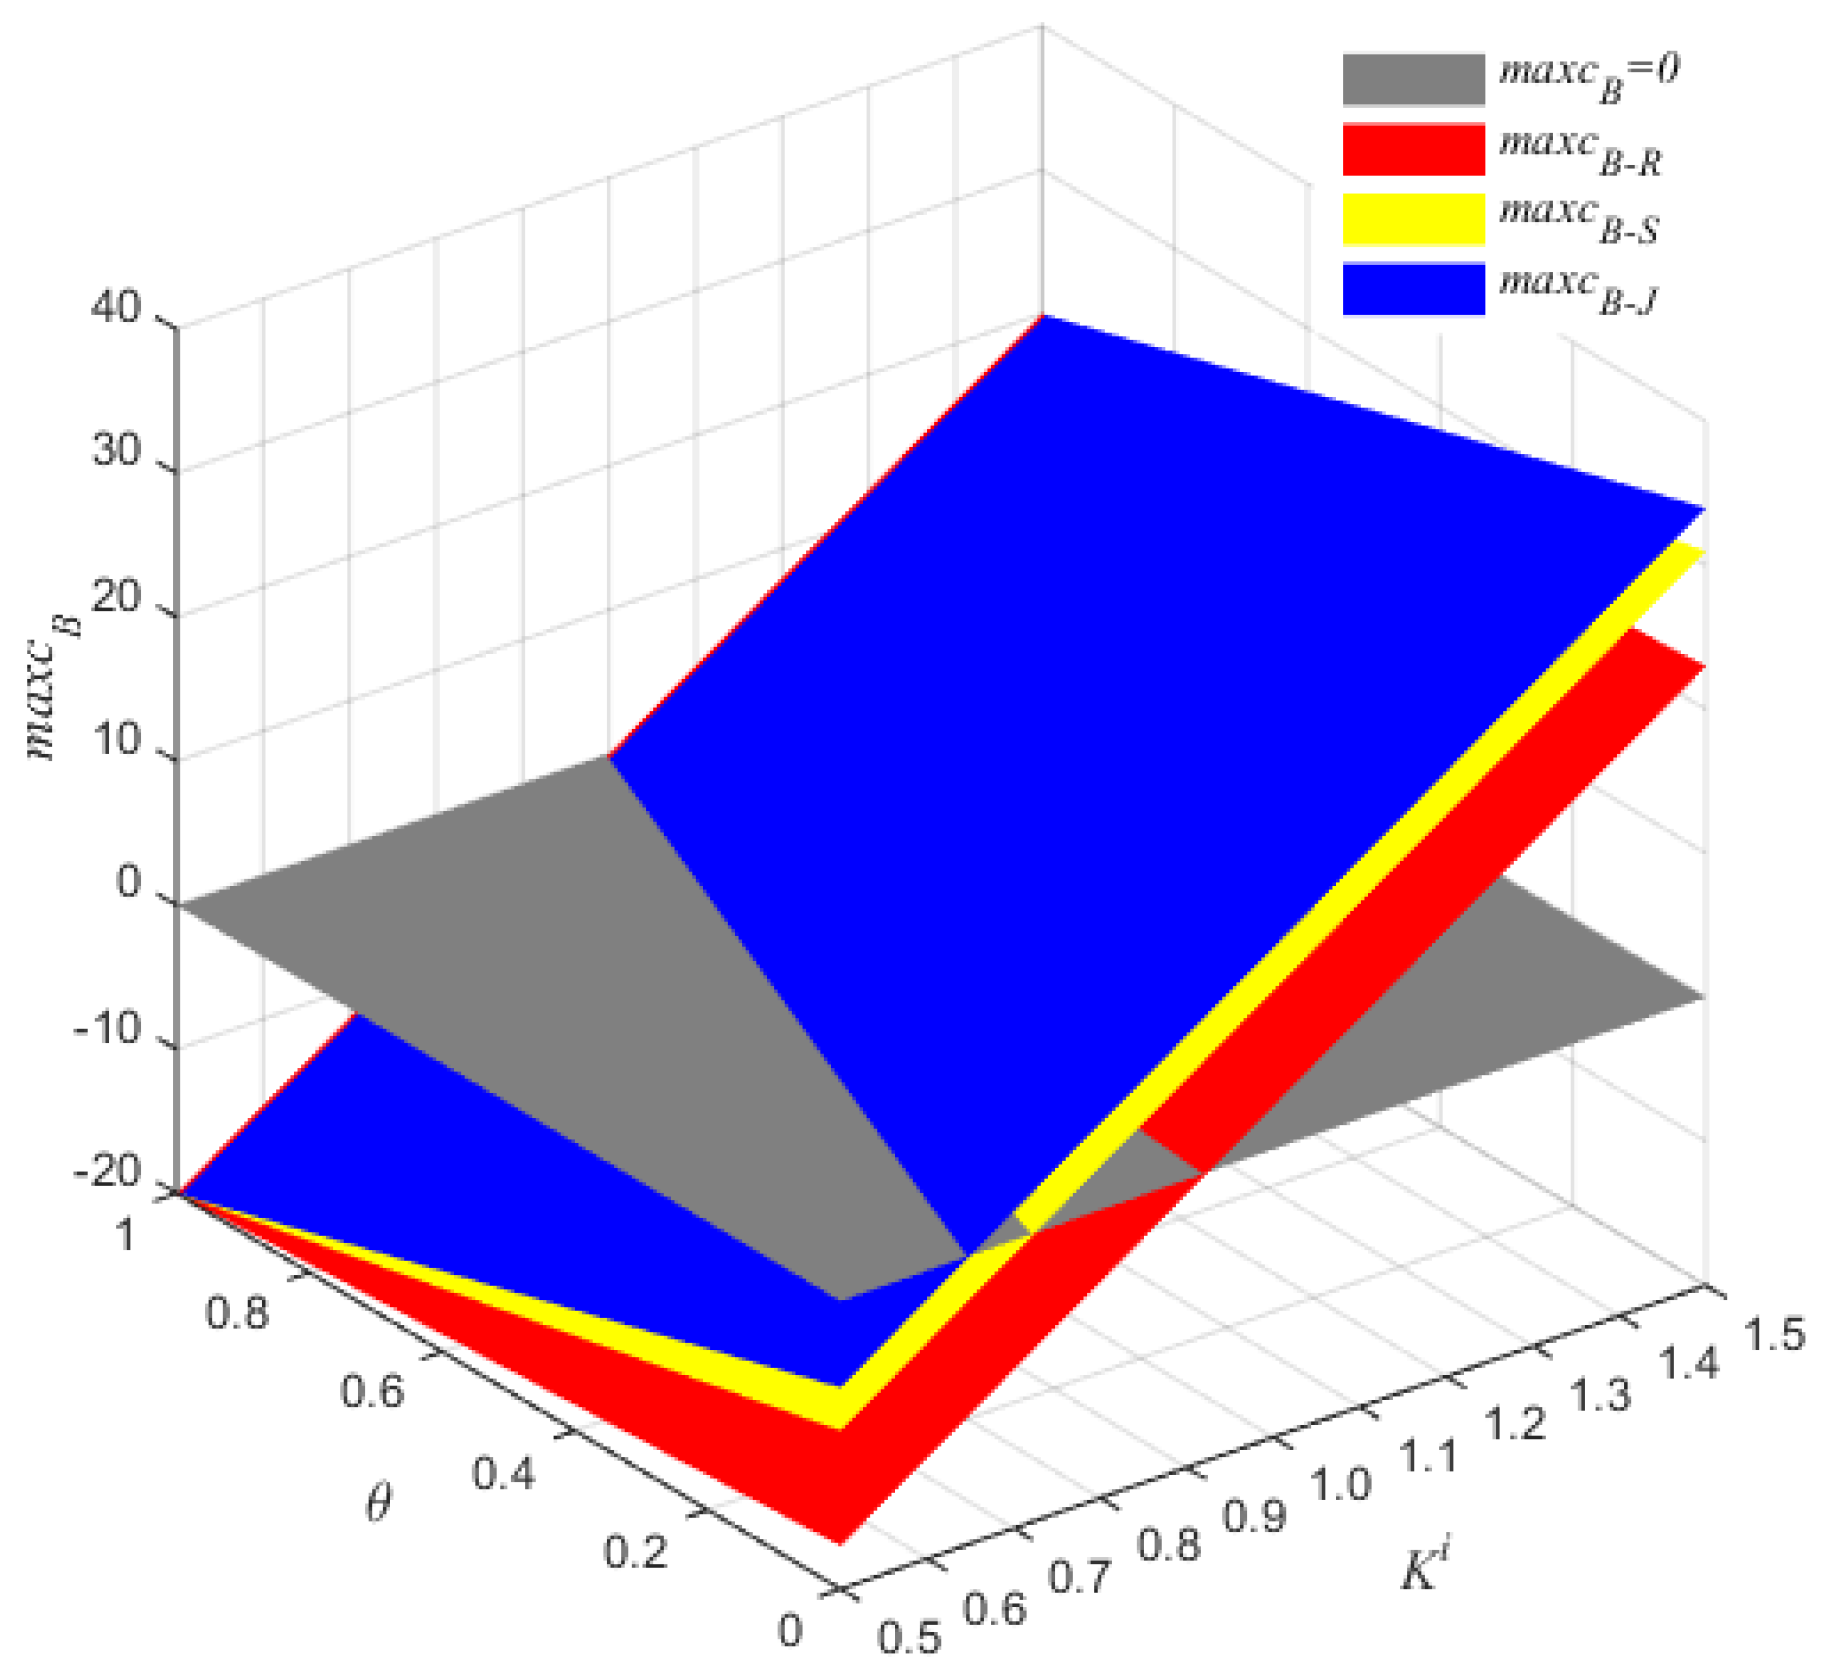
In the R, S, and J modes, Figure 5 shows how the maximum unit costs of the Big Data business vary as the potential market demand coefficient and the cost-reducing coefficient increase; that is, increases as increases, and it decreases as increases. In addition, let , ; then, we have . Thus, is the highest, so Corollary 4 is verified.
In the JR mode, let , , ; then, we have and , and thus Corollary 5 is verified.
According to ), let ; then, . Therefore, we have . This implies that the supply chain has the highest profit in the JR mode when takes a value in a specific range; thus, Corollary 6 is verified.
7. Conclusions
In this study, a model of a two-stage supply chain is built, consisting of a single supplier and a single retailer. Enterprises in the supply chain can reduce their internal production costs and increase the product sales ratio by investing in Big Data business. We then analyze five different decision-making modes in terms of the supply chain’s investment in Big Data business, and the results are as follows:
- When the supply chain members invest in the Big Data business individually or jointly, and if the unit cost of Big Data business satisfies the cost constraints, the profits of the supply chain and its members will increase. When supply chain members jointly invest in Big Data business, the maximum unit cost that the supply chain members are willing to undertake will be higher than if the supply chain members invest in Big Data business individually.
- The maximum unit cost of the Big Data business that the supply chain members are willing to undertake is inversely proportional to the cost-reduction coefficient, and it is proportional to the operations cost of the supply chain members.
- When both supply chain members invest in the Big Data business, if the unit cost is within a certain threshold, the revenue-sharing contract can perfectly coordinate the supply chain.
- If both supply chain members choose to invest in the Big Data business and the cost sharing and profit-sharing coefficients are within a certain threshold, the profit of the supply chain can achieve Pareto optimality.
In terms of the practical application, the results of our paper specify conditions on which Big Data investment can be a feasible strategy jointly or individually for supply chain members and how the unit cost of Big Data business affects the conditions, thus providing guidance to each supply chain member on judging when Big Data investment can be a good choice. Moreover, our results also show the optimal cost and revenue-sharing proportion, as well as the condition under which this mechanism can coordinate the supply chain. Therefore, our paper can also help the supplier in contract design seeking for supply chain coordination.
The basis of this study is a linear demand function, and nonlinear demand functions are not discussed. Only a two-stage supply chain situation is discussed, and multi-stage or multi-channel supply chains are not considered. In our future research, we will relax the hypothesis and explore these alternative situations.
Author Contributions
Conceptualization, L.X. and Y.X.; methodology, Y.X.; formal analysis, Y.X.; validation, Y.X and R.G.; visualization, R.G.; writing—original draft preparation, Y.X. and P.D.; writing—review and editing, R.G. and H.L.; project administration, L.X.
Funding
This research was supported in part by National Natural Science Foundation of China (Grant No. 71672125, 71702130), major research project of National Natural Science Foundation of China (Grant No. 91646117), Project of High School Innovation Team of Tianjin Province (Grant No. TD13-5018).
Conflicts of Interest
The authors declare no conflict of interest.
References
- Manyika, J.; Chui, M.; Brown, B.; Bughin, J.; Dobbs, R.; Roxburgh, C.; Byers, A.H. Big Data: The Next Frontier for Innovation, Competition, and Productivity; Mckinsey Global Institute: New York, NY, USA, 2011; pp. 1–143. [Google Scholar]
- Hogarth, R.M.; Soyer, E. Using simulated experience to make sense of big data. MIT Sloan Manag. Rev. 2015, 56, 49. [Google Scholar]
- Waller, M.A.; Fawcett, S.E. Data Science, Predictive Analytics, and Big Data: A Revolution That Will Transform Supply Chain Design and Management. J. Bus. Logist. 2013, 34, 77–84. [Google Scholar] [CrossRef]
- Hazen, B.T.; Boone, C.A.; Ezell, J.D.; Jones-Farmer, L.A. Data quality for data science, predictive analytics, and big data in supply chain management: An introduction to the problem and suggestions for research and applications. Int. J. Prod. Econ. 2014, 154, 72–80. [Google Scholar] [CrossRef]
- McAfee, A.; Brynjolfsson, E. Big data: The management revolution. Harv. Bus. Rev. 2012, 90, 60–68. [Google Scholar]
- Cao, S.; Manrai, A.K. Big data in marketing & retailing. J. Int. Interdiscip. Bus. Res. 2014, 1, 23–42. [Google Scholar]
- Assunção, M.D.; Calheiros, R.N.; Bianchi, S.; Bianchi, S.; Netto, M.A.; Buyya, R. Big Data computing and clouds: Trends and future directions. J. Parallel Distrib. Comput. 2015, 79, 3–15. [Google Scholar] [CrossRef]
- Sundsøy, P.; Bjelland, J.; Iqbal, A.M.; Pentland, A.S.; de Montjoye, Y.A. Big data-driven marketing: How machine learning outperforms marketers’ gut-feeling. In Proceedings of the International Conference on Social Computing, Behavioral-Cultural Modeling, and Prediction, Washington, DC, USA, 1–4 April 2014; pp. 367–374. [Google Scholar]
- Pasternack, B.A. Optimal pricing and return policies for perishable commodities. Mark. Sci. 1985, 4, 166–176. [Google Scholar] [CrossRef]
- Choi, T.M.; Li, Y.; Xu, L. Channel leadership, performance and coordination in closed loop supply chains. Int. J. Prod. Econ. 2013, 146, 371–380. [Google Scholar] [CrossRef]
- Xu, L.; Li, Y.; Govindan, K.; Xu, X. Consumer returns policies with endogenous deadline and supply chain coordination. Eur. J. Oper. Res. 2015, 242, 88–99. [Google Scholar] [CrossRef]
- Cachon, G.P.; Lariviere, M.A. Supply chain coordination with revenue-sharing contracts: Strengths and limitations. Manag. Sci. 2005, 51, 30–44. [Google Scholar] [CrossRef]
- Gerchak, Y.; Cho, R.K.; Ray, S. Coordination of quantity and shelf-retention timing in the video movie rental industry. IIE Trans. 2006, 38, 525–536. [Google Scholar] [CrossRef]
- Hsieh, C.C.; Liu, Y.T.; Wang, W.M. Coordinating ordering and pricing decisions in a two-stage distribution system with price-sensitive demand through short-term discounting. Eur. J. Oper. Res. 2010, 207, 142–151. [Google Scholar] [CrossRef]
- Li, J.; Liu, L. Supply chain coordination with quantity discount policy. Int. J. Prod. Econ. 2006, 101, 89–98. [Google Scholar] [CrossRef]
- Chen, X.; Li, C.L.; Rhee, B.D.; Simchi-Levi, D. The impact of manufacturer rebates on supply chain profits. Nav. Res. Logist. NRL 2007, 54, 667–680. [Google Scholar] [CrossRef] [Green Version]
- Saha, S. Supply chain coordination through rebate induced contracts. Transp. Res. Part E Logist. Transp. Rev. 2013, 50, 120–137. [Google Scholar] [CrossRef]
- Liu, P.; Yi, S.P. A study on supply chain investment decision-making and coordination in the Big Data environment. Ann. Oper. Res. 2018, 270, 235–253. [Google Scholar] [CrossRef]
- Liu, P.; Yi, S. Investment decision-making and coordination of supply chain: A new research in the big data era. Discret. Dyn. Nat. Soc. 2016, 2016, 2026715. [Google Scholar] [CrossRef]
- Lee, H.L. Big data and the innovation cycle. Prod. Oper. Manag. 2018, 27, 1642–1646. [Google Scholar] [CrossRef]
- Feng, Q.; Shanthikumar, J.G. How research in production and operations management may evolve in the era of big data. Prod. Oper. Manag. 2018, 27, 1670–1684. [Google Scholar] [CrossRef]
- Sanders, N.R.; Ganeshan, R. Big Data in Supply Chain Management. Prod. Oper. Manag. 2018, 27, 1745–1748. [Google Scholar] [CrossRef]
- Choi, T.M.; Wallace, S.W.; Wang, Y. Big Data Analytics in Operations Management. Prod. Oper. Manag. 2017, 27, 1868–1883. [Google Scholar] [CrossRef]
- Tiwari, S.; Wee, H.M.; Daryanto, Y. Big data analytics in supply chain management between 2010 and 2016: Insights to industries. Comput. Ind. Eng. 2018, 115, 319–330. [Google Scholar] [CrossRef]
- Bi, Z.; Cochran, D. Big data analytics with applications. J. Manag. Anal. 2014, 1, 249–265. [Google Scholar] [CrossRef]
- Wang, L.; Alexander, C.A. Big data driven supply chain management and business administration. Am. J. Econ. Bus. Adm. 2015, 7, 60–67. [Google Scholar] [CrossRef]
- Arunachalam, D.; Kumar, N.; Kawalek, J.P. Understanding big data analytics capabilities in supply chain management: Unravelling the issues, challenges and implications for practice. Transp. Res. Part E Logist. Transp. Rev. 2018, 114, 416–436. [Google Scholar] [CrossRef]
- Chen, D.Q.; Preston, D.S.; Swink, M. How the use of big data analytics affects value creation in supply chain management. J. Manag. Inf. Syst. 2015, 32, 4–39. [Google Scholar] [CrossRef]
- Cheng, Y.; Kuang, Y.; Shi, X.; Dong, C. Sustainable investment in a supply chain in the big data era: An information updating approach. Sustainability 2018, 10, 403. [Google Scholar] [CrossRef]
- Govindan, K.; Cheng, T.C.E.; Mishra, N.; Shukla, N. Big data analytics and application for logistics and supply chain management. Transp. Res. Part E Logist. Transp. Rev. 2018, 114, 343–349. [Google Scholar] [CrossRef]
- Guha, S.; Kumar, S. Emergence of big data research in operations management, information systems, and healthcare: Past contributions and future roadmap. Prod. Oper. Manag. 2018, 27, 1724–1735. [Google Scholar] [CrossRef]
- Raman, S.; Patwa, N.; Niranjan, I.; Ranjan, U.; Moorthy, K.; Mehta, A. Impact of big data on supply chain management. Int. J. Logist. Res. Appl. 2018, 21, 579–596. [Google Scholar] [CrossRef]
- Zhao, R.; Liu, Y.; Zhang, N.; Huang, T. An optimization model for green supply chain management by using a big data analytic approach. J. Clean. Prod. 2017, 142, 1085–1097. [Google Scholar] [CrossRef]
- Wu, K.J.; Liao, C.J.; Tseng, M.L.; Lim, M.K.; Hu, J.; Tan, K. Toward sustainability: Using big data to explore the decisive attributes of supply chain risks and uncertainties. J. Clean. Prod. 2017, 142, 663–676. [Google Scholar] [CrossRef]
- Chen, S.; Wang, H.; Xie, Y.; Qi, C. Mean-risk analysis of radio frequency identification technology in supply chain with inventory misplacement: Risk-sharing and coordination. Omega 2014, 46, 86–103. [Google Scholar] [CrossRef]
- Wang, G.; Gunasekaran, A.; Ngai, E.W.T.; Papadopoulos, T. Big data analytics in logistics and supply chain management: Certain investigations for research and applications. Int. J. Prod. Econ. 2016, 176, 98–110. [Google Scholar] [CrossRef] [Green Version]
- Li, L.; Chi, T.; Hao, T.; Yu, T. Customer demand analysis of the electronic commerce supply chain using Big Data. Ann. Oper. Res. 2018, 268, 113–128. [Google Scholar] [CrossRef]
- Gunasekaran, A.; Papadopoulos, T.; Dubey, R.; Wamba, S.F.; Childe, S.J.; Hazen, B.; Akter, S. Big data and predictive analytics for supply chain and organizational performance. J. Bus. Res. 2017, 70, 308–317. [Google Scholar] [CrossRef] [Green Version]
- Ma, J.; Leung, Y.T.; Kamath, M. Service system design under information uncertainty: Insights from an M/G/1 model. Serv. Sci. 2019. [Google Scholar] [CrossRef]
- Lee, J.; Lapira, E.; Bagheri, B.; Bagheri, B.; Kao, H. Recent advances and trends in predictive manufacturing systems in big data environment. Manuf. Lett. 2013, 1, 38–41. [Google Scholar] [CrossRef]
- Singh, S.; Shehab, E.; Higgins, N.; Fowler, K.; Tomiyama, T.; Fowler, C. Challenges of Digital Twin in High Value Manufacturing. SAE Tech. Pap. 2018. [Google Scholar] [CrossRef]
- Tao, F.; Cheng, J.; Qi, Q.; Zhang, M.; Zhang, H.; Sui, F. Digital twin-driven product design, manufacturing and service with big data. Int. J. Adv. Manuf. Technol. 2018, 94, 3563–3576. [Google Scholar] [CrossRef]
- Ivanov, D.; Tsipoulanidis, A.; Schönberger, J. Digital Supply Chain, Smart Operations and Industry 4.0. In Global Supply Chain Operations Management; Springer: Cham, Switzerland, 2019; pp. 481–526. [Google Scholar]
- Bijlsma, R.; Merkestejin, D. Optimizing manufacturing & supply chains using digital twin systems. In Proceedings of the 2018 Winter Simulation Conference, Gothenburg, Sweden, 9–12 December 2018; p. 4249. [Google Scholar]
Figure 1.
The model of the supply chain.

Figure 2.
Impact of Big Data business investment on profit of supply chain members in the R mode.

Figure 3.
Impact of Big Data business investment on profit of supply chain in the S mode.

Figure 4.
Impact of joint Big Data business investment on profit of supply chain members in the J mode.
Figure 4.
Impact of joint Big Data business investment on profit of supply chain members in the J mode.

Figure 5.
The impact of and on the maximum unit cost of the Big Data business in the R, S, and J modes.
Figure 5.
The impact of and on the maximum unit cost of the Big Data business in the R, S, and J modes.


Table 1.
The results of four Big Data investment decision-making modes.
| N Mode | R Mode | S Mode | J Mode | |
|---|---|---|---|---|
© 2019 by the authors. Licensee MDPI, Basel, Switzerland. This article is an open access article distributed under the terms and conditions of the Creative Commons Attribution (CC BY) license (http://creativecommons.org/licenses/by/4.0/).
Share and Cite
MDPI and ACS Style
Xu, L.; Gao, R.; Xie, Y.; Du, P. To Be or Not to Be? Big Data Business Investment Decision-Making in the Supply Chain. Sustainability 2019, 11, 2298. https://doi.org/10.3390/su11082298
AMA Style
Xu L, Gao R, Xie Y, Du P. To Be or Not to Be? Big Data Business Investment Decision-Making in the Supply Chain. Sustainability. 2019; 11(8):2298. https://doi.org/10.3390/su11082298
Chicago/Turabian StyleXu, Lei, Runpeng Gao, Yu Xie, and Peng Du. 2019. "To Be or Not to Be? Big Data Business Investment Decision-Making in the Supply Chain" Sustainability 11, no. 8: 2298. https://doi.org/10.3390/su11082298
Note that from the first issue of 2016, this journal uses article numbers instead of page numbers. See further details here.