An Ecological Early Warning Indicator System for Environmental Protection of Scenic Areas

1
Department of Tourism, Leisure and Hospitality Management, National Chi Nan University, No.1, University Rd., Puli Township, Nantou County 54561, Taiwan
2
Institute of Tourism, Zhejiang University, Zijingang Campus, Hangzhou 3100585, China
3
Department of Ecology and Environmental Resources, National University of Tainan, No. 33, Sec. 2, Shu-Lin St., West Central Dist., Tainan City 70005, Taiwan
*
Author to whom correspondence should be addressed.
Sustainability 2019, 11(8), 2344; https://doi.org/10.3390/su11082344
Submission received: 2 March 2019
/
Revised: 10 April 2019
/
Accepted: 15 April 2019
/
Published: 18 April 2019
(This article belongs to the Special Issue Environmental Impact Assessment and Sustainable Development)
Abstract
:The aim of this research is to build an ecological early warning indicator system. Several complex and interlinked factors contribute to changes in the environmental quality of scenic areas. If changes in these factors can be monitored and controlled, the environmental quality of scenic areas can also be controlled, achieving the purpose of protecting the ecological environment. This study utilizes ecological early warning indicators to enable environmental management. Twenty-six early warning indicators are first identified through a literature review, interviews, and survey pretesting. A fuzzy analytic hierarchy process is then used to calculate the weights of different levels/hierarchies. These early warning indicators can be used both to assess the environmental quality of scenic areas, and to provide a foundation for the construction of an ecological early warning indicator system in scenic areas. This approach represents a new perspective on scenic area environmental management and ecological protection.
1. Introduction
The purpose of this research is to construct an ecological early warning indicator system to explore the primary factors in environmental management of scenic areas, providing a basis for the design of an early warning system of scenic areas. With continuous growth of demand for tourism, the tourism economy has become a primary means of local economic development in many areas. The tourism industry has grown with the rapid development of the Chinese economy in China and Taiwan. Recently, the governments have determined that ecological protection and tourism are expected to extend to the traveling market. The development of tourism in natural preserves and the establishment of hotels in scenic areas are important elements of tourism-related development [1]. Scenic locations are important resources and must maintain their environmental sustainability. The fact that these resources suffer from ecological degradation due to tourism-related development has gained the attention of many scholars and environmental managers [2,3]. Consequently, there are increasingly strident calls for the protection of the environment in scenic areas. Ecological protection and ecological tourism have become the most significant and discussed aspects of the tourism industry [4]. Environmental protection of scenic areas has become a problem that must be solved along with the continued development of the tourism industry [5,6,7,8,9].
The development of tourism inevitably has an impact on the environment, but it is essential to control and limit this impact. Environmental degradation in scenic areas is inevitably manifested through various phenomena, including changes in water quality or air quality, and noise pollution [7,9,10]. These problems can be monitored and managed using early warning systems. Information technology systems can be used to observe these phenomena and to track subtle changes in the ecological environments of scenic areas. The purpose of this research is to construct an ecological early warning indicator system to explore the primary factors in environmental management of scenic areas, providing a basis for the design of an early warning system for scenic areas exposed to significant levels of tourism.
Besides the “Introduction”, this paper includes a “Literature Review” section developing the research model and hypotheses, a “Research Methods” section detailing first-stage index development and second-stage weight evaluation, a “Results” section revealing the finding and discussion regarding validity and reliability analysis for the indicator structure, indicator structure survey analysis, and Fuzzy AHP survey analysis, and a “Conclusion and Suggestion” section providing conclusions and suggestions to the researchers and practitioners related to the environmental protection of scenic areas.
2. Literature Review
2.1. The Impact of Tourist Activity on the Environmental Quality of Scenic Areas
With the development of the tourism industry, an increasing number of articles looking at the environmental management of scenic areas are being published. A search of the Chinese Academic Journal Network for the terms “tourism + scenic attraction + environment” yielded only four articles in 1999; whereas in March 2019, the same search term yielded more than three thousand related articles and about 1/3 of these articles are related to problems of environmental impact at scenic attractions. Research in this area primarily deals with the sustainability of the natural environments. Specifically, the impact of tourism activities on air pollution, water pollution, noise pollution, and plant and animal populations are often considered in the literature (e.g., Shi et al., [11]; Zhuang et al., [12]; Sun et al., [13]; Yang and Zhang, [14]; Fan, et al., [8]; Zhang, et al., [9]).
The connection between air pollution and tourist activity has been shown in the literature [7,9]. For example, Zhuang et al. [12] studied atmospheric pollution in the Wulingyuan Scenic and Historic Interest Area in Zhangjiajie, China and found that atmospheric SO2 and TSP levels exhibited rising trends, increasing the frequency of acid rain in Wulingyuan. A study by Zhang [10], analyzing the atmospheric environment of the Jiuzhai valley and Mount Huangshan area in Southwestern China found that CO2 emissions had reached 309,456 metric tons (t) and 1,469,479t, respectively. CO2 emissions per tourist visitor were 161.85 kg and 91.47 kg, respectively. The emissions from tourism-related activities had a very obvious impact on atmospheric change and ecological characteristics of the scenic areas. Studies by American scholars [15,16,17] on Yellowstone National Park, Denali National Park, Grand Canyon National Park, and Glacier National Park in the United States of America found that motor vehicle emissions and tourist activity produced very large amounts of CO2, NOx, and VOC emissions, which were the primary causes of atmospheric environmental degradation in these areas.
The impacts of tourism on water pollution are well documented in the literature. A study by Sun et al. [13] on water pollution in Da Xi Scenic Spots of AnJi in Zhejiang Province, China found that the total nitrogen content during the weekends was 1.3–2.2 times the normal level and that animal and vegetable oil content at pollutant discharge outlets were 4–12 times the normal level, indicating that the large number of weekend tourists caused serious damage in terms of water pollution. Zhang [18] analyzed water quality in Fuzhou National Forest Park’s reservoir in China’s Fujian Province and indicated that the primary sources of pollution were hotels, restaurants and food providers, and entertainment vendors. Liu and Liu [19] studied the Tianchi Mountain scenic area in Xinjiang, China and showed that water quality around the mountain suffered greatly due to tourism activities. Lead, cadmium, copper, and phosphorous levels increased on an annual basis. Ortiz-Lozano et al. [20] studied water pollution in the Mexican coastal region of the Gulf of Mexico. The construction of holiday resorts resulted in water pollution from the discharge of waste water. Hall [3] summarized environmental problems caused by tourism-related development in the Pacific islands, suggesting that the pollution of seawater occurs primarily because of entry of tourists in excessive numbers and unregulated development of seaside reception facilities (e.g., hotels).
Noise pollution is another key issue for environmental sustainability in scenic areas. Yang and Zhang [14] studied noise pollution in the East Lake scenic area of Wuhan, China. They found that excessive noise within the scenic area was primarily caused by vehicular traffic. Zhang [21] studied the Wuyi Mountain Natural Preserve in the Northern Fujian province of China and found that large tourist flows led to higher levels of environmental noise (in decibel terms). Research by Buddhawong [22] indicated that noise pollution is a stress factor for animals in scenic areas, and the production of noise in scenic areas is primarily related to vehicles and tourist density around walkways. Mbaiwa [23] analyzed noise pollution problems in the Okavango Delta of Botswana. His research indicated that noise pollution is primarily caused by boats, small aviation equipment, engines of land vehicles, and tourists themselves. Noise greatly disturbed hippos, birds, and various species of wild animals. Animal populations continually decreased.
Wildlife experience a broad range of negative impacts from tourism [7,9]. After studying the impact of tourism-related activities on wild animals in natural preserves, Ma and Cheng [24] suggested that the types, scope, strength, and temporal distribution of tourist activities within natural preserves are important interference factors for the population growth of wild animals. For example, mountaineering, photographing wild animals, ice skating, hunting, and vehicular traffic all impact the activity ranges and existence of wild animals. Animals are not the only living things impacted by tourism, research on plant impacts is an important sustainability consideration as well. An investigation by Shi et al. [11] on the impact of tourism on plants in the Zhangjiajie National Forest Park, located in the Hunan Province of China, indicated that fluoride and SO2 levels for Chinese fir (Cunninghamia lanceolata), Japanese fir (Cryptomeria japonica), and Chinese wingnut (Pterocarya stenoptera) leaves in park reception areas were 1.6–16 times higher than for those in non-reception areas. The radial growth (e.g., annual growth rings) of Chinese fir reduced by 32.3%–57.1% relative to non-reception areas. Vandalism and carving scarred forest trees along the Jinbian Creek and Yellow Stone Village scenic routes; these scars were primarily distributed on the trees at a height of 1.2–1.6 m from the ground. Liu and Zhang [25] examined the impact of tourism on smoke tree forests in the Beijing Xiangshan Park and found that sustained high-strength tourist interference may cause smoke trees to be partially replaced by other species. Pickering and Hill [26] studied the impact of tourism-related activities on plants in Australian natural preserves and suggested that tourist facilities have an obvious impact on vegetation, particularly within the range of sewage systems.
The studies described above all note that tourist activities (e.g., tourist volume or reception facilities) have a clear impact on the natural environmental quality of scenic areas (e.g., atmospheric pollution, water pollution, noise pollution, and flora and fauna populations and habitats).
2.2. Studies on Ecological Early Warning Indicator Systems
Many scholars have established ecological sustainability early warning systems for different fields based on different approaches [8,9]. For example, Cao [27] constructed an ecological security early warning indicator system for tourist destinations (ecological environmental stress, ecological environmental quality, ecological environmental rebuilding), using the ecological tourism environment of Kaifeng City as a case study for empirical analysis. Zou [28] studied early warnings for the ecological security of inland rivers, using the Hei River as a specific case for analysis. Yang [29] suggested that ecological security indicators for tourist destinations should be considered from the perspectives of tourism resource security, tourism environmental security, and tourism ecological construction. Zhao and Li [30] proceeded from the perspective of ecological-environmental capacity and introduced an ecological-environmental capacity indicator system for the Lijiang River based on natural environment, economic environment, and social environment. Wang and Wu [31] constructed a four-level ecological security assessment indicator system for the Wuyi Mountain Scenic Area based on ecological-environmental stress, ecological-environmental conditions, and ecological-environmental responses, using the PSR (Pressure-State-Response) indicator system model.
Studies have facilitated the development of an early warning indicator system for scenic areas [7,9]. For example, considering the developing ecological protection and tourism areas in Taiwan, Lin [4] analyzed and evaluated aspects of local industries, transportation, agriculture society, etc. Zou et al. [5] suggested that ecological security in scenic tourist areas requires early warning for indicators such as the number of tourists, scale, and reception capabilities. Ming [32] studied indicators for tourism environmental capacity (natural environmental capacity and tourism environmental capacity). Li and Zhang [33], Zhang, et al. [9] performed more detailed research on hierarchical indicators (ecological environmental capacity, spatial environmental capacity, facility environmental capacity, and social environmental capacity).
Some studies have indicated that scenic area environments face the ecological problems of air pollution, water pollution, noise pollution, soil pollution, and various impacts on flora and fauna. These pollutions and impacts discussed in this literature are primarily caused by tourism-related activities. This study suggests that pollution and impact problems in scenic areas can be predicted and prevented using ecological early warning indicator systems.
2.3. Fuzzy Analytic Hierarchy Process
The analytic hierarchy process (AHP): AHP, first suggested by Saaty [34], was used to numerically process and express subjective decisions made by humans [35]. Saaty [34] pointed out that the process was useful for forming groups with seemingly complex attributes, using a layer framework. Although each element in the framework was independent, the elements were able to influence one another. AHP works by comparing the element pairs in the framework. Results are transmitted to experts to evaluate their importance, before the ranking is calculated. Completion of the framework and priority are checked for consistency. The following should be emphasized when performing AHP: (1) The ultimate goal is evaluation of the highest group in the hierarchy; (2) Elements with similar attributes are grouped within the same hierarchy branches; (3) No more than seven elements should be in any layer of the hierarchy; and (4) To prevent overlapping or excessive elements from confusing decision makers and complicating calculation weightings, elements in each layer should be unique. This is crucial as the hierarchy establishes importance in descending order, from top to bottom. By comparing elements in pairs, researchers are able to verify whether or not the decisions are precise.
Fuzzy set theory: Fuzzy set theory (fuzzy set theory), also referred to as fuzzy theory, is a quantification method used to deal with fuzzy concepts which originated from Professor Lotfi A. Zadeh [36], an American scientist that specialized in automatic control. Since the word fuzzy is literally ambiguous and vague, it was not widely accepted by precise scientific researchers at first, until successful industrial application occurred in the early 1970s. The concept continued to gradually gain attention, but remained primarily a concept used in academia [37]. In the late 1980s, Japan developed home appliances, which utilized fuzzy logic, and promoted them in the market, causing widespread attention. Since the 1990s, fuzzy theory has been intensively studied, and various applications have been released proving that fuzzy theory can be utilized practically [38].
Decision-making processes in real life are often made in fuzzy environments. As the decision-making environment changes in complexity (including the determination of human behaviors), fuzzy concepts develop in significance. For example, the terms “beautiful” or “good” in a language can be highly subjective and the evaluation of these words varies from person to person. To address the difficulty of making decisions based on subjectively defined criteria, Zadeh [39] introduced the concept of fuzzy sets in order to solve problems obscured by uncertainty. Wu et al. [40] pointed out that uncertainty and fuzziness in data existed due to incomplete information and subjective imprecision of the researcher. As a result, decision makers prefer using fuzzy scales to provide buffer room.
Fuzzy analytic hierarchy process (FAHP): FAHP was introduced by Van Laarhoven and Pedrycz [41], who suggested introducing trigonometric functions to the concept of fuzzy numbers and using geometric means to analyze data in subsequent research. According to Chen and Hwang [42], fuzzy subjective judgments substitute the specific ranking numbers (e.g., from one to nine for clear word-conversion) with fuzzy numbers. For words that are unclear or subjective, fuzzy conversion is used. Researchers then are able to utilize various methods as they see fit to reach a consensus among experts [42,43,44,45].
3. Research Methods
3.1. First Stage
This study arrived at the initial variables for ecological early warning based on an examination of previous literature and expert interviews. Survey pretesting was then used to purge initial variables, forming an ecological early warning indicator structure scale for further analysis. The initial attributes for ecological early warning indicators of scenic areas shown in Table 1 are the result of combining the demand for environmental quality in natural scenic areas with the literature review described above and interviews with scenic area managers.
The survey pretest in this study was intended to confirm whether or not the initial indicator structure was reasonable. Perneger, et al. [46] declared that a default sample size of 30 participants is recommended. The pretesting process of this study involved distributing 30 questionnaires to scenic area managers and scholars in the field of environmental protection to achieve the purpose of purging the initial variables from 1 August to 30 September 2017. Corrected item-total correlation (CITC) was used to purge the initial variables. Cronbach’s α and standard deviations were used to test the reliability of the scale. The CITC for the initial items 2, 3, 8, 24, 25, and 30 (see Table 1) was less than 0.3. Excising these variables led to a significant increase in overall reliability [47]. The final Cronbach α value was 0.95. As a result, the initial indicator scale was reduced from 32 items to 26 items.
All of the questions shown in Table 1 a Likert-type scale to rate the importance of ecological early warning indicators in natural scenarios to environmental protection with the following ratings: Very Important (5 points), Important (4 points), Average (3 points), Unimportant (2 points), and Very Unimportant (1 point). These criteria allowed the respondents completing the questionnaire to voice their opinions on the importance of the indices given. These criteria were then simplified.
A total of 300 questionnaires were distributed from 1 October to 30 May 2018. After the questionnaires were retrieved, those that did not meet requirements were excised. This process of elimination was performed based on the following two conditions: (1) questionnaires that were incomplete, contained omitted responses, or that included multiple responses to a single question were excised; and (2) questionnaires that included 10 consecutive identical responses to scale questions were also eliminated. There were 150, 100, and 50 copies of electronic questionnaires distributed to scenic area managers, government officials and academic scholars, respectively. The number of valid questionnaires was 118, 79, and 20, respectively. A total of 217 (118 + 79 + 20) valid questionnaires remained after excising invalid ones, resulting in a valid response rate of 72.3% (217/300).
3.2. Second Stage
The second stage of the research applied a fuzzy AHP questionnaire for evaluating weights of ecological early warning indicators. We also performed a consistency test during the stage of fuzzy AHP survey analysis. Chen and Hwang [42], Chou et al. [44], and Lin and Cheng [45] pointed out that too many rating categories made it difficult when filling out the questionnaire. Therefore, five ratings, “Absolutely Important”, “Very Important”, “Somewhat Important”, “Slightly Important”, and “Equally Important” were used to describe the fuzzy numbers. The conversion of linguistic terms to fuzzy numbers is shown in Table 2. The linguistic values characterized by triangular fuzzy numbers (TFN) defined on references [1,9] were utilized to convert the suitability evaluation of alternatives; versus criteria [42]. Respondents answering the questionnaire included 15 high-level scenic area management personnel, 6 government officials, and 11 academic scholars. A total of 32 research questionnaires were distributed from 1 January to 15 August 2018, and 30 valid questionnaires were retrieved (response rate = 94%).
The algorithm for evaluating weights of ecological early warning indicators by FAHP, based on linguistic terms can be summarized as follows:
Step 1: Establishing fuzzy judgment matrices
The fuzzy rating values produced by the FAHP questionnaires were coded, and fuzzy pairwise comparison matrices were created.
: Fuzzy pairwise comparison matrix was produced based on importance of ith versus jth to expert i, j, k = 1, 2, …, m
Step 2: Aggregating expert opinions
Since each number in the pairwise comparison matrix represents the subjective opinion of decision makers, the fuzzy synthetic operation works to integrate expert opinions on the pairwise comparison matrix of the decision elements. Following the method of expert’ consensus proposed by Saaty [34] and Buckley [52], the fuzzy positive reciprocal matrix (), generated by geometric means, was used and the weighting calculation was performed at a later time.
Step 3: Calculating fuzzy weight
- m: Number of indices
- : Geometric mean of the triangular fuzzy numbers
- : Fuzzy weight of every array of fuzzy positive reciprocal matrix
Step 4: Performing defuzzification
Conversion of fuzzy weight into crisp real values.
, , are the lower, medium, and upper values of the fuzzy weight.
Step 5: Combining the relative weights of hierarchy
After defuzzifying, the relative weight was formalized to determine the synthesis value of each layer.
4. Analysis and Results
4.1. Validity and Reliability Analysis for the Indicator Structure
The initial ecological early warning indicator scale in this study was obtained from the literature review and interviews with expert scholars. In particular, the initial indicators shown in Table 1 were pretested based on expert scholar compilation and selection. This process indicates that the ecological early warning indicator scale structure has high validity. In terms of reliability for all indicator surveys, the overall Cronbach’s α coefficient was 0.96; the Cronbach’s α values for each of the factors significantly exceeded 0.7. These results indicate high reliability for the overall survey.
4.2. Indicator Structure Survey Analysis
4.2.1 Indicator Importance Analysis
This analysis is intended to confirm whether or not the selected indicators are important. In addition, these results reflect the issues that should be given greater priority in relation to scenic area environmental management. The 26 ecological early warning indicators all have average values in excess of 3, indicating that they are important in the construction of a scenic area’s ecological early warning indicator system. From the rankings of average values, it is evident that the environmental sanitation quality (mean = 3.95), green space coverage (mean = 3.93), atmospheric environmental quality (mean = 3.92), Soil environmental quality (mean = 3.92), and organism species diversity (mean = 3.90) of the scenic area are important indicators in measuring the ecology of the scenic area. These results are consistent with the perspectives of scenic area managers and related scholars as expressed in interviews.
4.2.2 Factor Analysis
The purpose of performing factor analysis in this study was to explore the indicator system dimensions for a scenic area ecological early warning system. When performing factor analysis, the ratio of the number of samples compared to the number of variables should be over 5:1. This study included 217 valid questionnaires and 26 variables, indicating an excellent sample size. Principal component analysis was used. Of the 26 early warning indicators, the Kaiser-Meyer-Olkin (KMO) measure of sampling adequacy and Bartlett’s test of sphericity values were 0.92 and 6078.0, respectively (p < 0.001). These results indicate a correlation between the indicator variables and their appropriateness for factor analysis. Table 3 shows the results of factor analysis for the ecological early warning indicators.
The results of the factor analysis, shown in Table 3, indicate that the 26 ecological early warning indicators can be divided into three factors: tourism activity security indicators, natural environmental security indicators, and environmental protection and restoration indicators; we term these as “dimension layers”. These conclusions are consistent with the views of many scholars as expressed in interviews. In other words, the ecological focus in scenic areas must be changes in natural environments, arising from or related to tourism activities. Ecological early warning indicators must be considered from the perspective of the environmental aspects of tourism activities and natural ecologies; these concepts are related to consciousness in scenic area environmental protection and protection measures. The eigenvalues in factor analysis meet the selection criterion of being greater than 1, and the cumulative variance explained is 73.054%. In addition, the Cronbach’s α values for factors and indicator variables are significantly greater than 0.7. These results indicate that the survey investigation is acceptable. The internal consistency for the scale is relatively high, and the ecological early warning indicator structure has relatively high reliability.
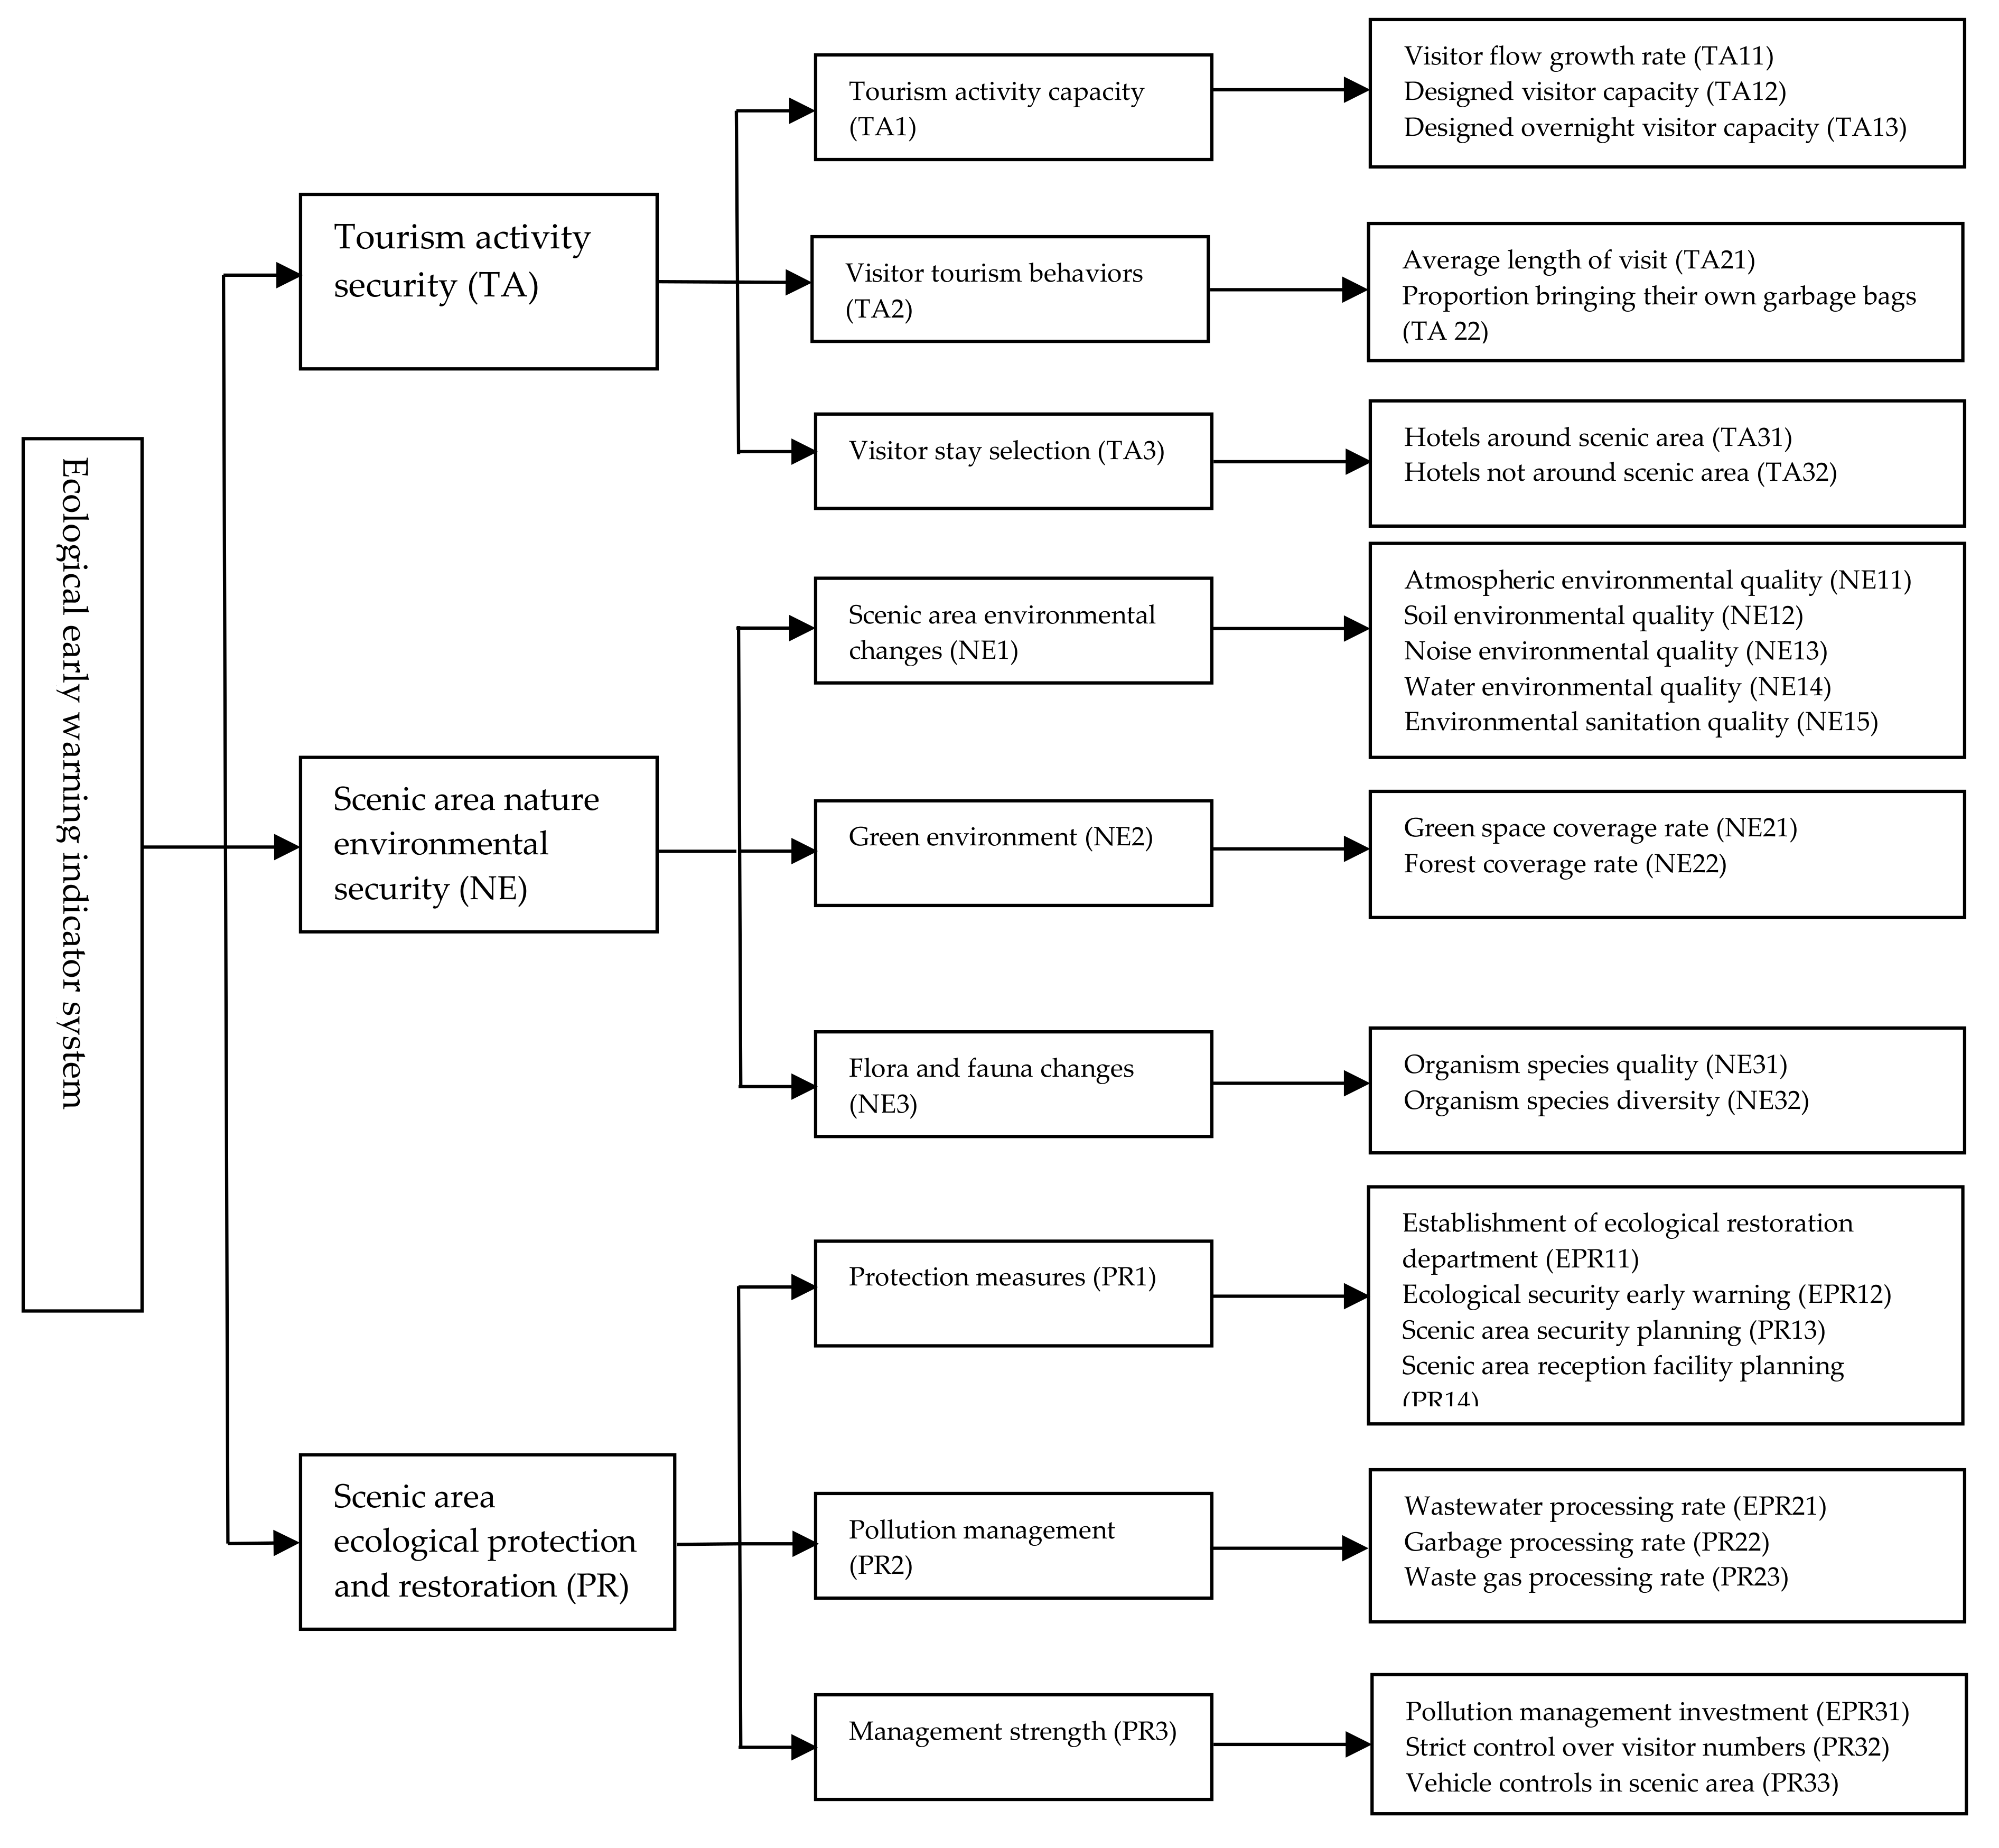
Using the same methods, we performed factor analysis for the dimension layers, including tourism activity security (TA), natural environmental security (NE), and ecological protection and restoration (PR) to arrive at tourism activity capacity, visitor tourism activity and visitor stay selection for the TA dimension layer; the scenic area environmental changes and green environment and flora/fauna changes for the NE dimension layer; and the protection measures, pollution management, and management strength for the PR dimension layer. The construction of these factor layers provides a basis for the study of an ecological early warning model. The hierarchical framework for the ecological early warning indicator system of scenic areas is shown in Figure 1.
4.3. Fuzzy AHP Survey Analysis
4.3.1. Consistency Test
The second stage involved fuzzy analytical hierarchy process (FAHP) survey analysis to examine the weights and consistency of ecological early warning indicators. To confirm the effectiveness of the AHP questionnaire, the 30 valid FAHP questionnaires were tested for consistency by using the most likely values of the evaluated data in fuzzy pairwise comparison matrix. Testing primarily involved calculating the consistency index (CI) and the consistency ratio (CR) of the item hierarchies, as well as the consistency ratio of hierarchy (CRH) value for the overall layer. Values were uniformly less than 0.1, indicating acceptable consistency [34]. Consequently, CI values of the consistency test were 0.0119 for the target layer, 0.0119 for the TA factor, 0.0109 for the NE factor, and 0.0437 for the PR factor. CR values of the consistency test were 0.0079 for the overall layer, 0.0940 for the TA dimension, 0.0076 for the NE dimension, and 0.0293 for the PR dimension. Overall layer CRH value was 0.0196. Thirty of the questionnaires retrieved met consistency standards. Positive reciprocal matrix construction, using geometric means, was used to perform weight analysis. In every group, the CI and CR values were ≤0.1, and the overall CRH value of the entire hierarchy was 0.0196. This showed that the structure of the hierarchy was consistent.
4.3.2. Weighting Analysis
The purpose of this study on ecological early warning indicators of scenic areas is to protect the environmental ecologies of scenic areas. As a result, it is necessary to examine the weights of indicators on the basis of the obtained early warning indicator structure, in order to better understand changes in indicator content and use information and communications technology in assessing these indicators. Since each of the three case layers reflects a different aspect of scenic environmental management, this study calculates the weights for case layer content and the overall weight series for indicator layers. The weight analysis results for specific ecological early warning indicators are shown in Table 4.
From the analysis results shown in Table 4, natural environmental security is the most important of the item layers for early warning. Its corresponding factor layers reflect environmental quality indicators. These indicators can be obtained through testing, constituting important early warnings for scenic area ecologies. Tourism activity security is the second-most important of the item layers, reflecting the fact that ecological problems in scenic areas are caused by tourism-related activities. Indicators in other item layers with greater weights, such as vehicle control in scenic areas, strict controls on visitor numbers, and hotels around the scenic areas, are related to tourism and constitute important ecological early warning indicators. These results indicate that the ecological security of scenic area environments is closely tied to tourism activities and facilities, constituting important issues to be forecasted and controlled through scenic area environmental management and ecological protection.
5. Conclusions and Suggestion
5.1. Conclusions
This study constructed an ecological early warning indicator system of scenic areas through a literature review, industry interviews, and questionnaire survey methods. Analysis included principal component analysis and fuzzy hierarchy analysis for factors. A total of 26 ecological early warning indicators with average mean values greater than 3 on a 5 point scale were used to construct three item layers and nine critical factors for ecological early warning indicators of scenic areas. Scenic area environmental managers and designers of ecological early warning systems for scenic areas can use these critical factors as a reference, as a theoretical basis for ecological early warning system focuses, and for tracking environmental impact factors. There may be problems with application, since it is impossible to solve the problem of uncertainty in scale evaluation. Consequently, we included fuzzy hierarchy analysis in our analysis, allowing the indicator layer weights and factor layer weights to be more reasonable and consistent with reality in the course of analysis.
From the research results, the impacts of tourism activity capacity (0.3718) and hotels around the scenic area (0.3265) on the environment should be given special attention in terms of tourism activity security. For natural environmental security, special attention should be given to flora and fauna changes (0.5122), and organism species quality (0.3120) and diversity (0.2002) are important signs of ecological health. For environmental protection and restoration, strength of scenic area ecological management (0.4473); vehicle control in scenic areas (0.2314) and strict control of visitor capacity are significant for ecological early warning. In the overall weighting analysis, organism species quality (0.16833) and flora and fauna species diversity (0.10802) are the most important, reflecting the ecological attributes of the scenic areas. These results are consistent with the perspective of many scholars, as expressed in interviews. Hotels around the scenic area (0.09695) and environmental sanitation quality (0.06576) are next in importance, indicating that hotels in scenic areas have a greater impact on environmental ecologies and should be a subject of focus for ecological early warnings. Environmental sanitation quality also reflects the characteristics of scenic area ecologies. The importance of these factors is consistent with previous analysis.
5.2. Contribution
Based on the conclusion of the above research findings, this study makes theoretical contributions by constructing an ecological early warning indicator system of scenic areas and they are as followings.
First, this study constructs an ecological early warning indicator system for environmental protection of scenic areas, including 3 dimensions and 26 ecological early warning indicators. This system can be used for monitoring tourism activities, scenic area surrounding facilities, the impact of ecological diversity and the impact on environmental sanitation, etc., to provide a basis for ecological security assessment of scenic areas, and to achieve the goal of protecting the ecological environment.
Second, this study provides practical references for environmental planning, management and protection, and develops a theoretical framework for establishing an ecological early warning system which can be used to track impact factors of environmental changes.
Third, the ecological early warning system established in this study can be used not only to evaluate the environmental quality of scenic areas, but also to study the feasibility of the new facilities construction for scenic areas.
5.3. Suggestion
The establishment of an ecological early warning indicator system for scenic areas is essential to the sustainable development of tourism. It is closely related to the developmental vision for scenic areas, the prevention of environmental degradation, and advocacy of ecological protection and ecological tourism. For different natural scenic area types, the ecological early warning indicator system proposed by this study should be used to provide environmental management departments with a set of specific, objective data to express corresponding indicator values. Indicator systems can thus have corresponding values for reasonable evaluation of ecological environments in scenic areas. For scenic area managers, an ecological early warning indicator system can be used as tools for environmental management and assessment to protect the ecologies of scenic environments by correcting negative impacts on the environment caused by tourism activities.
From the weighting analysis of ecological early warning indicators, it is evident that natural environmental security (0.5396) in the case layer has the greatest weight, indicating that ecological early warning should focus on the ecologies of natural systems in scenic areas. Tourism activity security is the second-most important factor, since it is the source of impact on ecological security in scenic areas. A combination of the overall weight series analysis for the indicator layer reveals that important indicators such as organism species quality, flora and fauna species diversity, environmental sanitation quality, and green space coverage rate are elements of natural environmental security. Ecological early warning indicator systems must concentrate on tracking changes in these indicators, manifesting the ecological attributes of natural scenic areas. Hotels around scenic areas and designed capacity for overnight visitors are included in tourism activity security. The weight of these factors indicates that they have an important impact on scenic area ecologies and environmental quality. In particular, hotels around scenic areas have an irreversible impact on the ecologies of scenic area environments.
Ecological change in natural scenic areas is a slow evolutionary process. On the foundation of research into an ecological early warning indicator system, future studies should use information technology to construct an ecological early warning indicator system of scenic areas based on impact models for early warning indicators. Technological systems can be used to track changes in the ecological early warning indicators of scenic areas. A holistic impact model can be used to analyze the trends in ecological changes in scenic areas and the speed at which they occur, allowing researchers to observe the interaction and relationships between impact factors and achieving real-time early warning and control in the ecological protection of scenic areas.
Author Contributions
Conceptualization, S.-Y.L., J.-L.L. and Y.-L.F.; methodology, S.-Y.L., J.-L.L. and Y.-L.F.; software, S.-Y.L.; validation, S.-Y.L., J.-L.L. and Y.-L.F.; formal analysis, S.-Y.L. and J.-L.L.; investigation, S.-Y.L. and J.-L.L.; resources, Y.-L.F.; data curation, S.-Y.L. and Y.-L.F.; writing—original draft preparation, S.-Y.L., J.-L.L. and Y.-L.F.; writing—review and editing, S.-Y.L. and Y.-L.F.; visualization, S.-Y.L. and Y.-L.F.; supervision, S.-Y.L. and Y.-L.F.; project administration, S.-Y.L.; funding acquisition, Y.-L.F.
Funding
This research received no external funding.
Conflicts of Interest
The authors declare no conflict of interest.
References
- Sun, G.N. Research on model of eco-tourism development in nature reserves of China. Resour. Sci. 1998, 20, 40–44. [Google Scholar]
- Collins, A. Tourism development and nature capital. Ann. Tour. Res. 1999, 1, 98–109. [Google Scholar] [CrossRef]
- Hall, C.M. Trends in ocean and coastal tourism: The end of the last frontier? Ocean Coast. Manag. 2001, 44, 601–618. [Google Scholar] [CrossRef]
- Lin, S.Y. The Application of multiple criteria decision making and grey relational analysis for evaluating destinations of ecotourism. Taiwan J. Rural Stud. 2004, 4, 75–110. [Google Scholar]
- Zou, J.H.; Zhao, Y.H.; Wang, H.Q. Domestic tourism ecological security research. J. Xiangtan Norm. Univ. (Soc. Sci. Ed.) 2008, 30, 74–76. [Google Scholar]
- Lo, L.C. Recreational impact on biodiversity and spatial distribution of populations in the intertidal zones of Liuchio Hsu. J. Geogr. Sci. 2013, 69, 25–46. [Google Scholar]
- Becken, S.; Mahon, R.; Rennie, H.G.; Shakeela, A. The tourism disaster vulnerability frame work: An application to tourism in small island destinations. Nat. Hazards 2014, 71, 955–972. [Google Scholar] [CrossRef]
- Fan, J.; Wang, Y.F.; Tang, Q.; Zhou, K. Academic Thought and Technica Progress of Monitoring and Early-warning of the National Resources and Environment Carrying Capacity (V 2014). Sci. Geogr. Sin. 2015, 35, 1–10. [Google Scholar]
- Zhang, C.; Jiang, J.l.; Yu, X.G.; Li, Q.S. The study of tourism carrying capacity of island in China. Ocean Dev. Manag. 2015, 6, 10–15. [Google Scholar]
- Zhang, J.H. Assessment of ecological impact of tourism waste—Jiuzhai Valley and Yellow Mountain Scenic areas. Acta Ecol. Sin. 2008, 6, 2764–2773. [Google Scholar]
- Shi, Q.; Zhong, L.S.; Wang, X.F. The impact of tourism activities on plants in the Zhangjiajie Forest Park. Chin. J. Plant Ecol. 2004, 28, 107–113. [Google Scholar]
- Zhuang, D.C.; Deng, X.Z.; Zhan, J.Y. Wulingyuan scenic area environmental quality assessment. Geogr. Res. 2004, 23, 192–200. [Google Scholar]
- Sun, X.; Zhang, Y.M.; Xu, Y.L.; Cao, J.; Chen, L. Impact of restaurant wastewater on Zhejiang Province Anjie County Daxi scenic area. J. Univ. Sci. Technol. Suzhou (Eng. Technol.) 2005, 18, 53–56. [Google Scholar]
- Yang, H.G.; Zhang, M. Traffic noise pollution and control strategies in Wuhan West Lake scenic area. Environ. Sanit. Eng. 2006, 14, 15–17. [Google Scholar]
- Davenport, J.; Davenport, J.L. The impact of tourism and personal leisure transport on coastal environments: A review estuarine. Coast. Shelf Sci. 2006, 67, 280–292. [Google Scholar] [CrossRef]
- Musselman, R.C.; Korfmacher, J.L. Air quality at a snowmobile staging area and snow chemistry on and off trail in a Rocky Mountain Subalpine Forest, Snowy Range, Wyoming. Environ. Monit. Assess. 2007, 133, 321–334. [Google Scholar] [CrossRef]
- Shively, D.D.; Pape, B.M.C.; Mower, R.N.; Zhou, Y.; Barkley, R.R.; Sive, C. Blowing smoke in Yellowstone: Air quality impacts of oversnow motorized recreation in the park. Environ. Manag. 2008, 41, 183–199. [Google Scholar] [CrossRef]
- Zhang, S.Q. Impact of tourism activities on water quality in Fuzhou National Forest Park. For. Prospect Des. 2008, 1, 96–99. [Google Scholar]
- Liu, H.F.; Liu, Y.Y. Primary environmental problems and management strategies for the Xinjiang Tianchi scenic area. J. Zaozhuang Univ. 2007, 24, 89–92. [Google Scholar]
- Ortiz-Lozano, L.; Granandos-Barba, A.; Garcia-Salgado, M.A. Environmental evaluation and development problems of the Mexican coastal zone. Ocean Coast. Manag. 2005, 48, 161–176. [Google Scholar] [CrossRef]
- Zhang, W.K. Wuyi Mountain tourism resource protection area. Nat. Resour. 1997, 2, 67–73. [Google Scholar]
- Buddhawong, M. The Development of Environmental Management System Guidelines for Sustainable Tourist Attractions: A Case Study of Bang Saen Beach in Chonburi Province. 2006. Available online: http://mulinet8.li.mahidol.ac.th/e-thesis/4536609.pdf (accessed on 14 January 2012).
- Mbaiwa, J.E. The socio-economic and environmental impacts of tourism development on the Okavango Delta, North-Western Botswana. J. Arid Environ. 2003, 54, 447–467. [Google Scholar] [CrossRef]
- Ma, J.Z.; Cheng, K. Impacts of ecotourism on wildlife in nature reserves monitoring and management. Acta Ecol. Sin. 2008, 28, 2818–2827. [Google Scholar]
- Liu, H.Y.; Zhang, J.H. Impact of tourism interference on Xiangshan smoke tree forests. Chin. J. Plant Ecol. 1997, 21, 191–196. [Google Scholar]
- Pickering, C.M.; Hill, W. Impacts of recreation and tourism on plants in protected areas in Australia. J. Environ. Manag. 2007, 85, 791–800. [Google Scholar] [CrossRef] [PubMed]
- Cao, X.X. Ecological security early warning assessment indicator system and methodology research—Kaifeng City. Environ. Sci. Manag. 2006, 31, 39–43. [Google Scholar]
- Zou, C.X. Inland River Basin Ecological Security—Hei River. Master’s Thesis, Nanjing Meteorology Institute, Nanjing, China, 2003. [Google Scholar]
- Yang, M.X. Ecological security assessment research for scenic tourist areas—Zhangjiajie National Forest Park. Yunnan Geogr. Environ. Res. 2007, 19, 106–113. [Google Scholar]
- Zhao, Z.; Li, F.S. Assessment of ecological tourism environmental capacity—Guilin River. J. Anhui Agric. Sci. 2007, 35, 2380–2385. [Google Scholar]
- Wang, H.C.; Wu, C.Z. Application of PSR indicator system model for Wuyi Mountain scenic area ecology security assessment. J. Secur. Environ. 2006, 6, 123–126. [Google Scholar]
- Ming, Q.Z. New conceptual system for tourism environmental capacity. J. Yunnan Norm. Univ. 1999, 5, 52–53. [Google Scholar]
- Li, Y.N.; Zhang, G.Z. Quantitative analysis of tourism environmental capacity—Jiuzhai Valley. J. Chongqing Inst. Commer. 2000, 6, 32–34. [Google Scholar]
- Saaty, T.L. The Analytic Hierarchy Process: Planning, Priority Setting, Resource Allocation; McGraw-Hill: New York, NY, USA, 1980. [Google Scholar]
- Hwang, C.L.; Yoon, K. Multiple Attribute Decision Making: Methods and Applications; Springer: New York, NY, USA, 1981. [Google Scholar]
- Zadeh, L.A. Fuzzy sets. Inf. Control 1965, 8, 338–353. [Google Scholar] [CrossRef]
- Zadeh, L.A. Outline of a new approach to the analysis of complex systems and decision processes. Syst. Man Cybern. 1973, 3, 28–44. [Google Scholar] [CrossRef]
- Zimmermann, H. Fuzzy Set Theory—And Its Applications, 4th ed.; Springer: Boston, MA, USA; Dodrecht, The Netherlands; London, UK, 2001. [Google Scholar]
- Zadeh, L.A. The concept of a linguistic variable and its application to approximate reasoning—I. Inf. Sci. 1975, 8, 199–249. [Google Scholar] [CrossRef]
- Wu, C.R.; Chang, C.W.; Lin, H.L. Evaluating the organization performance of Taiwanese hospitals using the fuzzy analytic hierarchy process. J. Am. Acad. Bus. 2006, 9, 201–210. [Google Scholar]
- Van Laarhoven, P.J.M.; Pedrycz, W. A Fuzzy extension of Saaty’s Priority Theory. Fuzzy Sets Syst. 1983, 11, 229–241. [Google Scholar] [CrossRef]
- Chen, S.J.; Hwang, C.L. Fuzzy Multiple Attribute Decision Making: Methods and Applications; Springer: New York, NY, USA, 1992. [Google Scholar]
- Kwong, C.K.; Bai, H. A Fuzzy AHP approach to the determination of importance weights of customer requirements in quality function deployment. J. Intell. Manuf. 2002, 13, 367–377. [Google Scholar] [CrossRef]
- Chou, T.Y.; Hsu, C.L.; Chen, M.C. A fuzzy multi-criteria decision model for international tourist hotels location selection. Int. J. Hosp. Manag. 2008, 27, 293–301. [Google Scholar] [CrossRef]
- Lin, S.Y.; Cheng, J.S. A concept of balanced scorecard for establishing resort hotel’s performance index—Application of fuzzy analytic hierarchy process. J. Qual. 2009, 16, 441–459. [Google Scholar]
- Perneger, T.V.; Courvoisier, D.S.; Hudelson, P.M.; Gayet-Ageron, A. Sample size for pre-tests of questionnaires. Qual. Life Res. 2015, 24, 147–151. [Google Scholar] [CrossRef]
- Chiou, H.J. Quantitative Research and Statistical Analysis in Social & Behavioral Sciences; Wunan Publishing: Taipei, Taiwan, 2002. [Google Scholar]
- Maguire, G.S.; Miller, K.K.; Weston, M.A.; Young, K. Being beside the seaside: Beach use and preferences among coastal residents of south-eastern Australia. Ocean Coast. Manag. 2011, 54, 781–788. [Google Scholar] [CrossRef]
- Lo, L.C.; Lin, Y.H. Assessing the management effectiveness of an intertidal attendance control area. Bull. Geogr. Soc. China 2016, 57, 41–55. [Google Scholar]
- Cloquell-Ballester, V.A.; Torres-Sibille, A.D.C.; Cloquell-Ballester, V.A.; Santamarina-Siurana, M.C. Human alteration of the rural landscape: Variations in visual perception. Environ. Impact Assess. Rev. 2012, 32, 50–60. [Google Scholar] [CrossRef]
- Mei, J.; Ran, H.; Yang, T.Y.; Xu, Q.Z. Species diversity of butterflies in Fanjing Mountain national nature reserve of Guizhou. Chin. J. Ecol. 2015, 34, 504–509. [Google Scholar]
- Buckley, J.J. Fuzzy Hierarchical analysis. Fuzzy Sets Syst. 1985, 17, 233–247. [Google Scholar] [CrossRef]
Figure 1.
Hierarchical framework for ecological early warning indicator system of scenic areas.

Table 1.
Initial variables for ecological early warning indicators of scenic areas.
| No. | Indicator | Indicator Source |
|---|---|---|
| 1 | Visitor flow growth rate | Yang [29]; Maguire, et al. [48]; Becken, et al. [7]; Zhang, et al. [9]; Lo and Lin [49]; interviews with scenic area managers |
| 2 | Local population growth rate | |
| 3 | Tourism worker population growth rate | |
| 4 | Designed tourist capacity | Cao [27]; Lo [6]; Becken, et al. [7]; Zhang, et al. [9]; interviews with scenic area managers |
| 5 | Designed overnight tourist capacity | |
| 6 | Average time staying at the scenic area | Suggestions from tourism researchers; stipulated by authors |
| 7 | Proportion of visitors bringing their own garbage bags | |
| 8 | Construction of parking lot for scenic area | Ming [32]; Li and Zhang [33]; Zhao and Li [30]; Zhang, et al. [9] |
| 9 | Hotels around the scenic area | |
| 10 | Hotels not around the scenic area | |
| 11 | Atmospheric environmental quality | Ming [32]; Li and Zhang [33]; Sun et al. [13]; Yang [29]; Zhang [18]; Cloquell-Ballester, et al. [50]; Lo [6]; Fan, et al. [8] |
| 12 | Soil environmental quality | |
| 13 | Noise environmental quality | |
| 14 | Water environmental quality | |
| 15 | Environmental sanitation quality | Cao [27]; Cloquell-Ballester, et al. [50]; Fan, et al. [8]; Zhang, et al. [9] |
| 16 | Green space coverage rate | Cao [27]; Yang [29]; Cloquell-Ballester, et al. [50]; Fan, et al. [8]; Zhang, et al. [9] |
| 17 | Forest coverage rate | Interviews with scenic area managers |
| 18 | Organism species quality | Cao [27]; Yang [29]; Zhao and Li [30]; Mei, et al. [51]; Zhang, et al. [9] |
| 19 | Organism species diversity | |
| 20 | Establishment of ecological restoration department | Li and Zhang [33]; Zhao and Li [30]; Becken, et al. [7]; Zhang, et al. [9]; interviews with scenic area managers |
| 21 | Construction of ecological security early warnings | |
| 22 | Scenic area ecological security planning | |
| 23 | Scenic area reception facility planning | |
| 24 | Number of environmental protection workers | |
| 25 | Quality of local residents | |
| 26 | Wastewater processing rate | Ming [32]; Li and Zhang [33]; Cao [27]; Yang [29]; Zhao and Li [30]; Zhang, et al. [9] |
| 27 | Garbage processing rate | |
| 28 | Waste gas processing rate | |
| 29 | Pollution management investments | Lin [4]; Cao [27]; Zhang, et al. [9] |
| 30 | Local GDP around scenic area | |
| 31 | Strict controls over visitor numbers | Interviews with scenic area managers |
| 32 | Vehicle controls in scenic area |
Source: Compiled as part of this study.
Table 2.
Converting linguistic terms to fuzzy numbers.
| Fuzzy Number | Definition of Linguistic Term | Triangular Fuzzy Scale |
|---|---|---|
| Equally Important | (1,1,2) | |
| Slightly Important | (2,3,4) | |
| Somewhat Important | (4,5,6) | |
| Very Important | (6,7,8) | |
| Absolutely Important | (8,9,9) |
Table 3.
Results of factor analysis for ecological early warning indicators of scenic areas.
| Extracted Dimension | Indicator Variable | Factor Loading | Eigenvalue | Variance Explained (%) | Cronbach’s α |
|---|---|---|---|---|---|
| Tourism activity security (TA) | 1. Visitor flow growth rate | 0.882 | 12.18 | 47.21 | 0.91 |
| 2. Designed visitor capacity | 0.843 | ||||
| 3. Designed overnight visitor capacity | 0.709 | ||||
| 4. Average time staying at a scenic area | 0.706 | ||||
| 5. Proportion of visitors bringing their own garbage bags | 0.738 | ||||
| 6. Hotels around scenic area | 0.814 | ||||
| 7. Hotels not around scenic area | 0.785 | ||||
| Natural environmental security (NE) | 8. Atmospheric environmental quality | 0.797 | 3.38 | 13.02 | 0.96 |
| 9. Soil environmental quality | 0.781 | ||||
| 10. Noise environmental quality | 0.867 | ||||
| 11. Water environmental quality | 0.875 | ||||
| 12. Environmental sanitation quality | 0.871 | ||||
| 13. Green space coverage rate | 0.792 | ||||
| 14. Forest coverage rate | 0.772 | ||||
| 15. Organism species quality | 0.810 | ||||
| 16. Flora and fauna species diversity | 0.778 | ||||
| Ecological protection and restoration (PR) | 17. Establishment of ecological restoration department | 0.851 | 3.34 | 12.83 | 0.96 |
| 18. Construction of ecological security early warnings | 0.801 | ||||
| 19. Ecological security planning for scenic area | 0.828 | ||||
| 20. Scenic area reception facility planning | 0.854 | ||||
| 21. Waste gas processing rate | 0.827 | ||||
| 22. Garbage processing rate | 0.780 | ||||
| 23. Waste water processing rate | 0.866 | ||||
| 24. Pollution management investment | 0.848 | ||||
| 25. Strict control over visitor numbers | 0.766 | ||||
| 26. Vehicle controls in scenic area | 0.814 |
Cumulative variance explained 73.054%; the overall Cronbach’s α 0.955; Source: Compiled as part of this study.
Table 4.
Weight analysis results for ecological early warning indicator system.
| Target Layer | Dimension Layer (Weight) | Rank | Factor Layer (Weight) | Rank | Indicator Layer (Weight) | Rank | Overall Weight | Rank |
|---|---|---|---|---|---|---|---|---|
| Ecological early warning indicator system of scenic areas | TA (0.2970) | 2 | TA1 (0.3718) | 1 | TA11(0.0471) | 6 | 0.01389 | 18 |
| TA12(0.1182) | 4 | 0.03510 | 11 | |||||
| TA13(0.2065) | 2 | 0.06132 | 6 | |||||
| TA2 (0.2726) | 3 | TA21(0.1929) | 3 | 0.05728 | 7 | |||
| TA22(0.0797) | 5 | 0.02366 | 13 | |||||
| TA3 (0.3556) | 2 | TA31(0.3265) | 1 | 0.09695 | 3 | |||
| TA32(0.0291) | 7 | 0.00863 | 23 | |||||
| NE (0.5396) | 1 | NE1 (0.2944) | 2 | NE11(0.0432) | 7 | 0.02330 | 15 | |
| NE12(0.0428) | 9 | 0.02305 | 17 | |||||
| NE13(0.0430) | 8 | 0.02320 | 16 | |||||
| NE14(0.0435) | 6 | 0.02345 | 14 | |||||
| NE15(0.1219) | 3 | 0.06576 | 4 | |||||
| NE2 (0.1934) | 3 | NE21(0.1218) | 4 | 0.06571 | 5 | |||
| NE22(0.0716) | 5 | 0.03915 | 9 | |||||
| NE3 (0.5122) | 1 | NE31(0.3120) | 1 | 0.16833 | 1 | |||
| NE32(0.2002) | 2 | 0.10802 | 2 | |||||
| PR (0.1634) | 3 | PR1 (0.4412) | 2 | PR11(0.0599) | 5 | 0.00975 | 21 | |
| PR12(0.2620) | 3 | 0.04281 | 8 | |||||
| PR13(0.0588) | 7 | 0.00960 | 22 | |||||
| PR14(0.0605) | 4 | 0.00989 | 19 | |||||
| PR2 (0.1115) | 3 | PR21(0.0367) | 9 | 0.00598 | 25 | |||
| PR22(0.0321) | 10 | 0.00524 | 26 | |||||
| PR23(0.0427) | 8 | 0.00698 | 24 | |||||
| PR3 (0.4473) | 1 | PR31(0.0591) | 6 | 0.00965 | 20 | |||
| PR32(0.1568) | 2 | 0.02561 | 12 | |||||
| PR33(0.2314) | 1 | 0.03781 | 10 |
Source: Compiled as part of this study.
© 2019 by the authors. Licensee MDPI, Basel, Switzerland. This article is an open access article distributed under the terms and conditions of the Creative Commons Attribution (CC BY) license (http://creativecommons.org/licenses/by/4.0/).
Share and Cite
MDPI and ACS Style
Lin, S.-Y.; Lu, J.-L.; Fan, Y.-L. An Ecological Early Warning Indicator System for Environmental Protection of Scenic Areas. Sustainability 2019, 11, 2344. https://doi.org/10.3390/su11082344
AMA Style
Lin S-Y, Lu J-L, Fan Y-L. An Ecological Early Warning Indicator System for Environmental Protection of Scenic Areas. Sustainability. 2019; 11(8):2344. https://doi.org/10.3390/su11082344
Chicago/Turabian StyleLin, Shih-Yen, Jun-Liang Lu, and Yu-Lin Fan. 2019. "An Ecological Early Warning Indicator System for Environmental Protection of Scenic Areas" Sustainability 11, no. 8: 2344. https://doi.org/10.3390/su11082344
Note that from the first issue of 2016, this journal uses article numbers instead of page numbers. See further details here.