Abstract
One of the most problematic forms of nature protection in Poland relates to landscape parks. They include the most valuable landscapes, but the areas within the landscape park still have economic uses. Therefore, the monitoring of landscape changes within landscape parks is necessary in order to properly manage these forms of protection. The main objective of the study was to monitor the scale and nature of landscape transformations within the boundaries of landscape parks in Poland during the period 2000–2018 and to assess the possibility of using the landscape change index (LCI) to monitor the intensity of landscape transformations within this type of protected area. Preliminary analyses of the transformations within all landscape parks in Poland showed an upward trend, both in terms of the number of types of identified landscape changes as well as their area. In spite of the large diversity and degree of transformation in landscape parks, several dominant processes can be observed. The largest number and area of changes during each of the analyzed periods were found in transformations within forest landscapes (temporary and permanent deforestation and forest maturation), which constitute the dominant type of land cover within most of the landscape parks. In open landscapes, changes mainly relate to afforestation and natural succession in meadows, pastures, and arable land, as well as the transformation of arable land into mining areas. Twelve case studies, covering all landscape parks in Lower Silesia, have shown that the LCI is an excellent tool for monitoring the intensity of landscape changes, but it is dependent on the accuracy of the source data. The analyses confirmed that, during the study periods, the changes in all 12 Lower Silesian landscape parks were at a low level, but their particular intensification took place in the years from 2012 to 2018. The highest LCI was found in the area where a natural disaster had occurred (air tornado), which destroyed huge areas of forest in landscape parks. After changes in the forest landscape, the most frequently identified type of change in 2006–2012 was the transformation of non-forest landscapes into forest landscapes. The main reason for such changes was the expansion of forest into abandoned arable land, meadows, and pastures. The use of the Corine Land Cover database to calculate the LCI and monitor the intensity of landscape change revealed a low usability of the database for the year 2000 and a high usability for data from 2006 to 2018.
1. Introduction
For many years, man has been considered to be the most important driving force behind changes in the landscape [1,2]. Especially on the local scale, the impact of human activity on the landscape is directly felt, perceived, and evaluated by local communities [3]. In many parts of the world, the changes are so strong that they cause a complete change in the character of the landscape or degradation of its values [4,5,6]. Anthropogenic changes, determined mainly by technological, social, cultural, political, and spatial processes, are mentioned as the main drivers of landscape changes on a global scale [7]. On the regional or local scale, differences in economic development, urbanization processes, and awareness of the need to protect these most valuable landscapes cause significant disproportions on the level of landscape transformations to continue to exist, and even to be deepened [8]. In recent years, a significant intensification of landscape changes [9] and increasing tourist pressure on areas with valuable landscape values [10] have been observed. Landscape transformations are observed all over the world, especially in the developing countries of Asia and South America, as well as in countries of Central and Eastern Europe, including Poland. The fall of communism was the beginning of not only political and cultural transformations, but also a new stage of landscape development in Poland [11,12]. Another important stimulus for landscape transformation was Poland’s accession to the European Union and the activation of significant funds for the improvement of the transport system, reconstruction of degraded areas, and protection of valuable landscapes or subsidies for afforested land with weaker soils [13,14]. The response to the acceleration of changes, in the context of European landscapes, was the European Landscape Convention, adopted in Florence in 2000, which emphasized that landscape is an important part of people’s quality of life and requires constant monitoring, noting its changes, and analysis of the forces and pressures transforming it [15]. Poland, as one of the signatories of the convention (ratification of the document took place in 2004), also undertook to take action in this direction [16]. In order to protect the most valuable landscapes against threats from man, national institutions, created for the purpose of nature and landscape protection, established various forms of protection with restrictions in place to halt progressing changes. Landscape parks constitute one such form, which apart from national parks, are one of the most important forms of landscape protection in Poland. At the same time, they constitute one of the most controversial forms of protection. On the one hand, a number of prohibitions are in force here, which are intended to limit negative landscape transformations. On the other hand, these areas are still in economic use and are subject to the same economic, demographic, or cultural changes as neighboring areas.
Intensive changes in agriculture, production techniques, forestry, construction or industry, transport and tourism management, and on a wider scale, in the world economy have resulted in the need to monitor the landscape and study its changes being discussed more and more often [17,18]. Changes are analyzed, both in relation to urban and suburban landscapes [19,20], agricultural and forest landscapes [21,22,23], or protected areas [24,25,26]. It is worth noting that, as a result of more and more intensive landscape changes, the main objective of landscape change research has changed. A descriptive approach, involving only the documentation of changes in the landscape, is gradually being replaced by an analytical approach [27]. The identification of changes has become insufficient and attempts to search for and understand the forces behind specific landscape transformations or to develop new indicators determining the degree of landscape transformations are popular objectives of research. In this context, three basic approaches to research on landscape changes can be identified. The first group includes broad studies on the identification of spatial and temporal landscape changes. These are mainly comparative analyses of maps from different periods, often using landscape metrics as basic indicators for identifying changes in the landscape [28,29,30,31]. The second group includes research on attempts to identify and understand the processes and forces that influenced the further direction of landscape development—the so-called driving forces of landscape changes [7]. This type of research includes typical individual case studies at the local and regional level from different parts of the world [32,33,34,35], comparative studies on a larger number of case studies [27] or large-scale areas [36], and meta-analyses [37,38] aimed at identifying the main trends that result from the research published so far in this field. The identification of landscape changes is usually the first stage of such analysis; it provides data to identify the driving forces of landscape changes. In the third group, there are studies on indicators for determining the intensity of landscape transformations. Aldwaik and Pontius presented a comprehensive approach to research the intensity of land use transformations [39]. In part of the study, completely new indicators [40,41] are proposed, mainly based on changes in the area occupied by various landscape components. Landscape change studies are increasingly used in decision support systems for spatial change [42]. The valuation of landscape services [43,44], derived from research on ecosystem services, may soon become a new direction in research on the dynamics of landscape changes. However, the development of methods in this area is necessary in order to be able to assess and monitor the impact of identified landscape transformations in terms of the value of services provided by specific types of landscapes.
The main goals of the study were to determine the scale and nature of landscape transformations within the boundaries of landscape parks in Poland during the period 2000–2018 and to assess the possibility of using the landscape change index (LCI) to monitor the intensity of landscape transformations within this type of protected area. Three specific objectives were defined as key milestones of the research:
- (1)
- Determination of the scale of landscape transformations and preparing a classification of landscape changes within landscape parks in Poland on the basis of comparative analyses of land cover maps for 2000, 2006, 2012, and 2018 for 123 landscape parks in Poland by using the Corine Land Cover (CLC) database.
- (2)
- Determination of the LCI and evaluation of the usefulness of the CLC database for this purpose on the example of 12 landscape parks from the Lower Silesia region, which included both lowland, highland, and mountain landscape parks.
- (3)
- Verification of changes in the landscape on the basis of methods used in social sciences.
This article proposed to fill a gap in the landscape change research regarding the lack of indicators enabling the easy monitoring of the intensity of landscape transformations. The possibility of using the LCI in reference to the example of landscape parks in the Lower Silesia region in Poland have been verified. Three main methodological challenges have been addressed: (1) the indicator must be simple enough to enable the quick determination of the level of landscape changes during the analyzed period; (2) the indicator must be based on generally available and cyclically published data; and (3) the indicator must be universal enough to be used for different types of areas. The developed landscape change index is based on the assumption that both the loss and increase in the area of each element of land cover causes a change in the landscape. Since the analyses were based mainly on data on land cover, which do not indicate whether changes in landscape affected the way of perceiving it, they were supplemented by individual oral interviews with a group of experts—field workers directly managing and implementing protection tasks in the area of particular landscape parks. In order to fully understand the scope of landscape transformations, the proposed approach combines techniques used in land use change research and social sciences [45]. This is in line with current trends in scientific research in the field of landscape changes [46,47,48]. Searching for an indicator that will make it possible to evaluate the dynamics of landscape transformations in a simple and quick way is part of the discussion on the methodology of landscape audits [49,50], which is a new landscape management tool in Poland under which all landscape units in the country will be identified and characterized, and one of the characteristics is the dynamics of landscape changes.
The implementation of the research objectives required finding answers to the following research questions:
- (1)
- What type of landscape changes dominated during the three analyzed research periods (2000–2006, 2006–2012, 2012–2018) within the boundaries of landscape parks in Poland?
- (2)
- Was the level of the landscape changes during particular periods the same?
- (3)
- What was the intensity of landscape transformations within the 12 landscape parks in Lower Silesia?
- (4)
- What is the usefulness of the CLC database relating to particular periods of time for the analysis of the changes and intensity of landscape transformations?
- (5)
- Does the cyclical calculation of the landscape change index (LCI), on the basis of the CLC database for consecutive periods, allow for the monitoring of the intensity of landscape transformations?
- (6)
- In this context, should social science methods be used to identify the perceived landscape changes?
2. Materials and Methods
2.1. Study Areas
The area of research consisted of landscape parks within the borders of Poland. The idea of creating landscape parks was born in the 1970s. Currently, there are 123 landscape parks in Poland. Lubelskie Voivodship has the largest number of parks (17), while Podlaskie Voivodship has only three. The total area of all landscape parks in Poland amounts to over 2.5 million ha, which constitutes over 8% of the country’s area. The legal basis for the creation of landscape parks in Poland is the Nature Conservation Act of 16 April 2004 [51]. According to the definition included in this act, landscape parks are areas protected due to their natural, historical, and cultural values, and the aim of their creation is to preserve, popularize, and disseminate these values under conditions of sustainable development. A landscape park is created by a resolution of regional authorities, after consultation with local authorities. All land in the landscape park remains in economic use. However, it is necessary to take special care of the state of the environment and landscape.
The area where the research was conducted was divided into two sets, covering the areas of landscape parks. At the initial stage, the analysis of changes in particular landscape components included a set of all of the 123 landscape parks in Poland (Figure 1). These parks were established mainly during the period from 1976 to 2001, so during the whole analyzed period, almost all areas were under the protection regime defined in the Nature Conservation Act.
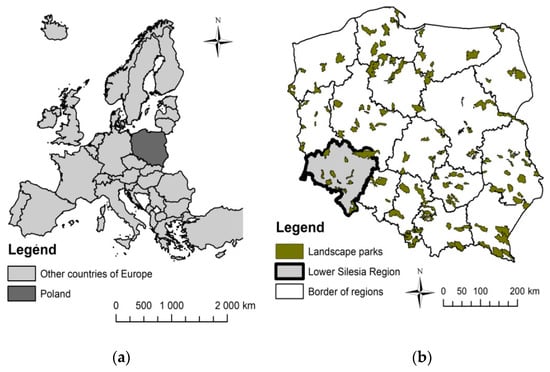
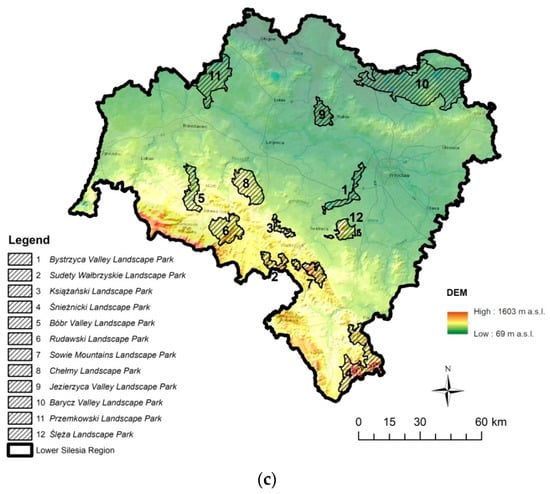
Figure 1.
Location of the research area: (a) location of Poland in Europe, (b) location of landscape parks in Poland, (c) location of landscape parks in the Lower Silesia region.
In the second stage of research concerning the determination of the intensity of landscape transformations, 12 landscape parks were subjected to detailed analyses. All of them are located in the Lower Silesia region, in the southwestern part of Poland (Figure 1). This region was selected because of the diversity of landscape parks within its borders. In terms of size, six landscape parks have an area under 100 km2, three parks have an area of 100–200 km2, and three other landscape parks have an area greater than 200 km2. Among the analyzed case studies is the Barycz Valley Landscape Park—the largest park in Poland. Due to the large diversity of terrain in Lower Silesia, the studied group includes four parks associated with lowland river valleys, four parks in highland areas, including two parks protecting fragments of river valleys and two parks with a mosaic of hills, as well as four parks covering fragments of the mountain ranges of the Sudetes. The characteristics of the detailed research areas are presented in Table 1. All landscape parks were managed throughout the analyzed period by one institution, the Lower Silesian Association of Landscape Parks.

Table 1.
The characteristics of the selected study areas and study landscapes.
2.2. Identification of Landscape Changes in Landscape Parks
In the first stage of the research, general analyses of landscape changes within all 123 landscape parks in Poland were made in order to identify the main types and trends of landscape changes in the three analyzed time periods. The main source of landscape transformations analysis was data from the Corine Land Cover (CLC) database for 2000, 2006, 2012, and 2018 and the land cover change databases for three time periods: 2000–2006, 2006–2012, 2012–2018. All CLC products had been verified for the correct identification of land use before they were released by the European Environment Agency. The CLC overall accuracy for all periods is greater than 85%. Validation criteria and methods are available in final validation reports. There were differences in the sources of data used for the development of individual databases. In particular, it relates to the 2000 satellite images from the Landsat-7 satellite with 30 m spatial resolution. They differed in resolution from the images taken by the satellites used in subsequent periods (2006–20 m, 2012–20 m, 2018–10 m spatial resolution). CLC land cover changes database was a separate product of a project prepared by the European Environment Agency during each period. The aim of its creation was to record actual land cover changes in Europe, which occupied an area greater than 5 ha, wider than 100 m, took place during a separate period of time, and was visible in satellite images. However, it should be added that the data collected in the land cover change databases are not the same as the data, obtained as a result of the spatial intersection of databases, showing land cover in the years of a given time interval. This is a result of the adopted minimum mapping unit in the case of land cover status registration, which was 25 ha for surface phenomena and 100 m in width for linear phenomena. It should also be emphasized that between different periods, especially in the database for the year 2000 and that for 2006, there were differences in the source materials used to interpret the land cover, which concerned, among other things, the resolution of satellite images. Since 2006, in order to achieve greater accuracy, satellite data for the same area have been obtained twice a year [52].
To identify the nature and scale of landscape transformations within the boundaries of all landscape parks, polygons representing land cover changes specified in the CLC database were analyzed using the ArcMap 10.3.1. The number and area of particular types of transformations were investigated with descriptive statistics as frequency of occurrence and total area of the indicated feature. In order to compare the scope of changes within the boundaries of landscape parks, the area of particular types of changes per 1000 ha of the landscape park’s area was also determined. The land cover changes revealed in the CLC database allowed to create a classification of landscape change types and subtypes within landscape parks during the analyzed periods. The classification includes 4 types of changes:
- (1)
- transformations within forest landscapes;
- (2)
- transformations of forest landscapes into non-forest landscapes;
- (3)
- transformations of non-forest landscapes into forest landscapes;
- (4)
- transformations within non-forest landscapes.
Within the classified types of changes, 18 subtypes have been identified (Table 2). Other possible types and subtypes of change, not listed in the classification below, were not observed in the landscape parks. The types of land cover changes were then assigned to the developed classification of landscape transformations in landscape parks. It should be stressed, however, that due to the limitations resulting from the specificity of the CLC database, the classification does not include types of land cover changes with an area of less than 5 ha.
Table 2.
Classification of types and subtypes of landscape changes in landscape parks.
2.3. Intensity of Landscape Changes in Lower Silesian Landscape Parks
In the second part of the research, 12 landscape parks in Lower Silesia were the subject of detailed analyses of landscape changes. For all the selected landscape parks, the number, types of changes, and their area, and in order to standardize the data, also the average area of changes per 1000 ha of the landscape park area, were identified. In the next stage, data from the CLC database were assigned to 12 selected landscape parks using the Intersect tool in ArcGIS. The maps for all landscape parks for four periods of time (48 maps in total) were the basis for further analyses aimed at determining the landscape change index (LCI). Example maps are presented in Figure 2.
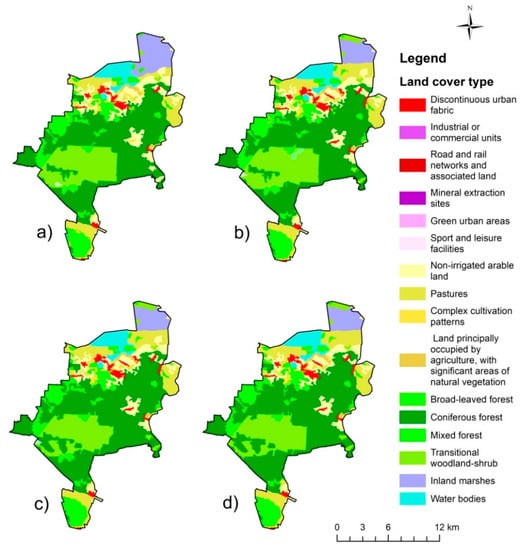
Figure 2.
Example of the analyzed land cover maps—Przemkowski Landscape Park: (a) 2000; (b) 2006; (c) 2012; (d) 2018.
In order to use the extracted data to determine the intensity of landscape transformations, the land cover categories included in the CLC database were reclassified. Within the most frequently used division into land cover classes [27,53], 10 main landscape components were identified. The area of each landscape component was the basis for calculating the landscape change index (LCI). A full classification of the main landscape components is included in Table 3.
Table 3.
Classification of the main landscape components in Lower Silesian landscape parks.
The next step was to create a database containing the percentage share of main landscape components in relation to the entire area of each landscape park during each of the time periods. The land cover maps, prepared for each time period on the basis of the CLC database, constituted the basis for this. In order to calculate the landscape change index (LCI) for each period, it was necessary to specify parameters that indicate changes in the percentage share of areas covered by the main landscape components. This was calculated as follows:
where CAi represents changes in the percentage share of areas covered by the main landscape components in relation to the total area of research (%); At+1 represents the area covered with the main landscape components during the time interval t + 1 (ha); At represents the area covered with the main landscape components during the time interval t (ha); and TA represents the total research area (ha).
CAi = 100 × (At+1 − At)/TA
This allowed us to determine the landscape change index (LCI) for each of the time intervals. The LCI is defined as the absolute values of change in the main landscape components that have the greatest impact on the landscape, assuming that both increases and decreases in these values cause noticeable changes in the landscape [40]. The index was calculated for each period by multiplying a factor of one-half by the sum of the absolute values of change in the percentage share of areas covered by the main landscape components in relation to the whole analyzed area. Summing the absolute values of change of the main landscape components essentially doubled the index, so the LCI included a factor of one-half to reflect the actual level of change. LCI was calculated as follows:
where LCIt represents the landscape change index in each time interval; and |CAi| represents the absolute value of the change in the percentage share of the areas covered by the main landscape elements in relation to the total research area.
In order to supplement knowledge concerning the changes that have taken place in the landscape parks of Lower Silesia, individual oral interviews were conducted with the field staff of the Lower Silesian Association of Landscape Parks. The purpose of the interviews was to obtain information on whether the identified changes were recorded, as well as to determine the reasons for the identified landscape transformations. Additionally, this allowed the driving forces of the most noticeable changes in the landscape to be determined. A total of 12 individual oral interviews were conducted. From each landscape park, an employee with the longest work experience in landscape protection and the longest period of time spent on guarding its area per week was selected. This was in accordance with generally accepted principles in land use change research, according to which the most valuable information about changes can be provided by the oldest people, with the longest relationship with the analyzed area [54,55,56]. The selected employees were local experts, because they have been associated with landscape protection for many years and have the appropriate education and knowledge to identify the changes that have taken place in the area of landscape parks.
3. Results
3.1. Landscape Changes in Landscape Parks in Poland
Analysis revealed a systematic increase in both the number of identified types of land cover transformations, as well as the number of polygons and the total area that was subject to changes (Table 4). The area of changes during the period 2012–2018 almost tripled in comparison with the period 2000–2006. The average size of changes per 1000 ha of the landscape park also increased. Therefore, it can be concluded that the dynamics of land cover changes in the areas of landscape parks in Poland is steadily increasing. However, due to the lower accuracy of land cover data for the year 2000 in the CLC database, the actual number and area of the identified changes in the polygons during the period 2000–2006 should be considered uncertain.
Table 4.
Indicators of change in land cover in landscape parks.
The analysis of the intensity of land cover changes in landscape parks in Poland showed that there is a large spatial diversity in this context. The indicator of the average size of changes per 1000 ha of the landscape park area obtained different values, depending on the considered period and park location in a given region (Figure 3). In the years 2000–2006, the indicator fluctuated between 0 and 38.04 ha of the area that changed, but it should be noted that, in the case of 25 landscape parks, no changes were observed. In the second of the analyzed periods, the value of the indicator ranged from 0 to 114.73 ha, with a value of above 40 ha recorded in seven landscape parks. No changes were recorded in 18 landscape parks. In the years 2012–2018, the indicator reached a value from 0 to 92.62 ha. Changes of more than 40 ha occurred in six landscape parks, and in only seven, no changes in land cover were identified. The average value of the indicator for the whole period, from 2000 to 2018, ranged from 0, in the case of four landscape parks, to 55.87 ha. The biggest changes took place within the Jezierzyca Valley Landscape Park in the Lower Silesia region. The highest change in land cover was found in one region—Upper Silesia—the most industrialized region in Poland.
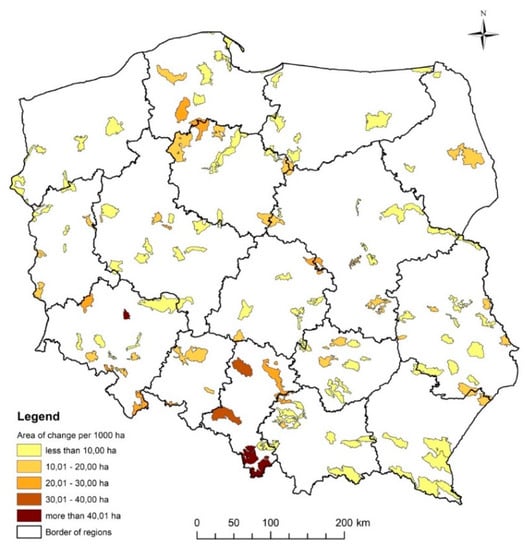
Figure 3.
Area of land cover change per 1000 ha of the landscape park—average value for the period 2000–2018.
The analysis of particular types and subtypes of landscape changes, identified in accordance with the proposed classification, proved that the nature of transformations within the boundaries of landscape parks in Poland has changed (Figure 4). During all the analyzed periods, transformations of forest landscapes dominated, accounting for 84% to 90% of all landscape changes in the areas of landscape parks in Poland. Within this type of landscape, however, temporary deforestation related to logging intensified, and the share of areas related to the forest maturation process decreased in consecutive periods. A similar situation was found in the case of the transformation of forest landscapes into non-forest landscapes, which involved permanent deforestation. In the group of transformations of non-forest landscapes into forests, associated with the process of afforestation and natural succession, this process concerned arable land in the same proportions as meadows and pastures only in the period 2012–2018. In the remaining periods, this type of change was mainly found in arable land. In the group of transformations within non-forest landscapes, the distribution of particular subtypes of landscape changes during each period was similar, with transformations between arable land and meadows and pastures dominating.
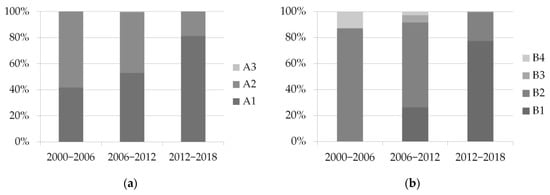
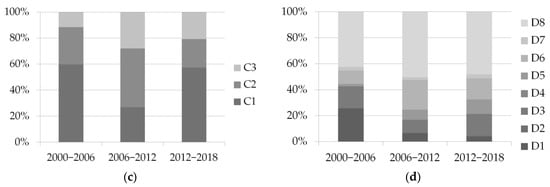
Figure 4.
Types and subtypes of landscape changes in landscape parks in Poland during three analyzed periods: (a) transformation within forest landscapes; (b) transformation from forest landscapes into non-forest landscapes; (c) transformation from non-forest landscapes into forest landscapes; (d) transformation within non-forest landscapes.
3.2. Intensity of Landscape Changes in Lower Silesian Landscape Parks
The results of the analyses related to the changes in the land cover during the analyzed periods showed that, among 12 landscape parks in Lower Silesia in the years 2000–2006, the largest changes were identified in the area of the Rudawski Landscape Park (25.16 ha/1000 ha of the landscape park), while in the Bóbr Valley Landscape Park and the Bystrzyca Valley Landscape Park, no changes were recorded. In the period 2006–2012, the highest intensity of changes in land cover, identified in the CLC database, were definitely that found in the Jezierzyca Valley Landscape Park (114.74 ha/1000 ha of the landscape park). No changes were recorded again in the Bystrzyca Valley Landscape Park. Meanwhile, in the years 2012–2018, there was an increase in the intensity of transformations in landscape parks, which in the previous period, were subject to fewer transformations. In this period, the largest rate of changes was identified in the Sudety Wałbrzyskie Landscape Park and in the Ślężański Landscape Park (40.49 and 39.83 ha/1000 ha of the landscape park, respectively), and the smallest was found in the “Chełmy” Landscape Park, where the indicator reached 3.8 ha/1000 ha of the landscape park area. An overview of the intensity of changes in particular landscape parks during the analyzed periods is presented in Figure 5.
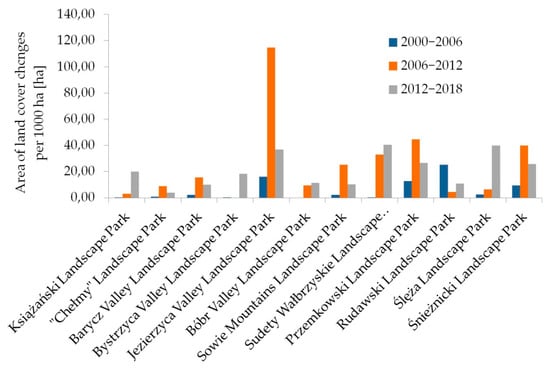
Figure 5.
Area of land cover changes per 1000 ha of the landscape park during the analyzed periods.
In all the analyzed periods, 91–92% of landscape changes within landscape parks were transformations inside forest landscapes. The share of particular subtypes of landscape changes varied, depending on the analyzed period. In this context, the share of temporary deforestation caused by natural catastrophes or forest management related to logging systematically increased, which during the period 2012–2018, reached 87.66% of all the changes in the forest landscapes. During the same period, a much greater diversity of subtypes of changes in non-forest landscapes, in comparison with other time periods, should be noted. Within the boundaries of three landscape parks—Sowie Mountains Landscape Park and Śnieżnicki Landscape Park, which include the Sudeten mountain ranges, and Ślężański Landscape Park. A full list of the types of changes can be found in Figure 6.
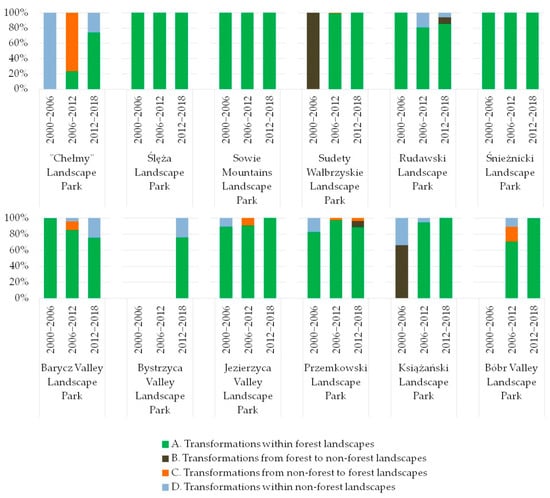
Figure 6.
Diversity of landscape change types in Lower Silesian landscape parks.
On the basis of four land cover maps, generated from the CLC database, showing the condition in four periods, for each of the landscape parks, the area covered by 10 main landscape components was compiled, in accordance with the proposed classification. Almost in each of the landscape parks, there was a systematic decrease in the area of land used for agriculture, which was gradually transformed into meadows. The phenomenon of land abandonment was observed in the years 2012–2018, especially in the Rudawski Landscape Park, where almost 450 ha were transformed in this direction. In the majority of landscape parks, the area of forest areas systematically increased. The exception was the Jezierzyca Valley Landscape Park, where the forest area decreased by 800 ha between 2006 and 2012, and the Sudety Wałbrzyskie Landscape Park, where the forest area decreased by over 500 ha between 2012 and 2018.
The calculation of the landscape change index (LCI) showed that the average level of landscape transformation intensity was the highest in the years 2012–2018. Landscape parks with the most intensive landscape changes included the Jezierzyca Valley Landscape Park, for which the LCI index of 11.18 was several times higher than in other case studies in the period 2006–2012. The situation is similar in the case of the Sudety Wałbrzyskie Landscape Park, for which the LCI was the highest in the period 2012–2018 and reached 11.01. The average value of the LCI index, including all landscape parks in Lower Silesia, had almost doubled, from 1.83 for the period 2006–2012 to 3.32 for the period 2012–2018. The highest increase in the intensity of transformations between these two periods occurred, in addition to the above-mentioned Sudety Wałbrzyskie Landscape Park, also in the Rudawski Landscape Park and the Ślężański Landscape Park. The lowest average LCI for the years 2006–2018 was found in the Bóbr Valley Landscape Park (0.63) and the Barycz Valley Landscape Park (0.77), where the scope of landscape transformations was the smallest in relation to the entire park area. The full list of LCI values is presented in Table 5.
Table 5.
Landscape change index (LCI) for all the analyzed periods.
The last stage of the research was oral interviews with the oldest employees of the Lower Association of Landscape Parks. Interviews were conducted with 12 employees, one residing in each of the landscape parks. There were three women and nine men among them. The average age of the interviewees was 50 years, and the average length of work experience in landscape protection was almost 19 years. The frequency of staying in the landscape park varied, depending on the nature of the work duties. Five interviewees declared that they stay in the landscape park every day, three at least three times a week, and another three at least once a week. In one case, the average frequency of field visits was much lower and equaled one time a month. The responses made it possible to obtain valuable information on the perceived changes in the landscape and their driving forces:
- (A)
- Landscape parks protecting lowland river valleys
- (1)
- Bystrzyca Valley Landscape Park: The interviewed person pointed out, as the most noticeable change in the non-forest landscapes of the whole area, that new areas of deposit mining have had the strongest impact on the landscape, especially those appearing in the last few years. The reason for this change is the rich deposits of sand and gravel in the river valley and the increased demand for this raw material. In the last few years there are also more and more residential development areas within the boundaries of the landscape park, especially in the northern part.
- (2)
- Jezierzyca Valley Landscape Park: The interviewee confirmed that the most noticeable and significant changes were found in forest landscapes. The transformations were the destruction of the forest area as a result of a storm, which took place in 2009. In recent years, the most frequent changes of the non-forest landscapes into forest landscapes, related to the process of natural forest succession in abandoned areas, have been observed.
- (3)
- Przemkowski Landscape Park: Transformations within forest landscapes, which relate to the process of the gradual overgrowing of heathland, with birches in the southern part of the landscape park, are noticeable during the whole period. For 10 years, there have been visible transformations of the non-forest landscapes into forest landscapes, associated with the afforestation of weak soils. The reason for this phenomenon is the availability of European Unionsubsidies for farmers. Since the beginning of the 21st century, a gradual overgrowth of ponds has been observed.
- (4)
- Barycz Valley Landscape Park: The most noticeable changes in the landscape, observed by the interviewed person, took place within non-forest landscapes. At the beginning of the 21st century, the changes were connected with new fishponds, created in arable land, and the gradual transformation of arable land into meadows. The promotion of the Barycz valley, as a place of exceptional value by numerous local government organizations, has resulted in the intensification of landscape changes relating to new buildings and road infrastructure over the last 10 years.
- (B)
- Landscape parks in highland areas
- (5)
- Książański Landscape Park: The observed changes relate to transformations within both forest landscapes and non-forest landscapes. A noticeable phenomenon is the abandonment of arable land, which gradually became overgrown and was transformed into meadows. Some of them have been afforested. Since 2016, there has been an increase in deforestation as a result of the hydrological drought in 2015 and a pest attack. This resulted in a significant thinning of the forest. In the last five years, increased tourist traffic and new built-up areas have been observed.
- (6)
- Bóbr Valley Landscape Park: The most frequently observed changes in the landscape are the transformation of non-forest landscapes into forest. The expansion of forests on abandoned arable land and former meadows, which gradually became overgrown as a result of the natural succession process, is observed. The number of small farms has decreased, and arable land has been merged. During the last 10 years, the tributaries of the Bóbr River have been regulated, and meadows have also been dried, which has contributed to a change in the water level in the Bóbr River.
- (7)
- Ślężański Landscape Park: Two basic phenomena are observed in this park—transformations within non-forest landscapes and transformations within forest landscapes. An increased intensification of changes, resulting from the creation of new built-up areas at the foot of Ślęża and other smaller hills, was observed, mainly in the years 2000–2006. Nowadays, this phenomenon has been limited. The reason indicated by the interviewee is a significant increase in land prices. Since 2017, there has been a noticeable increase in tree harvesting as a result of the change in the law.
- (8)
- “Chełmy” Landscape Park: Transformations relate mainly to non-forest landscapes. The most noticeable phenomenon is the abandonment of arable land, the cultivation of which, on fairly steep slopes, is becoming less and less profitable. These lands are gradually transformed into meadows. In the last five years, changes in the landscape relating to new built-up areas have intensified as a result of changes in the designation of land for development by the commune authorities.
- (C)
- Landscape parks in mountain areas
- (9)
- Sowie Mountains Landscape Park: Within this area, there are changes in the forest landscapes. The interviewee indicated the intensification of forest harvesting as a result of hydrological drought, which took place in the southern part of Lower Silesia in 2016.
- (10)
- Sudety Wałbrzyskie Landscape Park: The most significant changes took place within the forest landscapes. The interviewee indicated the intensification of forest harvesting as a result of hydrological drought, which took place in the southern part of Lower Silesia in 2016. In recent years, there has been an expansion of the area and intensification of melaphyre extraction.
- (11)
- Śnieżnicki Landscape Park: Within this area, increased forest harvesting as a result of hydrological drought, which took place in the southern part of Lower Silesia in 2016, was also indicated. In the last 10 years, there has been an intensification of changes related to the development of tourist infrastructure, especially in the region of the Black Mountain.
- (12)
- Rudawski Landscape Park: Transformations relate mainly to non-forest landscapes. The most noticeable phenomenon is the development of new dispersed buildings in the areas of meadows, located on the slopes of hills. The area of the landscape park is a popular place for the location of recreational houses, owned by richer city dwellers. An abandonment of arable land, which gradually transforms into meadows, is also observed.
4. Discussion
4.1. Intensity of Transformations and Processes in the Landscape Parks
The scale of changes within particular landscape parks in Poland differs from one to the next. There are landscape parks where the landscape has remained unchanged for years, while others are subject to strong transformations. Regional diversity is also visible. However, a gradual increase in the scale of transformations is noticeable, especially in the years 2012–2018. This confirms the constant trend indicated by other researchers in Europe [9,57] and other parts of the world (e.g., China) [58]. In this context, the scale of landscape transformations in Lower Silesian landscape parks stood at a relatively low level. The exception is the Jezierzyca Valley Landscape Park, where huge areas of forests were destroyed as a result of a natural catastrophe. The scale of landscape transformations within this landscape park is one of the largest in such protected areas in Poland. A high intensity of landscape changes is confirmed by the highest index of landscape change (LCI) among the analyzed landscape parks in the Lower Silesia. Of course, the intensity of landscape transformations is incomparable with changes taking place (e.g., in suburban or heavily urbanized areas) [59,60]. It should be noted, however, that the level of landscape dynamics within landscape parks differs between parks and the analyzed periods. This confirms the thesis of low landscape stability and difficulties in managing this type of protected areas, where the interests of various social groups clash with the need for landscape protection [61,62,63].
The most important processes, which are the most frequently indicated drivers of landscape changes in Europe, include the abandonment of arable land that transforms into meadows and slowly becomes overgrown as a result of natural succession, as well as deforestation and afforestation [27,37]. The results of the research fully confirm this. In the analyzed case studies, the most frequently observed changes were transformations within forest landscapes. They were mainly connected with natural processes, such as forest extinction, as a result of drought or sudden natural disasters. Significant changes also took place in non-forest landscapes. They were connected with the abandonment of land that was gradually transformed into meadows. However, land cover changes are stronger in Poland than in other Eastern European countries [11]. There is a noticeable increase in the intensification of tree harvesting, which has been taking place in Poland since 2017, not only in the context of the Białowieża Primeval Forest [64], but also in other forest areas, including various protected areas.
4.2. The Use of Indicator Methods in Monitoring Landscape Changes
The monitoring of landscape changes is one of the ways of implementing the provisions of the European Landscape Convention. Landscape analyses are of particular importance also in the context of land use policy development [65]. The need to develop methods in this area is also stressed by a number of researchers. The most frequently proposed methods for monitoring landscape changes are the use of appropriate indicators. In order to assess the intensity of transformations, the following indicators are used: changes in landscape metrics [29,66,67], indicators determining the dynamics of changes in individual land use types [68], or indicators determining changes in landscape visual character [69]. The proposed landscape change index (LCI) is in line with the global trend of searching for indicators enabling the monitoring of changes. The three methodological challenges adopted at the stage of the formulation of the indicator have been achieved. The development of an indicator that will make it possible to easily and quickly determine the intensity of landscape transformations was the first of the challenges. The landscape change index (LCI) is based on simple statistics, determining the percentage share of the area covered by the main landscape components. It allows the level of landscape change intensity to be determined based on generally available and cyclically collected data on land cover. The simplicity of obtaining the source data was the second challenge. The study used the Corine Land Cover database, where data for the whole of Europe are generally available and collected cyclically every six years. However, this is not the only source of data that can be used as a database for calculating the landscape change index. In other studies that use this index, the source data concerned different periods of time and were obtained on the basis of analyses of historical land cover maps [25] or analyses of aerial photographs, in the case of smaller scale areas [40], and satellite images for larger areas [70]. They also concerned different periods of time. The possibility of using the landscape change index to assess the intensity of landscape transformations for different types of areas was another methodological objective. The presented research results show the possibility of using the index to monitor transformations of protected areas. Other studies show that the indicator can be used for the analysis of transformations within suburban areas [19], highland and mountain areas [25], forest areas [34] or coastal areas [70], located in different countries, which confirms the wide possibilities of using the LCI. Based on cyclically collected data on land cover or satellite images, the indicator can also be used to assess the dynamics of landscape changes at the regional or national level. Continuous monitoring of landscape changes also provides information on trends in landscape changes and anticipates the intensity of future transformations.
4.3. Limitations and Further Research Directions
The use of indicator methods in landscape monitoring, which are based on data of natural areas and anthropogenic landscape components, forms the basis for sustainable landscape management. However, in order to be able to adapt the proposed landscape change index for wider use, it is necessary to consider the advantages and disadvantages of the developed method. The most important limitations of the research concerns primarily the nature of the proposed landscape change index, which is based on data on changes in landscape components, including various elements of land cover, but does not consider changes in the sociological and aesthetic values of the landscape. In this context, the use of the landscape change index needs to be supplemented by social studies on landscape perception. Current trends in landscape change research indicate the need to supplement research based on map analysis with direct oral interviews on the perception of landscape changes. This provides a more comprehensive view of landscape transformation and provides and complements information that is not taken into account in map-only analyses. The use of the method on a local scale, especially in areas with diverse terrain, should also take into account changes in topography that may result from natural processes or human activity. Another constraint is the need to obtain data during cyclical periods, and a comparison of the intensity of changes in different areas requires data from the same source, which are not always available. The use of the Corine Land Cover database, based on the analysis of satellite images for the European area, has some advantages but is also a source of some limitations. These are summarized in Table 6.
Table 6.
Pros and cons of using the Corine Land Cover database for monitoring landscape changes.
The results of the research show that in some landscape parks the CLC 2000 database almost did not show the existence of development areas at all, which indicates that data from 2000 have a lower accuracy. Due to the principles of mapping, the source database did not distinguish villages with a linear layout, which is reflected in a smaller area of built-up areas in mountain parks. In the period 2000–2006, the LCI reached the highest values for the Rudawski Landscape Park and the Bóbr Valley Landscape Park, but this result, considering the almost complete lack of development areas in the CLC data for 2000, is not plausible. The analysis of changes in particular landscape components showed that the data from the year 2000, due to deficiencies in the identification of some land cover categories, are of little use in determining the intensity of landscape changes. The results of the research proved that comparison of the analysis of the landscape transformation intensity, using the LCI index and the CLC source database, is possible only for data from the period 2006–2018.
Considering further directions of research on the methodology of the landscape change index in the monitoring of transformations, it is advisable to develop a model in GIS software that simplifies the calculation and generation of summaries of the area of particular landscape components on the basis of the CLC database. In case studies covering small areas, it is necessary to take greater account of sociological studies on the perception of landscape changes, which will supplement knowledge about the scope and types of transformations in the landscape and their driving forces. In subsequent studies, LCI can also be used to assess the intensity of transformations in peri-urban areas, as well as changes on a regional or national scale. The use of the CLC database for this purpose will make it possible to identify the landscapes that are changing the most on a European scale.
5. Conclusions
This research reflects the diversity of landscape changes that have taken place within the boundaries of landscape parks, the protection of which constitutes the most problematic form of landscape protection in Poland. Analyses of the scale and nature of landscape changes within the boundaries of 123 landscape parks during the period 2000–2018 and intensity of landscape transformations by using the landscape change index (LCI) in 12 Lower Silesian landscape parks allowed me to answer the research questions.
- The greatest diversity of landscape changes in Polish landscape parks, in terms of both the number and area of changes, was recorded in the years 2012–2018. The vast majority of changes in each period took place within forest landscapes and involved temporary deforestation related to the management of forest resources and natural disasters in the forest.
- Analyses of all 123 landscape parks show the increasing intensity of landscape transformations in subsequent analyzed periods. The most intensive changes occurred in the period 2012–2018.
- The systematic increase in the intensity of landscape transformations was confirmed by detailed research within landscape parks in Lower Silesia. The value of LCI was higher for the period 2012–2018 than for period 2006–2012. Such a result was observed in 9 of 12 landscape parks in Lower Silesia. While the detailed research covered only 12 case studies, they were so diverse that it was possible to validate the use of the LCI in monitoring of transformations of different types of landscapes.
- Data on land cover, collected every six years within the CLC database, were used for the analyses. However, due to the accuracy of land cover mapping, its usefulness for monitoring landscape changes on a local scale is limited, especially for data from CLC 2000.
- Cyclical calculation of LCI on the basis of the CLC database allow to monitor landscape changes starting from 2006 because not all land cover categories are correctly classified in the data from the year 2000. In particular, they concern the built-up area of linear villages in the mountain area.
- It is important to include social science methods to fully understand landscape transformations. Individual oral interviews with the field workers with the longest work experience in landscape parks revealed the main driving forces of landscape change.
- Nevertheless, thanks to two methodological achievements—the development and use of the landscape change index to assess the intensity and monitoring of landscape transformations in comparative studies of 12 case studies, as well as the use of social studies on the perception of the intensity of landscape changes—the research provided a comprehensive picture of landscape change in landscape parks in the 21st century. In this way, the combination of methods applied in different areas of science has made it possible to gain a broader understanding of the extent of the changes and the driving forces that have caused them. The knowledge, obtained in this way, will make it possible to take measures to protect and anticipate changes in the landscape in the future and to assess the effectiveness of the implemented protective measures in the case of protected areas.
Funding
This research was funded by the Ministry of Science and Higher Education (MNiSW, Poland). The funds were granted by the Wroclaw University of Environmental and Life Sciences in the framework of funds of research or development activities for the development of young scientists, grant number B030/0117/18.
Acknowledgments
I would like to thank all interviewees—employees of the Lower Silesian Association of Landscape Parks—who agreed to conduct direct oral interviews and provided important information on the intensity of landscape changes in landscape parks.
Conflicts of Interest
The author declares no conflict of interest. The funders had no role in the design of the study; in the collection, analyses, or interpretation of data; in the writing of the manuscript; or in the decision to publish the results.
References
- Vitousek, P.M.; Mooney, H.A.; Lubchenco, J.; Melillo, J.M. Human Domination of Earth’s Ecosystems. Science 1997, 277, 494–499. [Google Scholar] [CrossRef]
- Ellis, E.C. Ecology in an anthropogenic biosphere. Ecol. Monogr. 2015, 85, 287–331. [Google Scholar] [CrossRef]
- Lewis, J.L. Perceptions of landscape change in a rural British Columbia community. Landsc. Urban Plan. 2008, 85, 49–59. [Google Scholar] [CrossRef]
- Žibret, G.; Gosar, M.; Miler, M.; Alijagić, J. Impacts of mining and smelting activities on environment and landscape degradation—Slovenian case studies. Land Degrad. Dev. 2018, 29, 4457–4470. [Google Scholar] [CrossRef]
- Fiorini, L.; Zullo, F.; Marucci, A.; Romano, B. Land take and landscape loss: Effect of uncontrolled urbanization in Southern Italy. J. Urban. Manag. 2018. [Google Scholar] [CrossRef]
- Yu, D.; Wang, D.; Li, W.; Liu, S.; Zhu, Y.; Wu, W.; Zhou, Y. Decreased Landscape Ecological Security of Peri-Urban Cultivated Land Following Rapid Urbanization: An Impediment to Sustainable Agriculture. Sustainability 2018, 10, 394. [Google Scholar] [CrossRef]
- Bürgi, M.; Hersperger, A.M.; Scheenberger, N. Driving forces of landscape change—Current and new directions. Landsc. Ecol. 2004, 19, 857–868. [Google Scholar] [CrossRef]
- Long, H.; Heilig, G.K.; Li, X.; Zhang, M. Socio-economic development and land-use change: Analysis of rural housing land transition in the Transect of the Yangtse River, China. Land Use Policy 2007, 24, 141–153. [Google Scholar] [CrossRef]
- Antrop, M. Landscape change and the urbanization process in Europe. Landsc. Urban Plan. 2004, 67, 9–26. [Google Scholar] [CrossRef]
- Przybyła, K.; Kulczyk-Dynowska, A. Transformations of Tourist Functions in Urban Areas of the Karkonosze Mountains. IOP Conf. Ser. Mater Sci. Eng. 2017, 245, 072001. [Google Scholar] [CrossRef]
- Cegielska, K.; Noszczyk, T.; Kukulska, A.; Szylar, M. Hernik, J.; Dixon-Gough, R.; Sándor Jombach, S.; Valánszki, I.; Kovács, K.F. Land use and land cover changes in post-socialist countries: Some observations from Hungary and Poland. Land Use Policy 2018, 78, 1–18. [Google Scholar] [CrossRef]
- Bucała-Hrabia, A. Long-term impact of socio-economic changes on agricultural land use in the Polish Carpathians. Land Use Policy 2017, 64, 391–404. [Google Scholar] [CrossRef]
- Heffner, K. Zmiany przestrzenne na obszarach wiejskich w Polsce w okresie transformacji i po wejściu do Unii Europejskiej. In Obszary Wiejskie—Wiejska Przestrzeń i Ludność, Aktywność Społeczna i Przedsiębiorczość; Heffner, K., Klemens, B., Eds.; Studia KPZK PAN: Warsaw, Poland, 2016; Volume 167, pp. 12–27. [Google Scholar]
- Kaliszewski, A. Problems implementing the “National Program for Expanding of Forest Cover” following Poland’s accession to the European Union. For. Res. Pap. 2012, 73, 189–200. [Google Scholar] [CrossRef]
- Council of Europe, European Landscape Convention, Florence, 2000. ETS No. 176. Available online: http://conventions.coe.int/Treaty/en/Treaties/Html/176.htm (accessed on 20 January 2019).
- Krajewski, P. Wykorzystanie wskaźnika zmienności krajobrazu w audycie krajobrazowym. Infrastruktura Ekol. Terenów Wiejskich 2018, I/1, 89–104. [Google Scholar] [CrossRef]
- Kienast, F.; Frick, J.; van Strien, M.J.; Hunziker, M. The Swiss Landscape Monitoring Program—A comprehensive indicator set to measure landscape change. Ecol. Modell. 2015, 295, 136–150. [Google Scholar] [CrossRef]
- Martay, B.; Pearce-Higgins, J.W.; Harris, S.J.; Gillings, S. Monitoring landscape-scale environmental changes with citizen scientists: Twenty years of land use change in Great Britain. J. Nat. Conserv. 2018, 44, 34–42. [Google Scholar] [CrossRef]
- Krajewski, P. Landscape changes in selected suburban area of Bratislava (Slovakia). In Landscape and Landscape Ecology: Proceedings of the 17th International Symposium on Landscape Ecology; Halada, L., Baca, A., Boltizar, M., Eds.; Institute of Landscape Ecology, Slovak Academy of Sciences: Bratislava, Slovakia, 2016; pp. 110–117. [Google Scholar]
- Solon, J. Spatial context of urbanization: Landscape pattern and changes between 1950 and 1990 in the Warsaw metropolitan area, Poland. Landsc. Urban. Plan. 2009, 93, 250–261. [Google Scholar] [CrossRef]
- Liesovsky, J.; Bezak, P.; Spulerova, J.; Liesovsky, T.; Koleda, P.; Dobrovodska, M.; Bürgi, M.; Gimmi, U. The abandonment of traditional agricultural landscape in Slovakia—Analysis of extent and driving forces. J. Rural Stud. 2015, 37, 75–84. [Google Scholar] [CrossRef]
- Frayer, J.; Müller, D.; Sun, Z.; Munroe, D.K.; Xu, J. Processes Underlying 50 Years of Local Forest-Cover Change in Yunnan, China. Forests 2014, 5, 3257–3273. [Google Scholar] [CrossRef]
- Krajewski, P.; Solecka, I.; Mrozik, K. Forest Landscape Change and Preliminary Study on Its Driving Forces in Ślęża Landscape Park (Southwestern Poland) in 1883–2013. Sustainability 2018, 10, 4526. [Google Scholar] [CrossRef]
- Wozniak, M.; Leuven, R.; Lenders, H.J.R.; Chmielewski, T.J.; Geerling, G.W.; Smits, A.J.M. Assessing landscape change and biodiversity values of the Middle Vistula river valley, Poland, using BIO-SAFE. Landsc. Urban Plan. 2009, 92, 210–219. [Google Scholar] [CrossRef]
- Krajewski, P. Assessing changes in high-value landscape—Case study of the municipality of Sobotka in Poland. Pol. J. Environ. Stud. 2017, 26, 2603–2610. [Google Scholar] [CrossRef]
- Kubacka, M.; Bródka, S.; Macias, A. Selecting agri-environmental indicators for monitoring and assessment of environmental management in the example of landscape parks in Poland. Ecol. Indic. 2016, 71, 377–387. [Google Scholar] [CrossRef]
- Bürgi, M.; Bieling, C.; von Hackwitz, K.; Kizos, T.; Liesovsky, J.; Martin, M.G.; McCarthy, S.; Müller, M.; Plieninger, T.; Printsmann, A. Processes and driving forces in changing cultural landscapes across Europe. Landsc. Ecol. 2017, 32, 2097–2112. [Google Scholar] [CrossRef]
- Kaligarič, M.; Sedonja, J.; Šajna, N. Traditional agricultural landscape in Goričko Landscape Park (Slovenia): Distribution and variety of riparian stream corridors and patches. Landsc. Urban Plan. 2008, 85, 71–78. [Google Scholar] [CrossRef]
- Kubacka, M. Evaluation of the ecological efficiency of landscape protection in areas of different protection status. A case study from Poland. Landsc. Res. 2018, in press. [Google Scholar] [CrossRef]
- Seto, K.; Fragkias, M. Quantifying Spatiotemporal Patterns of Urban Land-use Change in Four Cities of China with Time Series Landscape Metrics. Landsc. Ecol. 2005, 20, 871–888. [Google Scholar] [CrossRef]
- Kumar, M.; Denis, D.M.; Singh, S.K.; Szabó, S.; Suryavanshi, S. Landscape metrics for assessment of land cover change and fragmentation of a heterogeneous watershe. Remote Sens. Appl. Soc. Environ. 2018, 10, 224–333. [Google Scholar] [CrossRef]
- Hersperger, A.M.; Bürgi, M. Driving forces of landscape change in the urbanizing Limmat valley, Switzerland. In Modelling Land-Use Change; Springer: Dordrecht, The Netherlands, 2007; pp. 45–60. [Google Scholar]
- Zewdie, M.; Worku, H.; Bantider, A. Temporal Dynamics of the Driving Factors of Urban Landscape Change of Addis Ababa During the Past Three Decades. Environ. Manag. 2018, 61, 132–146. [Google Scholar] [CrossRef]
- Szabo, P. Driving forces of stability and change in woodland structure: A case-study from the Czech lowlands. For. Ecol. Manag. 2010, 259, 650–656. [Google Scholar] [CrossRef]
- Seabrook, L.; McAlpine, C.; Fensham, R. Cattle, crops and clearing: Regional drivers of landscape change in the Bridglow Belt, Queensland, Australia, 1840–2004. Landsc. Urban. Plan. 2006, 78, 373–385. [Google Scholar] [CrossRef]
- Skokanová, H.; Falťan, V.; Havlíček, M. Driving forces of main landscape change processes from past 200 years in Central Europe—Differences between old democratic and post-socialist countries. Ekológia 2016, 35, 50–65. [Google Scholar] [CrossRef]
- Plieninger, T.; Draux, H.; Fagerholm, N.; Bieling, C.; Bürgi, M.; Kizos, T.; Kuemmerle, T.; Primdahl, J.; Verburg, P.H. The driving forces of landscape change in Europe: A systematic review of the evidence. Land Use Policy 2016, 57, 204–214. [Google Scholar] [CrossRef]
- Munteanu, C.; Kuemmerle, T.; Boltiziar, M.; Butsic, V.; Gimmi, U.; Lúboš, H.; Kaim, D.; Király, G.; Konkoly-Gyuró, É.; Kozak, J.; et al. Forest and agricultural land change in the Carpathian region—A meta-analysis of long-term patterns and drivers of change. Land Use Policy 2014, 38, 685–697. [Google Scholar] [CrossRef]
- Aldwaik, S.Z.; Pontius, R.G., Jr. Intensity analysis to unify measurements of size and stationarity of land changes by interval, category, and transition. Landsc. Urban Plan. 2012, 106, 103–114. [Google Scholar] [CrossRef]
- Krajewski, P. Landscape change index as a tool for spatial analysis. J. IOP Mater. Sci. Eng. 2017, 245, 072014. [Google Scholar] [CrossRef]
- Łowicki, D. Land use changes in Poland during transformation: Case study of Wielkopolska region. Landsc. Urban Plan. 2008, 87, 279–288. [Google Scholar] [CrossRef]
- Szewrański, S.; Chruściński, J.; Van Hoof, J.; Kazak, J.K.; Świąder, M.; Tokarczyk-Dorociak, K.; Żmuda, R. A Location Intelligence System for the Assessment of Pluvial Flooding Risk and the Identification of Storm Water Pollutant Sources from Roads in Suburbanised Areas. Water 2018, 10, 746. [Google Scholar] [CrossRef]
- Bastian, O.; Grunewald, K.; Syrbe, R.-U.; Waltz, U.; Wende, W. Landscape services: The concept and its practical relevance. Landsc. Ecol. 2014, 29, 1463–1479. [Google Scholar] [CrossRef]
- Nowak, A.; Grunewald, K. Landscape sustainability in terms of landscape services in rural areas: Exemplified with a case study area in Poland. Ecol. Indic. 2018, 94, 12–22. [Google Scholar] [CrossRef]
- Celestino, E.F.; Celestino, L.F.; Silva, J.F.M.; Kashiwaqui, E.A.L.; Makrakis, M.C.; Makrakis, S. Environmental assessment in neotropical natersheds: A multi-factorial approach. Sustainability 2019, 11, 490. [Google Scholar] [CrossRef]
- Yaeger, C.D.; Steiger, T. Applied geography in a digital age: The case for mixed methods. Appl. Geogr. 2013, 39, 1–4. [Google Scholar] [CrossRef]
- Martínez-Sastre, R.; Ravera, F.; González, J.A.; López Santiago, C.; Bidegain, I.; Munda, G. Mediterranean landscapes under change: Combining social multicriteria evaluation and the ecosystem services framework for land use planning. Land Use Policy 2017, 67, 472–486. [Google Scholar] [CrossRef]
- Fagerholm, N. Käyhkö; N; Ndumbaro, F.; Khamis, M. Community stakeholders’ knowledge in landscape assessments—Mapping indicators for landscape services. Ecol. Indic. 2012, 18, 421–433. [Google Scholar] [CrossRef]
- Chmielewski, T.J.; Myga-Piątek, U.; Solon, J. Typologia aktualnych krajobrazów Polski. Przegląd Geograficzny 2015, 87, 377–408. [Google Scholar] [CrossRef]
- Parliament’s Chancellery. Nature Conservation Act from 16 April 2004. J. Laws 2018, 1614, 1–145. [Google Scholar]
- Parliament’s Chancellery. Act on amending certain acts in connection with the strengthening of landscape protection tools from 24 April 2015. J. Laws 2015, 774, 1–35. [Google Scholar]
- Bielecka, E.; Ciołkosz, A. Baza danych o pokryciu terenu w Polsce CLC-2006. Polski Przegląd Kartograficzny 2009, 41, 227–236. [Google Scholar]
- Bagan, H.; Yamagata, Y. Land-cover change analysis in 50 global cities by using a combination of Landsat data and analysis of grid cells. Environ. Res. Lett. 2014, 9, 064015A. [Google Scholar] [CrossRef]
- Santana-Cordero, A.M.; Monteiro-Quintana, M.L.; Hernandez-Calvento, L. Reconstruction of the land uses that led to the termination of an arid coastal dune system: The case of the Guanarteme dune system (Canary Islands, Spain), 1834–2012. Land Use Policy 2016, 55, 73–85. [Google Scholar] [CrossRef]
- Oba, G.; Kaitira, L.M. Herder knowledge of landscape assessments in arid rangelands in northern Tanzania. J. Arid Environ. 2006, 66, 168–186. [Google Scholar] [CrossRef]
- Konkoly-Gyuró, É. Conceptualisation and perception of the landscape and its changes in a transboundary area. A case study of the Southern German-French borderland. Land Use Policy 2018, 79, 556–574. [Google Scholar] [CrossRef]
- Van Vliet, J.; de Groot, H.L.F.; Rietveld, P.; Verburg, P.H. Manifestations and underlying drivers of agricultural land use change in Europe. Landsc. Urban Plan. 2015, 133, 24–36. [Google Scholar] [CrossRef]
- Fan, Q.; Ding, S. Landscape pattern changes at a county scale: A case study in Fengqiu, Henan Province, China from 1990 to 2013. CATENA 2016, 137, 152–160. [Google Scholar] [CrossRef]
- García-Nieto, A.P.; Geijzendorffer, I.R.; Baró, F.; Roche, P.K.; Bondeau, A.; Cramer, W. Impacts of urbanization around Mediterranean cities: Changes in ecosystem service supply. Ecol. Indic. 2018, 91, 589–606. [Google Scholar] [CrossRef]
- Li, H.; Peng, J.; Yanxu, L.; Yi’na, H. Urbanization impact on landscape patterns in Beijing City, China: A spatial heterogeneity perspective. Ecol. Indic. 2017, 82, 50–60. [Google Scholar] [CrossRef]
- Sowińska-Świerkosz, B.; Soszyński, D. Landscape structure versus the effectiveness of nature conservation: Roztocze region case study (Poland). Ecol. Indic. 2014, 43, 143–153. [Google Scholar] [CrossRef]
- Kistowski, M. Wybrane Aspekty Zarządzania Ochroną Przyrody w Parkach Krajobrazowych; Uniwersytet Gdański: Gdańsk, Poland, 2004. [Google Scholar]
- Krajewski, P. Problemy planistyczne na terenach parków krajobrazowych w sąsiedztwie Wrocławia na przykładzie Ślężańskiego Parku Krajobrazowego. Prace Naukowe Uniwersytetu Ekonomicznego Wrocłąwiu 2014, 267, 147–154. [Google Scholar] [CrossRef]
- Mikusiński, G.; Bubnicki, J.W.; Churski, M.; Czeszczewik, D.; Walankiewicz, W.; Kuijper, D.P.J. Is the impact of loggings in the last primeval lowland forest in Europe underestimated? The conservation issues of Białowieża Forest. Biol. Conserv. 2018, 227, 266–274. [Google Scholar] [CrossRef]
- Solecka, I.; Raszka, B.; Krajewski, P. Landscape analysis for sustainable land use policy: A case study in the municipality of Popielów, Poland. Land Use Policy 2018, 75, 116–126. [Google Scholar] [CrossRef]
- Lausch, A.; Herzog, F. Applicability of landscape metrics for the monitoring of landscape change: Issues of scale, resolution and interpretability. Ecol. Indic. 2002, 2, 3–15. [Google Scholar] [CrossRef]
- Walz, U. Indicators to monitor the structural diversity of landscapes. Ecol. Modell. 2015, 295, 88–106. [Google Scholar] [CrossRef]
- Liu, Y.; Luo, T.; Liu, Z.; Kong, X.; Li, J.; Tan, R. A comparative analysis of urban and rural construction land use change and driving forces: Implications for urban-rural coordination development in Wuhan, Central China. Habitat Int. 2015, 47, 113–125. [Google Scholar] [CrossRef]
- Martín, B.; Ortega, E.; Martino, P.; Otero, I. Inferring landscape change from differences in landscape character between the current and a reference situation. Ecol. Indic. 2018, 90, 584–593. [Google Scholar] [CrossRef]
- Cheng, M.; Huang, B.; Kong, L.; Ouyang, Z. Ecosystem Spatial Changes and Driving Forces in the Bohai Coastal Zone. Int. J. Environ. Res. Public Health 2019, 16, 536. [Google Scholar] [CrossRef] [PubMed]
© 2019 by the author. Licensee MDPI, Basel, Switzerland. This article is an open access article distributed under the terms and conditions of the Creative Commons Attribution (CC BY) license (http://creativecommons.org/licenses/by/4.0/).