Cost-Effective Options for the Renovation of an Existing Education Building toward the Nearly Net-Zero Energy Goal—Life-Cycle Cost Analysis


School of Architecture, Planning and Preservation, University of Maryland, College Park, MD 20742, USA
Sustainability 2019, 11(8), 2444; https://doi.org/10.3390/su11082444
Submission received: 3 April 2019
/
Revised: 19 April 2019
/
Accepted: 20 April 2019
/
Published: 25 April 2019
(This article belongs to the Collection Green Building Technologies)
Abstract
:A comprehensive case study on life-cycle cost analysis (LCCA) was conducted on a two- story education building with a projected 40-year lifespan in College Park, Maryland. The aim of this paper was to (1) create a life cycle assessment model, using an education building to test the model, (2) compare the life cycle cost (LCC) of different renovation scenarios, taking into account added renewable energy resources to achieve the university’s overall carbon neutrality goal, and (3) verify the robustness of the LCC model by conducting sensitivity analysis and studying the influence of different variables. Nine renovation scenarios were constructed by combining six renovation techniques and three renewable energy resources. The LCCA results were then compared to understand the cost-effective relation between implementing energy reduction techniques and renewable energy sources. The results indicated that investing in energy-efficient retrofitting techniques was more cost-effective than investments in renewable energy sources in the long term. In the optimum scenario, renovation and renewable energy, when combined, produced close to a 90% reduction in the life cycle cost compared to the baseline. The payback period for the initial investment cost, including avoided electricity costs, varies from 1.4 to 4.1 years. This suggests that the initial investment in energy-efficient renovation is the primary factor in the LCC of an existing building.
1. Introduction
A net-zero energy building is a building that can generate the same amount of energy onsite through locally available renewable sources as the building consumes. The first set of official net-zero energy building definitions was proposed in 2006, by researchers at the National Renewable Energy Laboratory. Four types of net-zero energy building were proposed: Net-zero site energy (NESE), net-zero source energy (NZSE), net-zero energy cost (NZEC), and net-zero energy emissions (NZEE) (Torcellini 2006). These have become the common set of definitions used in the United States. In this study, the net-zero energy building (NZEB) is defined as having net-zero site energy. A NZEB can be achieved through three steps: (1) Reduce the energy consumption of buildings through low-cost passive design strategies; (2) use energy-efficient equipment, appliances, and building systems; and (3) generate energy onsite through renewable energy resources. Regarding the first step, passive design strategies include optimizing solar gain and increasing thermal properties and natural ventilation. The renewable energy sources mentioned in the third step involve solar thermal, photovoltaic systems as well as geothermal and biomass energy sources.
Based on the United States 2015 Commercial Building Energy Consumption Survey [1] results, the majority of educational buildings in the U.S. are at least 50 years-old. More than 50% of educational buildings are close to the end of their service life and decisions need to be made to determine whether to building a new building or renovate the existing buildings.
Meanwhile, this existing building stock presents a large renovation market in the United States and Europe. In 2015, the EU renovation market was worth approximately $123 billion (€109 billion), which comprised 57% of its total construction market [2]. In the United States, home improvements and repairs are projected to be worth $340 billion in 2018, which is a 7.5% increase from 2017 [3]. Consequently, the renovation of existing buildings is key to the successful reduction of energy consumption of and carbon emissions caused by the building industry. There are three different levels of renovation: (1) Minor renovations implement one or two renovation techniques (RT), such as replacing a boiler, and result in a reduction of energy consumption between 0% and 30%; (2) moderate renovations result in a 30% to 60% energy consumption reduction that is typically achieved by implementing three to five renovation techniques; and (3) an extensive renovation, or deep renovation, can lead to an energy reduction of 60% to 90% [4]. After a deep renovation, the renovated building has such low energy consumption that it becomes possible for the building to achieve the net-zero goal if renewable energy resources are available onsite. The extent to which an existing building can reduce its energy consumption depends on the depth of the renovation. A deep renovation of existing buildings, together with new energy-efficient construction and a nearly net-zero energy target, could save 80% of the final energy consumption consumed by the building industry [5].
Often, renovation decisions will be made based on the balance between initial cost and long-term cost savings. Several studies have focused on cost-optimal renovation strategies. For instance, Niemela et al. determined that a nearly zero-energy building (nZEB) target can be cost-effectively achieved in renovations and that modern renewable energy production technologies are cost-efficient and recommendable [6]. Additionally, Ferreira et al. (2016) studied a multifamily building located in Porto, Portugal, and concluded that the lowest cost of a nearly zero-energy building is possible to be achieved through the introduction of renewables to buildings that meet the cost-optimal levels. Ferrara et al. (2016) studied renovation trends in Europe with a focus on nearly zero-energy. They found that all EU member states had actively researched this area; however, the adoption of a cost-optimal approach occurred at a slower rate. Therefore, renovation with a nearly zero energy target did not become a focal research topic until 2014. To date, there has been limited research conducted to determine the effectiveness of different renovation alternatives from a life cycle cost perspective, and few studies have examined the effectiveness of integrating renewable energy resources in renovations. This research gap may explain the wide range in sustainable building renovation costs [7]. Based on a literature review conducted using the Scopus database and Google research tools, Ferrara et al. (2018) found that the most studied building type was residential buildings (68%); within nonresidential buildings, 18% were office buildings, 5% were retail, and only 4% were schools. Collectively, there is a large need for further studies of cost-optimal renovation, especially in the less-studied building types.
The aim of this research project was to (1) create a life-cycle assessment model and use an education building to test the model, (2) compare the life-cycle cost (LCC) of different renovation scenarios, taking into account the addition of renewable energy resources to achieve the university’s overall carbon neutrality goal, (3) and verify the robustness of the LCC model by conducting sensitivity analysis and understanding the influence of different variables.
2. Methodology and Tools
Life-cycle cost analysis (LCCA) is an economic method of project evaluation in which all costs accumulated from all life stages of a building are considered as potentially important to the decision. Those life stages include construction, operation, maintenance, and demolition. LCCA provides significantly better assessments of the long-term cost-effectiveness of renovation investment than alternative economic methods that only focus on initial costs [8]. Furthermore, LCCA helps to compare and determine which energy renovation strategies are economically justified from the investor’s (i.e., client’s) perspective based on energy consumption reduction and other cost measurements.
The life-cycle cost analysis applied in this research project was built on the LCCA approach developed by the National Institute of Standards and Technology (NIST) and adopted by the U.S. Department of Energy’s Federal Energy Management Program (FEMP) for evaluating energy conservation investment in all federal buildings [8]. Since the University of Maryland is a state-owned university and all facilities are state property, following the federal standard is an appropriate approach. The life cycle cost (LCC) can be calculated either in present-value or annual-value terms. Present-value terms require all future costs to be discounted to their present-value equivalent while the latter method amortizes those future costs evenly over the study period [9]. In this research project, the present-value method is deployed for its simplicity and practicality [8,9].
The general formula used for the LCC present-value model is Equation (1):
where LCC equals the total life-cycle cost in present-value dollars of a given renovation scenario (RS). IC indicates the present-value investment costs, RepC is the present-value capital replacement costs, OC is the present-value operating energy cost, and MRC is the present-value maintenance and repair costs.
2.1. Investment Costs (IC)
The investment costs include all costs spent on (1) the building systems (structure, HAVA, building envelope, etc.); (2) the process of producing, transporting, and assembling all building components onsite; (3) installation labor; and (4) the utilities and energy spent on construction. In this project, all initial investment costs were assumed to be incurred at the beginning of the study period [8]. Furthermore, the investment cost was calculated based on the combination of available renovation techniques (RT) explained in later sections.
2.2. Replacement Costs (RepC)
Replacement costs are the planned expenditures for major building systems, such as heating ventilation air-conditioning (HVAC) systems and water supply systems, to keep the building in operation. RepC is to be discounted to its present value, prior to the addition of the LCC total, using Equation (2) [8]:
where d is the discount rate (interest rate), t is the year, and n represents a specific year when the present value is calculated. PV indicates the present value and F is the future case amount occurring at the end of the year n [9]. For instance, if the discount rate is 5%, then the present value of a cash amount of $78.35 today receivable at the end of the fifth year will be $100. For a decision-maker, those two amounts are time equivalent. Therefore, they will not have a preference between $78.35 received today and $100 received at the end of five years. In this study, the replacement frequency for HVAC systems and the water supply system is once during a 40-year lifespan, window replacement is once per 20 years, and other building components are assumed not to be replaced, with a discount rate of 3%.
2.3. Operating Costs (OC)
Operating costs include the cost of normal electricity use, water consumption, and other expenditures, such as custodial and insurance. Operating costs are annual costs that exclude maintenance and repair and other costs not directly related to the operation. The value is also adjusted to the present value using Equation (3):
where d is the interest rate (%), n is the study period of the analysis (years), PV is the present value, and PA is the annual recurring operating cost. The data used for annual recurring operating costs were based on simulation results explained in later sections.
2.4. Maintenance and Repair Costs (MRC)
Maintenance costs are planned/scheduled costs associated with the upkeep of the facility, for example, the annual inspection of the HVAC and roofing systems is a typical maintenance cost. Repair costs include expected and unanticipated expenditures required to prolong the life of a building system and thus avoid replacing the system [10]. Certain MRCs are incurred annually and others less frequently. In our calculation, for simplicity we treat MRCs as a fixed annual cost. The data used for MRCs were extracted from the UMD facility management database, which includes records for the past 20 years for similar academic buildings.
2.5. Tools
The program employed for LCCA in this research project was Building Life Cycle Cost (BLCC), version 5.3-18, which was developed by NIST. It conducts economic analyses by evaluating the relative cost-effectiveness of alternative buildings or building-related systems and components. It is particularly suitable for evaluating the costs and benefits of energy conservation and renewable energy projects [11,12,13,14,15].
3. Reference Building
The two-story building is located in the State of Maryland with a total floor area of 6517 m2 (70,150 ft2). The main building façade faces south and north and there are large skylights on the roof as well. This building is multi-functional and includes a 200-seat auditorium, offices, classrooms, library, computer labs and gallery space. The majority of classrooms are placed around the two-story atrium space (refer to floor plan in Figure 1) and offices are arranged on the second floor around a shaded courtyard. Most rooms have windows and views to outdoors. The building was initially completely in 1972, but since then several renovations and upgrades have taken place in the library, auditorium and office areas in 1997, 1998, 2007 and 2009. The facility management office estimate the total cost of demolishing the existing building and building new is around $36,391,731 ($518/ft2), while renovating the existing building would cost about $26,565,950 ($379/ft2) [16].
3.1. Construction and Building Envelope
The original building facade is composed of composite brick veneer with two tiers of concrete masonry unit (CMU). Since there is no insulation or air space in the existing exterior wall, the existing R-value is as low as 10 w/m2/°C (1.90 Btus/ft2 hr °F). This is far below the current building code requirement (ASHRAE 2016). Based on the original construction document, the existing roof has an R-value of 28.3 w/m2/°C (5.0 Btus/ft2 hr °F), which is also far below the current code requirement of R-30 according to ASHRAE 2016. The majority of existing windows are the original units: Single-pane uninsulated glass with steel frames. Some of the large glass doors on the ground floor have been replaced with double panel glass during the multiple renovations. However, most window units have a U-value of approximately 7.3 w/m2/°C (1.29 Btus/ft2 hr °F) and do not meet the current energy-efficiency standards. The biggest problem is that the existing building envelope condition falls well below the current building energy code requirements. Major renovation, retrofitting and upgrade work could not only prolong the life span of the building, but also present large opportunities for conserving energy in a more cost-effective way.
3.2. Building System and Renewable Energy System
The heating for the building is supplied by several central utility plants: Hot water is delivered into the building, and the centralized environmental control system in the building supply the heating in the winter by circulating the hot water. In the basement there are seven air-handling units that supply cool air to 16 different zones within the building. The recorded annual energy consumption between 2015 and 2017 was, 148 KWh/m2 (47.13 KBTu/ft2). The current lighting system is composed of fluorescent lamps (T8) and some LED lightings in the atrium space and library. There is no separate ventilation system: Air renewal is executed through the opening of windows and doors and natural infiltration. Overall, indoor lighting is satisfactory due to the combination of sufficient daylight through large windows and skylights, and the electric lighting fixtures. There is no renewable energy source to the existing building.
4. Model Framework and Analysis
4.1. Renovation Techniques’ Targeted Energy-Saving Goals
The University of Maryland is committed to reduce carbon emission by 50% by 2020 and 60% by 2025, from 2005 levels [17]. The university has made good progress since 2005: The carbon emission was reduced by 27% in 2015, while the construction has grown by 11%. The overall campus energy use was reduced by 20% in 2015 compared to 2005 levels [18]. The future goal is to reduce the energy consumption by another 20% in all existing building by 2030 [17]. This research project is mainly focusing on building envelope renovation. Nine different renovation scenarios (RS) are defined, which reduce the current operating energy consumption by 35% to 80% without compromising other building quality. For instance, in RT1, replacing all existing windows with low-emissivity window units could help to reduce energy use by minimizing the amount of ultraviolet and infrared light that passes through glass, while still providing sufficient daylight. Each scenario includes multiple commonly used renovation techniques (RT) that primarily focus on building envelope retrofitting. These techniques were summarized and extracted based on highly influential and frequently cited studies [6,19,20,21,22]. The six renovation techniques are as follows:
- RT1: Replace all existing windows/doors with double-glazed low-emissivity units
- RT2: Apply additional insulation to the existing roof (R-50)
- RT3: Apply additional insulation to the inside face of exterior walls (add additional three-inch insulation panels, R-38); refer to Figure 2
- RT4: Apply additional insulation to the interior walls (partition wall).
- RT5: Reduce air infiltration by concealing all leakage (air infiltration rate, 0.3 L/s·m2)
- RT6: Use LED lighting throughout the entire building
RT3 involves applying the additional insulation to the inside face of exterior wall, while in RT4 insulation is added to the interior wall (interior walls are those partition walls separating different rooms and space). RT5 conceals all the areas for potential air leakage without replacing existing windows. This is one of most affordable renovation strategies to conserve energy. Replacing windows and doors is one way to make a building more air tight. There are other methods to air seal buildings without replacing the windows, since air could leak through windows, doors, attic access, recessed lighting, fireplace and exhaust fan. The air sealing techniques used for air sealing could include using low-expansion spray foam or foam sealant on larger gaps around windows, baseboards, and other places where air may leak out; using sheet metal or sheetrock and furnace cement caulk to seal around fireplace chimneys or furnaces; and installing foam gaskets behind outlets and switch plates on walls [11].
In this research, the three levels of energy reduction that address the UMD carbon neutral goal are as follows:
- L1: Reduce energy consumption by 35% compared to the existing condition (baseline)
- L2: Reduce energy consumption by 65% compared to the existing condition (baseline)
- L3: Reduce energy consumption by 80% compared to the existing condition (baseline).
4.2. Energy Model Method and Framework
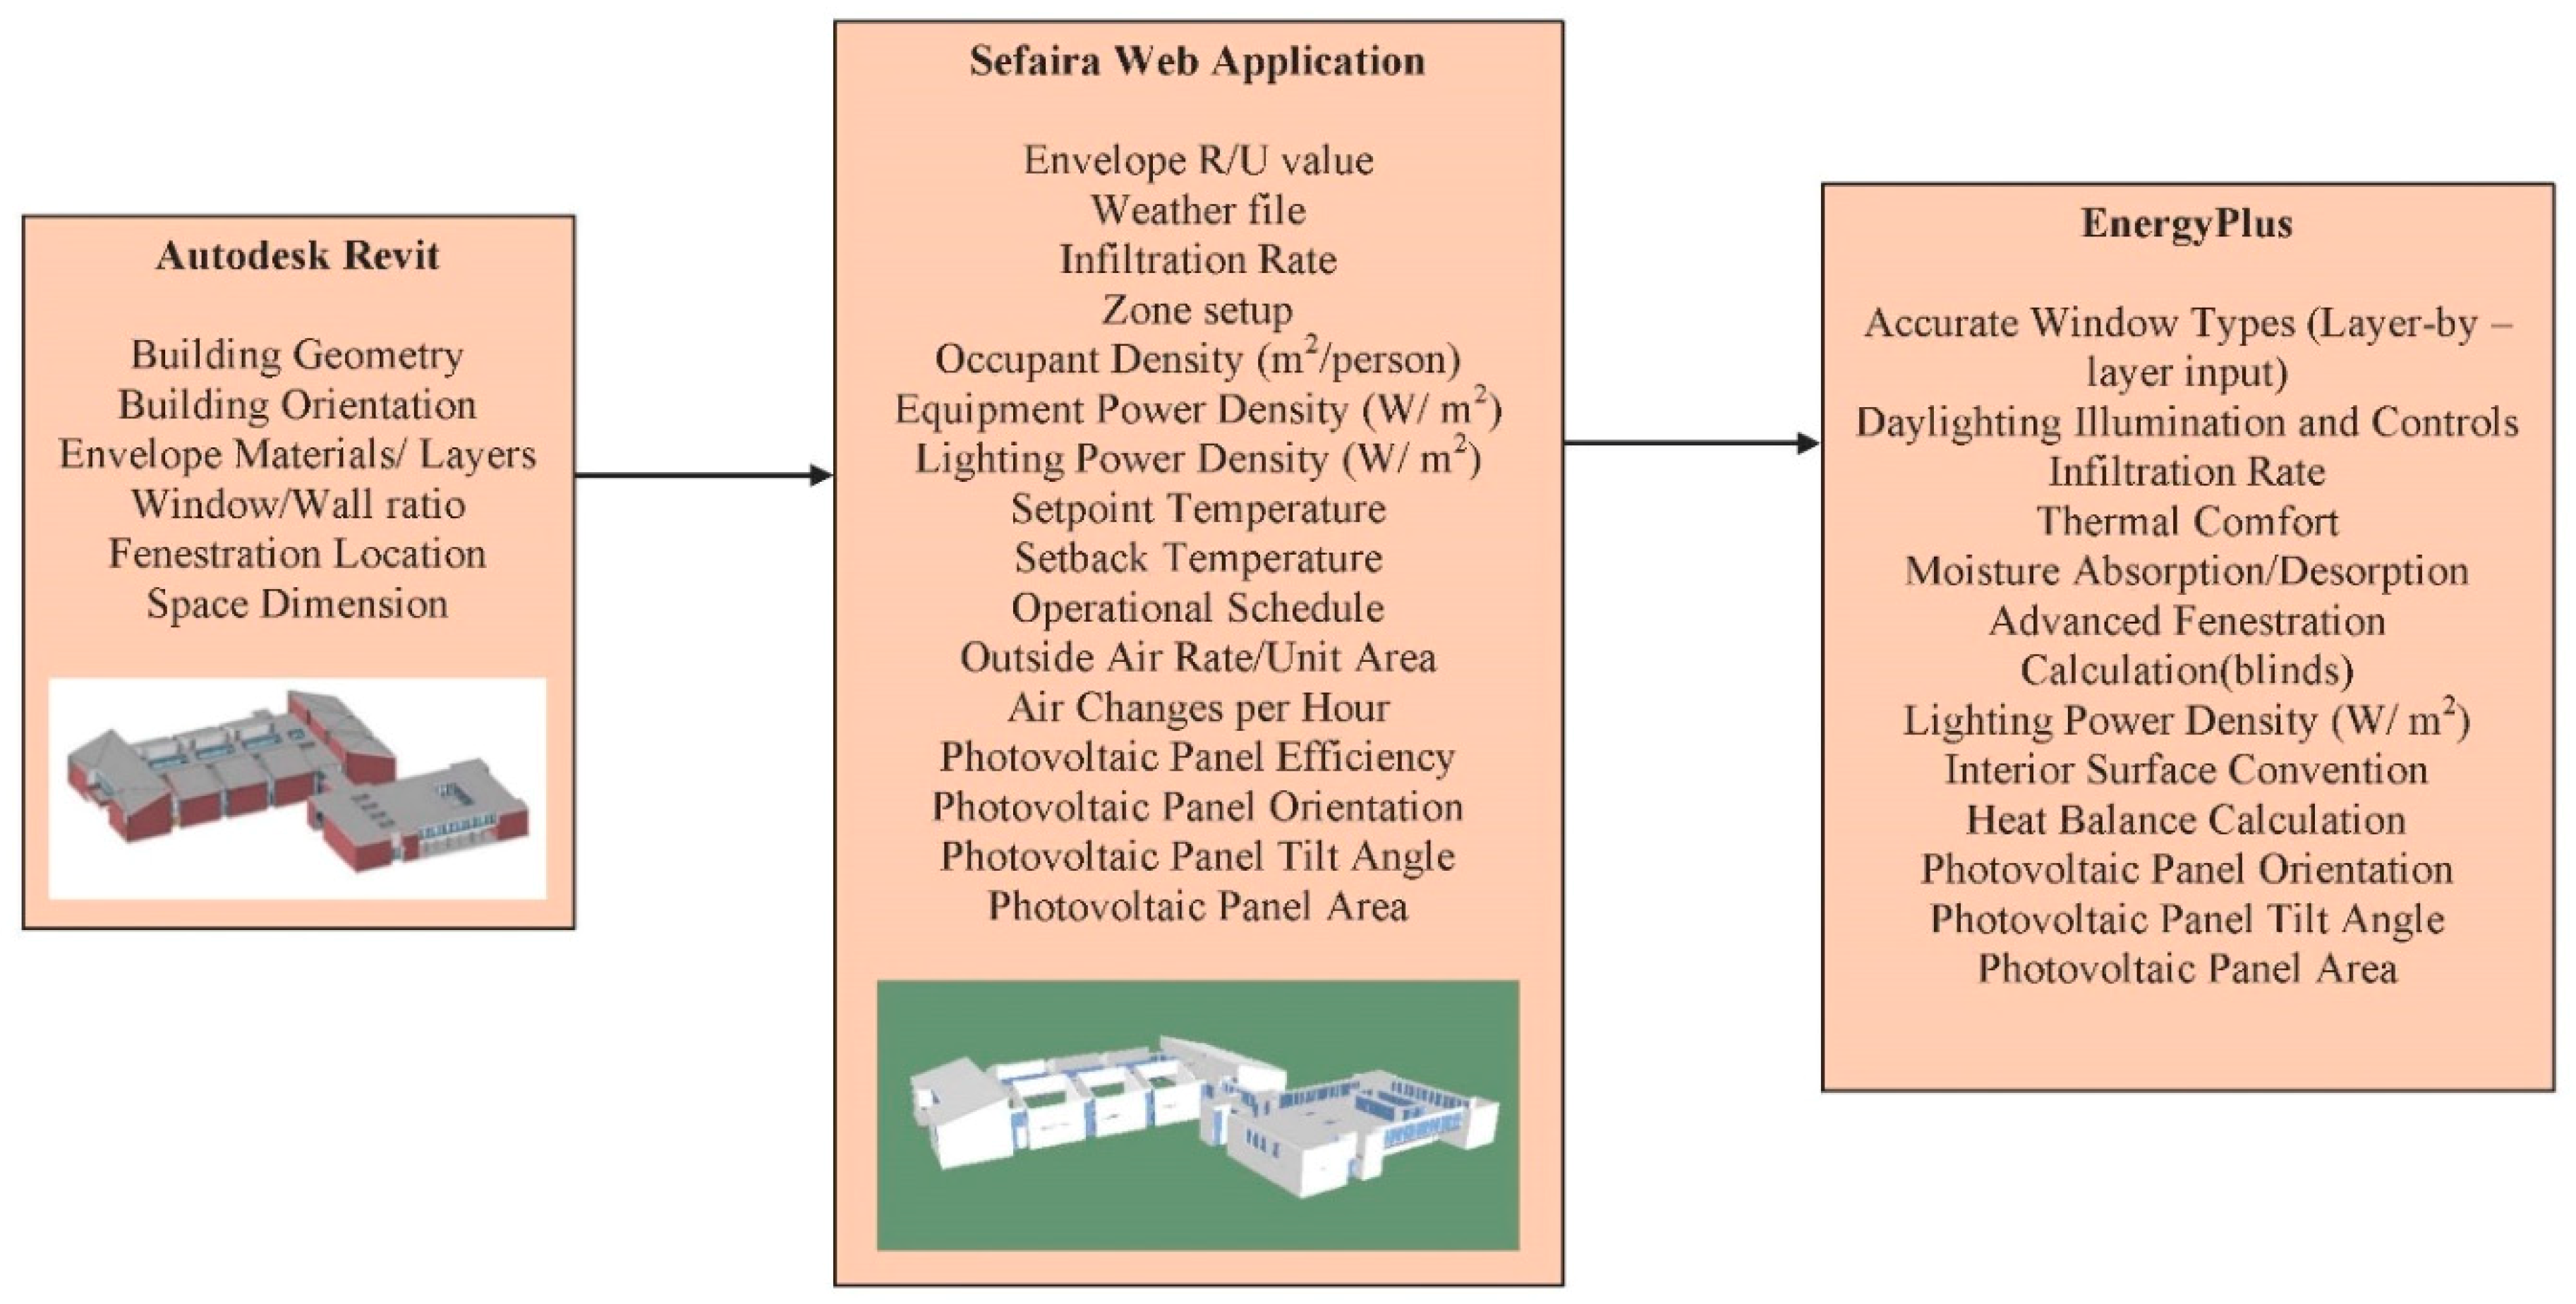
For the case study building (ARCH building), the current energy consumption intensity is 396 KWh/m2year, and the energy efficiency, which is much lower than the national average of 760 KWh/m2year levels are L1 = 297 kWh/m2year, L2 = 138 kWh/m2year, and L3 = 79 kWh/m2year. The energy performance of each renovation technique and scenario was simulated using a combination of three workflow software systems: Autodesk Revit, Sefaira and EnergyPlus. EnergyPlus is widely accepted as a reliable energy model program. However, the input files are not user-friendly, therefore, the Department of Energy (the developer of EnergyPlus) expects most users will access the program through third-party interfaces, such as OpenStudio and Sefaira [23]. Figure 3 illustrates the energy modeling workflow used in this study.
Firstly, the three-dimensional model of the case building was constructed in Autodesk Revit [24] based on the original construction document and field measurements. Secondly, the building’s basic physical and mechanical information was uploaded to the Sefaira web application [25] through the plug-in tool in Autodesk Revit. Thirdly, alternative renovation techniques (RTs) and nine renovation scenarios (RSs) were chosen by the Sefaira web application, and then the RSs were exported to EnergyPlus as an IDF file that included all building physical properties and system settings. Lastly, detailed energy simulations were carried out in EnergyPlus. In order to acquire the value of the OC, a detailed energy model framework of the existing conditions illustrates the scope and level of energy simulation (refer to Table 1 below).
4.3. Renewable Energy Supply System Integration
Three renewable energy supply systems were studied in this research:
- RES1: Photovoltaic panel in combination with air/solar source heat pump
- RES2: Photovoltaic panel in combination with ground source heat pump
- RES3: Photovoltaic panel in combination with district heating
Studies indicate that using combined solar heating and air source heat pumps could reduce the heating and cooling load by 30% to 60% [26,27]. Lund et al. (2016) [28] studied a photovoltaic system that was integrated in the district heating and concluded that this option was the most reasonable solution for heating a building located in a district heating area. Since the UMD campus has a centralized district heating system, investigating the above options could provide useful insights.
In this project, the photovoltaic panel cost included labor and materials and was calculated based on the standard guidelines published by the National Renewable Energy Lab (Q1 2017 commercial pricing from NREL) [29]. First, the annual energy (electricity) consumption was simulated and then multiplied by 1.2 to account for variation in photovoltaic generation. Based on NREL’s bottom-up model, $2.13/Wac was used for the commercial photovoltaic system cost [29].
4.4. Energy Price
For this case study, the price of electricity is assumed to fluctuate based on the energy price escalation rates projected by the Department of Energy (DOE) for the years 2018 to 2048, in census region 3, which includes the state of Maryland. During the first five years (2018–2023), the price of electricity for commercial building is expected to increase by 7%, and from 2023 to 2028, it is projected to have an annual 1% increase. From 2028 to 2033, a zero-price increase is predicted, and for the remaining 25 years, there is a projected electricity price decrease of 1%. Based on the 10 CFR 436 Federal Energy Management and Planning Program (10 CFR 436 is part of the Code of Federal Regulations. https://www.gpo.gov/fdsys/granule/CFR-1999-title10-vol3/CFR-1999-title10-vol3-part436) issued in 2018, the real discount rate is 3%, with an inflation rate of −0.2%.
4.5. Renovation Scenario Structure
Altogether, three varying energy reduction levels, three renewable energy supply alternatives, and six renovation techniques produced nine different renovation scenarios (SCE) (refer to Table 2). SCEs 1–3 meet the energy reduction level L1. SCEs 4–6 meet the energy reduction level L2. SCEs 7–9 meet the energy reduction level L1. Table 2 illustrates the SCE framework for life-cycle cost assessment as well as related energy reduction levels, renovation techniques (RT1–RT6), and renewable energy supply options (RT1–RT3) mentioned in Section 4.1. SCEs 1–3 also have an ascending energy-efficiency goal at different initial costs, which provides the designer and building owners with certain flexibility to apply varied and multiple renovation techniques (refer to Section 4.1). Following the same logic, SCEs 4–9 were organized, with itemized costs for each renovation technique also provided.
The total initial cost was derived from the itemized costs of the renovation techniques as well as the photovoltaic panel cost. Table 3 demonstrates the initial renovation and photovoltaic costs and energy efficiency goal for each SCE.
5. Initial Findings
The nine scenarios were evaluated over the life-cycle of 40 years to understand the cost-effective relationship between implementing energy reduction techniques and renewable energy sources. Table 4 illustrates the LCCA results. For the total LCC of the case building, scenarios 7–9 rank as the top three in terms of LCC savings, while scenarios 1–3 rank as the lowest three. The payback period for the initial investment cost, including avoided electricity costs, varies from 1.4 years to 4.1 years (refer to Table 4).
When we closely examined the relationship between nonrenewable energy consumption and the overall LCC of the building, a clear trend emerges: Figure 4 indicates that when energy consumption intensity increases, the overall life cycle cost of the building also increases. The impact of onsite renewable energy systems/sources on the cost-effectiveness of the measures in the building renovation strategies did not significantly change the hierarchy of cost-effectiveness in the different renovation scenarios. This finding does align with other research findings, for instance, [23] conducted study on one single commercial building in Portugal and determined the two important concepts (in European Union energy policies): Cost optimality and nearly zero-energy building do not conflict with each other since the primary task for both concepts is to minimize energy consumption, which leads to cost reduction.
The existing building’s energy performance is relatively poor when compared to new constructions that are built to meet current standards; therefore, the building operational energy use is determinant for the building life cycle cost since most budget will be spent on keeping the building operational. Unlike other educational buildings equipped with laboratory and other energy intense equipment, this base building only has regular classrooms and offices. Hence, it is an external thermal load dominated building, rather than internal load dominated. This means most energy will be consumed by providing thermal comfort (heating and cooling) to the internal space; therefore, the thermal performance of the building envelope is essential to cost-effective renovation strategies. For other internal load dominated building (with laboratories), improving the HVAC systems or the using onsite renewable energy could become the most cost-effective methods.
To this extent, for this type of building, energy consumption intensity could be used to predict the LCC of a given SCE. In this project, energy consumption intensity excluded the embodied energy, meaning that the results could have differed without the exclusion.
Our primary findings from the analysis cover two areas. First, they highlight the importance of a reduction in the operating energy. This would dramatically reduce the overall life cycle cost of the building as the operating timespan is much longer than the initial construction. By initially investing in more energy-efficient retrofit techniques with an additional $10/m2, building owners can save up to 79% of the costs over the building’s lifespan. Even with $5.8/m2 of additional initial renovation construction costs, a building owner can still receive close to a 19% saving, compared to making no changes to the existing building. The second finding revealed that district heating combined with solar panels was the preferable renewable energy source. This finding was based on a large percentage increase in LCC savings between scenarios 7–9 and the other scenarios.
6. Sensitivity Analysis
Research from the building and construction industry identified eight major factors that influence the cost and schedule of a project (new and renovation) [7,30,31]: Complexity of the building, technological requirements, project information, project team requirements, contract requirements, project duration, market requirements, and site requirements. Among those eight factors, three factors are particularly essential to a renovation project with an aim to achieve net zero: Complexity, technological requirements, and site requirements. This is because net-zero goal feasibility largely depends on available renovation techniques and renewable energy resources onsite. In order to evaluate the robustness of the results, a sensitivity analysis (SA) was performed for those three factors. In this study, the three factors were influenced by subfactors/multiple variables described in Table 5. Altogether, the SA was modeled based on 34 variables.
The first factor, complexity, is composed of four subfactors: Building types, census region (geographic location), climate region (climate condition), and discount rate (interest rate). Each of those variables also break into multiple sub-variables, which are associated with unique base building profiles. The energy consumption varies per building type and climate region [32] based on the data extracted from the EIA 2018 database. The second factor, technological requirements, is mainly related to photovoltaic technology since it remains the largest market available for renewable energy resources in the United States. Two sub-variables are also considered: Photovoltaic panel price reduction and production efficiency. The photovoltaic panel price will continue to decrease due to technology advancement and growing interest [32]. It is assumed that the cost of photovoltaic panels will decrease at three different levels—25%, 50%, and 70%—during the building’s lifespan [9]. Additionally, panel efficiency has experienced great improvement, and according to the National Renewable Energy Laboratory 2017 report, certain top-tier marketable photovoltaic panels can achieve up to 29% efficiency [33] (Green et al. 2017), whereas the typical photovoltaic panel efficiency ranges from 14% to 21.5%. In this study, we used three values for photovoltaic panel efficiency, 14%, 17% and 21%. The third factor, site requirements, is composed of two variables: Energy costs influenced by regional energy infrastructure and construction cost factors per region. The data used in this study were based on the EIA’s International Energy Outlook [34]. Energy infrastructure varies depending on the location, which affects the electricity unit cost. Furthermore, changes in the local electricity unit cost could influence the cost-effectiveness of district heating and cooling. For the sensitivity analysis, we studied five different mega regions: New England, Middle Atlantic, Midwest, South, and West. The construction cost factor is related to varied labor and material costs in different regions/locations and is included in the initial investment cost (refer to Table 5).
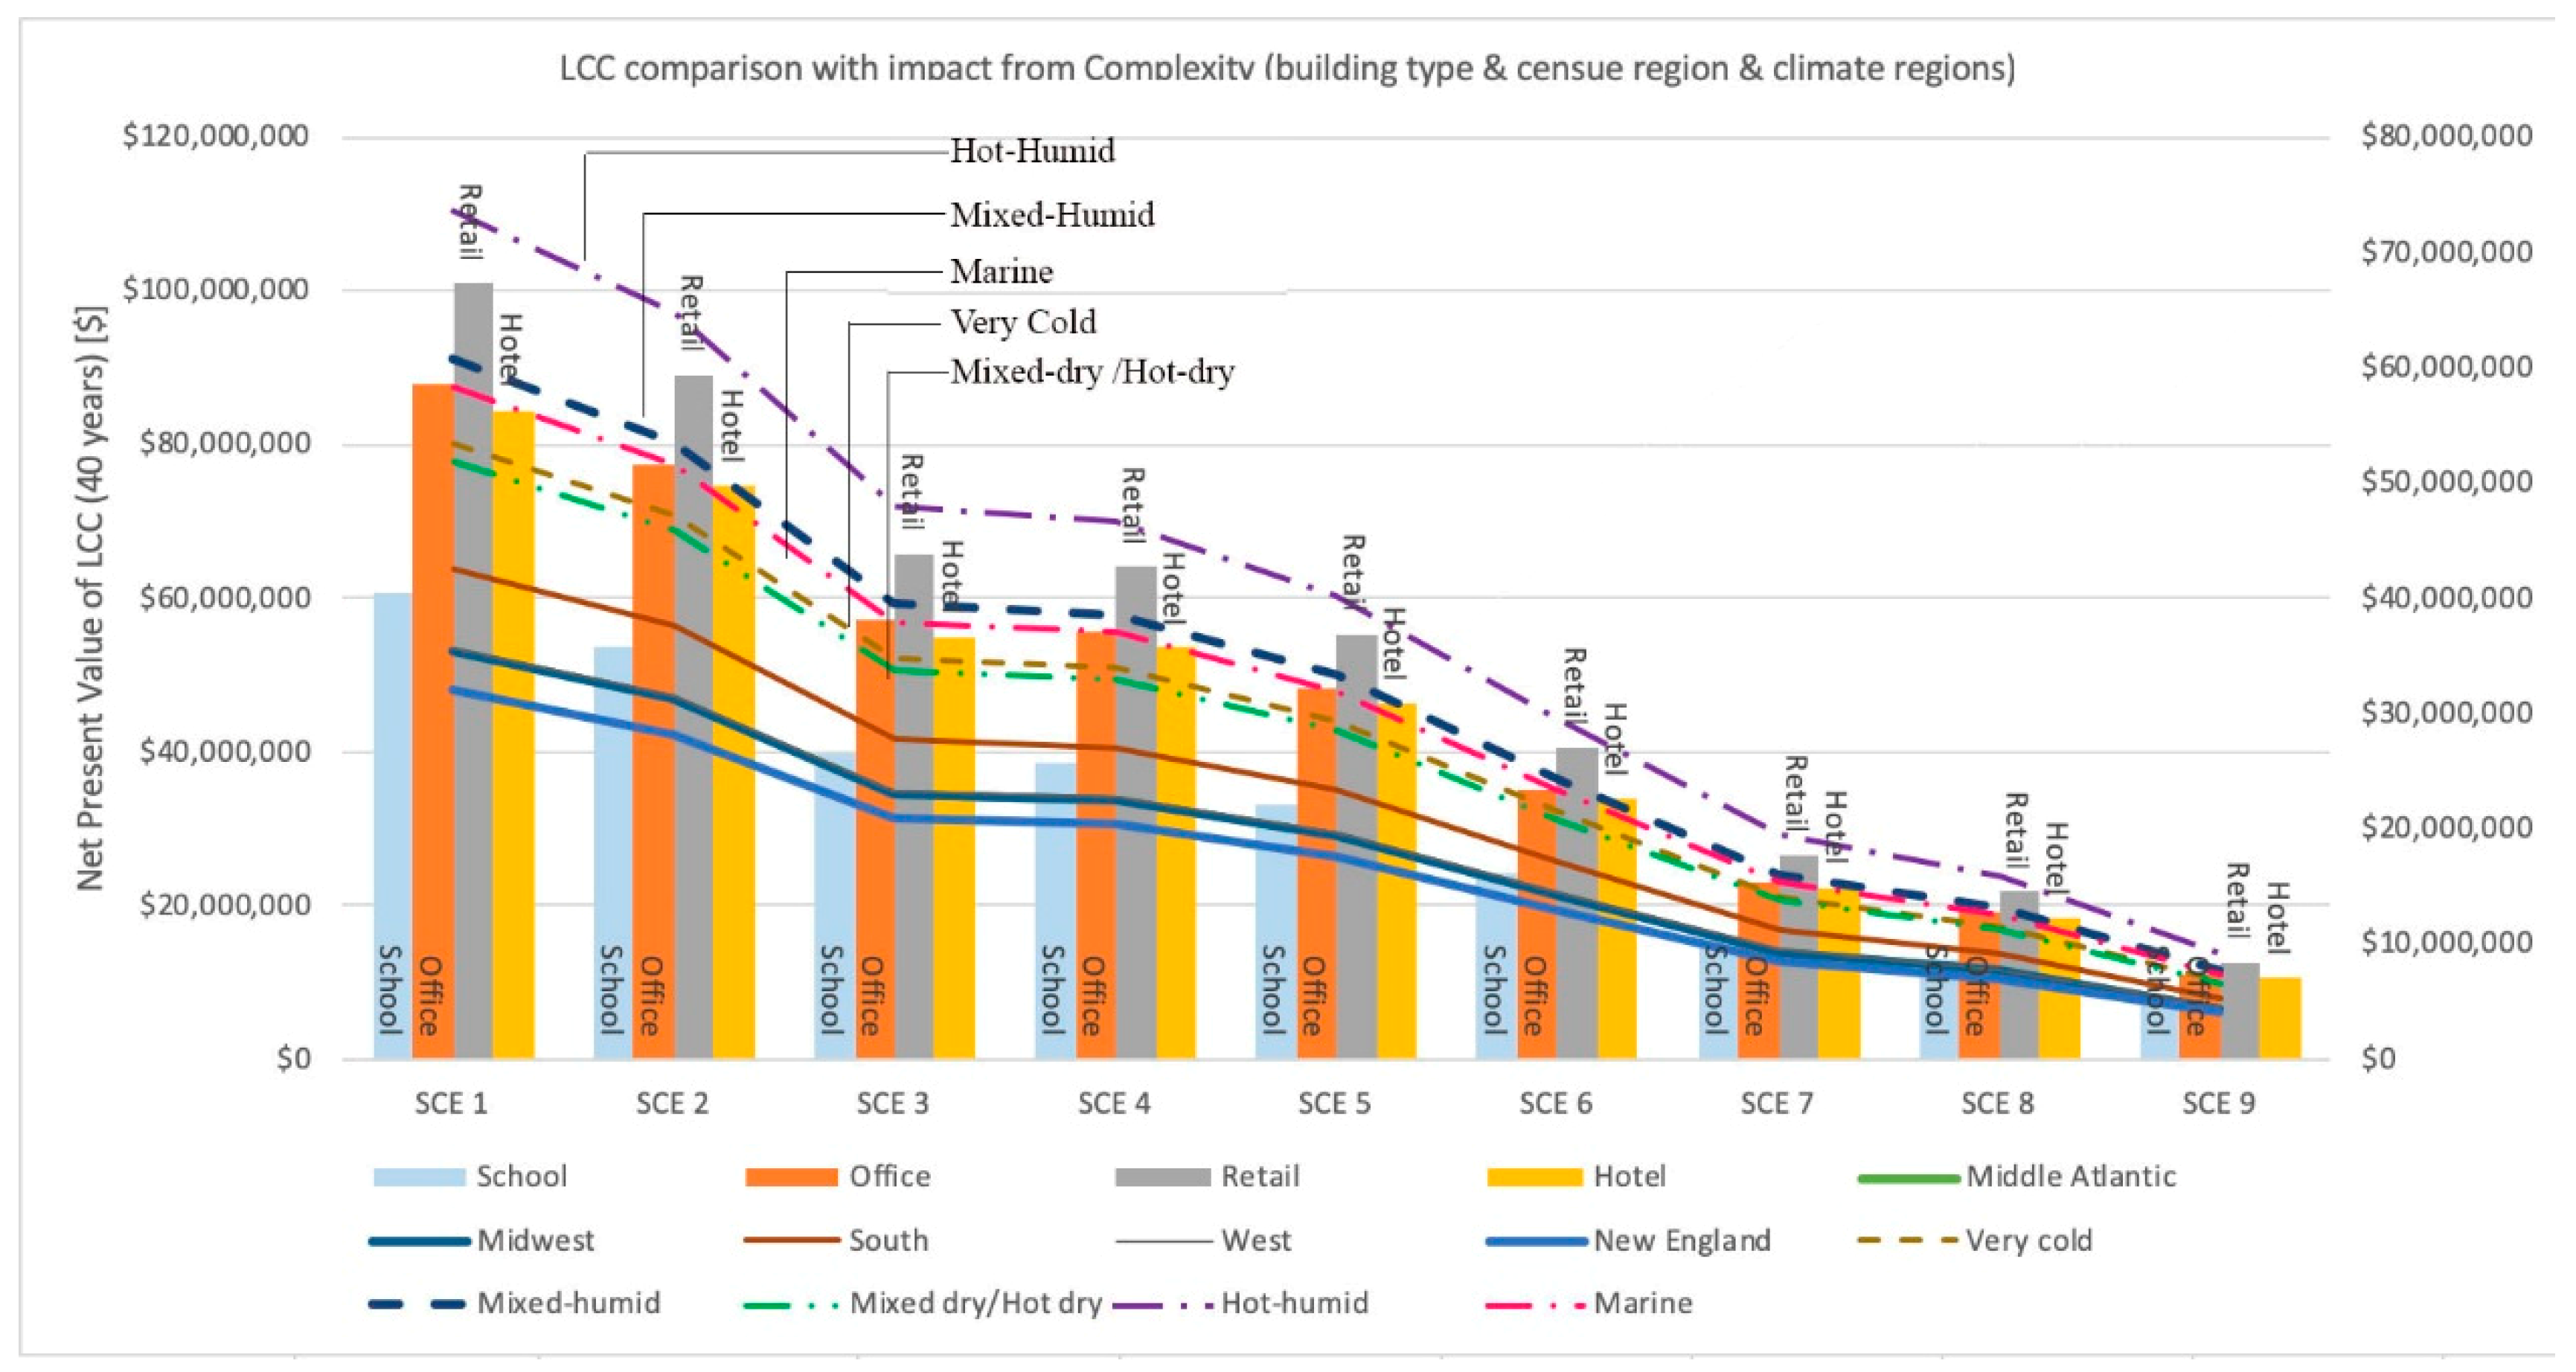
Figure 5 illustrates the combined impact due to the complexity of the building. The school building, Middle Atlantic region, and mixed-humid climate region were used as a reference case. The first variable (building type) did not influence the hierarchical ranking of the different SCEs. However, it did change the LCC percentage among different SCEs. The LCC variance among different building types decreased as the building energy efficiency increased. The second variable, geographic regions (census regions) influenced the technology availability and potential adoption rate but did not change the ranking of SCEs. When examining differences among the five regions, the South appeared to have the highest LCC while New England had the lowest. This might be due to the New England region’s existing buildings having the lowest average energy consumption (kWh/m2), at 1210 kWh/m2 according to EIA data, whereas the South had the highest, at 1610 kWh/m2. Regarding the climate condition influence, the hot-humid climate appeared to have the highest LCC and benefitted the most from energy efficiency improvement. Compared to the baseline (mixed-humid region), the mixed dry/hot-dry, very cold, and marine regions all indicated smaller LCC variations among different SCEs. Overall, diverse climate conditions did not affect the order of cost-effectiveness renovation scenarios. However, there were higher LCC differences among SCEs in more humid climate conditions than in dryer conditions.
Overall, building complexity did not change the ranking of different renovation scenarios for LCC. Among the four subfactors influencing complexity, building type had the highest impact on the LCC percentage among SCEs. Building types that required greater energy consumption indicated higher life-cycle cost savings through the implementation of various renovation techniques, even those bearing high initial costs. Climate condition also played a role in cost effectiveness of SCEs, with humid regions contributing more to life-cycle cost savings. Finally, geographic influence was mainly related to energy consumption intensity, indicating a minor influence on the cost effectiveness of different SCEs.
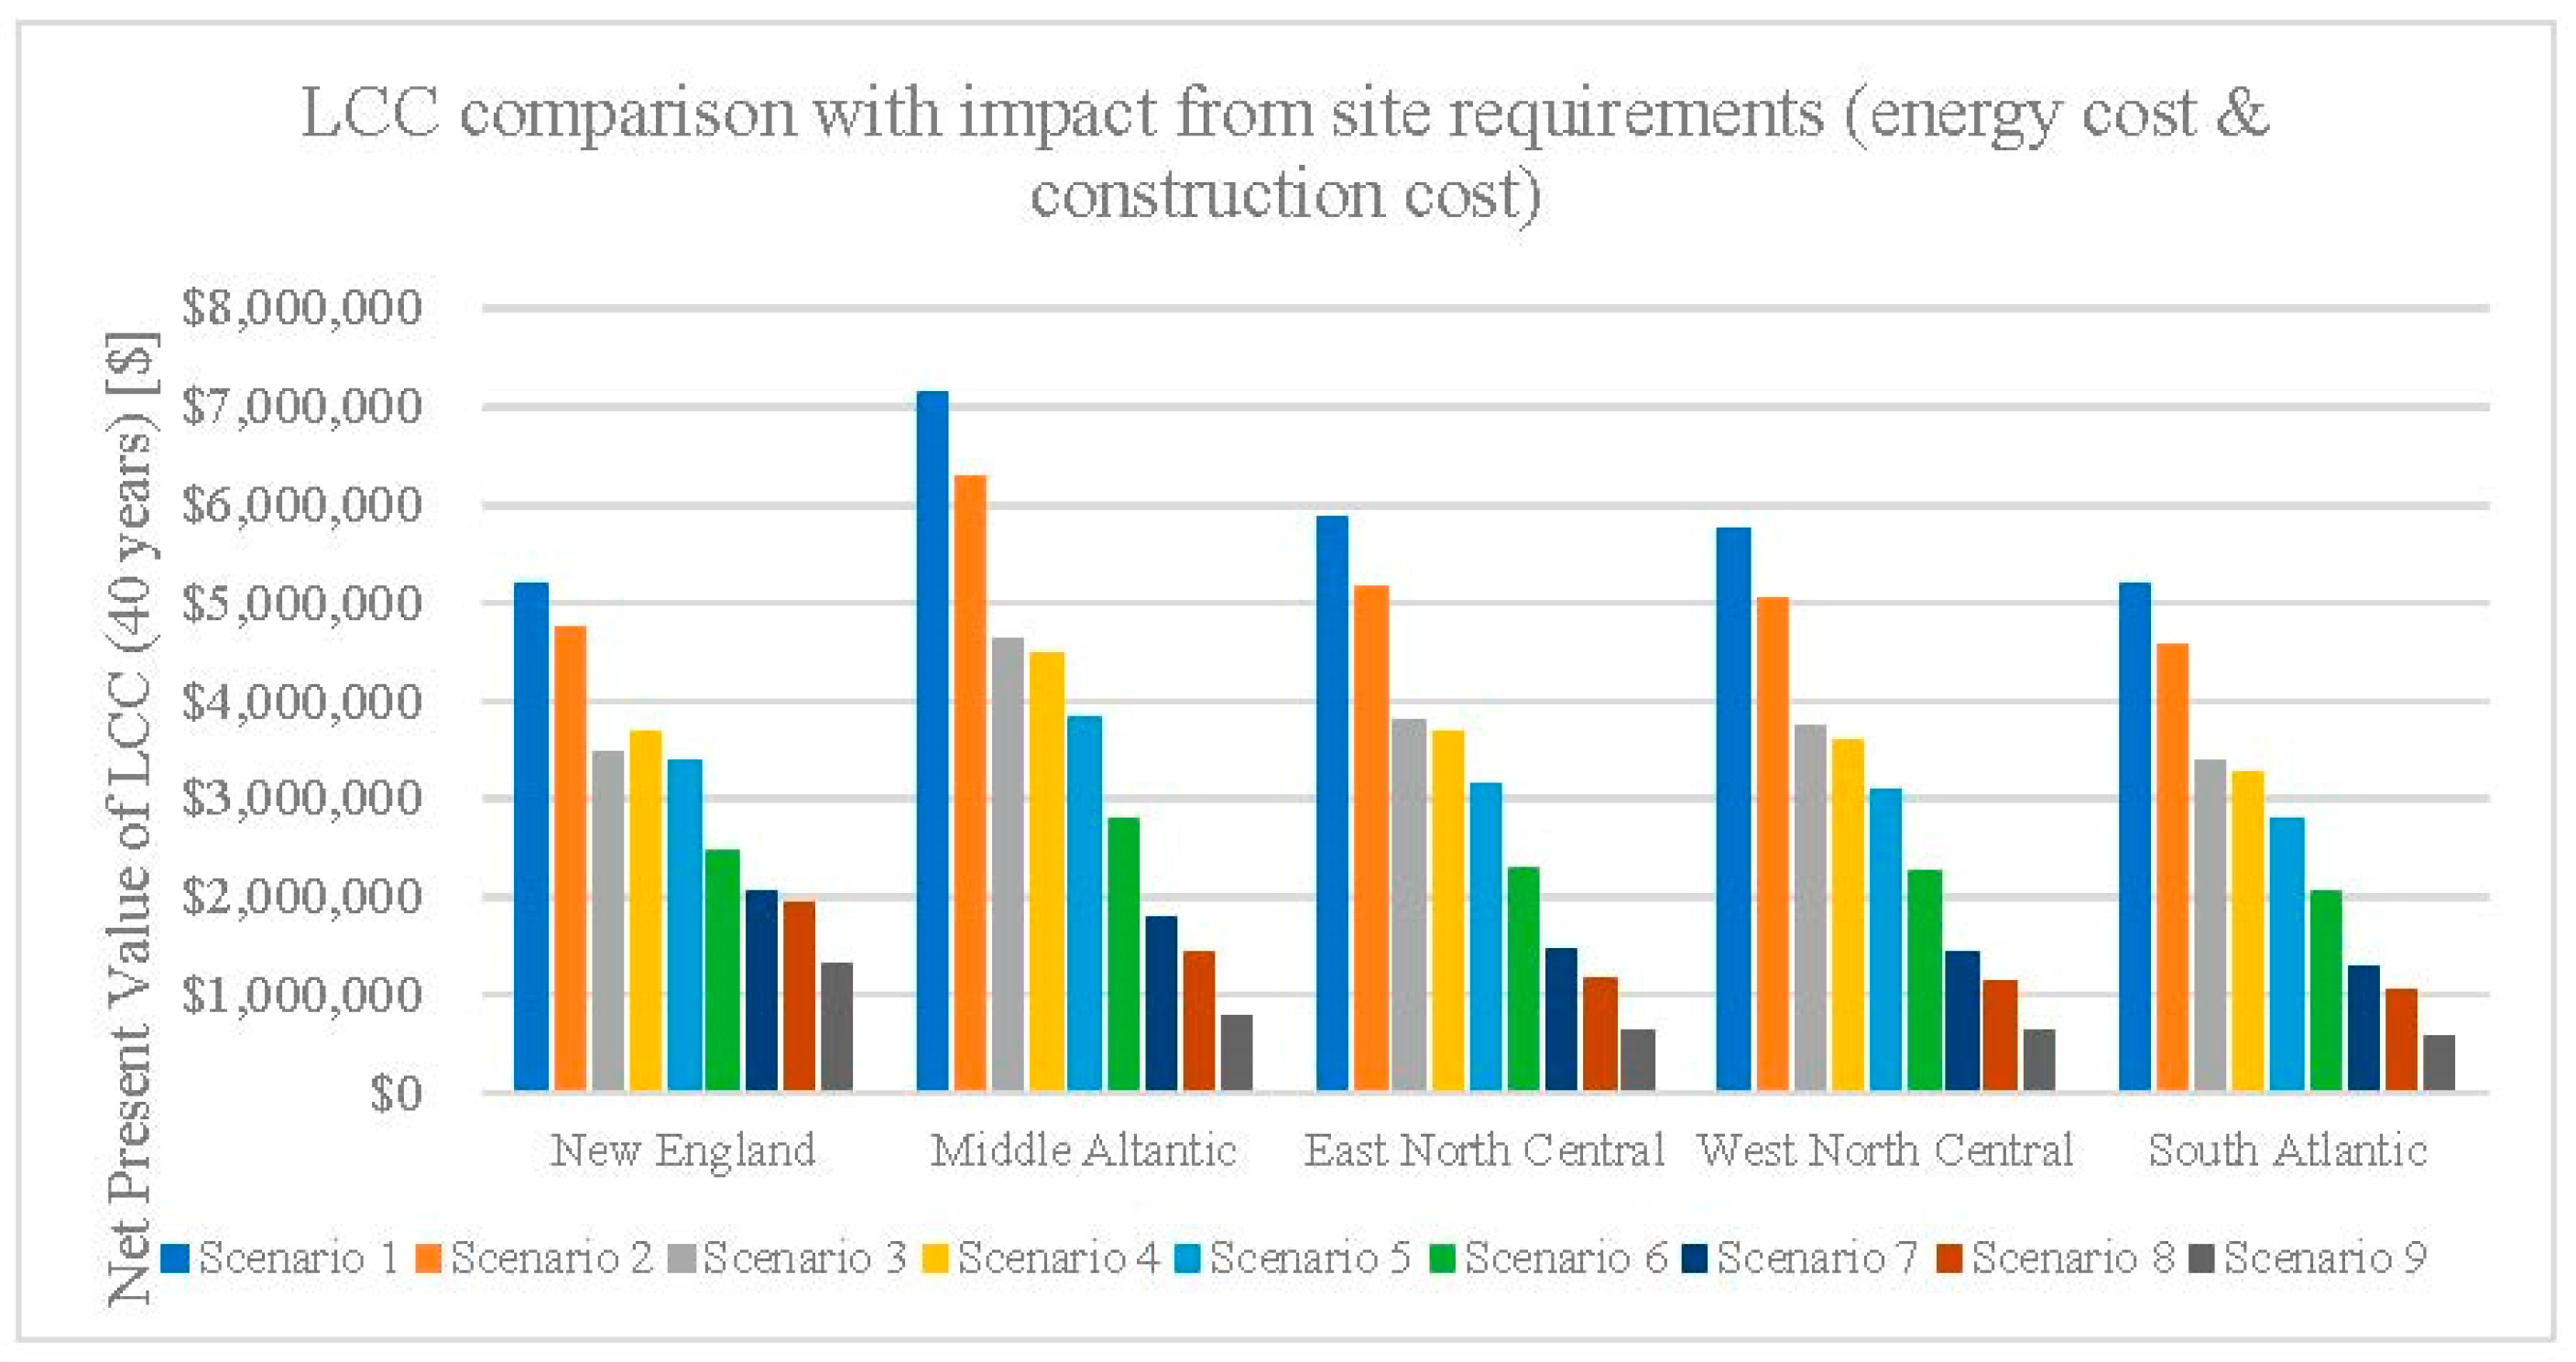
Finally, Figure 6 indicates that the energy infrastructure and locality do have an impact on the SCE ranking. For example, in the New England area, scenarios 3 and 4 switched places, regardless of the large difference in energy target levels (L1 and L2). This is mainly due to the high initial construction cost, despite the energy unit cost also being higher in New England. However, the substantially higher initial cost could not be offset by the long-term energy saving benefits. The results could explain the importance of the energy infrastructure, which may play a critical role in the selection of renovation techniques and renewable energy sources. Further studies should be conducted to determine the optimal threshold for initial construction costs for long-term LCC reduction.
7. Discussion
According to this study, the cost-effective renovation scenario, in terms of energy performance improvement (SCE 9) in the studied case building, was close to meeting the proposed energy performance of nearly net-zero energy, based on one of the most stringent building performance standards, Passive House. Passive House requires that the total energy consumption for all buildings must not exceed 60 kWh/m2. Based on the simulation, SCE 9 had an energy performance measurement of 35 kWh/m2. The renovation techniques included in SCE 9 resulted in an 80% total primary energy consumption reduction while reducing the LCC by 89.89%. Although this scenario’s estimated payback period of initial renovation investment was the longest, it is still a relatively short period. According to this study, the optimal scenario includes all renovation techniques: Additional thermal insulation on the exterior wall, interior wall and roof; replacement of existing windows with double pane Low-e window units; and replacement of existing lighting with LED lights. The short payback period could be explained by the absence of a major mechanical system in any of the renovation scenarios. When the total primary energy consumption has been minimized, it is recommended to invest in a renewable energy supply with photovoltaic panels to compensate for the electricity that still must be consumed onsite. The sensitivity study shows that a renewable energy supply with photovoltaic panels does not have a noticeable influence on the overall LCC reduction. Accordingly, for this case-study building, we conclude that the energy efficiency retrofits are more cost-effective in the long term compared to a renewable energy investment. More specifically, a photovoltaic panel combined with district heating was cost-optimal for this building. Those findings align with other studies, with the consensus being that a net-zero or nearly net-zero goal is reachable through the optimal building design [39]. However, investing in the implementation of renewable energy sources, such as photovoltaic panels, is still limited, either due to the return on investment or other factors.
This study differentiates itself from other studies of cost-optimal strategies aiming for a net-zero goal in two aspects. First, most existing studies focus on residential buildings, and for research that includes commercial buildings, only 4% of those studies involve school buildings [39] (Ferrara et al. 2018). Additionally, the majority of existing studies do not support the building envelope as being a driver of cost-optimal strategies [40]. In contrast, this study of an education building demonstrated that renovating the building envelope would be a cost-effective way to achieve the net-zero goal and reduce the overall LCC. Further studies will be helpful to understand the variation in results. Secondly, this study mainly focused on life cycle cost reduction benefits, instead of cost-optimal initial investments for existing buildings.
It is also important to emphasize that the authors acknowledge the following limitations on this research project: (1) There were additional variables that were not included, such as the price fluctuation of different renovation techniques; (2) photovoltaic panels were the only considered renewable energy source, excluding other renewable sources; (3) repair and maintenance costs and schedules vary according to different technologies and need to be considered; and (4) the exclusion of embodied energy in the calculation (future studies should include embodied energy since an operational energy decrease will cause it to play an essential role in achieving the carbon neutral goal [41,42]); (5) the use of a single building does not support the generalization of the research results; and (6) variability in the adopted operating schedule has not been integrated in the calculation.
8. Conclusions
As buildings have much longer lifespans compared to other industrial products, the decisions made in the design stage have long-term consequences [43]. Currently, when developers or building owners make renovation decisions, they often focus on the initial construction costs (investment) and overlook the overall life cycle cost of the building. The lack of a holistic view of the actual building costs can result in a failure to choose a cost-effective renovation solution [9]. The main goal of this research was to determine the cost-effectiveness impact of energy efficiency renovation and renewable energy integration for an existing education building’s renovation, with a focus on the building envelope and lighting system. The three primary findings from this study provided insights for ongoing discussions around existing building retrofitting aimed at achieving the net-zero goal:
- The LCC analysis results indicated that investing in energy-efficient retrofitting techniques is more cost-effective than renewable energy source investments in the long term. This suggests that the initial investment in energy-efficient renovation is the primary factor in the LCC of an existing building.
- Regarding the three renewable energy systems compared, the photovoltaic panel combined with district heating was chosen as the cost-optimal system since the infrastructure for district heating already exists on campus.
- This study also demonstrated that the building complexity and technological requirements had some influence on cost differences among SCEs but did not change the hierarchical order of the different SCEs. However, the site requirements—mainly the energy infrastructure—did affect the ranking of different SCEs, indicating that cost-effective renovation strategies of a single building were closely related to the regional energy supply and renovation.
The results from this study may potentially encourage deep energy renovation and demonstrate the viability of a building envelope retrofit. Follow-up research should include (1) consideration of all variables and factors influencing the life cycle cost, (2) a close examination of the climate condition impact of cost savings, and (3) studies on additional renewable energy technologies beyond photovoltaic panels.
Funding
This research was funded by Office of Sustainability of University of Maryland and Junior Faculty Research Award 2018 from School of Architecture, Planning and Preservation, University of Maryland.
Acknowledgments
I thank all faculty, staff and students in School of Architecture, Planning and Preservation at University of Maryland, for their administrative and technical support. I would also like to show my gratitude to Mark Stewart, Sustainability Manger, Office of Sustainability, University of Maryland Martha Shrader, Sustainability Manger, University of Maryland for their help to review my original research proposal and continuous feedback and input during the entire research process. Lastly, I want to thank the 3 anonymous reviewers for their comments and suggestions that helped me to improve this paper.
Conflicts of Interest
The authors declare no conflict of interest.
Nomenclature
| RT | Renovation techniques |
| SCE | Renovation scenario |
| RES | Renewable energy supply |
| IC | Investment cost |
| RepC | Present-value capital replacement cost |
| OC | Present-value operating energy cost |
| MRC | Present-value maintenance and repair cost |
| PV | Present value |
| n | Study period of the analysis (years) |
| t | year |
| d | Discount rate (interest rate) |
| F | Future cash amount |
| PA | Annual recurring operating cost |
| Wac | Watts alternating current |
References
- Commercial Buildings Energy Consumption Survey (CBECS). U.S. Energy Information Administration. 2012. Available online: https://www.eia.gov/consumption/commercial/ (accessed on 1 April 2019).
- Economist Intelligence Unit, Investing in Energy Efficiency in Europe’s Building: A view from the Construction and Real Estate Sectors; The Economist Intelligence Unit (EIU), Commissioned by the GBPN. Available online: https://www.tias.edu/docs/default-source/documentlibrary_fsinsight/the-eiu-report.pdf (accessed on 28 March 2019).
- Robust Outlook for Residential Remodelling Through Mid-Year 2019. Joint Center for Housing Studies. Harvard University. Available online: https://www.jchs.harvard.edu/press-releases/robust-outlook-residential-remodeling-through-mid-year-2019 (accessed on 1 April 2019).
- Artola, I.; Rademaekers, K.; Williams, R.; Yearwood, J. Boosting Building Renovation: What Potential and Value for Europe; Economic and Scientific Policy, European Parliament, Policy Department A: Brussels, Belgium, 2016. [Google Scholar]
- Boermans, T.; Papaefthymiou, G.; Offermann, M.; John, A.; Comaty, F. The Role of Energy Efficient Buildings in the EUs Future Power System. Last Modified 5 October 2015. Available online: https://www.ecofys.com/files/files/ecofys-2015-role-of-energy-efficient-buildings-in-power-systems.pdf (accessed on 28 March 2019).
- Niemelä, T.; Risto, K.; Juha, J. Cost-optimal energy performance renovation measures of educational buildings in cold climate. Appl. Energy 2016, 183, 1005–1020. [Google Scholar] [CrossRef]
- Hu, M. Optimal Renovation Strategies for Education Buildings—A Novel BIM–BPM–BEM Framework. Sustainability 2018, 10, 3287. [Google Scholar] [CrossRef]
- Fuller, S.K.; Stephen, R.P. Life Cycle Costing Manual. NIST Handbook 135; National Institute of Standards and Technology: Gaithersburg, MD, USA, 1995.
- Marszal, A.J.; Heiselberg, P. Life cycle cost analysis of a multi-storey residential net zero energy building in Denmark. Energy 2011, 36, 5600–5609. [Google Scholar] [CrossRef]
- Mearing, T.; Coffee, N.; Morgan, M. Life Cycle Cost Analysis Handbook; State of Alaska, Department of Education & Early Development: Juneau, AL, USA, 1999.
- Fu, R.; Feldman, D.J.; Margolis, R.M.; Woodhouse, M.A.; Ardani, K.B. US Solar Photovoltaic System Cost Benchmark: Q1 2017 (No. NREL/TP-6A20-68925); National Renewable Energy Lab. (NREL): Golden, CO, USA, 2017.
- Fuller, S. Life-Cycle Cost Analysis (LCCA). Whole Building Design Guide. Available online: https://archexamacademy.com/download/Building%20Design%20Construction%20Systems/Life-Cycle%20Cost%20Analysis.pdf (accessed on 28 March 2019).
- Wong, N.H.; Tay, S.F.; Wong, R.; Ong, C.L.; Sia, A. Life cycle cost analysis of rooftop gardens in Singapore. Build. Environ. 2003, 38, 499–509. [Google Scholar] [CrossRef]
- Pelzeter, A. Building optimisation with life cycle costs–the influence of calculation methods. J. Facil. Manag. 2007, 5, 115–128. [Google Scholar] [CrossRef]
- Rushing, A.S.; Kneifel, J.D.; Lippiatt, B.C. Energy Price Indices and Discount Factors for Life-Cycle Cost Analysis. 2012; US Department of Commerce, National Institute of Standards and Technology. Available online: https://nvlpubs.nist.gov/nistpubs/ir/2013/NIST.IR.85-3273-28.pdf (accessed on 28 March 2019).
- Cosner, D. Invisible Crisis at University of Maryland. Available online: https://www.facilities.umd.edu/documents/Invisible%20Crisis.pdf (accessed on 1 January 2019).
- University of Maryland. Facilities Master Plan 2011–2030. Available online: https://www.facilities.umd.edu/documents/fmp/2011-2030%20facilities%20Master%20Plan.pdf (accessed on 28 March 2019).
- University of Maryland. Progress toward UMD Carbon Neutrality. Available online: https://www.president.umd.edu/progress-toward-umd-carbon-neutrality (accessed on 1 January 2019).
- Kaklauskas, A.; Zavadskas, E.K.; Raslanas, S.; Ginevicius, R.; Komka, A.; Malinauskas, P. Selection of low-e windows in retrofit of public buildings by applying multiple criteria method COPRAS: A Lithuanian case. Energy Build. 2006, 38, 454–462. [Google Scholar] [CrossRef]
- Juan, Y.K.; Peng, G.; Wang, J. A hybrid decision support system for sustainable office building renovation and energy performance improvement. Energy Build. 2010, 42, 290–297. [Google Scholar] [CrossRef]
- Ma, Z.; Cooper, P.; Daly, D.; Ledo, L. Existing building retrofits: Methodology and state-of-the-art. Energy Build. 2012, 55, 889–902. [Google Scholar] [CrossRef]
- Ferreira, M.; Almeida, M.; Rodrigues, A.; Silva, S.M. Comparing cost-optimal and net-zero energy targets in building retrofit. Build. Res. Inf. 2016, 44, 188–201. [Google Scholar] [CrossRef]
- Crawley, D.B.; Lawrie, L.K.; Winkelmann, F.C.; Pedersen, C.O. EnergyPlus: New Capabilities in a Whole-Building Energy Simulation Program. In Proceedings of Building Simulation; Springer: Rio de Janeiro, Brazil, 2001; pp. 51–58. [Google Scholar]
- Zolotova, J.; Vatin, N.; Tuchkevich, E.; Rechinsky, A. Autodesk Revit-key to successful training of highly qualified civil engineers. In Applied Mechanics and Materials; Trans Tech Publications: Zurich, Switzerland, 2015; Volume 725, pp. 1617–1625. [Google Scholar]
- Tschätsch, C.; Turner, E.; Marston, A.; Zakhor, A.; Lemmond, J.; Baumann, O. Smart energy analysis calculator–an interactive tool for automating building energy analysis & expediting energy audits. In Proceedings of SimBuild; ASHRAE: Salt Lake City, UT, USA, 2016. [Google Scholar]
- Yin, Z.; Enshen, L.; Xinhui, Z.; Zhenghao, J.; Qinjian, L.; Fei, L.; Yang, M. Combined solar heating and air-source heat pump system with energy storage: Thermal performance analysis and optimization. Procedia Eng. 2017, 205, 4090–4097. [Google Scholar] [CrossRef]
- Ramos, A.; Chatzopoulou, M.A.; Guarracino, I.; Freeman, J.; Markides, C.N. Hybrid photovoltaic-thermal solar systems for combined heating, cooling and power provision in the urban environment. Energy Convers. Manag. 2017, 150, 838–850. [Google Scholar] [CrossRef]
- Lund, H.; Möller, B.; Mathiesen, B.V.; Dyrelund, A. The role of district heating in future renewable energy systems. Energy 2010, 35, 1381–1390. [Google Scholar] [CrossRef]
- Kim, H.C.; Fthenakis, V.; Choi, J.K.; Turney, D.E. Life cycle greenhouse gas emissions of thin-film photovoltaic electricity generation: Systematic review and harmonization. J. Ind. Ecol. 2012, 16, S110–S121. [Google Scholar] [CrossRef]
- Grant, A.; Ries, R.; Kibert, C. Life cycle assessment and service life prediction: A case study of building envelope materials. J. Ind. Ecol. 2014, 18, 187–200. [Google Scholar] [CrossRef]
- Saunders, C.L.; Landis, A.E.; Mecca, L.P.; Jones, A.K.; Schaefer, L.A.; Bilec, M.M. 2013. Analyzing the practice of life cycle assessment: Focus on the building sector. J. Ind. Ecol. 2013, 17, 777–788. [Google Scholar]
- Raugei, M.; Frankl, P. Life cycle impacts and costs of photovoltaic systems: Current state of the art and future outlooks. Energy 2009, 34, 392–399. [Google Scholar] [CrossRef]
- Green, M.A.; Hishikawa, Y.; Warta, W.; Dunlop, E.D.; Levi, D.H.; Hohl-Ebinger, J.; Ho-Baillie, A.W. Solar Cell Efficiency Tables (Version 50). Prog. Photovolt. Res. Appl. 2017, 25, 668–676. [Google Scholar] [CrossRef]
- EIA’s International Energy Outlook 2018. Average Price of Electricity to Ultimate Customers by End-Sue Sector. U.S. Energy Information Administration; Last Modified May 2018. Available online: https://www.eia.gov/electricity/monthly/epm_table_grapher.php?t=epmt_5_6_a (accessed on 28 March 2019).
- Moselle, B. National Building Cost Manual, 41st ed.; Craftsman Book Company: Carlsbad, CA, USA, 2017. [Google Scholar]
- U.S. Energy Information. International Energy Outlook 2018. Last Modified 24 July 2018. Available online: https://www.eia.gov/outlooks/ieo/ (accessed on 28 March 2019).
- Price, J.S.; Grede, A.J.; Wang, B.; Lipski, M.V.; Fisher, B.; Lee, K.T.; He, J.; Brulo, G.S.; Ma, X.; Burroughs, S.; et al. 2017. High-concentration planar microtracking photovoltaic system exceeding 30% efficiency. Nat. Energy 2017, 2, 17113. [Google Scholar] [CrossRef]
- Craftsman Book Company. 2017 National Building Cost Manual. Available online: https://www.craftsman-book.com/media/static/previews/2017_NBC_book_preview.pdf (accessed on 1 April 2019).
- Ferrara, M.; Monetti, V.; Fabrizio, E. Cost-Optimal Analysis for Nearly Zero Energy Buildings Design and Optimization: A Critical Review. Energies 2018, 11, 1478. [Google Scholar] [CrossRef]
- Stocker, E.; Tschurtschenthaler, M.; Schrott, L. Cost-optimal renovation and energy performance: Evidence from existing school buildings in the Alps. Energy Build. 2015, 100, 20–26. [Google Scholar] [CrossRef]
- Stephan, A.; Crawford, R.H.; De Myttenaere, K. A comprehensive assessment of the life cycle energy demand of passive houses. Appl. Energy 2013, 112, 23–34. [Google Scholar] [CrossRef] [Green Version]
- Dixit, M.K. Life cycle embodied energy analysis of residential buildings: A review of literature to investigate embodied energy parameters. Renew. Sustain. Energy Rev. 2017, 79, 390–413. [Google Scholar] [CrossRef]
- Ryghaug, M.; Sørensen, K.H. How energy efficiency fails in the building industry. Energy Policy 2009, 37, 984–991. [Google Scholar] [CrossRef] [Green Version]
Figure 1.
Existing School of Architecture Building.

Figure 2.
Adding insulation to the inside of an exterior wall.

Figure 3.
Energy modeling workflow (Revit, Sefaira, EnergyPlus).

Figure 4.
LCC (PV—present value) and nonrenewable energy consumption for different scenarios.

Figure 5.
LCC comparison with impact from building types.

Figure 6.
LCC comparison with impact from site requirements.


Table 1.
Case study building’s existing property framework for energy model.
| Energy Model Framework | |||
|---|---|---|---|
| Envelope Property | U-Value | Ratio | |
| Exterior wall | 1.42 W/(m²·K) | ||
| Roof | 1.88 W/(m²·K) | ||
| Floor | 2.50 W/(m²·K) | ||
| Exterior window/door | 7.3 W/(m²·K) | ||
| Wall-to-window ratio | 40% | ||
| Infiltration rate | 1.97 L/s·m2 | ||
| Operation | |||
| Temperature setpoint | Heating | 20 °C | |
| Cooling | 25 °C | ||
| Setback temperature | Heating | 12 °C | |
| Cooling | 28 °C | ||
| Operation hour | 8 a.m.–6 p.m. | ||
| Density | Occupant density | 4.0 m2/person | |
| Equipment power density | 9.7 W/m2 | ||
| Lighting power density | 15.1 W/m2 | ||
| Timesteps | 1 h | ||
| HVAC System | Heating efficiency | 0.85 | |
| Cooling efficiency | 3 | ||
| Ventilation rate | 0.3 L/s·m2 | ||
| Photovoltaic System | |||
| Efficiency | 14% | ||
| Area | 2000 m2 | ||
Table 2.
Scenario structures for life-cycle cost analysis.
| Scenario | Energy Reduction Level | Renewal Energy Supply | Renovation Techniques (RT) | Itemized Cost |
|---|---|---|---|---|
| SCE 1 | L1 (35%) | RES 1 | RT1 (Window) | $42,857 |
| SCE 2 | RES 2 | RT1 (Window) RT2 (Roof) | $42,857 $64,839 | |
| SCE 3 | RES 3 | RT1 (Window) RT2 (Roof) RT5 (Air sealing) | $42,857 $64,839 $17,040 | |
| SCE 4 | L2 (65%) | RES 1 | RT3 (Exterior wall) RT5 (Air sealing) | $150,000 $17,040 |
| SCE 5 | RES 2 | RT1 (Window) RT3 (Exterior wall) RT5 (Air sealing) | $42,857 $150,000 $17,040 | |
| SCE 6 | RES 3 | RT1 (Window) RT2 (Roof) RT3 (Exterior wall) RT5 (Air sealing) | $42,857 $64,839 $150,000 $17,040 | |
| SCE 7 | L3 (80%) | RES 1 | RT1 (Window) RT2 (Roof) RT3 (Exterior wall) RT4 (Interior wall) RT5 (Air sealing) | $42,857 $64,839 $150,000 $45,650 $17,040 |
| SCE 8 | RES 2 | RT1 (Window) RT2 (Roof) RT3 (Exterior wall) RT4 (Interior wall) RT5 (Air sealing) RT6 (LED light) | $42,857 $64,839 $150,000 $45,650 $17,040 $60,000 | |
| SCE 9 | RES 3 | RT1 (Window) RT2 (Roof) RT3 (Exterior wall) RT4 (Interior wall) RT5 (Air sealing) RT6 (LED light) | $42,857 $64,839 $150,000 $45,650 $17,040 $60,000 |
Table 3.
Initial investment cost and energy efficiency goals for SCEs.
| Scenario | Energy Efficiency Goal (kWh/m2 year) | Total Initial Renovation Cost ($) | Photovoltaic Panel Cost 200KW | Total Initial Investment Cost (IC $) |
|---|---|---|---|---|
| SCE 1 | 316 kWh/m2 year | $42,857 | $425,600 | $468,457 |
| SCE 2 | 278 kWh/m2 year | $66,386 | $525,600 | $591,986 |
| SCE 3 | 205 kWh/m2 year | $49,346 | $344,400 | $393,746 |
| SCE 4 | 198 kWh/m2 year | $167,040 | $425,600 | $592,640 |
| SCE 5 | 170 kWh/m2 year | $209,897 | $525,600 | $735,497 |
| SCE 6 | 124 kWh/m2 year | $274,736 | $344,400 | $619,136 |
| SCE 7 | 79 kWh/m2 year | $320,386 | $425,600 | $745,986 |
| SCE 8 | 63 kWh/m2 year | $380,386 | $525,600 | $905,986 |
| SCE 9 | 35 kWh/m2 year | $380,386 | $344,400 | $724,786 |
Table 4.
Scenario ranking for life-cycle cost analysis (lowest LCC).
| Ranking | Scenario # | Life Cycle Cost (Present Value) | Annual Energy Cost ($) | Energy Cost Savings ($) | Payback Period (Year) | LCC Savings (% Compared to Baseline) |
|---|---|---|---|---|---|---|
| Existing Building (Baseline) | $75,360,000 | $3,252,000 | ||||
| 1 | SCE 9 | $7,618,000 | $287,000 | $2,964,000 | 4.1 | 89.89% |
| 2 | SCE 8 | $13,114,000 | $517,000 | $2,734,000 | 3.0 | 82.60% |
| 3 | SCE 7 | $16,026,000 | $649,000 | $2,603,000 | 3.2 | 78.73% |
| 4 | SCE 6 | $24,350,000 | $1,018,000 | $2,234,000 | 2.5 | 67.69% |
| 5 | SCE 5 | $33,265,000 | $1,396,000 | $1,856,000 | 2.3 | 55.86% |
| 6 | SCE 4 | $38,480,000 | $1,626,000 | $1,626,000 | 2.3 | 48.94% |
| 7 | SCE 3 | $39,546,000 | $1,683,000 | $1,568,000 | 3.8 | 47.52% |
| 8 | SCE 2 | $53,582,000 | $2,283,000 | $969,000 | 1.6 | 28.90% |
| 9 | SCE 1 | $60,693,000 | $2,595,000 | $657,000 | 1.4 | 19.46% |
Table 5.
Variables for sensitivity analysis.
| Factors | Subfactors | Variables | Energy Consumption Intensity (Base Building) | Data Source |
| Complexity of Building | Building Type | Retail | 1830 kWh//m2 | [34] |
| School | 1100 kWh//m2 | |||
| Office | 1590 kWh//m2 | |||
| Hotel | 1530 kWh//m2 | |||
| Census Region (high-education building) | New England | 1210 kWh//m2 | [35,36] | |
| Middle Atlantic | 1530 kWh//m2 | |||
| Midwest | 1340 kWh//m2 | |||
| South | 1610 kWh//m2 | |||
| West | 1350 kWh//m2 | |||
| Climate region (high-education building) | Very cold/cold | 1340 kWh//m2 | [36] | |
| Mixed-humid | 1520 kWh//m2 | |||
| Mize-dry/hot dry | 1300 kWh//m2 | |||
| Hot-humid | 1840 kWh//m2 | |||
| Marine | 1460 kWh//m2 | |||
| Discount rate (interest rate) | 5% | |||
| 3% | ||||
| 2% | ||||
| Factors | Subfactors | Variables | Cost | Data Source |
| Technological Requirements | Photovoltaic panel price | Reduction 25% | $/m2 | [9] |
| Reduction 50% | ||||
| Reduction 70% | ||||
| Photovoltaic panel efficiency | 14% | [37] | ||
| 17% | ||||
| 21% | ||||
| Factors | Subfactors | Variables | Cost/Value | Data Source |
| Site Requirements | Energy cost $Cents/kWh | New England | 16.23 cents/kWh | [36] |
| Middle Atlantic | 13.09 cents/kWh | |||
| Midwest | 10.10 cents/kWh | |||
| South | 9.25 cents/kWh | |||
| West | 10.41 cents/kWh | |||
| Construction cost factor | New England | 1.12 | [38] | |
| Middle Atlantic | 1.02 | |||
| Midwest | 1.01 | |||
| South | 0.95 | |||
| West | 1.07 |
© 2019 by the author. Licensee MDPI, Basel, Switzerland. This article is an open access article distributed under the terms and conditions of the Creative Commons Attribution (CC BY) license (http://creativecommons.org/licenses/by/4.0/).
Share and Cite
MDPI and ACS Style
Hu, M. Cost-Effective Options for the Renovation of an Existing Education Building toward the Nearly Net-Zero Energy Goal—Life-Cycle Cost Analysis. Sustainability 2019, 11, 2444. https://doi.org/10.3390/su11082444
AMA Style
Hu M. Cost-Effective Options for the Renovation of an Existing Education Building toward the Nearly Net-Zero Energy Goal—Life-Cycle Cost Analysis. Sustainability. 2019; 11(8):2444. https://doi.org/10.3390/su11082444
Chicago/Turabian StyleHu, Ming. 2019. "Cost-Effective Options for the Renovation of an Existing Education Building toward the Nearly Net-Zero Energy Goal—Life-Cycle Cost Analysis" Sustainability 11, no. 8: 2444. https://doi.org/10.3390/su11082444
Note that from the first issue of 2016, this journal uses article numbers instead of page numbers. See further details here.