Assessment on Island Ecological Vulnerability to Urbanization: A Tale of Chongming Island, China

1
School of Management, Harbin Institute of Technology, 92 West Dazhi Street, Nan Gang District, Harbin 150001, China
2
School of Languages and Literature, Harbin Institute of Technology, 2 Wenhuaxi Road, Weihai 264209, China
3
Erasmus School of Law, Erasmus University Rotterdam, 3062 PA Rotterdam, The Netherlands
4
Rotterdam School of Management, Erasmus University Rotterdam, 3062 PA Rotterdam, The Netherlands
5
School of International Relations and Public Affairs, Fudan University, Shanghai 200433, China
*
Author to whom correspondence should be addressed.
Sustainability 2019, 11(9), 2536; https://doi.org/10.3390/su11092536
Submission received: 25 February 2019
/
Revised: 19 April 2019
/
Accepted: 23 April 2019
/
Published: 1 May 2019
(This article belongs to the Special Issue Assessment, Mitigation and Restoration of Ecosystems in a Changing World)
Abstract
:The twenty first century has witnessed an emerging research interest in island urbanization, which will set further pressure on island ecological vulnerability (IEV), especially in those islands with a fixed link to the mainland. In this contribution, the IEV of eighteen towns and townships in Chongming Island is assessed based on an “exposure (E)-sensitivity (S)-adaptive capacity (A)” framework and by means of the entropy weight method for determination of the weight of fifteen indicators. The assessment results show that: (1) An index system consisting of 1 objective, 3 sub-objectives, 8 elements, and 15 indicators can be established and tested to reflect the IEV to island urbanization; (2) The overall ecological vulnerability of Chongming Island to urbanization is at a rather low level, with only three out of eighteen towns and townships at a moderate high and high IEV level, while the spatial distribution of IEV surrounds Chengqiao, the seat of the district government, and radiates in a fan-shaped manner; (3) Chengqiao inevitably leads among the towns and townships in its IEV value, and its westward urbanization has adversely affected the IEV of adjacent towns Xinhe and Jianshe. (4) Chenjia’s moderate low level of IEV comes as a surprise to the authors, due largely to its proximity to Shanghai. Our proposed E-S-A framework and assessment model could be rationally applied to similar islands with fixed links to the mainland nationally and internationally, which is the major contribution of our study.
1. Introduction
The twenty first century has witnessed an emerging research interest in island urbanization around the world. In the aspiration of promoting sustainable development and ameliorating the living condition of local habitants, the significance of island urbanization in Small Island Developing States (SIDS) attracts worldwide academic attention [1]. Researchers have underscored many distinguishing characteristics of the urbanization process in islands, ranging from the high population growth rates found in Melanesian towns [2] and the importance of urbanization as a key driver of national economic growth [3], to problems of urban management throughout the region [4] and its vulnerability driven by extreme exposure to the effects of climate change [5]. In comparison with the above secluded and physically mainland-faraway-detached islands, offshore islands with sea-crossing bridges or tunnels to the mainland have been effective incubators and testing grounds for the sound extrapolation of China’s sustainable urbanization ideology in recent years.
Since the beginning of the new century, concepts of sustainable urbanization, such as sustainable city, eco-city and low carbon city, have proliferated in China among policy-makers and academics [6,7,8,9]. In 2002, Chongming County of Shanghai was formally accepted among the National Ecological Demonstration Zones (NEDZ) initiated by the former Ministry of Environmental Protection (MEP; MEP was superseded by Ministry of Ecology and Environment (MEE) in March 2018) of China [10]. It was widely hailed as the commencement of island urbanization in China, and also accepted in the eco counties program of the former MEP [11] in early 2016, not long before it was upgraded to the level of district of Shanghai in early 2017. Zhoushan City (consisting of 9 archipelagos) of Zhejiang Province had also followed Chongming into the NEDZ program [12] in 2008. Since the two islands pioneered as islands with early fixed links to the mainland and branded as sustainable urbanization, Chongming and Zhoushan have attracted academic interest in a variety of empirical and analytical studies. On the one hand, regarding Chongming‘s urbanization, researchers have spotted a dramatic decline in annual ecosystem service values in Dongtan eco-city (East Beach of Chongming Island) [13], explored some primary strategies for Chongming Eco-Island construction [14], developed a broader planning and policy oriented assessment matrix [15], and critically assessed how ambitions of sustained economic growth and promises of environmentally sustainable futures are combined and translated into realities on the ground by examining a low-carbon development project in Dongtan eco-city [16]. On the other hand, studies on urban expansion in Zhoushan have only recently begun to yield significant academic fruit. Researchers have integrated socio-economic drivers and policy guidance to characterize the spatiotemporal dynamics of urban expansion between 1980 and 2013 [17,18], proposed an analytical framework to help make rural land transfer decisions [19], assessed the ecological carrying capacity of tourism associated with rapid urbanization [20], and examined how ecosystems in the archipelago have been affected by urbanization and related development policies [21,22]. From the review of previous studies, it appears that island urbanization in China constitutes an irreversible process in which Chinese governments eagerly apply their mainland experience in urbanization practices to mainland-connected, offshore islands. Negative lessons were drawn from the suspension of the Dongtan eco-city project in 2008 [23], which was once a reference model among China’s high-profile eco-city projects, island urbanization in China’s context. Hope has not been abandoned since, and the accessibility of the islands to the mainland was improved by the construction of bridges and tunnels.
Since these previous studies primarily consolidated the linkage between island urbanization and national ambitions, knowledge and practice of island ecological vulnerability (IEV) in islands is still a blank. Islands generally have different urban expansion characteristics due to their distinct geological, geographic, and economic features [24]. With Chongming (Chongming denotes former Chongming County, Chongming District, and Chongming Three Island as a whole in the following sections, if not specified) serving as the model for island urbanization in China, the assessment of its IEV can offer an expanded perspective of sustainable urbanization in islands. This article aims at addressing the following questions: (1) What vulnerability framework can be applied to assess the ecological vulnerability of islands with a fixed link to the mainland in the context of China’s urbanization and what indicators can reflect island urbanization features? (2) What results does the IEV index model yield from an ecological perspective? (3) How can the results be utilized to instruct future island urbanization sustainably?
This paper attempts to assess how island ecological vulnerability is affected by island urbanization. Thus, the contribution of this article is three-fold. Firstly, an IEV assessment model which can be applied to islands with fixed links to the mainland is established, breaking its limitation of applicability to just site-specific cases. Secondly, it demonstrates China’s challenges in handling island urbanization to a broader international audience. Thirdly, addressing the above issues offers policy-makers heuristics telling them how to draft urban master plans for islands, taking into consideration ecological vulnerability in a structured manner.
To answer the above questions, the remainder of this article will proceed as follows: Section 2 addresses the theoretical issues and reviews the concept of IEV as it is used here. It provides a set of leading definitions and conceptualizations as they exist in the literature. Section 3 introduces our research materials and methods. It (1) provides a general geographic and demographic description of Chongming; (2) clarifies the methodological approach to IEV assessment, in which the “Exposure-Sensitivity-Adaptive capacity” (E-S-A) framework is adopted and an index system of IEV model is also established, and then (3) presents the process of data acquisition. Section 4 analyzes the results derived from the E-S-A framework and spatial distribution of ecological vulnerability of Chongming. Section 5 discusses the spatial heterogeneity of IEV in Chongming in 2017, and the rationality and applicability of the assessment model. Section 6 synthesizes the findings and concludes by formulating future implications for researchers and policy-makers.
2. Island Ecological Vulnerability: Theory and Framework
2.1. Definition of Ecological Vulnerability and Island Ecological Vulnerability
Vulnerability is generally considered as a function of exposure to a stressor, effect (also termed sensitivity), and recovery potential (also termed adaptive capacity) [25,26,27,28], while the definition of ecological vulnerability (EV) bears an ecotoxicological root, where Van Straalen identified three components in his conceptual model of vulnerable ecological receptors: external exposure, intrinsic sensitivity, and capacity to recover [29]. Ecosystem vulnerability is defined as “the potential of an ecosystem to modulate its response to stressors over time and space, where that potential is determined by characteristics of an ecosystem that include many levels of organization, such as soil, bioregion, tissue, species, organism, and stream reach. It is an estimate of the inability of an ecosystem to tolerate stressors over time and space” [30]. Nevertheless, the limited amount of research that involves the use of indicator systems to assess EV may partially result from the absence of a generally accepted definition and framework that can instruct indicator generation. A wide range of context-specific regions of China have been major research objects, from natural reserves [31], mountainous regions [32], and ecotones [33] where there was little anthropogenic disturbance, to urban areas [34,35] where anthropogenic activities were prominent disturbance factors. Compared with the above EV case studies in China, the island urbanization process and its corresponding EV are still understudied.
Island ecological vulnerability (IEV) is a fledgling definition developed by Chinese researchers during their empirical work in the sustainable urbanization of islands. It is defined as the vulnerability to damage and the difficulty of restoration under unique conditions and various types of disturbance; long-term heterogeneity and controllability are typical features of IEV [36]. In recent years, Shanghai and Chongming, Shanghai and Yangshan Port, Ningbo and Zhoushan, Wenzhou and Dongtou, Fuzhou and Pingtan, Zhanjiang and Donghai Islands have all constructed fixed links to the mainland through sea-crossing bridges or tunnels. It is imperative to assess the IEV impact imposed by ensuing urbanization pressure. Although island urbanization and its ecological consequences have been researched as a case study under China’s context [22], we are far from a thorough understanding of the correlations between IEV and island urbanization, especially with regard to islands that have fixed sea-crossing links to the mainland.
2.2. Conceptual Framework
The report of the Intergovernmental Panel on Climate Change (IPCC) provides a useful typology suggesting that vulnerability may be characterized as a function of three components: exposure, sensitivity, and adaptive capacity [37]. Exposure refers to the magnitude of external of internal perturbations sustained by a system, and sensitivity is defined as the degree to which it would be affected by those perturbations [38]. Adaptive capacity denotes the self-regulated ability of a system in order to adapt to changing conditions and cope with external perturbations [39]. EV and this conceptual framework have been well articulated in marine and coastal ecosystem literature [40,41,42], and applied to research on island spatial heterogeneity in the context of China’s island sustainable urbanization [36]. We adopted the E-S-A framework for reasons: (1) it assembles the primary elements of social-ecological-economic systems at multiple scales; (2) it emphasizes adaptive capacity, which shapes vulnerability to a large extent in the long period of ecosystem management; and (3) it uses a combination of diverse layers and indicators for more integrated assessment.
Our approach applies the IPCC typology to develop a conceptual framework of exposure, sensitivity, and adaptive capacity. Essentially, we are expanding the IPCC definition of climate change vulnerability to ecological vulnerability to urbanization in a regional assessment, and show how different indicators that shape ecological vulnerability vary within an offshore island with fixed links to the mainland. While our approach represents only one interpretation of the IPCC typology, it does furnish a fledgling entry point for discussions related to the utility of ecological vulnerability mapping at both coastal and offshore island areas.
In our paper, island urbanization refers to the island population shift from rural to urban residency, the gradual increase in the proportion of island people living in urban areas, and the ways in which island society adapts to this shift. We follow the convention that (1) the combination of exposure and sensitivity defines the degree of the potential impacts of island urbanization to island ecosystem, (2) vulnerability is the ratio of potential impact to adaptive capacity, and (3) an island ecosystem is anticipated to be vulnerable when exposed to island urbanization impacts, if it is sensitive to those impacts, and if it has a low adaptive capacity to cope with those impacts. Estimating the IEV to island urbanization; thus, requires quantification of these three components (Figure 1) using various indicators that can be identified and quantified.
3. Materials and Methods
3.1. Study Area
Chongming (31°25’–31°38’ N and 121°50’–122°05’ E) is the northernmost district of the provincial-level municipality of Shanghai (Figure 2). It consists of three low-lying inhabited alluvial islands at the mouth of the Yangtze River, north of the Shanghai peninsula and to the west of the Yellow Sea of China: Chongming, Changxing, and Hengsha. Covering an administrative land area of 1413 km2, Chongming is the third largest island in China and the largest alluvial island in the world. Chongming administrates 16 towns and 2 townships, with Chengqiao Town as its administrative center and largest settlement, and Changxing Town and Hengsha Township as two offshore administrative islands. It hosts a small population of 675,875, of which the floating population from outside is 136,729, and a population density of just 575 persons/km2 at the end of 2017 (Table 1). In our study, the administrative land area of 1175.74 km2 is the aggregate land area of its 18 towns and townships, exclusive of Dongping Forest Park, Qianwei Farm, and Shangshi Contemporary Agricultural Park, due to their data deficiencies and non-administrative status.
As one of the most developed coastal metropolitan cores in the world, Shanghai has experienced rapid urbanization in the past two decades, coupled with, on the one hand, economic prosperity and demographic concentration, as well as, on the other hand, environmental pollution and ecological deterioration. Chongming’s superior natural, environmental and ecological advantages would make up for the lack of space for development in Shanghai and provide definite answers to Shanghai’s developmental problems. Ever since the construction of a bridge linking the island with Shanghai Pudong New Area in the south and neighboring Qidong County of Jiangsu Province in the north went into operation in 2009 and 2011 respectively (Figure 2 and Table 2), the interaction between coastal cities and Chongming has been strengthened.
Chongming’s urbanization had been limited until its administrative level was upgraded from Chongming County to Chongming District of Shanghai in July 2016, framing Chongming in the context of massive urban expansion in the Yangtze River Delta. Since then Chongming has undergone an unprecedented level of development concurrent with a series of strategic plans initiated by Shanghai and local governments, including Overall Plan for Chongming Three Islands (2005–2020) [44], Chongming Eco-Island Construction Outline (2010–2020) [45], and the Thirteenth Five-Year Plan for National Economic and Social Development of Chongming (2016–2020) [46]. These plans have not only provided Chongming with plausible policies on sustainable development, but also secured Chongming from rampant urbanization.
3.2. Methods
Guided by the E-S-A framework, assessing the IEV to island urbanization involved three major steps: (1) defining each component in our E-S-A framework; (2) culling indicators from a wide variety of literature to denote exposure, sensitivity, and adaptive capacity; (3) presenting the process of data acquisition and weighting. The “objective-element-indicator layers” structure [36] is adopted.
3.2.1. Component Definition and Indicator Selection
The indicator system consists of 1 objective, 3 sub-objectives, 8 elements, and 15 indicators. The objective layer takes the IEV as the objective, including three sub-objectives: exposure, sensitivity, and adaptive capacity. The elements are selected based on a comprehensive consideration of natural and anthropogenic factors. Indicators are selected according to vulnerability features to island urbanization (Table 3).
Exposure indicator: exposure in this paper is defined as the degree to which ecosystems are exposed to island urbanization within our study area. Urbanization represents a wide range of anthropogenic activities, including demography, economy, sociology, and land management [47]. Exposure indicator includes two elements: Anthropogenic disturbance and Natural pressure. Anthropogenic disturbance includes Population density, Total energy consumption, and Built-up urban area, which were widely applied to indicate the anthropogenic disturbance to ecosystem services [48,49,50,51]. Disaster influence denotes Natural pressure.
Sensitivity indicator: sensitivity in this paper is deduced from the Ecosystem sensitivity (B3), Demographic sensitivity, and Health care sensitivity. Arable land proportion represents Ecosystem sensitivity. Demographic sensitivity is composed of Rural population proportion [52] and Proportion of population over age of 60, whose sensitivity to island urbanization are comparatively acute. Number of medical beds per 100 people [53] denotes Health care sensitivity.
Adaptive capacity indicator: adaptive capacity in this paper refers to the ability of social, economic, and environmental triple systems to cope with the impacts of island urbanization. Given the data availability and indicator applicability, Proportion of tertiary industries [36], Fixed assets investment ratio, and Urbanization rate are selected to signify Social support; GDP (Gross Domestic Product) per capita [36,54,55], GDP growth rate, and Average per capita disposable income for rural residents to Economic development; and Urban green coverage to Environmental conservation.
3.2.2. Data Acquisition
Data sources included Chongming Statistical Yearbook [43,56,57,58], Shanghai Statistical Yearbook [59,60,61], and some of China’s official ministry websites (e.g., Ministry of Natural Resources, Ministry of Ecology and Environment, and Ministry of Science and Technology). Data are collected at the local and municipal scales for the years 2014–2017 to reflect the latest urbanization developments and corresponding IEV.
Disaster influence (C4) is the maximum precipitation and the maximum wind speed during the trajectory of the typhoon Ampil, which tracked across Chongming on July 22nd, 2018 (Figure 3). The typhoon’s trajectory is derived from the typhoon track forecast system (http://typhoon.zjwater.gov.cn/default.aspx). The precipitation and wind speed data is obtained from the Meteorological Information Bulletin released by Chongming Meteorological Service [62].
Zhu et al. calculated the weight of maximum precipitation and maximum wind speed in typhoon disaster with the former being 0.78 and latter being 0.43 [63], and established a comprehensive index of typhoon precipitation and wind speed (Equation (1)):
where I is the comprehensive index of typhoon precipitation and wind speed; x and y are the standardized maximum precipitation and the maximum wind speed, respectively.
3.2.3. Data Normalization and Weighting
With n indicators of b element layer to measure a objective indices (exposure, sensitivity, and adaptive capacity) as its affiliation situation showed in the Table A1 (Appendix B), of Chongming with m towns, the original indicators value matrix can be formed as:
where represents the value of the j-th indicator of the i-th town.
Given the fact that indicators presented different magnitudes and dimensions, all the indicators were primarily normalized according to their orientation [64,65]. The normalization process of indicators could be expressed as Equations (3) and (4).
To measure the average information value of stochastic system, the information entropy of j-th indicator can be defined as:
where , , and suppose when .
The weight of entropy of j-th indicator of e-th element layer could be defined as:
where is the minimum ordinal number and is the maximum ordinal number of indicators in e-th element layer, .
G is obtained from multiplying the weight corresponding to the C indicators by the normalization matrix :
G is multiplied by the harmonic matrix (See Appendix A) to obtain the results of the element layer for each region, matrix .
To calculate the weight of element layer, matrix H should be normalized as Equation (3) and Equation (4) and the normalization matrix is formed.
, the information entropy of e-th element layer, which can be defined as:
where , and suppose when .
The weight of entropy of e-th element layer of d-th objective index could be defined as:
where is the minimum ordinal number and is the maximum ordinal number of element layers in d-th objective index,
The objective index (exposure, sensitivity, and adaptive capacity) of each region are derived from multiplying the weight of the element layer by its normalized matrix and the other harmonic matrix C (See Appendix A).
The ultimate value of IEV for each region is derived from Equations (14) and (15):
where and are the values of objective index—Exposure and Sensitivity for town(ship) i, while is the value of potential impact for town(ship) i.
4. Results
After establishing the conceptual framework for assessing Chongming’s ecological vulnerability, mapping the geographic, demographic, and urbanization process of Chongming, and; thus, presenting detailed methods of data collection and processing, we now look at the assessment results of Chongming in 2017. In this section, the assessment results of Chongming’s exposure, sensitivity, potential impact, adaptive capacity, and overall ecological vulnerability to island urbanization will be examined respectively.
According to IPCC’s classification [37], the IEV is partitioned into five levels and their respective confidence interval is modified in our paper (based upon former State Oceanic Administration’s confidence range of environment carrying capacity [66], and the collective judgement of the authors using the observational evidence and modeling results): low vulnerability (IEV ≤ 0.5), moderate low vulnerability (0.5 < IEV ≤ 0.6), medium vulnerability (0.6 < IEV ≤ 0.8), moderate high vulnerability (0.8 < IEV ≤ 1.0), and high vulnerability (IEV > 1.0).
4.1. Exposure
Figure 4 summarizes the standardized values of the proxy variables for exposure and presents the single-value of exposure indicator for each town or township of Chongming. As the seat of district government, Chengqiao stood out in exposure impacts, denoting the level of high exposure alone, the result of which corresponded to its densest population, highest energy consumption per unit of GDP and built-up urban area proportion among overall 18 towns and townships. While the average value of population density, energy consumption per unit of GDP, and built-up urban area proportion was 575 persons/km2, 0.1 ton standard ton/10,000 yuan, and 5.1%, respectively, the corresponding counterpart of Chengqiao was 1549 persons/km2, 0.17 ton standard ton/1000 yuan, and 31.82%, presenting 2.7 times, 1.7 times, and 6.3 times that of the average level. The respective exposure index of the remaining 17 towns and townships was all below medium level, while their aggregated land area accounted for 95.1% of the total study area. The average ecological exposure degree in Chongming was 0.25, denoting lower than medium level. Affected by the proliferation effect of urbanization in Chengqiao, the aggregated exposure index of adjacent Jianshe ranked second highest, though lagging far behind that of Chengqiao with less than half of its value. Notwithstanding the prominence of Chengqiao in ecological exposure, the overall exposure of Chongming was not significant, due largely to its ecological modernization-guided eco-urbanization prospects [67,68].
4.2. Sensitivity
As shown in Figure 5, generally speaking, Chongming was characterized by a relatively low level of ecological sensitivity, with an average value of 0.51, denoting the medium level. The levels of moderate low and medium sensitivity accounted for 74.4% of the total territory, while the areas of moderate high sensitivity were mainly distributed in the northwest and central part of Chongming. With the largest arable land proportion and percentage of rural population among all, Miao pioneered in ecological sensitivity. The higher arable land proportion and the lowest number of medical beds per 100 people contributed to a higher sensitivity for Gangyan, Sanxing, and Xinhe. The absence of a low sensitivity level indicated that the towns and townships in Chongming were all to a certain extent affected adversely by island urbanization. The absence of a high sensitivity level also revealed that no town or township incurred high sensitivity.
4.3. Potential Impact
The combined effects of ecological exposure and the system’s sensitivity will determine the potential impact. Figure 6 presents the potential impact of each town or township in Chongming on aggregate of ecological exposure and system sensitivity, with an average value of 0.76, denoting the medium level. Chengqiao topped the list of potential impact as the only high potential impact level, followed by Bu as a mere moderate high potential impact level. Chengqiao’s medium sensitivity did not compensate for its high exposure much, signifying that island urbanization had been transforming the landscape of the district’s central town. According to our field investigation in 2016, the Chengqiao district government had transferred most of its administrative departments from the old downtown to a newly-built and well-planned area in the west of Chengqiao, as a result of urbanized expansion. Thirteen out of eighteen towns and townships in Chongming fell into medium potential impact level, whereas no town or township could totally avoid potential impact given its intrinsic sensitivity to urbanization.
4.4. Adaptive Capacit
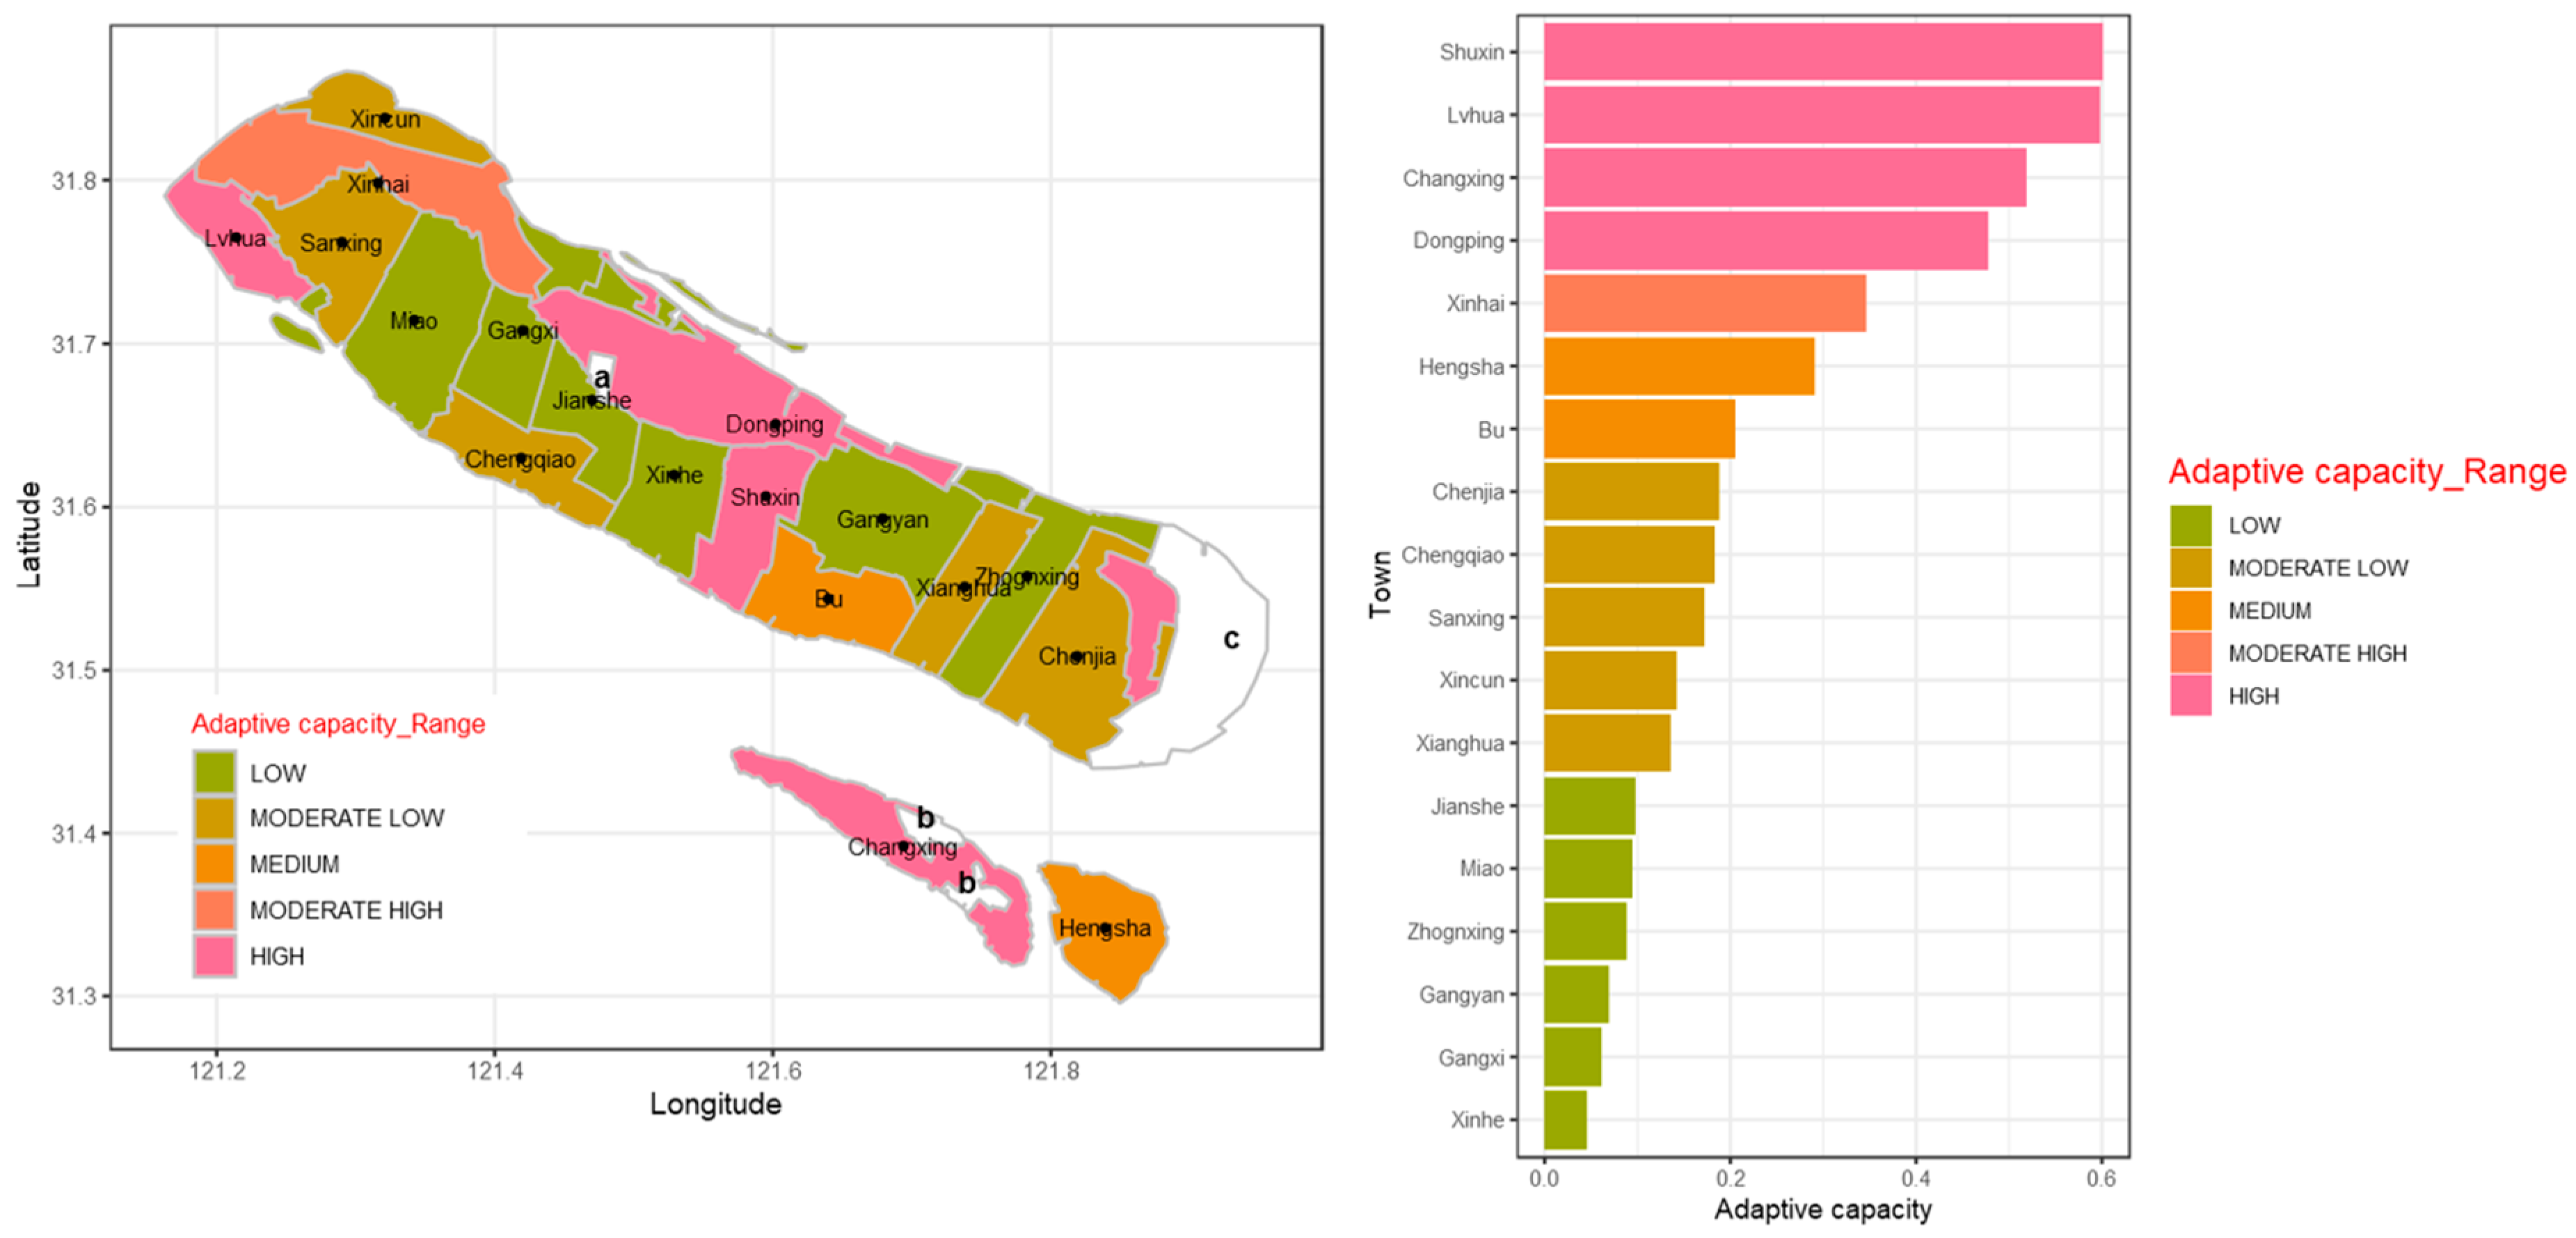
A high adaptive capacity signifies a higher resilience to resist potential impact, thus leading to lower ecological vulnerability. On the one hand, Shuxin, Lvhua, Changxing and Dongping top the list of adaptive capacity as Shuxin and Lvhua leads the towns in environmental conservation and urban green coverage, and Dongping gain more social support in proportion to tertiary industries and urbanization rate. Comparatively, Changxing seems to be a notable exception with strong economic stimuli as an important strategic equipment manufacturing base. Its agglomeration of shipbuilding industry has attracted a wide range of knowledge talents and capital-intensive resources from China’s central government. On the other hand, thirteen out of eighteen towns and townships fell into low, moderate low, and medium adaptive capacity levels, the aggregated land area of which accounted for 65.6% of the total study area, and were located in the southeastern and southwestern parts of Chongming. As shown in Figure 7, the adaptive capacity value of six towns (Xinhe, Gangxi, Gangyan, Zhongxing, Miao, and Jianshe) was below 0.1, which signified a much lower adaptive capacity and definitely a higher level of IEV.
4.5. Composite IEV of Chongming in 2017
The assessment results of IEV are shown in Figure 8 and Table 4. On the whole, the IEV of Chongming was medium, with an average value of 0.62. The spatial distribution of IEV surrounded Chengqiao and radiated in a fan shape. As the seat of Chongming District, Chengqiao inevitably led the towns and townships in its IEV value, due largely to its intrinsic demand for regional urbanization to sustain the social, economic, and ecological development of Chongming. Chengqiao had a high level of exposure and a medium level of sensitivity, aggregated to a high level of potential impact. In addition, a moderate low level of adaptive capacity prompted Chengqiao to incurring the highest vulnerability among all eighteen towns and townships.
As the two towns with moderate high IEV, Xinhe and Jianshe were mostly affected by Chengqiao’s westward urbanization. The remaining fifteen towns and townships fell into medium (five), moderate low (six), and low (five) IEV levels, the aggregated land area of which accounted for 86.3% of the total study area. The main reason for their resilience was their greater adaptive capacity with better social support, sounder economic development, and restricted environmental conservation.
It is surprising that Chenjia has a moderate low level of IEV, though its proximity to the link with Shanghai should have allowed it to be the receptacle and hub for occasional visitors from Shanghai and neighboring provinces for weekend and holiday recreation, and consequently incurred extensive urbanization. As the future eastern transportation hub to the island from Shanghai and neighboring Jiangsu Province, Chenjia is indeed second after Chengqiao in deploying the most extensive resources in terms of real estate and infrastructure development. Our field trip investigation may partially provide answers to the surprise. First, urban plans for Chenjia show the Shanghai Yangtze River Bridge as the dividing line, the west of which remains nearly untouched as the old town center and only the east of which develops as the new residential community for real estate. Second, the Dongtan Wetland Park located in the eastern part of Chenjia has always been well preserved and has furnished Chenjia with a natural environment. Third, specific social, economic, and environmental interventions may increase its adaptive capacity and prompts its lower IEV.
5. Discussion
5.1. The Spatial Heterogeneity of IEV in Chongming in 2017
What stands out in terms of urbanization is that unbridled urban expansion in Chongming has been prevented on most parts of the island [15]. The moderate high and high vulnerable areas of Chongming were distributed in Chengqiao and its adjacent towns, Xinhe and Jianshe. Previous studies indicated that the areas of higher ecological vulnerability always showed higher ecological exposure, higher ecological sensitivity, and lower ecological adaptive capacity, and vice versa [69]. On the one hand, Chengqiao’s high exposure and medium sensitivity resulted in its high potential impact, thus increasing its IEV with ensuing moderate low adaptive capacity. On the other hand, Xinhe and Jianshe’s moderate high IEV scores were largely attributed to their lower adaptive capacity. The ecological vulnerability of the remaining towns and townships was basically decreasing eastwards and westwards according to the distance from Chengqiao. It should come as a surprise to us that Chenjia possessed a moderate low IEV despite its strategic location for linking Shanghai Yangtze River Bridge and Chongming-Qidong Yangtze River Bridge. According to our field investigation in April 2016, Chenjia’s old downtown remained unchanged with few new urban planning and economic stimuli. As the future eastern transportation hub to the island from Shanghai, Chenjia is indeed second after Chengqiao in deploying the most extensive resources, which were mostly landed between the bridge and the eastern Dongtan Wetland Park. There urban expansion evolves due to the built-up areas for luxurious villas and golf courses for the temporary vacationers from Shanghai and neighboring provinces, and the grand vision for a light-rail connection from Shanghai, which would situate Chenjia in the context of regional transportation hub.
According to the distribution of moderate high and high exposure area in Chongming, we found that anthropogenic disturbance is the key element influencing vulnerability negatively. In the sensitivity of island, since the main economic income of Chongming Island (excluding Changxing Island and Hengsha Island) is agriculture and eco-tourism, arable land proportion should be well preserved. The social support, economic development, and environmental conservation would eventually determine the adaptive capacity of the island.
5.2. The Overlap Between IEV Distribution and Eco-Urbanization Project in Chongming
Briefly after the link projects to Shanghai went into operation, the Shanghai Municipal Development and Reform Commission (SHDRC) released the Chongming Eco-Island Construction Outline (2010–2020) in January 2010 in an attempt to sustain Chongming’s ecological development with a medium level of urbanization by 2020. The Outline featured five divisional planning of Chongming with distinctive functions [15], from which the conceptualization of “one capital town and nine towns” was distilled and the urban planning of Chongming was formed along the southern coast, facing right, south to Shanghai.
To a large extent, the IEV distribution of Chongming in our study overlapped divisional urban planning in SHDRC’s Outline. In eastern Chongming, Chenjia (where Dongtan eco-city is located) enjoyed a moderate low IEV, and its strong economic development provided ideal support for scientific innovation and international education, thus far having attracted Shanghai International Studies University to set up Xianda College of Economics and Humanities there in 2004. In northern Chongming, the IEV ranged from moderate low level in central northern town Dongping to low level in northwestern Xinhai town and Xincun township, guaranteeing a sound ecological environment for agriculture. In Western Chongming, Lvhua (where Pearl Lake is located) and Sanxing also scored low IEV and moderate low IEV, respectively, providing a bright prospect for exhibition economy and leisure industries. The sole mismatch was found at the southern coast of Chongming, where only Chenqiao’s newly-built western new town could be unconvincingly called a garden-style town, but with more administrative function rather than resident communities. The other towns alongside the southern coast remained far removed from reaching SHDRC’s ambition.
5.3. Benefits and Limitations of the Model
Not until recent years, several IEV models were developed to assess the state of island ecosystems under major influencing indicators. Cao et al. integrated satellite images and topographic data to portray and characterize the urbanization process in the years 1995–2011 in Zhoushan Island, East China [22], with a focus on its ecological consequences affected by island urbanization. Chi et al. pioneered an IEV model reflecting the land-sea dual features, natural and anthropogenic attributes, and spatial heterogeneity of the island ecosystem, and fitting off-shore archipelagos [36]. Xie et al. followed suit with an emphasis on island anthropogenic disturbance factors in Zhujiajian Island (part of Zhoushan Island) [70]. Thus far, the above IEV models had reflected the comprehensive effects of natural and anthropogenic activities in island areas.
The IEV model proposed in our study adapts to islands with fixed links to the mainland, with a comparatively open and transparent access to data sources. In China, Ningbo and Zhoushan, Wenzhou and Dongtou, Fuzhou and Pingtan, Zhanjiang and Donghai Islands all have established fixed links to the mainland through sea-crossing bridges or tunnels. It is urgent to assess the IEV of those connected islands in response to China’s high-profile urbanization drive and improve island ecological management. This model can also be borrowed to assess IEV for worldwide islands, such as Prince Edward Island of Canada linked by the Confederation Bridge with mainland, and Bahrain Island linked by the King Fahd Causeway with the Saudi Arabian mainland.
Despite the applicability to the above-mentioned island cases, our model seems to possess certain weaknesses. Since ecological vulnerability assessment remains quite broad and our research area stays at a preliminary stage of island urbanization, indicators such as emissions and toxicity are not included and specified in our model. Future research could expand the potential of the model by including such elements and make it suitable for studying cases where urbanization has progressed further. Finally, the E-S-A framework could also be expanded so as to be comprised of more policy-oriented indicators, which would allow for offering policy-makers specific clues for concrete interventions.
5.4. The Applicability of the IPCC Framework to Urbanization
IPCC’s E-S-A vulnerability framework is oriented from climate-induced environmental changes, which is the same phenomenal source of urban adaptive capacity to extreme natural disasters. Urbanization has received substantial recognition in the IPCC Fifth Assessment Report [71], a status it would consolidate as the number of publications related to the interactions of urbanization and climate change has proliferated during the past two decades [72,73]. There are significant risks to urban areas from the impacts of climate change in addition to existing vulnerabilities, primarily because of rapid urbanization.
An integrated response to urbanization will provide substantial opportunities for enhanced resilience, reduced emissions and more sustainable development. In rapidly growing and urbanizing regions, ecological vulnerability assessment based on IPCC’s E-S-A framework can avoid the lock-in of high urbanization patterns and help focus on the initial adaptive capacity to natural disasters in the preliminary planning stage by taking into consideration of local social, economic and environmental factors. With respect to ecological vulnerability assessment, our case study provides a new site-specific field, islands with fixed links to the mainland where the population and assets are exposed to urbanization pressures as well as coastal risks and natural disasters. One of the largest barriers to understanding the implications of urbanization-induced environmental changes for such islands has been the lack of integrated ecological vulnerability assessments that analyze the full range of ecological exposure, sensitivity, adaptive capacity, and their interactions. Our study is projected to fill this void by situating island ecological vulnerability in a wider China’s urbanization context.
6. Conclusions
It is commonly accepted that ecological vulnerability is on the rise due to massive urbanization around the world coasts [40], although the IEV is normally low on the whole due to the island’s usually considerable distance to the mainland and secluded geography [36]. Since several sea-crossing mega projects have been constructed during the past twenty years, both in China and worldwide, islands with fixed links to the mainland have never been immune to urbanization side-effects, such as anthropogenic disturbance and demographic sensitivity. A void exists in spite of established research that has identified ecological vulnerability in inland areas [74], coasts [40], and secluded islands [75]. Our study contributes to the growing literature that attempts to identify the IEV of islands with fixed links to the mainland by collecting and analyzing data from a large island in China through an adapted E-S-A vulnerability framework, which, consisting of 1 objective, 3 sub-objectives, 8 elements, and 15 indicators, is established and tested on the IEV of Chongming to island urbanization coming from China’s mainland. The 3 sub-objectives consider: (1) anthropogenic disturbance and natural pressure as a function of exposure; (2) ecosystem, demography, and health care as sensitivity; and (3) social support, economic development, and environmental conservation as adaptive capacity.
The assessment results in Chongming indicate that, on the whole, the IEV of Chongming was at a medium level, while the spatial distribution of high IEV surrounds Chengqiao, the seat of the district government, and radiates in a fan-shaped manner. Our major findings are that: (1) Chengqiao inevitably leads the towns and townships in its IEV value, and its westward urbanization has adversely affected the IEV of adjacent towns, Xinhe and Jianshe. (2) Chenjia’s moderate low level of IEV comes as a surprise, due to its proximity to the link with Shanghai. Urban planning of the western old town center and eastern new residential community, Dongtan Wetland Preserves, and support from social, economic, and environmental sectors contribute to its unexpected IEV assessment result. Our adapted E-S-A framework and assessment model helps interpret and structure the data collected to show a panoramic view of Chongming’s ecological vulnerability and could be applied to similar islands with fixed links to the mainland in China and elsewhere, which is the major contribution of our study.
Given the ambition to explore oceanic resources and mysteries, island urbanization seems to be irreversible in China. Future implications of our study include policy-oriented research concerning island conservation and island urbanization based on IEV, ecological functions of islands with fixed links to the mainland, and urban symbiosis between coastal cities and islands with infrastructure links to them. Besides, the need for ecological vulnerability assessment approaches capable of examining the critical urbanization-induced risks associated with islands are an unequivocal research priority.
Author Contributions
B.S., X.M. and M.d.J. jointly wrote the article, with B.S. and X.M. focusing more on the methodological parts and M.d.J. more on the theoretical and empirical sections; X.M. and X.B. collected the data; B.S. and X.B. contributed to the data analysis and text-editing. B.S. shares academic responsibility for the research programs in which this paper is embedded.
Funding
This research was funded by the National Natural Science Foundation of China (NSFC) [grant number 71271069; 71774042]. The APC was funded by the Key Program, National Science Foundation of China [grant number 71271069].
Acknowledgments
Xin Ma acknowledges partial support by the Young Teacher Development Fund from Harbin Institute of Technology, Weihai, China.
Conflicts of Interest
The authors declare no conflict of interest.
Appendix A. Harmonic Matrix B and C


Appendix B

Table A1.
The affiliation of variables.
| b | 1 | 2 | 3 | 4 | 5 | 6 | 7 | 8 |
|---|---|---|---|---|---|---|---|---|
| 1,2,3 | 4 | 5 | 6,7 | 8 | 9,10,11 | 12,13,14 | 15 | |
| 1 | 2 | 3 | ||||||
| 1,2 | 3,4,5 | 6,7,8 |
References
- Connell, J.; Lea, J. Urbanization in the Island Pacific: Towards Sustainable Development; Routledge: London, UK, 2002. [Google Scholar]
- Stroey, D. The peri-urban Pacific: From exclusive to inclusive cities. Asia Pac. Viewp. 2003, 44, 259–279. [Google Scholar] [CrossRef]
- Jones, P. Urban Development in the Pacific. Presented at the ESCAP/POC Pacific Workshop on Managing the Transition from Village to City—The Pacific Urban Agenda, Nadi, Fiji Islands, 1–4 December 2003. [Google Scholar]
- Jones, P. Managing urban development in the Pacific. Aust. Plan. 2005, 42, 39–46. [Google Scholar] [CrossRef]
- Scandurra, G.; Romano, A.A.; Ronghi, M.; Carfora, A. On the vulnerability of Small Island Developing States: A dynamic analysis. Ecol. Indic. 2018, 84, 382–392. [Google Scholar] [CrossRef]
- Caprotti, F. Eco-urbanism and the eco-city, or, denying the right to the city? Antipode 2014, 46, 1285–1303. [Google Scholar] [CrossRef]
- De Jong, M.; Joss, S.; Schraven, D.; Zhan, C.; Weijnen, M. Sustainable-smart-resilient-low carbon-eco-knowledge cities: Making sense of a multitude of concepts promoting sustainable urbanization. J. Clean. Prod. 2015, 109, 25–38. [Google Scholar] [CrossRef]
- De Jong, M.; Yu, C.; Joss, S.; Wennersten, R.; Yu, L.; Zhang, X.; Ma, X. Eco city development in China: Addressing the policy implementation challenge. J. Clean. Prod. 2016, 134, 31–41. [Google Scholar] [CrossRef]
- Joss, S.; Molella, A. The eco-city as urban technology: Perspectives on Caofeidian international eco-city (China). J. Urban Technol. 2013, 20, 115–137. [Google Scholar] [CrossRef]
- MEE (Ministry of Ecology and Environment). Announcement of Award of 49 Areas as Pilot National Ecological Demonstration Zones. 2002. Available online: http://www.mee.gov.cn/gkml/zj/wj/200910/t20091022_172084.htm (accessed on 24 December 2018).
- MEE (Ministry of Ecology and Environment). Announcement of Award of 22 Areas as National Eco cities (Districts and Counties). 2016. Available online: http://www.mee.gov.cn/gkml/hbb/bgg/201601/t20160128_327052.htm (accessed on 24 December 2018).
- MEE (Ministry of Ecology and Environment). Announcement of Award of 69 Areas as Pilot National Ecological Demonstration Zones. 2008. Available online: http://www.mee.gov.cn/gkml/hbb/bwj/201004/t20100414_188189.htm (accessed on 24 December 2018).
- Zhao, B.; Kreuter, U.; Li, B.; Ma, Z.J.; Chen, J.K.; Nakagoshi, N. An ecosystem service value assessment of land-use change on Chongming Island, China. Land Use Policy 2004, 21, 139–148. [Google Scholar] [CrossRef]
- Huang, B.R.; Ouyang, Z.Y.; Zheng, H.; Zhang, H.Z.; Wang, X.K. Construction of an eco-island: A case study of Chongming Island, China. Ocean. Coast. Manag. 2008, 51, 575–588. [Google Scholar] [CrossRef]
- Ma, X.; de Jong, M.; den Hartog, H. Assessing the implementation of the Chongming Eco Island policy: What a broad planning framework can tell more than technocratic indicator systems. J. Clean. Prod. 2018, 172, 872–886. [Google Scholar] [CrossRef]
- Den Hartog, H.; Sengers, F.; Xu, Y.; Xie, L.J.; Jiang, P.; de Jong, M. Low-carbon promises and realities: Lessons from three socio-technical experiments in Shanghai. J. Clean. Prod. 2018, 181, 692–702. [Google Scholar] [CrossRef]
- Pan, Y.; Zhai, M.; Lin, L.; Lin, Y.; Cai, J.; Deng, J.; Wang, K. Characterizing the spatiotemporal evolutions and impact of rapid urbanization on island sustainable development. Habitat Int. 2016, 53, 215–227. [Google Scholar] [CrossRef]
- Xie, Z.L.; Li, X.Z.; Zhang, Y.Q.; Chen, S.L. Accelerated expansion of built-up area after bridge connection with mainland: A case study of Zhujiajian Island. Ocean Coast. Manag. 2018, 152, 62–69. [Google Scholar] [CrossRef]
- Wang, H.; Zhang, X.; Wang, H.; Skitmore, M. The right-of-use transfer mechanism of collective construction land in new urban districts in China: The case of Zhoushan City. Habitat Int. 2017, 61, 55–63. [Google Scholar] [CrossRef]
- Chen, J.D.; Ye, G.Q.; Jing, C.W.; Wu, J.P.; Ma, P.P. Ecological footprint analysis on tourism carrying capacity at the Zhoushan Archipelago, China. Asia Pac. J. Tour. Res. 2017, 22, 1049–1062. [Google Scholar] [CrossRef]
- Qiu, S.S.; Yue, W.Z.; Zhang, H.; Qi, J.G. Island ecosystem services value, land-use change, and the National New Area Policy in Zhoushan Archipelago, China. Isl. Stud. J. 2017, 12, 177–198. [Google Scholar] [CrossRef]
- Cao, W.; Li, R.; Chi, X.; Chen, N.; Chen, J.; Zhang, H.; Zhang, F. Island urbanization and its ecological consequences: A case study in the Zhoushan Island, East China. Ecol. Indic. 2017, 76, 1–14. [Google Scholar] [CrossRef]
- Chang, I.C.C.; Sheppard, E. China’s Eco-Cities as Variegated Urban Sustainability: Dongtan Eco-City and Chongming Eco-Island. J. Urban Technol. 2013, 20, 57–75. [Google Scholar] [CrossRef]
- Bertolo, L.S.; Lima, G.T.; Santos, R.F. Identifying change trajectories and evolutive phases on coastal landscapes. Case study: São Sebastião Island, Brazil. Landsc. Urban Plan. 2012, 106, 115–123. [Google Scholar] [CrossRef]
- Turner, B.L., II; Kasperson, R.E.; Matson, P.A.; McCarthy, J.J.; Corell, R.W.; Christensen, L.; Eckley, N.; Kasperson, J.X.; Luers, A.; Martello, M.L. A framework for vulnerability analysis in sustainability science. Proc. Natl. Acad. Sci. USA 2003, 100, 8074–8079. [Google Scholar] [CrossRef]
- Schröter, D.; Polsky, C.; Patt, A. Assessing vulnerabilities to the effects of global change: An eight step approach. Mitig. Adapt. Strateg. Glob. Chang. 2005, 10, 573–595. [Google Scholar] [CrossRef]
- Adger, W.N. Vulnerability. Glob. Environ. Chang. 2006, 16, 268–281. [Google Scholar] [CrossRef]
- De Lange, H.J.; Lahr, J.; Van der Pol, J.J.C.; Wessels, Y.; Faber, J.H. Ecological vulnerability in wildlife: An expert judgment and multi-criteria analysis tool using ecological traits to assess relative impact of pollutants. Environ. Toxicol. Chem. 2009, 28, 2233–2240. [Google Scholar] [CrossRef] [PubMed]
- Van Straalen, N.M. Biodiversity of ecotoxicological responses in animals. Neth. J. Zool. 1994, 44, 112–129. [Google Scholar] [CrossRef]
- Williams, L.R.R.; Kapustka, L.A. Ecosystem vulnerability: A complex interface with technical components. Environ. Toxicol. Chem. 2000, 19, 1055–1058. [Google Scholar] [CrossRef]
- Gu, Q.; Li, J.; Deng, J.; Lin, Y.; Ma, L.; Wu, C.; Wang, K.; Hong, Y. Eco-environmental vulnerability assessment for large drinking water resource: A case study of Qiandao Lake Area, China. Front. Earth Sci. 2015, 9, 578–589. [Google Scholar] [CrossRef]
- Song, G.; Chen, Y.; Tian, M.; Lv, S.; Zhang, S.; Liu, S. The ecological vulnerability evaluation in Southwestern mountain region of China based on GIS and AHP method. Procedia Environ. Sci. 2010, 2, 465–475. [Google Scholar] [CrossRef]
- Qiao, Z.; Yang, X.; Liu, J.; Xu, X. Ecological vulnerability assessment integrating the spatial analysis technology with algorithms: A case of the wood-grass ecotone of Northeast China. Abstr. Appl. Anal. 2013, 2013, 207987:1–207987:8. [Google Scholar] [CrossRef]
- Gao, C.; Lei, J.; Jin, F. The classification and assessment of vulnerability of man-land system of oasis city in arid area. Front. Earth Sci. 2013, 7, 406–416. [Google Scholar] [CrossRef]
- Hong, W.; Jiang, R.; Yang, C.; Zhang, F.; Su, M.; Liao, Q. Establishing an ecological vulnerability assessment indicator system for spatial recognition and management of ecologically vulnerable areas in highly urbanized regions: A case study of Shenzhen, China. Ecol. Indic. 2016, 69, 540–547. [Google Scholar] [CrossRef]
- Chi, Y.; Shi, H.; Wang, Y.; Guo, Z.; Wang, E. Evaluation on island ecological vulnerability and its spatial heterogeneity. Mar. Pollut. Bull. 2017, 125, 216–241. [Google Scholar] [CrossRef] [PubMed]
- McCarthy, J.J.; Canziani, O.F.; Leary, N.A.; Dokken, D.J.; White, K.S. (Eds.) Climate Change 2001: Impacts, Adaptation, and Vulnerability; Cambridge University Press: Cambridge, UK, 2001; pp. 4–8. ISBN 0-521-01500-6. [Google Scholar]
- O’Brien, K.; Leichenko, R.; Kelkar, U.; Venema, H.; Aandahl, G.; Tompkins, H.; Javed, A.; Bhadwal, S.; Barg, S.; Nygaard, L.; et al. Mapping vulnerability to multiple stressors: Climate change and globalization in India. Glob. Environ. Chang. 2004, 14, 303–313. [Google Scholar] [CrossRef]
- Brooks, N.; Adger, W.N.; Kelly, P.M. The determinants of vulnerability and adaptive capacity at the national level and the implications for adaptation. Glob. Environ. Chang. 2005, 15, 151–163. [Google Scholar] [CrossRef]
- Nguyen, T.T.X.; Bonetti, J.; Rogers, K.; Woodroffe, C.D. Indicator-based assessment of climate-change impacts on coasts: A review of concepts, methodological approaches and vulnerability indices. Ocean Coast. Manag. 2016, 123, 18–43. [Google Scholar] [CrossRef]
- Okey, T.A.; Agbayani, S.; Alidina, H.M. Mapping ecological vulnerability to recent climate change in Canada’s Pacific marine ecosystems. Ocean Coast. Manag. 2015, 106, 35–48. [Google Scholar] [CrossRef]
- Yoo, G.; Kim, A.R.; Hadi, S. A methodology to assess environmental vulnerability in a coastal city: Application to Jakarta, Indonesia. Ocean Coast. Manag. 2014, 102, 169–177. [Google Scholar] [CrossRef]
- Chongming Statistical Bureau. Chongming Statistical Yearbook. 2018. Available online: http://www.yearbookchina.com/navibooklist-n3018111125-1.html (accessed on 8 January 2019).
- SHPLRA, Overall Plan for Chongming Three Islands (2005–2020). 2005. Available online: http://www.cmx.gov.cn/cm_website/html/DefaultSite/shcm_xxgk_ghjh_cmsdztgh/List/list_0.htm (accessed on 15 October 2018).
- SHDRC. Chongming Eco-island Construction Outline (2010–2020). 2010. Available online: http://www.shdrc.gov.cn/xxgk/cxxxgk/14202.htm (accessed on 20 October 2018).
- Chongming. The Thirteenth Five-Year Plan for National Economic and Social Development of Chongming County (2016–2020). 2016. Available online: http://fgw.shcm.gov.cn/new_cmfgw_fzggdt_ghjh/2016-04-07/Deta il_545505.htm (accessed on 25 October 2018).
- Wang, S.; Ma, H.; Zhao, Y. Exploring the relationship between urbanization and the eco-environment—A case study of Beijing–Tianjin–Hebei region. Ecol. Indic. 2014, 45, 171–183. [Google Scholar] [CrossRef]
- Burkhard, B.; Kroll, F.; Nedkov, S.; Müller, F. Mapping ecosystem service supply, demand and budgets. Ecol. Indic. 2012, 21, 17–29. [Google Scholar] [CrossRef]
- Castro, A.J.; Verburg, P.H.; Martín-López, B.; Garcia-Llorente, M.; Cabello, J.; Vaughn, C.C.; López, E. Ecosystem service trade-offs from supply to social demand:a landscape-scale spatial analysis. Landsc. Urban Plan. 2014, 132, 102–110. [Google Scholar] [CrossRef]
- Preston, B.; Smith, T.; Brooke, C.; Gorddard, R.; Measham, T.; Withycombe, G.; Beveridge, B.; Morrison, C.; Mclnnes, K.; Abbs, D. Mapping Climate Change Vulnerability in the Sydney Coastal Councils Group; Report prepared for the Sydney Coastal Councils Group; CSIRO: Melbourne, Australia, 2008.
- Villamagnaa, A.M.; Angermeier, P.L.; Bennett, E.M. Capacity, pressure, demand, and flow: A conceptual framework for analyzing ecosystem service provision and delivery. Ecol. Complex. 2013, 15, 114–121. [Google Scholar] [CrossRef]
- Vincent, K. Creating an Index of Social Vulnerability to Climate Change for Africa; Working Paper 56; Tyndall Centre for Climate Change Research: Norwich, UK, 2004. [Google Scholar]
- Kumpulainen, S. Vulnerability concepts in hazard and risk assessment. In Natural and Technological Hazards and Risks Affecting the Spatial Development of European Regions; Schmidt-Thome, P., Ed.; Special Paper 42; Geological Survey of Finland: Helsinki, Denmark, 2006; pp. 65–74. [Google Scholar]
- Schröter, D.; Acosta-Michlik, L.; Arnell, A.W.; Araujo, M.B.; Badeck, F.; Bakker, M.; Bondeau, A.; Bugmann, H.; Carter, T.; Vega-Leinert, A.C.; et al. Advanced Terrestrial Ecosystem Analysis and Modelling-ATEAM Final Report (PIK); Potsdam Institute for Climate Impact Research: Potsdam, Germany, 2004. [Google Scholar]
- Schröter, D.; Cramer, W.; Leemans, R.; Prentice, I.C.; Araújo, M.B.; Arnell, N.W.; Bondeau, A.; Bugmann, H.; Carter, T.R.; Gracia, C.A.; et al. Ecosystem service supply and vulnerability to global change in Europe. Science 2005, 310, 1333–1337. [Google Scholar] [CrossRef]
- Chongming Statistical Bureau. Chongming Statistical Yearbook. 2015. Available online: http://www.yearbookchina.com/navibooklist-n3018111128-1.html (accessed on 10 October 2018).
- Chongming Statistical Bureau. Chongming Statistical Yearbook. 2016. Available online: http://www.yearbookchina.com/navibooklist-n3018111127-1.html (accessed on 20 October 2018).
- Chongming Statistical Bureau. Chongming Statistical Yearbook. 2017. Available online: http://www.yearbookchina.com/navibooklist-n3018111126-1.html (accessed on 28 October 2018).
- Shanghai Statistical Bureau. Shanghai Statistical Yearbook 2015; Chinese Statistical Press: Shanghai, China, 2016. Available online: http://www.stats-sh.gov.cn/html/sjfb/201701/1000201.html (accessed on 12 September 2018).
- Shanghai Statistical Bureau. Shanghai Statistical Yearbook 2016; Chinese Statistical Press: Shanghai, China, 2017. Available online: http://www.stats-sh.gov.cn/html/sjfb/201701/1000339.html (accessed on 16 September 2018).
- Shanghai Statistical Bureau. Shanghai Statistical Yearbook 2017; Chinese Statistical Press: Shanghai, China, 2018. Available online: http://www.statssh.gov.cn/html/sjfb/201801/1001529.html?pClassID=664&ClassID=665&Matter D=61127 (accessed on 18 September 2018).
- Yuan, Y.H. Meterological Information Bulletin; Chongming Meterological Service: Shanghai, China, 2018; p. 15. [Google Scholar]
- Zhu, J.; Lu, Y.; Li, G.P.; Ren, F.M. Risk assessment of typhoon disasters in Fujian Province of each county. J. Catastrophol. 2017, 32, 204–209. (In Chinese) [Google Scholar] [CrossRef]
- Yang, Q.; Lin, A.; Zhao, Z.; Zou, L.; Sun, C. Assessment of urban ecosystem health based on entropy weight extension decision model in urban agglomeration. Sustainability 2016, 8, 869. [Google Scholar] [CrossRef]
- Wang, M.; Zhao, X.; Gong, Q.; Ji, Z. Measurement of regional green economy sustainable development ability based on entropy weight-topsis-coupling coordination degree—A case study in Shandong Province, China. Sustainability 2019, 11, 280. [Google Scholar] [CrossRef]
- MEE (Ministry of Ecology and Environment). The Guideline of Index System and Technical Methods for Monitoring and Early-Warning of Marine Resources and Environment Carrying Capacity; State Oceanic Administration PRC: Beijing, China, 2015. (In Chinese)
- Ma, X.; de Jong, M. Chongming Island as a test-bed of eco island development in China: What is the evidence? In Proceedings of the 2016 23rd Annual International Conference on Management Science and Engineering (ICMSE), Olten, Switzerland, 18–20 August 2016; pp. 983–997. [Google Scholar]
- Xie, L.J.; Flynn, A.; Tan-Mullins, M.; Cheshmehzangi, A. The making and remaking of ecological space in China: The political ecology of Chongming Eco-Island. Polit. Geogr. 2019, 69, 89–102. [Google Scholar] [CrossRef]
- Jiang, L.; Huang, X.; Wang, F.; Liu, Y.; An, P. Method for evaluating ecological vulnerability under climate change based on remote sensing: A case study. Ecol. Indic. 2018, 85, 479–486. [Google Scholar] [CrossRef]
- Xie, Z.; Li, X.; Jiang, D.; Lin, S.; Yang, B.; Chen, S. Threshold of island anthropogenic disturbance based on ecological vulnerability Assessment—A case study of Zhujiajian Island. Ocean Coast. Manag. 2019, 167, 127–136. [Google Scholar] [CrossRef]
- IPCC. Climate Change 2014: Synthesis Report. Contribution of Working Groups I, II and III to the Fifth Assessment Report of the Intergovernmental Panel on Climate Change; Pachauri, R.K., Meyer, L.A., Eds.; IPCC: Geneva, Switzerland, 2014; pp. 111–112. [Google Scholar]
- Satterthwaite, D. The implications of population growth and urbanization for climate change. Environ. Urban. 2009, 21, 545–567. [Google Scholar] [CrossRef]
- Chapman, S.; Watson, J.E.M.; Salazar, A.; Thatcher, M.; McAlpine, C.A. The impact of urbanization and climate change on urban temperatures: A systematic review. Landsc. Ecol. 2017, 32, 1921–1935. [Google Scholar] [CrossRef]
- Qiu, B.; Li, H.; Zhou, M.; Zhang, L. Vulnerability of ecosystem services provisioning to urbanization: A case of China. Ecol. Indic. 2015, 57, 505–513. [Google Scholar] [CrossRef]
- Farhan, A.R.; Lim, S. Vulnerability assessment of ecological conditions in Seribu Islands, Indonesia. Ocean Coast. Manag. 2012, 65, 1–14. [Google Scholar] [CrossRef]
Figure 1.
Conceptual framework of ecological vulnerability.

Figure 2.
Geographic location of the Chongming Island (Source: Google Maps).

Figure 3.
Disaster influence (C4): Typhoon Ampil’s trajectory across Chongming on July 22nd, 2018. a. Dongping Forest Park. b. Qianwei Farm. c. Shangshi Contemporary Agricultural Park.
Figure 3.
Disaster influence (C4): Typhoon Ampil’s trajectory across Chongming on July 22nd, 2018. a. Dongping Forest Park. b. Qianwei Farm. c. Shangshi Contemporary Agricultural Park.

Figure 4.
Ecological exposure of Chongming in 2017.

Figure 5.
Ecological sensitivity of Chongming in 2017.

Figure 6.
Ecological potential impact of Chongming in 2017.

Figure 7.
Ecological adaptive capacity of Chongming in 2017.

Figure 8.
Composite island ecological vulnerability assessment of Chongming in 2017.

Table 1.
Land area, population, and density of population in towns/townships of Chongming (2017).
| Towns/Townships | Land Area (sq.km) | Year-End Resident Population | Of Which | Density of Population (persons/sq.km) |
|---|---|---|---|---|
| Floating People | ||||
| Total | 1175.74 | 675,875 | 136,729 | 575 |
| Chengqiao Town | 57.52 | 89,087 | 18,991 | 1549 |
| Bu Town | 61.30 | 59,721 | 1578 | 974 |
| Xinhe Town | 61.96 | 45,137 | 5557 | 728 |
| Miao Town | 95.51 | 55,762 | 3652 | 584 |
| Shuxin Town | 58.86 | 39,963 | 3987 | 679 |
| Xianghua Town | 53.78 | 31,086 | 2367 | 578 |
| Sanxing Town | 68.17 | 39,054 | 1130 | 573 |
| Gangyan Town | 74.92 | 51,644 | 3023 | 689 |
| Zhognxing Town | 51.50 | 30,228 | 2630 | 587 |
| Chenjia Town | 82.31 | 59,863 | 6032 | 727 |
| Lvhua Town | 37.45 | 8607 | 1133 | 230 |
| Gangxi Town | 45.73 | 27,416 | 2563 | 600 |
| Jianshe Town | 42.40 | 30,687 | 2537 | 724 |
| Xinhai Town | 105.04 | 10,919 | 3522 | 104 |
| Dongping Town | 119.70 | 11,897 | 7323 | 99 |
| Changxing Town | 82.96 | 40,793 | 67,017 | 492 |
| Xincun Township | 24.89 | 10,600 | 1990 | 426 |
| Hengsha Township | 51.74 | 33,411 | 1697 | 646 |
Source: Chongming Statistical Yearbook 2018 [43].
Table 2.
Major bridges linking Chongming with Shanghai and Jiangsu Province.
| Bridge/Tunnel Name | Length (km) | Beginning of Construction | Completion Time | Linked Areas |
|---|---|---|---|---|
| Shanghai Yangtze River Tunnel | 8.95 | 28/12/2004 | 31/10/2009 | Pudong New Area of Shanghai and Changxing Island |
| Shanghai Yangtze River Bridge | 16.65 | Changxing Island and Chongming Island | ||
| Chongming-Qidong Yangtze River Bridge | 52 | 1/08/2008 | 24/12/2011 | Northern Chongming of Shanghai and Qidong County of Jiangsu Province |
Table 3.
Indicator system of Island Ecological Vulnerability (IEV) model and their respective weights for Chongming.
Table 3.
Indicator system of Island Ecological Vulnerability (IEV) model and their respective weights for Chongming.
| Objective Layer | Element Layer | Element Layer Weight | Indicator Layer/Type/Source | Indicator Calculation | Indicator Layer Weight | |
|---|---|---|---|---|---|---|
| IEV | Exposure | B1 Anthropogenic disturbance | 0.79 | C1 Population density (+) [43] | Number of permanent population/regional area | 0.17 |
| C2 Energy consumption per unit of GDP (+) [43] | Energy consumption/GDP (Gross Domestic Product) | 0.30 | ||||
| C3 Built-up urban area proportion (+) [43] | Built-up urban area/regional area | 0.53 | ||||
| B2 Natural pressure | 0.21 | C4 Disaster influence (+) [62] | Details below | 1.00 | ||
| Sensitivity | B3 Ecosystem sensitivity | 0.32 | C5 Arable land proportion (+) [43] | Arable land area/regional area | 1.00 | |
| B4 Demographic sensitivity | 0.27 | C6 Rural population proportion (+) [43] | Number of rural population/regional population | 0.49 | ||
| C7 Proportion of population over age of 60 (+) [43] | Number of population over age of 60/regional population | 0.51 | ||||
| B5 Health care sensitivity | 0.41 | C8 Number of medical beds per 100 people (−) [43] | Number of medical beds/number of regional population × 100 people | 1.00 | ||
| Adaptive | B6 Social support | 0.09 | C9 Proportion of tertiary industries (+) [43] | Tertiary industries added value/GDP | 0.20 | |
| Capacity | C10 Fixed assets investment ratio (+) [59] | Regional amount/total amount | 0.34 | |||
| C11 Urbanization rate (+) [60] | Urban population/regional population | 0.46 | ||||
| B7 Economic development | 0.40 | C12 GDP per capita (+) [60] | GDP/number of regional permanent population | 0.63 | ||
| C13 GDP growth rate (+) [43,56,57,58] | Annual average GDP growth rate in recent 3 years | 0.33 | ||||
| C14 The average per capita disposable income for rural residents (+) [61] | Yuan/year | 0.04 | ||||
| B8 Environmental conservation | 0.51 | C15 Urban green coverage (+) [61] | Urban green area/urban built-up area | 1.00 | ||
Note: The indicators could be divided into positive indicators (+) and negative indicators (−) according to their properties. The greater the positive indicators are, the better the results are, while the negative indicators are the opposite.
Table 4.
Evaluation results of composite IEV in Chongming.
| Region | B1 Anthropogenic Disturbance | B2 Natural Pressure | B3 Ecosystem Sensitivity | B4 Demographic Sensitivity | B5 Health Care Sensitivity | B6 Social Support | B7 Economic Development | B8 Environmental Conservation | IEV |
|---|---|---|---|---|---|---|---|---|---|
| Chengqiao | 0.9426 | 0.4965 | 0.5158 | 0.1112 | 0.7454 | 0.5693 | 0.0928 | 0.1468 | 1.1555 |
| Xinhe | 0.2138 | 0.5317 | 0.6868 | 0.6877 | 0.3949 | 0.386 | 0.0371 | 0.000 | 0.8163 |
| Jianshe | 0.3997 | 0.4435 | 0.4143 | 0.7173 | 0.2697 | 0.3399 | 0.0756 | 0.0741 | 0.8011 |
| Bu | 0.3113 | 0.6279 | 0.6032 | 0.4539 | 0.5896 | 0.4027 | 0.046 | 0.2984 | 0.7619 |
| Gangyan | 0.0923 | 0.5901 | 0.9628 | 0.3919 | 0.5348 | 0.4672 | 0.0555 | 0.0009 | 0.7261 |
| Miao | 0.1486 | 0.1687 | 1.000 | 0.7698 | 0.2199 | 0.51.1 | 0.0619 | 0.0277 | 0.7135 |
| Gangxi | 0.1803 | 0.4435 | 0.3313 | 0.6216 | 0.3697 | 0.2873 | 0.0794 | 0.0138 | 0.6154 |
| Sanxing | 0.0927 | 0.2917 | 0.846 | 0.751 | 0.2294 | 0.316 | 0.1363 | 0.1554 | 0.5984 |
| Xianghua | 0.1888 | 0.4922 | 0.5277 | 0.4121 | 0.3847 | 0.4406 | 0.1679 | 0.0074 | 0.5755 |
| Chenjia | 0.2283 | 0.4392 | 0.7183 | 0.3841 | 0.2644 | 0.3017 | 0.1197 | 0.2096 | 0.5713 |
| Dongping | 0.2521 | 0.5228 | 0.0089 | 0.3969 | 1.000 | 0.6637 | 0.1234 | 0.6553 | 0.5398 |
| Changxing | 0.3448 | 0.4646 | 0.398 | 0.1348 | 0.7997 | 0.4773 | 0.7081 | 0.1195 | 0.5302 |
| Zhongxing | 0.1301 | 0.3873 | 0.5533 | 0.4867 | 0.2298 | 0.2805 | 0.1059 | 0.0392 | 0.508 |
| Xinhai | 0.0781 | 0.3928 | 0.000 | 0.5062 | 1.000 | 0.5468 | 0.1817 | 0.3696 | 0.4851 |
| Xincun | 0.2101 | 0.1722 | 0.3066 | 0.7497 | 0.0746 | 0.1144 | 0.1746 | 0.1159 | 0.4806 |
| Lvhua | 0.3226 | 0.000 | 0.4617 | 0.6987 | 0.3117 | 0.2939 | 0.1761 | 0.9452 | 0.4646 |
| Shuxin | 0.1293 | 0.5266 | 0.6572 | 0.7322 | 0.2638 | 0.3044 | 0.1307 | 1.000 | 0.4557 |
| Hengsha | 0.1093 | 1.000 | 0.2893 | 0.6459 | 0.000 | 0.3272 | 0.4624 | 0.0079 | 0.4237 |
© 2019 by the authors. Licensee MDPI, Basel, Switzerland. This article is an open access article distributed under the terms and conditions of the Creative Commons Attribution (CC BY) license (http://creativecommons.org/licenses/by/4.0/).
Share and Cite
MDPI and ACS Style
Sun, B.; Ma, X.; de Jong, M.; Bao, X. Assessment on Island Ecological Vulnerability to Urbanization: A Tale of Chongming Island, China. Sustainability 2019, 11, 2536. https://doi.org/10.3390/su11092536
AMA Style
Sun B, Ma X, de Jong M, Bao X. Assessment on Island Ecological Vulnerability to Urbanization: A Tale of Chongming Island, China. Sustainability. 2019; 11(9):2536. https://doi.org/10.3390/su11092536
Chicago/Turabian StyleSun, Baiqing, Xin Ma, Martin de Jong, and Xin Bao. 2019. "Assessment on Island Ecological Vulnerability to Urbanization: A Tale of Chongming Island, China" Sustainability 11, no. 9: 2536. https://doi.org/10.3390/su11092536
Note that from the first issue of 2016, this journal uses article numbers instead of page numbers. See further details here.