Abstract
This paper presents a methodology to evaluate (1) to what extent students of a higher degree in the field of education acquire sustainability competencies, and (2) to determine whether the subjects that develop Education for Sustainable Development (ESD) achieve their learning objectives. The methodology is applied to a case study. The instruments used are the sustainability survey and the sustainability presence map developed by the EDINSOST project. The survey consists of 18 questions, and has been answered by 104 first-year students and 86 fourth-year students belonging to the Bachelor Degree in Primary Education Teaching at the University of Seville. The Mann-Whitney U test has been used to compare the results of the two students groups, and Cohen’s D has been used to measure the effect size. Students only obtain significant improvements, with 95% confidence, in three questions: Q4 (I know procedures and resources to integrate sustainability in the subjects), Q5 (I analyze the opportunities presented in the subjects to plan educational projects to integrate sustainability) and Q6 (I design educational projects from the perspective of sustainability), all concerning critical thinking and creativity. An improvement is also detected in question Q11 (I know how to develop myself satisfactorily in community educational projects, encouraging participation), with a confidence of 90%. Surprisingly, no subject in the curriculum develops the learning outcomes concerning questions Q4, Q5 and Q6, and only one subject develops the learning outcomes regarding question Q11. However, up to five subjects declare development of the learning outcomes regarding questions in which there is no improvement in student learning. These results suggest that the subjects are failing to reach their ESD learning objectives, and that the students are either trained in sustainability outside the university or the subject learning guides do not reflect the work done by the students throughout their studies.
1. Introduction
The recent UNESCO publication "Education for the Sustainable Development Goals. “Learning objectives” [1] highlights once again the importance of education as a key instrument for achieving the Sustainable Development Goals (SDG). As part of the SDG4 Sustainable Development Goal, “Quality Education,” goal 4.7 indicates that all students must acquire the knowledge and skills necessary to promote sustainable development [1].
A broad consensus exists among higher education administrators, academics, researchers and those responsible for formulating university policies, that higher education institutions play a very important role in achieving the SDG [2,3,4]. Higher education institutions must be involved in all the changes that are proposed as relevant and/or necessary [5]. However, as stated by Leal Filho et al. [6], the inclusion of Education for Sustainable Development (ESD) in universities is still in diapers [2].
Although sustainability is increasingly recognized as an important principle for the design of higher education, the actual large-scale implementation of Higher Education for Sustainable Development is still very scarce [7]. The effective integration of ESD is complicated, especially since there are very different ideas about how ESD could and should be implemented. For example, different proposals have been made about the learning outcomes that students must achieve, and about the educational methodologies, pedagogies and philosophies that teachers should use [8]. Despite the diversity of existing proposals, an objective shared by the different approaches of ESD is to help students to develop an understanding of sustainability that they can then use to analyze specific problems and act accordingly. Therefore, one of the central aspects that must come under consideration is the competencies that should be developed in the teaching-learning processes [9] and an analysis of whether indeed they are being acquired by the students.
As a result of the adaptation of the curricula of the Spanish university system to the European Higher Education Area, many Bachelor degrees have included sustainability and social commitment as a transversal competency. The UNESCO report "Education for Sustainable Development Goals. Learning Objectives" [1] mentions a set of key competences for sustainability that must be developed in all degrees:
- Systems thinking competency
- Anticipatory competency
- Normative competency
- Strategic competency
- Collaboration competency
- Critical thinking competency
- Self-awareness competency
- Integrated problem-solving competency
The introduction of these competences into the curricula of all degrees can provide a powerful tool in university education to prepare students for the performance of their professional duties, while ensuring that all professionals who complete their university studies acquire the basic skills for decision-making and carrying out their activities from the perspective of sustainability.
Competence-based learning plays an integrating role. It combines knowledge (theoretical background), skills (methodological capabilities within a discipline or practice area) and attitudes (values that provide a moral compass for behavior and decision-making), and therefore has a pivotal effect on behavior in the context of sustainability. Sustainability-related competencies (hereafter, sustainability competencies) are essential for developing capacities that allow people to critically review current values, policies and practices, as well as enabling them to make decisions and act for change. Therefore, sustainability competencies have an emancipatory and transformative impact [10].
Sustainable development has cognitive, normative and motivational factors, such as important prerequisites for making informed decisions, planning and carrying out interventions. In this respect, the integrative nature of competencies is especially important. The implementation of ESD not only requires the creation of knowledge, which also occurs with competencies: its development also requires a change in teaching and learning methods. The introduction of sustainability competencies in the curriculum implies a change in the culture of teaching, in teaching-learning methods and in the methodological strategies related to ESD. It is the primary element that must be taken into account in order for this introduction to be real. Thus, if competencies are a central element for the achievement of ESD, if follows that the teaching-learning methodology constitutes the second essential element.
In a recent work, Lozano et al. [8] explored the relationship that should be articulated between the competencies and the methodologies to be used for the development of ESD. Most of the methodologies proposed in teaching SDGs are based on constructivism. In this approach, students are at the center of the teaching-learning process, and as such they are the ones who build knowledge [11]. Students are therefore at the very heart of the teaching activity, and this constitutes the third core element of ESD. However, around the students crucial actors must orbit: teachers, since it is they who are charged with preparing new generations to face the challenges of current unsustainable development and who also have a role in shaping the future.
The possession of sustainability competencies is crucial for teachers, who are unable to provide an appropriate ESD if they themselves have not acquired the necessary competencies [12]. Teacher training can therefore be regarded as the fourth essential element for the integration of ESD in university classrooms.
We agree with Cebrián & Junyent [13] when they argue that exploring the perceptions about ESD of Education degree students, and determining the learning outcomes they acquire during their university academic career are fundamental. The future teaching staff -current Education degree students around whom this research is framed- will be responsible for designing and implementing the next generation of educational programs.
Various studies and reports on the integration of sustainability in higher education point out that the greatest obstacles and barriers to change are found precisely in teaching [14]. This situation highlights the importance of developing research aimed at assessing whether an effective integration of sustainability into the curricula [14,15] and into university teaching exists, and whether or not better learning outcomes are being obtained in sustainability competencies.
The existing literature on higher education regarding the evaluation of student learning outcomes has recently been growing [15]. It stresses that a good assessment of teaching and learning is essential for (1) understanding the complexity of the student learning process and (2) for evaluating the effectiveness of curricula and teaching practices [16]. Although these investigations have begun to examine how university teaching can be improved, there is broad agreement that measuring teaching and learning in universities is a very complex task [16].
Theorists of measurement and educational evaluation have suggested that, in order to understand the dynamic and complex nature of the functioning of teaching-learning processes, it is necessary to use multiple methods to achieve a more comprehensive perspective [16,17].
Nevertheless, previous studies have largely focused on measuring student learning outcomes, thereby paying too much attention to analyzing the validity and reliability of course evaluations as the only method of evaluation. Fewer studies exist on the use of multiple methods and their combination as a source of evidence for assessing the effectiveness of university education [18,19]. Examining how these methods are combined in order to understand learning processes in higher education will lead to a better measurement of the complex concept of university teaching, as well as enabling the appropriate design of actions for teaching and promoting ESD.
In essence, the use of multiple methods, combined and integrated into a methodology to evaluate teaching and learning, will enable the main causes for why ESD is failing to achieve its objectives to be indentified, as well as where it is possible to bring about improvement by providing specific lines of action to enhance the investment of resources in Spanish universities.
The main objective of the study presented in this paper is to diagnose the effectiveness of ESD in a higher degree in Education by means of a specific methodology that combines the use of multiple assessment instruments. The results are derived from one of the phases carried out in the EDINSOST project (education and social innovation for sustainability). EDINSOST [20] is a Spanish project that aims to facilitate the training of engineering and education graduates as agents of change through the integration of sustainability curricula in the Spanish University System. The results obtained allow us to determine the strengths and weaknesses of ESD in the teaching-learning processes, as well as enabling us to propose improvement strategies to advance its integration and effective implementation.
2. Materials and Methods
This paper presents a methodology to evaluate the learning achieved in ESD by students of a university degree in the field of education. The methodology is applied, as a case study, to the Bachelor Degree in Primary Education Teaching at the University of Seville.
2.1. Research Questions
This study aims to answer the following two research questions:
- Can it be affirmed that the students of a given higher education degree improve their sustainability competencies during their academic career?
- Can it be affirmed that the subjects that develop sustainability competencies in the curriculum of a given higher degree of Education reach their objectives regarding ESD?
2.2. Instruments
This paper uses three instruments in order to answer the two research questions:
- The EDINSOST sustainability map for education degrees (see Table A1 in the Appendix A). The sustainability map is a competency map [21] containing the learning outcomes expected from graduates on completion of their studies. Learning outcomes are classified using a simplified version of Miller’s pyramid [22] as a learning taxonomy. The domain levels of the taxonomy used in the sustainability map are “Know” (level 1), “Know how” (Level 2) and "Demonstrate + Do" (Level 3).
- The sustainability presence map. The sustainability presence map is organized as a sustainability map, but the cells contain the number of subjects that develop the learning outcomes corresponding to that cell in a given curriculum. Unlike the sustainability map, which is linked to all curricula of a particular degree, each curriculum has its own sustainability presence map. The Appendix A shows the sustainability presence map of the case study (see Table A2).
- The EDINSOST sustainability survey for education degrees (see Appendix A). The survey consists of 18 questions. Each question corresponds to one of the cells on the sustainability map. Students answer the questions using a 4-point Likert scale [23] with the following rating: Strongly disagree, Disagree, Agree and Strongly agree. The relationship between the survey questions and the learning outcomes of the sustainability map can be found in Table A3 of the Appendix A.
2.3. Procedure
The fourth- and first-year students of a degree answer the survey at the same time. First- and fourth-year students will therefore not be the same. It is assumed that both groups of students had a similar training on entering the university, although first-year students entered three years later than fourth-year students did. The results are based on comparing, for each question and using the appropriate statistics, the answers of the fourth-year students with the answers of the first-year students.
2.4. Statistical Analysis
2.4.1. Conversion of Responses to Discrete Values
In order to perform a statistical analysis of the data, the qualitative answers of the students to each question of the survey are converted into a discrete numerical range in the interval [0..3]. The following correspondence is made:
- Strongly disagree: value 0
- Disagree: value 1
- Agree: value 2
- Strongly agree: value 3
2.4.2. Statistical Analysis of the First Research Question
To answer the first research question, “Can it be affirmed that the students of a given higher education degree improve their sustainability competencies during their academic career?”, the Shapiro-Wilk Normality test is conducted on the students’ answers to each question, in order to determine whether the answers conform to a normal distribution. If this is the case, the students’ T test may be used to compare the responses of first- and fourth-year students. Should the distribution not be normal, the Mann-Whitney U test is performed to compare the answers to each question. This test indicates whether significant differences exist between the results of first-year and fourth-year.
We are not only interested in knowing if there are differences, but how big those differences are. In order to obtain this data, Cohen’s D is calculated for each question. Cohen’s D allows the size of the effect to be measured. In general, 0.2 is a small effect size, 0.5 is a medium size and 0.8 is a large size (Cohen’s D may have a value greater than 1).
2.4.3. Graphical Presentation of Results for the First Research Question
When working with Likert variables, the median is usually a better indicator than the mean. The calculation of the mean as a representative value is not advisable if the respondents are not certain of perceiving the responses as equidistant. Since the survey is not presented graphically, student perception cannot be guaranteed. However, the mean also provides information.
In order to present the results graphically, the mean and median of each question are calculated for the first- and fourth-course responses. The comparison of the first- and fourth-year results is made both in an absolute value (recommended procedure for Likert variables) and as a percentage (simply for informational purposes) for all questions.
Next, an analysis is conducted to determine whether a correlation exists between the values provided by Cohen’s D and the measured learning (from medians and means, both in percentage and in absolute value in the case of means). If a high correlation exists between the value of Cohen’s D for each question and the learning calculated from mean, it can be affirmed that the students perceive the answers in a linear and equidistant way to each other, and thus the mean will be a valid indicator, as well as the results calculated from the mean. If this correlation is small, the values of the means are dismissed and only the values of the medians are considered in the results.
For questions in which the Mann-Whitney U (or the student’s T) identifies significant improvements, the mean and median responses of first- and fourth-year students are presented using Significant Mean Difference Plots. The mean is with a 95% confidence interval. The Significant Mean Difference Plots allow the significance of the differences between the results of the first and fourth year to be contrasted. The less overlap between the first- and fourth-year values, the greater the indication of significant difference.
The comparison of the mean and median values enables us to form a better idea of how the responses are distributed. To view this distribution graphically, the distribution of the first- and fourth-course answers to each question in which the Mann-Whitney U test (or Student’s T) identifies significant improvements is presented.
2.4.4. Statistical Analysis of the Second Research Question
To answer the second research question, “Can it be affirmed that the subjects that develop sustainability competencies in the curriculum of a given higher degree of Education reach their objectives regarding ESD?”, the number of subjects that develop the learning outcomes for each question of the survey (data obtained from the sustainability presence map), and the improvement achieved by the students on completion of their studies (Cohen’s D), are compared. If a high correlation exists between both variables, it can be concluded that the subjects are achieving their ESD objectives; otherwise, the opposite will be determined.
Table A3, in the Appendix A, presents the relationship between the survey questions (Q1–Q18) and the learning outcomes of the sustainability map.
2.5. Case Study
As a case study, the Bachelor Degree in Primary Education Teaching at the University of Seville is analyzed.
The sample consists of 104 first-year students and 86 fourth-year students. All students responded voluntarily to the survey during the first semester of the year 2018. Students gave their express consent so that the answers could be used anonymously by the EDINSOST project in order to meet the project objectives.
3. Results and Discussion
3.1. Results of the First Research Question
The first research question is: Can it be affirmed that the students of a given higher education degree improve their sustainability competencies during their academic career?
The Shapiro-Wilk Normality test concludes that all questions violate the assumption of normality (p < 0.05). The null hypothesis that the variables follow a normal distribution is therefore rejected, and the student’s T cannot be used to make the comparison.
Therefore, to compare the results of first- and fourth-year students, the Mann-Whitney U test is applied to each question. This test indicates whether significant differences exist between the results of the first year and fourth year.
The results of the Mann-Whitney U test show only significant differences (p < 0.05) in questions Q4, Q5, and Q6. The differences in question Q11 are significant, with a confidence level of 90%. From these results, the data corresponding to questions Q4, Q5, Q6 and Q11 will be analyzed in more detail. In these questions, students are asked whether they know procedures and resources for integrating sustainability into the subjects (Q4); whether they know how to analyze the opportunities presented in the subjects to plan educational projects that integrate sustainability (Q5); whether they know how to design educational projects from the perspective of sustainability (Q6), and whether they know how to perform satisfactorily in community educational projects, encouraging participation (Q15).
Cohen’s D is applied to each question (Q4, Q5, Q6 and Q11) to measure the effect size. The null hypothesis is that fourth-year learning is greater than first-year learning. The size of all measured effects is small. The largest effect size corresponds to Q4 (0.44). The effect size of Q5 is 0.24, that of Q6 is 0.30 and that of Q11 is 0.21. The fact that the effect size is positive shows that the results of the fourth year are statistically better than those of the first year.
To visualize the results, the mean and median of the answers of each question are calculated, both in the first- and fourth-year answers. Figure 1 and Figure 2 show respectively the median and mean of the answers to the 18 questions of the survey. In both figures, the X-axis contains the 18 survey questions, and the Y-axis shows the value associated with the answers according to the conversion detailed in Section 2.4.1.
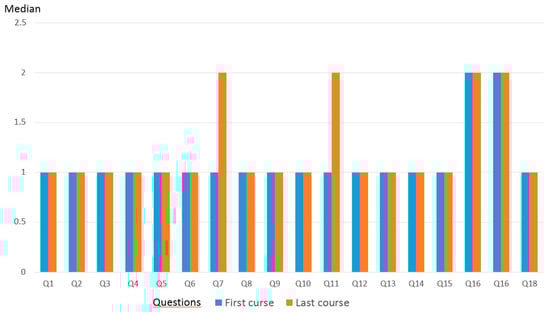
Figure 1.
Median of responses of first- and fourth-year students.
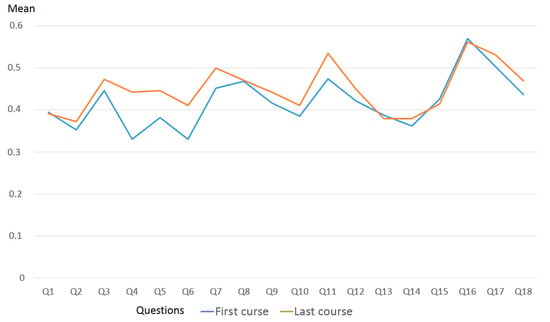
Figure 2.
Mean of the responses of first- and fourth-year students.
Figure 1 presents the values of the median of each question, which are presumably more representative than the mean because the values belong to a Likert scale. The median represents the value of the central position variable in a set of ordered data. As can be seen, the improvements indicated by Mann-Whitman U in questions Q4, Q5, and Q6 are not observed in Figure 1. However, the improvement for question Q11 is observed.
As can be seen from the data presented in Figure 2, first-year students state that in some questions (Q1, Q13, Q15, Q16) they have more sustainability competencies than fourth-year students. This situation can be explained by the effect detailed by Kruger & Dunnin [24], according to which an individual with fewer competencies and less knowledge has an illusory feeling of superiority, considering himself/herself to be more intelligent than another better prepared individual. The fourth-year student is more consistent in the answers.
This situation also contradicts certain contributions to the pro-environmental attitudes of young people, and how these attitudes do not change throughout primary to university education. At an international level, the ROSE project [25] studies them within the framework of attitudes towards science. In the Spanish national sphere, studies such as those by Vázquez & Manasero [26,27,28,29], read in [30,31] state that the pro-environmental attitudes of young people are positive, although the predisposition to act in favor of the environment is low in relation to the concern shown. The ideas of first-year university students seem to be more simplistic than those of fourth-year students, since they have yet to complete a course or receive extracurricular training in sustainability [32,33,34,35]. Taken together, these studies suggest that students begin their higher education studies with a confused conception of sustainability, which influences their perception of the importance of sustainability and their professional development.
Unlike Figure 1, Figure 2 shows the improvement detected by the Mann-Whitney U test in questions Q4, Q5 and Q6. To visualize the improvement in the results of the fourth year with respect to those of the first year, Figure 3 presents the difference in absolute value (fourth year minus first year) for each question, and the relative percentage of improvement calculated as 100 * (fourth year - first year) / first year. The X-axis shows the 18 questions, the left Y-axis shows the percentage (corresponding to the blue line) and the right Y-axis shows the difference in absolute value (corresponding to the orange line). Since these are Likert variables, the improvement in absolute value is more clearly indicated than the improvement in percentage. However, the great similarity between the absolute value and the percentage value can be observed in the figure. The two lines show the improvements detected by the Mann-Whitman U test in questions Q4, Q5, Q6 and Q11, since in both lines these four questions obtain the highest improvement values.
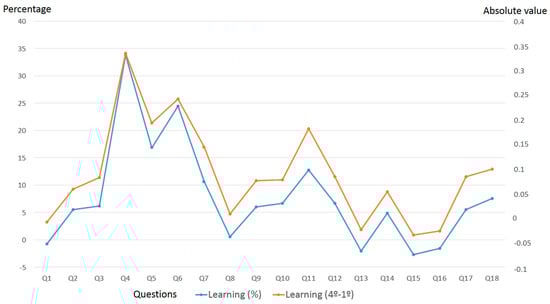
Figure 3.
Improvement in sustainability of fourth-year students compared to first-year students measured in absolute value (orange line) and percentage (blue line).
We now study graphically whether a relationship exists between the variables shown in Figure 3 and the size of the effect calculated by Cohen’s D. To this end, Figure 4 presents the improvement in percentage (orange line), the improvement in absolute value (gray line) and Cohen’s D (blue line) for each question. The Y-axis on the left corresponds to both Cohen’s D and the improvement in absolute value. The Y-axis on the right corresponds to the improvement in percentage. The 18 questions are shown on the X-axis.
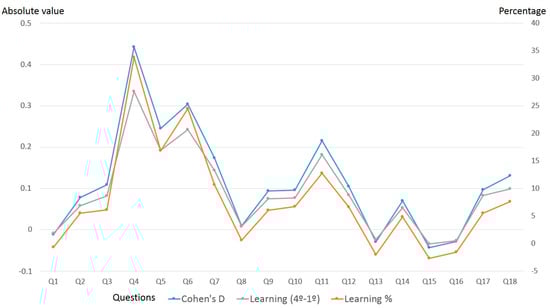
Figure 4.
Cohen’s D vs. improvement of fourth-year students compared to first-year students measured in absolute value and percentage.
Cohen’s D conforms to a normal distribution, but learning (both in absolute value and in percentage) does not meet this criterion. Therefore, Spearman’s non-parametric correlation has been performed. The correlation between Cohen’s D and absolute value learning is 0.9917, while the correlation between Cohen’s D and percentage learning is 0.9752. The high correlation found between the variables in Figure 4 suggests that students perceive Likert variables as a linear scale in which the four responses have a uniform distribution.
The comparison of the mean (with a 95% confidence interval) with the median for the four questions in which the Mann-Whitney U detects improvement is presented below. Figure 5 shows the Significant Mean Difference plots for the four questions Q4, Q5, Q6 and Q11, to contrast the significance of the differences between the results obtained in the first and fourth year. The less the overlap in the confidence intervals of the means (some do not overlap at all), the greater the indicator of significant difference.
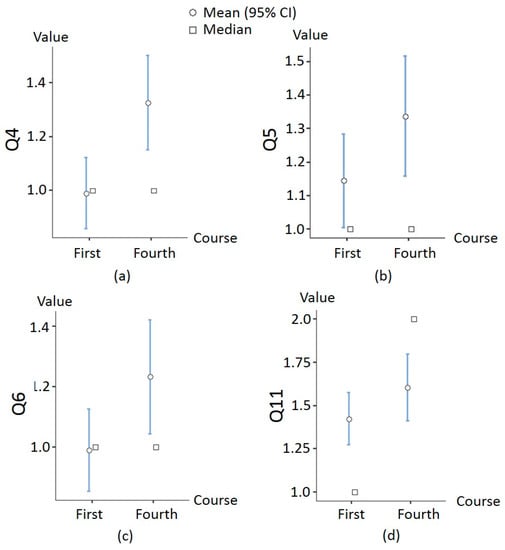
Figure 5.
Significant Mean Difference plots for: (a) Question 4, (b) Question 5, (c) Question 6 and (d) Question 11.
One may observe in Figure 5 that the medians are below the confidence intervals of the means between the first- and fourth-year results in almost all cases. This information should not be interpreted as a generalized increase in the sustainability competencies of fourth-year students corresponding to the questions analyzed, but rather that a minority of students have greatly increased their learning. Therefore, when the group as a whole is analyzed, a mean increase is not reflected in the median.
In questions Q4, Q5 and Q6, both groups have the same median. Nevertheless, the confidence intervals of the first- and fourth-year means differ greatly. This is due to the positive asymmetry of great magnitude that reflects the distributions of the responses of fourth-year students (see Figure 6, Figure 7 and Figure 8), compared to the distributions of the responses of first-year students, which approach to a moderately normal distribution (but not normal in any case). This means that the difference in the learning detected does not reside in a generalized change in fourth-year students, but rather in an increase in learning in a relevant minority.
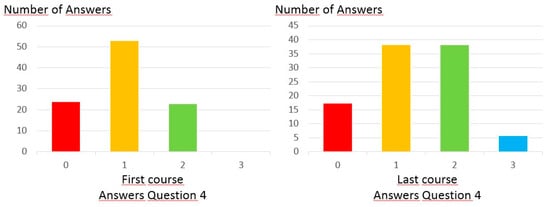
Figure 6.
Percentage of responses for each option for question Q4: I know procedures and resources for integrating sustainability into the subjects.
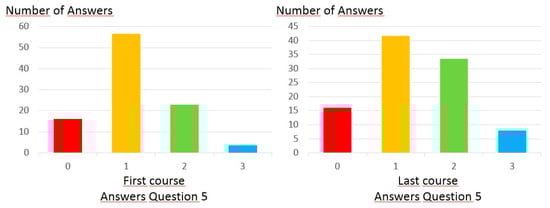
Figure 7.
Percentage of answers of each option for question Q5: I know how to analyze the opportunities presented in the subjects to plan educational projects that integrate sustainability.
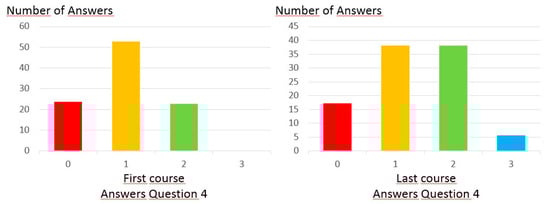
Figure 8.
Percentage of responses of each option for question Q6: I know how to design educational projects from the perspective of sustainability.
To visualize the distribution of responses to each of the questions in which Cohen’s D identifies an improvement, Figure 6, Figure 7 and Figure 8 present the percentages of responses to each option.
Figure 6, Figure 7 and Figure 8 show that a large majority of first-year students respond that they “strongly disagree” (0) or “disagree” (1), while fourth-year responses show a shift of the responses to the right, "agree" (2) or "strongly agree" (3). Fourth-year students perceive a clear shift from "disagree” (1) to "agree" (2), and a significant increase in the "strongly agree" (3) responses.
On the other hand, the responses to question Q11 present a different behavior. In this case, the means and confidence intervals of each course converge, while the medians are different (Figure 5d). Both groups (first- and fourth-year students) show large asymmetries, but opposite, as seen in Figure 9.
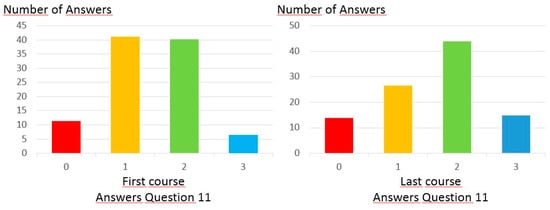
Figure 9.
Percentage of answers for each option for question Q11: I can develop community educational projects satisfactorily, encouraging participation.
In addition, as noted above, differences observed between results from first-year and fourth-year students are only significant with a 90% confidence level.
3.2. Results of the Second Research Question
The second research question is: Can it be affirmed that the subjects that develop sustainability competencies in the curriculum of a given higher degree of Education reach their objectives regarding ESD?
In order to answer this question, an analysis is given below about whether a relationship exists between the improvement obtained by fourth-year students compared to first-year students (Cohen’s D), and the number of subjects in the curriculum that develop the learning outcomes related to each Survey question. This data can be seen in Figure 10, where the X-axis contains the 18 questions of the survey. The Y-axis on the left identifies the number of subjects that develop the learning outcomes corresponding to each question, while the Y-axis on the right presents the Cohen D value obtained for each question. The results of the graph are so clear that no statistical calculation is necessary to show that there is no correlation between the two variables. However, the Spearman correlation coefficient between both variables has been calculated, obtaining the value −0.1830, which indicates a very low correlation.
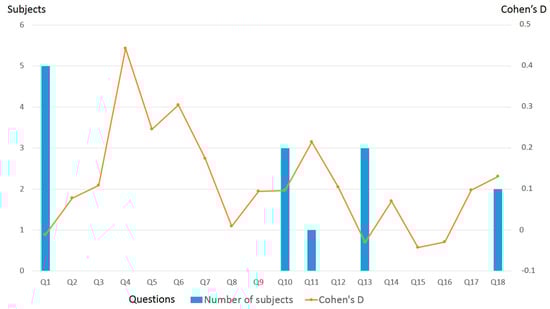
Figure 10.
Cohen’s D vs. number of subjects that develop each question.
As can be seen in Figure 10, no curriculum subject states that it develops learning outcomes related to questions Q4, Q5 and Q6, and yet students declare that they have improved learning outcomes related to those questions. This may be because the students receive some type of training in sustainability outside the classroom, or that in their learning guides the subjects do not correctly declare the learning outcomes they develop. On the other hand, there are subjects that develop the learning outcomes related to the questions, although no improvement is detected. For example, 5 subjects declare that they develop learning outcomes related to question Q1, but not only do students perceive no improvement, but state that they know less in the fourth year than in the first year. This is undoubtedly due to the effect detailed by Kruger & Dunnin [24], but whatever the case, the expected improvement is not detected. Something similar occurs with questions Q10, Q13 and Q18, which declare that they develop 3, 3 and 2 subjects, respectively, but which nevertheless show no significant improvement. Finally, question Q11 presents a different case. It is only developed in one subject, but Cohen’s D detects a small effect and Mann Whitney’s U detects differences between first- and fourth-year students with 90% confidence. It is reasonable to deduce that this subject is obtaining the learning outcomes related to this question.
The research by Sundermann & Fischer [7] shows that the pedagogical approaches that transfer the subject learning guides to the teaching practices in the classroom do not take into account or adapt to the conceptions and previous experiences of the students. Previous studies show that when the design of learning environments does not adequately consider students’ prior knowledge, an accumulation of inert knowledge may occur that does not affect their previous knowledge and conceptions. However, consideration of students’ conceptions and their previous experiences when designing learning environments seems to influence their thinking directly [35]. What students bring to the classroom, and what they perceive as useful and important at the beginning of the course, should be reflected in the design of the subject programs [7].
The low expectations of teachers could be another reason for why learning is less than expected in those learning outcomes that have a greater presence of sustainability. Previous studies have found that the level of expectations that teachers have of their students is related to the degree of student participation in the classroom. Consequently, if teachers maintain high expectations in learning and in the participation of their students in activities related to sustainability competencies, they will be more likely to devote greater efforts to acquiring them and putting them into practice [16].
The achievements of the teaching-learning process are the sum of the learning outcomes of the various subjects of the curriculum, and this sum helps in the acquisition of the competencies of the degree. However, each subject must enhance the development of certain competencies so that all of them are developed throughout the degree. The authentic development of sustainability competencies should far exceed the curriculum framework, beyond which it integrates knowledge and practices with values and attitudes at a later stage.
A risk exists in the education system that ESD competencies remain merely as a formal model that is not put into practice. This is already happening with other competencies [36], so it may also happens with those related to ESD. To avoid this, teachers must include in the program strategies that involve planning, and thus introduce in the very first year a series of tasks relevant to the development of sustainability competencies.
Extracurricular activities improve sustainability competencies because they are diverse and related to the field of emotions and values. These activities may consist of conducting a debate; participating in a contest; being a member of student clubs and/or student delegations; volunteering in associations and NGOs, or participating in private pro-environmental actions, which include daily decisions and actions directed at recycling, reuse and reduction. For a long time now in the field of higher education, the importance of considering not only experiences in class, but also experiences outside of class have been the subject of investigation. In previous studies, it is argued that no division should exist between learning in and outside the classroom: university education provides greater opportunities for the increase of learning and participation in terms of sustainability through a combination of curricular and extra-curricular factors [37]. Hopkinson, Hughes & Layer [38] suggest that, in order to increase learning outcomes in sustainability, it would be more effective to configure learning processes within a broader framework that encompasses and combines the curriculum in all its dimensions. Only from this perspective of education can students be trained as citizens.
Due to the pedagogical methods used, current students may have evolved differently from those of some years ago, when these methods were fundamentally expository and less innovative. Motivation is a key element in the new pedagogical methods. Motivation implies an interest in learning and acquiring knowledge about aspects concerning sustainability. Pedagogical models and social changes foster the emergence of new methodologies for increasing student interest and motivation as part of their cognitive processes. Increasing motivation improves student learning, achievement and academic performance.
Finally, it is necessary to remember that the three questions in which the Mann Whitney U test detects significant improvements belong to the same Competency unit, CU1.2: “Possesses critical thinking and creativity, taking advantage of the different opportunities presented (ICT, strategic plans, regulations, etc.) in the planning of a sustainable future”.
In other words, according to the causal interpretation, CU 1.2 is the only competency unit in which the move from first year to fourth year has led to an improvement in the learning of sustainability competencies. That is, CU 1.2 is the only unit that has shown a significant improvement in regard to the variable “course”. According to our tentative causal interpretation, CU 1.2 is the only competency unit in which the fact of advancing from course to course (from first year to fourth year) implies an improvement in learning. In other words, an association exists between both dimensions.
The question is whether the course variable is responsible for the improvements detected in questions Q4, Q5, Q6 and Q11, or whether other factors are involved. In order to test and contextualize the possible causal relationship of the course effect, a series of linear regression models have been constructed, which are shown in Table 1.

Table 1.
Linear regression models on learning produced in the competency unit CU1.2.
The first three models (M1, M2 and M3) develop partial regressions. First, the fundamental explanatory variable of the main hypothesis, the course effect. Second, a series of basic sociodemographic controls that allow students to calibrate their results by gender and age. Third, a series of confounding factors that would have an indirect effect on learning in the CU1.2 competency unit through learning in other competencies or competency units. Model 4 is constructed as a strategy for identifying the causal relationship. It is a joint model that allows control of the incidence and possible distortions of both sociodemographic factors and confounding factors.
First, the normality of the dependent variable, learning in UC1.2, is verified. This is an essential step to approach the analysis through a linear regression model. Subsequently, bivariate relationships between the different independent variables and learning in UC 1.2 are analyzed according to their level of measurement and normality. This allows us to verify that, in addition to their theoretical relevance, their inclusion in the models is also empirically justified. The result is favorable for all variables except for the age variable, which, however, will remain in the table to assure minimal sociodemographic control.
Next, it is proven that the regression models do not violate the assumptions of linearity, normality, homoscedasticity or autocorrelation. It has also been verified that the independent variables of model M3 are highly correlated. It has then been decided to focus the learning variables by subtracting the mean as a strategy to deal with the problem of multicollinearity. This decision has been taken because the violation of this assumption is not of such magnitude as the loss of information that other alternatives would entail, for example, the reduction of dimensions.
The first three models develop partial regressions. First, the fundamental explanatory variable of the main hypothesis is presented: the course effect, the value of the fourth course compared to the first course (Cat. Ref.). Second, a series of basic sociodemographic controls that allow to be calibrated by gender and age are presented. Gender appears in Table 1 as male/female gender. Since gender is the same for the first year as for the fourth, only one of the categories is given value because it is a dummy variable. Third, a series of confounding factors is presented that could have an indirect effect on learning in competency unit 1.2 through learning in other competency units or competency units.
As a strategy for identifying the causal relationship, Model 4 constructs a joint model that allows control of the incidence and possible distortions of both sociodemographic factors and confounding factors.
Model 5 aims to reveal a moderating effect of CU1.2. about learning (in Table 1 course * CU 1.1 and course * CU2.1) through the interaction between the course and two competencies/competency units, in order to analyze whether the cause-effect relationship of learning is more complex. The results show that this effect does not occur.
Finally, the point of the coordinate axis from which the function starts is represented (the constant).
In Model 1, fourth year students tend to get better learning outcomes in CU1.2. This enables us to affirm that, to a certain extent, advancing in the courses of the degree implies an improvement in the learning of CU 1.2. However, it is necessary to recognize that the influence of being in the fourth year instead of the first year is less than the indirect learning that is acquired in other competency units, especially CU2.1 or CU4.1, as verified by Models 2, 3 and 4.
In Model 2, it is observed that older students tend to obtain better results than younger students do, while gender does not have a significant influence on learning.
Model 3 shows that the learning acquired in CU1.1 and CU4.1 maintains a significant relationship with the learning produced in CU1.2.
The predictors of the three previous models are grouped In Model 4. The objective is to see how independent variables interact and which significant relationships prevail. First, the effect of being in the fourth year is maintained, and even slightly reinforced. Second, the significant influence exerted by age ceases. Finally, the indirect effects of learning in other competency units remain similar to those detected by Model 3.
Model 5 aims to inspect the existence of interactions and, in particular, of causal moderators. To this end, the possible existence of these interactions is explored first by means of partial regression models (not shown), in which the following predictors are successively included: the course variable, the competency or competency unit in each case, and an interaction term of both (the product of both variables). From this exploration, it is concluded that moderating effects may exist between the course and CU1.1 and CU2.1. However, all these deductions are canceled when the M5 model is observed: the control exercised by this multivariate model discards any type of interaction. Therefore, for a complete and accurate analysis, Model 4 should be considered.
It is found that the course effect prevails once it is controlled by other relevant sociodemographic or academic factors. It can be affirmed that, to a certain extent, advancing in the courses of the curriculum implies an improvement in the learning of CU1.2. However, it is significant that the influence of being in the fourth year is less than the indirect learning that is done in other competency units, especially in CU2.1 (Designs and develops actions, making decisions that take into account the environmental, economic, social, cultural and educational impacts so as to improve sustainability) and in CU4.1 (Is consistent in actions respecting and valuing -biological, social and cultural- diversity and committed to improving sustainability).
Learning about environmental and sustainability issues within the curriculum is necessary, as students learn to be co-responsible with the community. It is known that curricular experiences are necessary for students to go beyond “knowing” towards “knowing how to do”, interacting with aspects of their daily lives. However, experiences outside the university are important in all university studies, as they are associated with the development of critical thinking, relational and organizational skills, peer interactions and leadership skills.
Finally, we wish to highlight that “Sustainability” is a plastic word, and some research shows how the media can generate high (false) familiarity with the term “sustainability”. However, despite the fact that various agents exist at all educational levels, and that the media and information technology play a fundamental role, this familiarization with the term “sustainability” can lead to non-specific and non-contrasted interpretations, unlike the knowledge that can be acquired in the classroom [39]. To avoid this, activities outside the campus must be included in the design of teaching-learning actions, as already established in the European Higher Education Area [40]. While it is desirable that students learn outside the university, it is also insufficient, because theoretical knowledge and training for the acquisition of sustainability competencies are also required. It is necessary to continue researching so that ESD becomes a reality in university studies, since educating for sustainable development is a professional duty.
3.3. Limitations of This Work
This study has several limitations that should be taken into account. First, the student sample is small (104 first-year students and 86 fourth-year students), and has not been chosen at random. Students have voluntarily responded to the survey. A limited knowledge also exists about the sociocultural and individual characteristics of the students, and how these characteristics could influence their responses. These data are not analyzed in the present study.
Secondly, the number of subjects that develop ESD in the analyzed curriculum is also small, and therefore probably few learning outcomes of the sustainability map are developed in the curriculum. This fact makes it difficult to draw clear conclusions due to the few available data.
Third, the study is conducted at the question level of the sustainability survey, mainly due to the lack of available data, as explained in the previous paragraph. The study should extend to the competency and competency unit levels, and a study of the improvement of sustainability competencies should also be carried out, taking into account the domain levels of the learning taxonomy. To carry out these analyses, it is necessary to consider a degree in which the sustainability presence map has subjects in all its cells. This analysis is part of the future work of the EDINSOST project, which will apply the methodology described in this work in other institutional, historical and cultural contexts at a national level.
Finally, the sustainability presence map measures only the presence of the learning outcomes of the sustainability map in the curriculum subject guides. It does not measure how many hours are spent developing these learning outcomes, nor the type of activities that are carried out to achieve them. It measures only presence. This is another limitation when comparing student surveys with the sustainability presence map, since the fact that a greater number of subjects develop a certain learning outcome does not imply that it develops further than another learning outcome developed in a smaller number of subjects.
4. Conclusions
This paper presents a methodology to assess the extent to which students of a higher degree in the field of education acquire sustainability competencies. Students’ learning outcomes are compared with the number of subjects that work on these results, in order to analyze which subjects achieve their learning objectives and which do not. The methodology has been applied in the Bachelor Degree in Primary Education Teaching of the University of Seville.
The two research questions raised are the following:
- Can it be affirmed that the students of a given higher education degree improve their sustainability competencies during their academic career?
- Can it be affirmed that the subjects that develop sustainability competencies in the curriculum of a given higher degree of Education reach their objectives regarding ESD?
The instruments used to answer these questions are the sustainability presence map of education degrees and the student sustainability survey of education degrees [41], which consists of 18 questions. The survey is answered using a four-point Likert scale. Both tools have been designed within the framework of the EDINSOST project [20].
Responses to the survey were given during the first semester of the year 2018 by 104 first-year students and 86 fourth-year students of the Bachelor Degree in Primary Education Teaching at the University of Seville. As the answers do not follow a normal distribution, even for students in the first year or in the fourth year, the Mann-Whitney U test is used to determine whether significant differences exist in the responses given by both groups to each question. In order to determine the size of the difference, Cohen’s D is calculated for each question. The mean and median responses to each question by each group of students are also calculated.
Regarding the first research question, the results indicate that there are only significant differences, with 95% confidence, for questions Q4, Q5 and Q6. For question Q11, differences are found with a 90% confidence. The biggest difference corresponds to question Q4 (D = 0.44), and the smallest to Q11 (D = 0.21). The effect size of Q5 is D = 0.24 and that of Q6 is D = 0.30. In general, 0.2 is a small effect size, 0.5 is a medium size and 0.8 is a large size, so the measured effects are small.
There are no differences in the medians for questions Q4, Q5, and Q6 (median = 1 for both groups), but they are observed for question Q11 (median = 1 for first-year students, and median = 2 for the fourth year). However, some differences are observed in the means. For some questions (Q1, Q13, Q15, Q16), the mean for first-year students is higher than the mean for fourth-year students. This does not mean that fourth-year students are less competent in sustainability than first-year students for those questions. Kruger & Dunnin [24] describe an effect according to which an individual with lower competencies and knowledge has an illusory feeling of superiority, thereby regarding himself/herself more intelligent than another more prepared individual, which is probably what is happening in this case.
When comparing the learning achieved in the means of the 18 questions by fourth-year students as against first-year students, both in percentage and absolute value, a high correlation is found with the values obtained by Cohen’s D and learning (0.9917 between Cohen’s D and learning measured in absolute value, and 0.9752 between Cohen’s D and learning measured in percentage). This data suggests that students perceive Likert variables as a linear scale in which the four responses have a uniform distribution.
When comparing the value of the means (with a 95% confidence interval) with the value of the medians for questions Q4, Q5, Q6 and Q11, it is observed that the medians are below the confidence intervals of the means in almost all cases. This information should not be interpreted as a generalized increase in the sustainability competencies of fourth-year students in the questions analyzed, but rather that a minority of the students have greatly increased their learning.
The distribution of the answers for each of the questions Q4, Q5, Q6 and Q11 has also been visually analyzed, in all of which a clear shift is found in the responses from the lower values of the Likert scale (strongly disagree, disagree) towards the highest values (agree, strongly agree).
With respect to the second research question, the results of Cohen’s D in each question are graphically compared with the number of subjects stating that they develop the learning outcomes related to the question. The Spearman correlation coefficient between both variables is calculated, a very low correlation being obtained. There is no curriculum subject that declares the development of learning outcomes related to questions Q4, Q5 and Q6, although students state that they have improved learning outcomes related to those questions. On the other hand, some subjects that develop learning outcomes relate to some questions in which no improvement is detected. Finally, the learning outcomes related to question Q11 are developed in a single subject, although Cohen’s D detects a small effect and Mann Whitney’s U detects differences between first- and fourth-year students with 90% confidence. The significant casuistry found suggests that only some subjects are achieving their learning objectives regarding ESD, and those students receive some kind of sustainability training outside the classroom. It also indicates that subjects do not correctly declare in their learning guides the learning outcomes they develop. This effect could be accounted for by the fact that the pedagogical approaches of the subjects do not take into account or adapt to the previous conceptions and experiences of students. A further factor may be that teachers have low expectations for student learning in terms of sustainability, or even the lack of ESD training of teachers themselves. In any case, these findings suggest that teachers do not address (or address inadequately) the content of the curriculum, probably because they give little or no importance to achieving the learning objectives declared in the subject teaching guides and their projection towards the teaching-learning process.
The teaching staff plays an important role in all teaching-learning processes, since it is responsible for organizing the teaching activities and programming the learning plan. For this reason, teacher training and motivation are essential, as well as the value given to activities regarding the integration of ESD into the university curriculum. Education professionals should focus specifically on relevant pedagogical approaches that enable the acquisition of ESD competencies with resources and activities for the classroom [8]. In order to implement ESD, and thus promote sustainability, it is crucial to increase the number of committed teachers and promote teacher training. It is therefore necessary for this training to establish a frame of reference that specifies the educational proposals [42], so that in order to promote sustainability students can learn all the knowledge and competencies in the academic field that they are unable to learn in another area.
Finally, it should be noted that the three questions in which the Mann Whitney U test detects significant improvements belong to the same Competency unit, CU1.2: “Possesses critical thinking and creativity, taking advantage of the different opportunities presented (ICT, strategic plans, regulations, etc.) in the planning of a sustainable future”. It is also worth mentioning that, according to the curriculum, this competency unit is not developed in any subject. It may be that the set of subjects on the curriculum, or even the intellectual maturation of students throughout their studies, help them to improve in this competency. It is also possible that the students’ own personal experience outside of the university contributes to this improvement. It is necessary to compare the results of the students in this case study with other students engaged in the same degree in another university, in other degrees and other universities. Such a comparison would provide valuable information about how university students improve their sustainability competencies throughout their studies. This undertaking forms part of the future work of the EDINSOST project.
Higher education undergoes transformation with economic, political and social changes, and the university is well placed to act as an important force for change. The objective of any university degree should be to assure that its graduates are good professionals, motivated to be responsible and committed members of society. This constitutes a pedagogical approach capable of responding to the current evolution of work organization as well as to the uncertainty that these changes pose for the future. It is the responsibility of universities to ensure that graduates acquire the necessary competencies of leadership, autonomy, adaptability, resilience and sustainability, since the future that awaits us will be sustainable or will not be at all.
Author Contributions
Conceptualization, R.V.-H., F.S.-C., L.A.R., and D.L.-D.; Data curation, R.V.-H., F.S.-C., and L.A.R.; Formal analysis, R.V.-H., F.S.-C., and L.A.R.; Funding acquisition, R.V.-H., F.S.-C., and D.L.-D.; Investigation, R.V.-H., F.S.-C., and L.A.R.; Methodology, R.V.-H., F.S.-C., L.A.R., and D.L.-D.; Project administration, R.V.-H. and F.S.-C.; Resources, R.V.-H., F.S.-C., L.A.R., and D.L.-D.; Software, R.V.-H., F.S.-C., and L.A.R.; Supervision, R.V.-H. and F.S.-C.; Validation, R.V.-H., F.S.-C., L.A.R., and D.L.-D.; Visualization, R.V.-H., F.S.-C., L.A.R., and D.L.-D.; Writing—original draft, R.V.-H., F.S.-C., and D.L.-D.; Writing—review and editing, R.V.-H. and F.S.-C. All authors have read and agreed to the published version of the manuscript.
Funding
This work was supported by the Spanish Ministerio de Economía y Competitividad, from study design to submission, under grant number EDU2015-65574-R; by the Spanish Ministerio de Ciencia, Innovación y Universidades, the Spanish Agencia Estatal de Investigación (AEI), and the Fondo Europeo de Desarrollo Regional (FEDER), from study design to submission, under grant number RTI2018-094982-B-I00; and by the department of Theory and History of Education and Social Pedagogy of the University of Seville, for writing review and editing, under grant 2019/0053061.
Acknowledgments
We wish to thank the rest of the EDINSOST team for their collaboration in this work, especially Daniel Romero.
Conflicts of Interest
The authors declare no conflict of interest.
Appendix A
Table A1 shows the Sustainability map for the Education degrees of the EDINSOST project, previously presented by Sánchez-Carracedo, Ruíz-Morales, Valderrama-Hernández et al. in [43].
The map has been drawn up on the basis of the four competencies defined by the CRUE [44]:
- SUS1: Critical contextualization of knowledge by establishing interrelations with social, economic, environmental, local and/or global problems
- SUS2: Sustainable use of resources and prevention of negative impacts on the natural and social environment.
- SUS3: Participation in community processes that promote sustainability
- SUS4: Application of ethical principles related to the values of sustainability in personal and professional behavior.
Each competency has been described in the form of a single competency unit (SUS2 and SUS3 competencies) or two (SUS1 and SUS4 competencies). Each competency unit has been analyzed holistically. The sustainability map contains the learning outcomes of each competency unit classified using a simplified version of the Miller Pyramid [22] as a taxonomy.
Table A2 shows the sustainability presence map of the Bachelor Degree in Primary Education Teaching at the University of Seville.
Table A1.
Sustainability Map for the Education degrees of the EDINSOST project, previously presented by Sánchez-Carracedo, Ruíz-Morales, Valderrama-Hernández et al. in [43].
Table A1.
Sustainability Map for the Education degrees of the EDINSOST project, previously presented by Sánchez-Carracedo, Ruíz-Morales, Valderrama-Hernández et al. in [43].
| EDINSOST’ Sustainability Map of All the Degrees in Education | |||||
|---|---|---|---|---|---|
| Related Competencies | Dimension | Competency Unit | Domain Levels (According to the Simplified Miller Pyramid) | ||
| Level 1. Knowing | Level 2. Knowing How | Level 3. Demonstrating & Doing | |||
| SUS1: Critical contextualization of knowledge by establishing interrelations with social, economic, environmental, local and/or global problems. | Holistic | 1.1 Understands the functioning of natural, social and economic systems, as well as their interrelations and problems, both at a local and global level. | 1.1.1. Knows the functioning of natural, social and economic systems and the mutual relations between them. | 1.1.2. Analyses and understands the relationship between natural systems and social and economic systems. | 1.1.3. Is able to imagine and predict the impacts the changes produced in natural systems may cause in social and economic systems and among each other. |
| 1.2 Possesses critical thinking and creativity, taking advantage of the different opportunities presented (ICT, strategic plans, regulations, etc.) in the planning of a sustainable future. | 1.2.1 Knows the procedures and resources to integrate sustainability into educational projects. | 1.2.2. Understands and takes advantage of the opportunities that present themselves in educational contexts in order to plan sustainable projects. | 1.2.3. Provides solutions to educational projects from a critical and creative viewpoint with the aim of planning a sustainable future. | ||
| SUS2: Sustainable use of resources and prevention of negative impacts on the natural and social environment. | Holistic | 2.1. Designs and develops actions, making decisions that take into account the environmental, economic, social, cultural and educational impacts so as to improve sustainability. | 2.1.1. Has basic knowledge of identifying possible socio-environmental impacts derived from educational actions. | 2.1.2. Knows how to develop educational actions that mitigate negative socio-environmental impacts. | 2.1.3. Designs and develops educational activities in which negative socio-environmental impacts are taken into account, and incorporates mitigating measures. |
| SUS3: Participation in community processes that promote sustainability | Holistic | 3.1 Promotes and participates in community activities that encourage sustainability. | 3.1.1. Recognises himself/herself as an integral part of his/her surroundings and knows the community education programmes that encourage participation and commitment to socio-environmental improvement. | 3.1.2. Is able to interact satisfactorily in educational community projects, encouraging participation. | 3.1.3. Designs and carries out socio-educational activities in participatory community processes that promote sustainability. |
| SUS4: Application of ethical principles related to the values of sustainability in personal and professional behavior. | Holistic | 4.1. Is consistent in actions respecting and valuing (biological, social and cultural) diversity and committed to improving sustainability. | 4.1.1. Knows the ethical principles of sustainability and the importance of respecting diversity in educational intervention. | 4.1.2. Understands and integrates the ethical principles of sustainability in his/her actions, considering nature as a good in itself and transmitting the importance of education for a change in the relationship between human beings and the socio-cultural environment. | 4.1.3. Is able to design and/or manage educational projects taking into account ecological ethics to improve quality of life and to promote the common good. |
| 4.2. Promotes education in values oriented to the formation of responsible, active and democratic citizens. | 4.2.1. Takes into account promoting integral and sustainable human development as the basic purpose of the formation of citizenship. | 4.2.2. Critically analyses and assesses the consequences his/ her personal and professional actions may have on the integral development of students and on promoting sustainable human development. | 4.2.3. Designs and develops educational intervention proposals that integrate the values of sustainability and which result in justice and the common good. | ||
Table A2.
Map of sustainability presence of the Bachelor Degree in Primary Education Teaching at the University of Seville.
Table A2.
Map of sustainability presence of the Bachelor Degree in Primary Education Teaching at the University of Seville.
| Sustainability Presence Map of Bachelor Degree in Primary Education Teaching of the University of Seville | |||||
|---|---|---|---|---|---|
| Related Competencies | Dimension | Competency Unit | Domain Levels (According to the Simplified Miller Pyramid) | ||
| Level 1. Knowing | Level 2. Knowing How | Level 3. Demonstrating & Doing | |||
| SUS1- Critical contextualization of knowledge by establishing interrelations with social, economic, environmental, local and/or global problems. | Holistic | 1.1 Understands the functioning of natural, social and economic systems, as well as their interrelations and problems, both at a local and global level. | 5 | 0 | 0 |
| 1.2 Possesses critical thinking and creativity, taking advantage of the different opportunities presented (ICT, strategic plans, regulations, etc.) in the planning of a sustainable future. | 0 | 0 | 0 | ||
| SUS2- Sustainable use of resources and prevention of negative impacts on the natural and social environment. | Holistic | 2.1. Designs and develops actions, making decisions that take into account the environmental, economic, social, cultural and educational impacts so as to improve sustainability. | 0 | 0 | 0 |
| SUS3: Participation in community processes that promote sustainability | Holistic | 3.1 Promotes and participates in community activities that encourage sustainability. | 3 | 1 | 0 |
| SUS4: Application of ethical principles related to the values of sustainability in personal and professional behavior. | Holistic | 4.1. Is consistent in actions respecting and valuing (biological, social and cultural) diversity and committed to improving sustainability. | 3 | 0 | 0 |
| 4.2. Promotes education in values oriented to the formation of responsible, active and democratic citizens. | 0 | 0 | 2 | ||
The sustainability survey defined by the EDINSOST project [41] for students of the Education degrees of the Spanish university system is presented below. The answers are classified according to a Likert scale [23] of 4 points with the following meaning: Strongly disagree, Disagree, Agree and Strongly agree.
- I know the interrelation between natural, social and economic systems.
- I analyze and understand the relationships between natural systems and social and economic systems.
- I anticipate the repercussions of changes in natural, social and economic systems.
- I know procedures and resources to integrate sustainability in the subjects.
- I analyze the opportunities presented in the subjects to plan educational projects to integrate sustainability.
- I design educational projects from the perspective of sustainability.
- I identify the possible socio-environmental impacts derived from my educational activities.
- I know how to develop educational actions that minimize negative socio-environmental impacts.
- I design and develop educational actions in which I take into account the negative socio-environmental impacts and I incorporate corrective actions.
- I know community educational programs that encourage participation and commitment in socio-environmental improvement.
- I know how to develop myself satisfactorily in community educational projects, encouraging participation.
- I design and carry out socio-educational activities in participatory community processes that promote sustainability, feeling myself an integral part of my environment.
- I know the ethical principles of sustainability.
- I understand and integrate the ethical principles of sustainability in my professional and personal actions.
- I design and/or manage educational projects taking into account ecological ethics, to improve the quality of life and promote the common good.
- I consider the promotion of sustainable human development as a fundamental purpose of citizen education.
- I critically analyze and value the consequences that my personal and professional performance may have on the integral development of students and on the promotion of sustainable human development.
- I design and develop educational intervention proposals that integrate sustainability values and result in justice and the common good.
Finally, Table A3 shows the relationship between the survey questions (Q1-Q18) and the learning outcomes of the sustainability map.
Table A3.
Relationship between the survey questions (Q1–Q18) and the learning outcomes of the sustainability map.
Table A3.
Relationship between the survey questions (Q1–Q18) and the learning outcomes of the sustainability map.
| Sustainability Presence Map of Bachelor Degree in Primary Education Teaching of the University of Seville | |||||
|---|---|---|---|---|---|
| Related Competencies | Dimension | Competency Unit | Domain Levels (According to the Simplified Miller Pyramid) | ||
| Level 1. KNOWING | Level 2. KNOWING HOW | Level 3. DEMONSTRATING & DOING | |||
| SUS1: Critical contextualization of knowledge by establishing interrelations with social, economic, environmental, local and/or global problems. | Holistic | 1.1 Understands the functioning of natural, social and economic systems, as well as their interrelations and problems, both at a local and global level. | Q1 | Q2 | Q3 |
| 1.2 Possesses critical thinking and creativity, taking advantage of the different opportunities presented (ICT, strategic plans, regulations, etc.) in the planning of a sustainable future. | Q4 | Q5 | Q6 | ||
| SUS2: Sustainable use of resources and prevention of negative impacts on the natural and social environment. | Holistic | 2.1. Designs and develops actions, making decisions that take into account the environmental, economic, social, cultural and educational impacts so as to improve sustainability. | Q7 | Q8 | Q9 |
| SUS3: Participation in community processes that promote sustainability | Holistic | 3.1 Promotes and participates in community activities that encourage sustainability. | Q10 | Q11 | Q12 |
| SUS4: Application of ethical principles related to the values of sustainability in personal and professional behavior. | Holistic | 4.1. Is consistent in actions respecting and valuing (biological, social and cultural) diversity and committed to improving sustainability. | Q13 | Q14 | Q15 |
| 4.2. Promotes education in values oriented to the formation of responsible, active and democratic citizens. | Q16 | Q17 | Q18 | ||
References
- UNESCO. Education for the Sustainable Development Goals: Learning Objetctives; UNESCO: París, France, 2017; pp. 1–68. [Google Scholar]
- Boni, A.; Lopez-Fogues, A.; Walker, M. Higher education and the post-2015 agenda: A contribution from the human development approach. J. Glob. Ethics 2016, 12, 17–28. [Google Scholar] [CrossRef]
- Gusmão Caiado, R.G.; Leal Filho, W.; Quelhas, O.L.G.; Luiz de Mattos Nascimento, D.; Ávila, L.V. A literature-based review on potentials and constraints in the implementation of the sustainable development goals. J. Clean. Prod. 2018, 198, 1276–1288. [Google Scholar] [CrossRef]
- Owens, T.L. Higher education in the sustainable development goals framework. Eur. J. Educ. 2017, 52, 414–420. [Google Scholar] [CrossRef]
- Vladimirova, K.; Le Blanc, D. Exploring Links between Education and Sustainable Development Goals Through the Lens of UN Flagship Reports: Links Between Education and Other Sustainable Development Goals. Sustain. Dev. 2016, 24, 254–271. [Google Scholar] [CrossRef]
- Leal Filho, W.; Shiel, C.; Paço, A.; Mifsud, M.; Ávila, L.V.; Brandli, L.L.; Molthan-Hill, P.; Pace, P.; Azeiteiro, U.M.; Vargas, V.R.; et al. Sustainable Development Goals and sustainability teaching at universities: Falling behind or getting ahead of the pack? J. Clean. Prod. 2019, 232, 285–294. [Google Scholar] [CrossRef]
- Sundermann, A.; Fischer, D. How Does Sustainability Become Professionally Relevant? Exploring the Role of Sustainability Conceptions in First Year Students. Sustainability 2019, 11, 5155. [Google Scholar] [CrossRef]
- Lozano, R.; Merrill, M.; Sammalisto, K.; Ceulemans, K.; Lozano, F. Connecting Competences and Pedagogical Approaches for Sustainable Development in Higher Education: A Literature Review and Framework Proposal. Sustainability 2017, 9, 1889. [Google Scholar] [CrossRef]
- Sá, M.; Serpa, S. Transversal Competences: Their Importance and Learning Processes by Higher Education Students. Educ. Sci. 2018, 8, 126. [Google Scholar] [CrossRef]
- Mochizuki, Y.; Fadeeva, Z. Competences for sustainable development and sustainability: Significance and challenges for ESD. Int. J. Sustain. High. Educ. 2010, 11, 391–403. [Google Scholar] [CrossRef]
- Carey, S.; Zaitchik, D.; Bascandziev, I. Theories of development: In dialog with Jean Piaget. Dev. Rev. 2015, 38, 36–54. [Google Scholar] [CrossRef]
- Ull, M.Á.; Aznar Minguet, P.; Martínez-Agut, M.P.; Piñero, A. Competencias para la sostenibilidad en los planes de estudio de los grados de ciencias de la Universitat de València. Enseñ. Las Cienc. 2013, 3406–3411. [Google Scholar]
- Cebrián, G.; Junyent, M. Competencies in Education for Sustainable Development: Exploring the Student Teachers’ Views. Sustainability 2015, 7, 2768–2786. [Google Scholar] [CrossRef]
- Miñano Rubio, R.; Uribe, D.; Moreno-Romero, A.; Yáñez, S. Embedding Sustainability Competences into Engineering Education. The Case of Informatics Engineering and Industrial Engineering Degree Programs at Spanish Universities. Sustainability 2019, 11, 5832. [Google Scholar] [CrossRef]
- Kuh, G.D.; Jankowski, N.; Ikenberry, S.O.; Kinzie, J. Knowing What Students Know and Can Do The Current State of Student Learning Outcomes Assessment in U.S. Colleges and Universities. Natl. Inst. Learn. Outcomes Assess. 2014, 19. [Google Scholar]
- Campbell, C.M.; Michel, J.O.; Patel, S.; Gelashvili, M. College Teaching from Multiple Angles: A Multi-trait Multi-method Analysis of College Courses. Res. High. Educ. 2019, 60, 711–735. [Google Scholar] [CrossRef]
- Mertens, D.M.; Hesse-Biber, S. Mixed Methods and Credibility of Evidence in Evaluation. New Dir. Eval. 2013, 2013, 5–13. [Google Scholar] [CrossRef]
- Benton, S.L.; Cashin, W.E. Student Ratings of Instruction in College and University Courses. In Higher Education: Handbook of Theory and Research; Educación Superior: Manual de Teoría e Investigación; Paulsen, M.B., Ed.; Springer: Dordrecht, The Netherlands, 2014; Volume 29, pp. 279–326. [Google Scholar]
- Pérez-Poch, A.; Sánchez-Carracedo, F.; Salán Ballesteros, M.N.; López Álvarez, D. Cooperative learning and embedded active learning methodologies for improving students’ motivation and academic results. Int. J. Eng. Educ. 2019, 35, 1851–1858. [Google Scholar]
- Segalàs, J.; Sánchez-Carracedo, F. Improving Engineering Educators’ Sustainability Competencies by Using Competency Maps; The EDINSOST Project: Barcelona, España, 14–18 October 2019. [Google Scholar]
- Sánchez Carracedo, F.; Soler, A.; Martín, C.; López, D.; Ageno, A.; Cabré, J.; Garcia, J.; Aranda, J.; Gibert, K. Competency Maps: An Effective Model to Integrate Professional Competencies Across a STEM Curriculum. J. Sci. Educ. Technol. 2018, 27, 448–468. [Google Scholar] [CrossRef]
- Miller, G.E. The assessment of clinical skills/competence/performance. Acad. Med. 1990, 65, S63–S67. [Google Scholar] [CrossRef]
- Likert, R. A technique for the measurement of attitudes. Arch. Psychol. 1932, 140, 55. [Google Scholar]
- Kruger, J.; Dunning, D. Unskilled and unaware of it: How difficulties in recognizing one’s own incompetence lead to inflated self-assessments. J. Pers. Soc. Psychol. 1999, 77, 1121–1134. [Google Scholar] [CrossRef] [PubMed]
- Schreiner, C.; Sjøberg, S.; Relevance of Science Education (research project); Universitetet i Oslo. Institutt for Lærerutdanning og Skoleutvikling Sowing the Seeds of ROSE: Background, Rationale, Questionnaire Development and Data Collection for ROSE (The Relevance of Science Education): A Comparative Study of Students’ Views of Science and Science Education; Unipub: Oslo, Norway, 2004; pp. 1–126. [Google Scholar]
- Vázquez, Á.; Manassero, M.A. Imagen de la ciencia y la tecnología al final de la educación obligatoria. Cult. Educ. 2004, 16, 385–398. [Google Scholar] [CrossRef]
- Vázquez, Á.; Mannasero, M.A. Actitudes de los jóvenes en relación con los desafíos medio-ambientales. Infancia y Aprendizaje. J. Study Educ. Dev. 2005, 28, 309–327. [Google Scholar]
- Vázquez, A.; Manassero, M.A. El declive de las actitudes hacia la ciencia de los estudiantes: Un indicador inquietante para la educación científica. Rev. Eureka Sobre Enseñ. Divulg. Las Cienc. 2008, 5, 274–292. [Google Scholar] [CrossRef]
- Vázquez, Á.; Manassero, M.-A. Patrones actitudinales de la vocación científica y tecnológica en chicas y chicos de secundaria. Rev. Iberoam. Educ. 2009, 50, 1–15. [Google Scholar]
- Pérez-Franco, D.; de Pro-Bueno, A.J.; Pérez-Manzano, A. Actitudes ambientales al final de la ESO. Un estudio diagnóstico con alumnos de Secundaria de la Región de Murcia. Rev. Eureka Sobre Enseñ. Divulg. Las Cienc. 2018, 15, 1–15. [Google Scholar] [CrossRef]
- Menoyo, M.Á.M. Percepciones, valores y actitudes ante el desarrollo sostenible: Detección de necesidades educativas en estudiantes universitarios. Rev. Esp. Pedagog. 2008, 66, 327–343. [Google Scholar]
- Zeegers, Y.; Francis Clark, I. Students’ perceptions of education for sustainable development. Int. J. Sustain. High. Educ. 2014, 15, 242–253. [Google Scholar] [CrossRef]
- Clark, I.F.; Zeegers, Y. Challenging students’ perceptions of sustainability using an Earth Systems Science approach. J. Geogr. High. Educ. 2015, 39, 260–274. [Google Scholar] [CrossRef]
- Haase, S. An Engineering Dilemma: Sustainability in the Eyes of Future Technology Professionals. Sci. Eng. Ethics 2013, 19, 893–911. [Google Scholar] [CrossRef]
- Corney, G. Student Geography Teachers’ Pre-conceptions about Teaching Environmental Topics. Environ. Educ. Res. 2000, 6, 313–329. [Google Scholar] [CrossRef]
- González González, J.M.; Arquero Montaño, J.L.; Hassall, T. Consolidación de la formación por competencias en la Universidad española: Estudio de un caso. Educ. XX1 2014, 17, 145–148. [Google Scholar] [CrossRef]
- Pizmony-Levy, O.; Ostrow Michel, J. Pro-Environmental Attitudes and Behaviors in Higher Education: Investigating the Role of Formal and Informal Factors. Acad. Commons 2018, 1–39. [Google Scholar] [CrossRef]
- Hopkinson, P.; Hughes, P.; Layer, G. Sustainable graduates: Linking formal, informal and campus curricula to embed education for sustainable development in the student learning experience. Environ. Educ. Res. 2008, 14, 435–454. [Google Scholar] [CrossRef]
- Manni, A.; Sporre, K.; Ottander, C. Emotions and values—A case study of meaning-making in ESE. Environ. Educ. Res. 2017, 23, 451–464. [Google Scholar] [CrossRef]
- EU. Recommendation of the European Parliament and of the Council of 18 June 2009 on the Establishment of a European Quality Assurance Reference Framework for Vocational Education and TrainingText with EEA Relevance; EU: Brussels, Belgium, 2009; p. 10. [Google Scholar]
- Sánchez-Carracedo, F.; Álvarez Orive, M.J.; Barrón, Á.; Caballero, D.; López, E.; Muñoz, J.M.; Lugo-Muñoz, M.; Sureda Carbonell, B.; Vidal López, E.M.; Vidal, S. Elaboración de un Cuestionario Para Evaluar el Nivel de Sostenibilidad de los Estudiantes de Grados en Ingeniería TIC.; Asociación de Enseñantes Universitarios de la Informática (AENUI): Barcelona, Spain, 2018; pp. 141–148. [Google Scholar]
- Vega-Marcote, P.; Varela-Losada, M.; Álvarez-Suárez, P. Evaluation of an Educational Model Based on the Development of Sustainable Competencies in Basic Teacher Training in Spain. Sustainability 2015, 7, 2603–2622. [Google Scholar] [CrossRef]
- Sánchez-Carracedo, F.; Ruiz-Morales, J.; Valderrama-Hernández, R.; Muñoz-Rodríguez, J.M.; Gomera, A. Analysis of the presence of sustainability in Higher Education Degrees of the Spanish university system. Stud. High. Educ. 2019, 44, 1–18. [Google Scholar] [CrossRef]
- CRUE. Directrices para la Introducción de la Sostenibilidad en el Curriculum. Available online: http://www.crue.org/Sostenibilidad/CADEP/Documents/DIRECTRICES%20SOSTENIBILIDAD%20CRUE%202012.pdf (accessed on 18 November 2019).
© 2019 by the authors. Licensee MDPI, Basel, Switzerland. This article is an open access article distributed under the terms and conditions of the Creative Commons Attribution (CC BY) license (http://creativecommons.org/licenses/by/4.0/).