Global Marine Fishing across Space and Time
by
 , , , and
Andrew K. Carlson
1,2,*,† ,
,
William W. Taylor
1,
Daniel I. Rubenstein
2,
Simon A. Levin
2 and
Jianguo Liu
1 1
Center for Systems Integration and Sustainability, Department of Fisheries and Wildlife, Michigan State University, 115 Manly Miles Building, 1405 S. Harrison Road, East Lansing, MI 48824, USA
2
Princeton Environmental Institute and Department of Ecology & Evolutionary Biology, Princeton University, Princeton, NJ 08544, USA
*
Author to whom correspondence should be addressed.
†
Current address: Princeton Environmental Institute and Department of Ecology & Evolutionary Biology, Princeton University, M30 Guyot Hall, Princeton, NJ 08544, USA.
Sustainability 2020, 12(11), 4714; https://doi.org/10.3390/su12114714
Submission received: 23 May 2020
/
Accepted: 4 June 2020
/
Published: 9 June 2020
(This article belongs to the Special Issue Through the Lens of Telecoupling: New Perspectives for Global Sustainability)
Abstract
:Human health and livelihoods are threatened by declining marine fisheries catches, causing substantial interest in the sources and dynamics of fishing. Catch analyses in individual exclusive economic zones (EEZs) and the high seas are abundant, and research across multiple EEZs is growing. However, no previous studies have systematically compared catches, intranational versus international fish flows, and fishing nations within all of the world’s EEZs and across adjacent and distant EEZs and the high seas to inform “metacoupled” fisheries management. We use the metacoupling framework—a new approach for evaluating human–nature interactions within and across adjacent and distant systems (metacouplings)—to illustrate how fisheries catches were locally, regionally, and globally interconnected in 1950–2014, totaling 5.8 billion metric tons and increasing by 298% (tonnage) and 431% (monetary value) over this time period. Catches by nations in their own EEZs (largest in Peru) and adjacent EEZs (largest in Indonesia) constituted 86% of worldwide catches, growing in 1950–1996 but declining in 1997–2014. In contrast, catches in distant EEZs and the high seas—largest in Morocco, Mauritania, and Canada—peaked in 1973 and have since represented 9–21% of annual catches. Our 65-year, local–regional–global analysis illustrates how metacoupled fisheries governance—holistic management of multiscalar catches, flows, and tradeoffs within and among fisheries—can improve food and nutrition security, livelihood resilience, and biodiversity conservation across the world.
1. Introduction
Humans have influenced earth’s physical, chemical, and biological environments throughout history. However, the magnitude and intensity of human–nature interactions have increased substantially during the Anthropocene due to climate change, species invasion, air and water pollution, technological development, and other global changes [1,2]. Scientists and policy-makers increasingly recognize the complexity of coupled human and natural systems (CHANS) in which people influence—and are affected by—natural systems and processes across space, time, and organizational levels [2]. Despite the utility of the CHANS paradigm for understanding and managing human–nature interactions [1,2], it has yet to be widely applied in fisheries science, a discipline involving extensive linkages among humans, biota, and habitats [3,4] and thus possessing great potential for CHANS research to improve fisheries management.
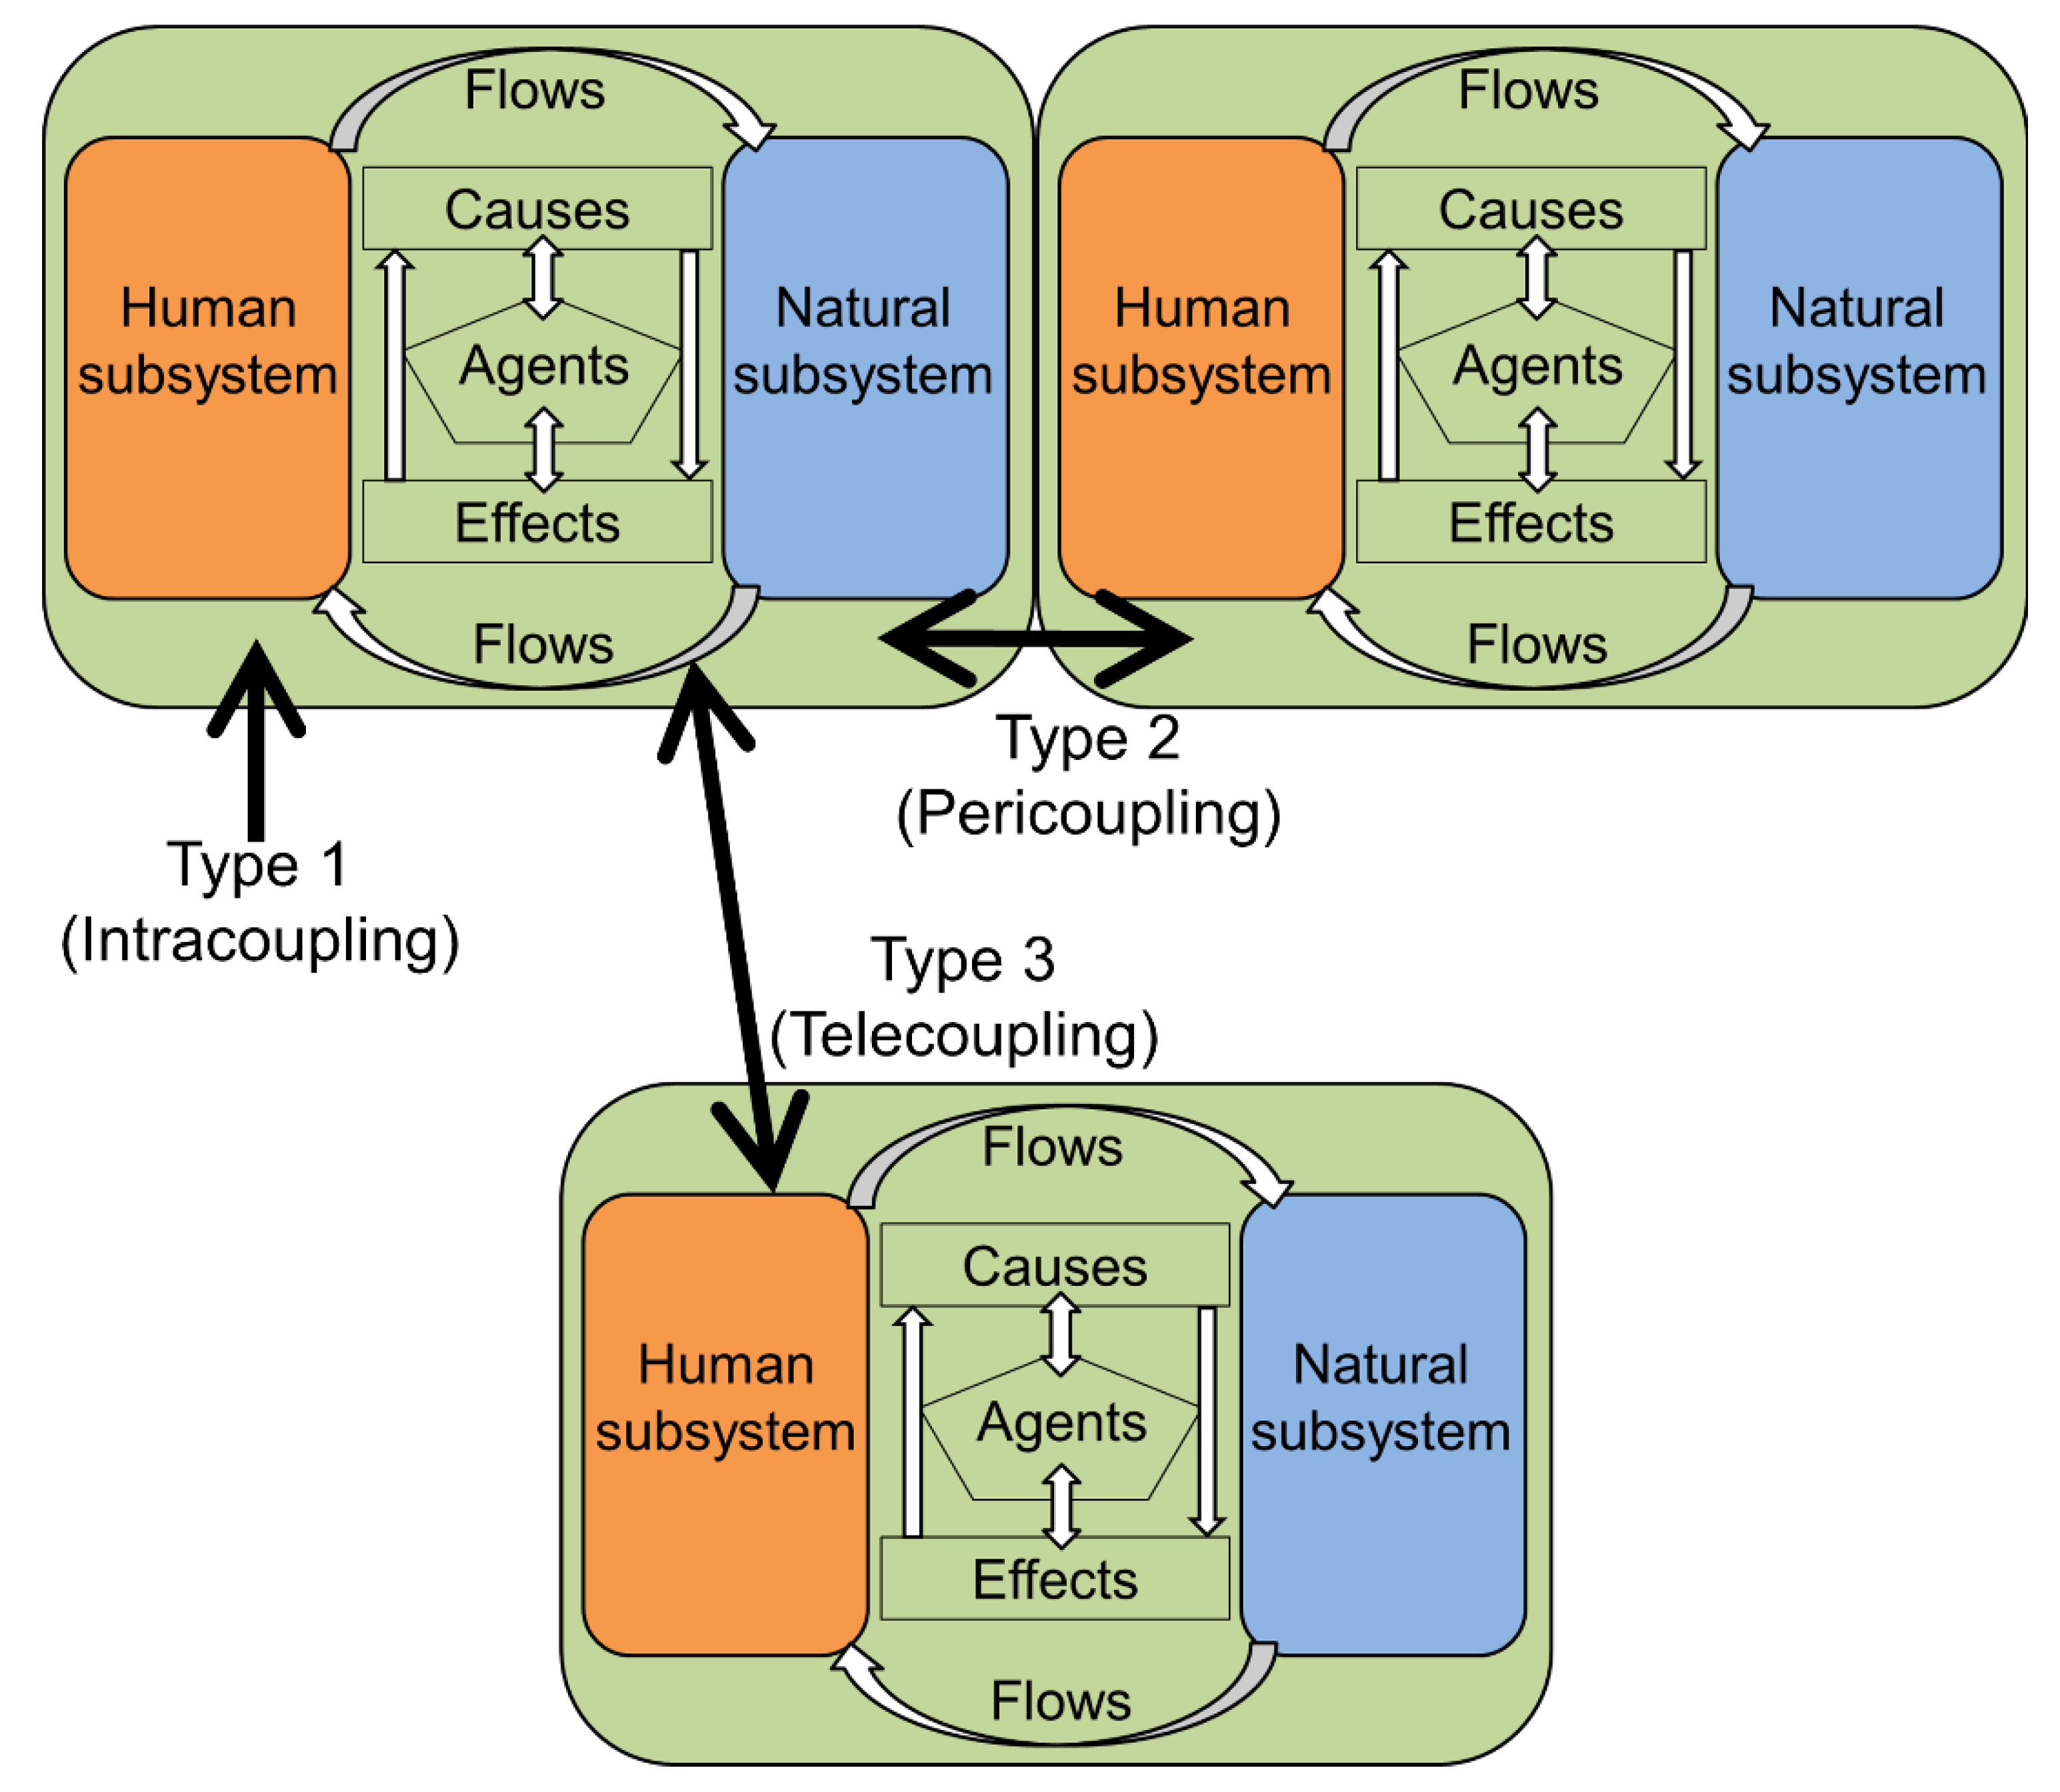
Fisheries provide people with food, income, employment, recreation, and culture, yet these ecosystem services are threatened locally, regionally, and globally by anthropogenic stressors such as overfishing, habitat degradation, and climate change [5,6,7]. Hence, there is a need for tools to holistically assess human–nature linkages and flows within local fisheries, as well as between adjacent and distant fisheries, to create integrative governance programs that leverage the bidirectionality of human–environmental interactions and thereby sustain productive fish populations and human societies at local to global scales. Such social-ecological, multiscalar fisheries governance is particularly important as marine fisheries catches decline, threatening food and nutrition security and livelihoods for billions of people across the world [8,9]. Although studies of catches within individual exclusive economic zones (EEZs) and the high seas are abundant [10,11,12,13] and research across multiple EEZs is growing [14,15,16,17], most studies are spatially limited, temporally constrained, or have not focused on fish flows—within nations, between adjacent nations, and between distant nations simultaneously—and implications for developing robust social-ecological, multiscalar fisheries management programs. Some multi-EEZ research has been multidecadal [8,17,18], but no previous studies have systematically, simultaneously evaluated local, regional, and global flows of fish resulting from marine fishing within the world’s EEZs and across adjacent and distant EEZs and the high seas to inform development of multiscalar, “metacoupled” fisheries management programs. Such programs stem from the metacoupling framework [19], a new paradigm for analyzing metacouplings: human–nature interactions such as fishing that occur within individual CHANS (intracouplings), between adjacent CHANS (pericouplings), and between distant CHANS (telecouplings; Figure 1). For instance, site-specific catches and local market sales of artisanal and subsistence fishers can be affected by the local and regional distribution of industrial fishing vessels, which in turn reflect regional and global policies of fisheries agencies and fishing companies [20]. Collectively, these local, regional, and global human–nature interactions characterize metacoupled fisheries systems.
The metacoupling framework complements and advances related concepts of globalization (socioeconomic interactions between human systems over distances) [21] and teleconnections (environmental interactions between natural systems over distances) [22] by simultaneously accounting for socioeconomic and environmental interactions spanning local, regional, and global scales [19]. In addition, the metacoupling framework enhances an antecedent paradigm (the telecoupling framework—socioeconomic and environmental interactions between CHANS over long distances) [23] by evaluating human–nature interactions locally, regionally, and globally. Amid human health and livelihood threats posed by declining marine fisheries catches [8,9,18], metacoupling research is critical because it explicitly links fisheries catches and flows within and among CHANS over time, helping identify multiscalar sources and dynamics of fishing and overfishing. In turn, researchers can use the metacoupling framework to assess the relative importance of fisheries intracouplings, pericouplings, and telecouplings across space and time, which is crucial for determining appropriate multiscalar ecological and policy interventions to safeguard fisheries biodiversity, food/nutrition security, and livelihoods across the world.
The metacoupling framework is a promising tool for social-ecological integration locally, regionally, and globally, but metacoupling research to date has been largely conceptual rather than quantitative [19,24] and terrestrial rather than aquatic [25,26]. Although these trends are beginning to change [27,28,29], the metacoupling framework has scarcely been applied to fisheries, which are prime examples of metacoupled systems because they encompass local, regional, and global flows of fish, fish products, money, information, and people [4,30,31]. With only one fisheries metacoupling study published to date [32]—descriptive research that conceptualized rather than quantified metacoupling components in inland streams—there is a pressing need for data-driven metacoupling research on marine fisheries and their metacoupled social-ecological contributions, including biodiversity and ecosystem function as well as food/nutrition security, employment, livelihoods, and recreational opportunities for billions of people globally [6,33]. To fill such important knowledge gaps, we used the metacoupling framework to analyze marine fisheries catches and fish flows within and across the world’s EEZs and the high seas in 1950–2014. Our first objective was to quantify, and assess how economic conditions and fisheries policies influence, metacoupled catches and fish flows within nations, between adjacent nations, and between distant nations over 65 years. Our second objective was to identify EEZs with particularly large catches and flows relative to primary production (i.e., hotspots for metacoupled fisheries management). Finally, we developed a metacoupling typology to distinguish and facilitate sustainable management and governance of different classes of metacoupled fisheries locally, regionally, and globally.
2. Materials and Methods
2.1. Metacoupling Framework
In the metacoupling framework, all couplings (metacouplings and their constituent intracouplings, pericouplings, and telecouplings) are characterized by systems (CHANS), flows, agents, causes, and effects [19] (Figure 1). CHANS are classified according to their association with flows (movements of harvested fish, fish products, people, money, information, etc.) as “sending” (systems where flows arise), “receiving” (systems that receive flows), or “spillover” (systems that affect, or are affected by, sending–receiving system interactions). Because fisheries metacouplings involve different sectors (artisanal, subsistence, industrial, recreational) with unique flows of fish, people, money, and information distributed across distinct spatial areas, a particular fisheries system may be classified in multiple ways (sending, receiving, spillover). Agents are the autonomous decision-making entities such as individuals, organizations, and governments that facilitate or hinder couplings directly or indirectly through feedbacks, either transparent or hidden [19,23]. By comparison, causes are environmental, socioeconomic, political, cultural, and technological reasons why couplings occur, and effects are the social-ecological outcomes of couplings.
This study encompassed three types of fishing corresponding to the metacoupling framework’s major components (Figure 1). Type 1 fishing (intracoupling) comprised industrial, artisanal, subsistence, and recreational catches and intranational flows caused by nations fishing within their own EEZs, including territories, collectivities, etc. Type 2 fishing (pericoupling) encompassed industrial catches in, and flows to and from, EEZs of adjacent nations (those sharing land/maritime borders; Figure 1). Type 3 fishing (telecoupling) included industrial catches in, and flows to and from, EEZs of distant nations (those not sharing land/maritime borders) and the high seas. Type 2 and Type 3 fishing were exclusively industrial because other, small-scale sectors (artisanal, subsistence, recreational) are inherently Type 1, occurring within coastal subunits of EEZs called inshore fishing areas (IFAs) that extend to either 50 km offshore or 200 m deep, whichever comes first [34]. The Type 1 designation used herein applies to EEZs, not IFAs, because it encompasses intranational industrial fishing occurring throughout entire EEZs [35]. Moreover, small-scale fisheries catches are numerically and typologically identical regardless of how they are evaluated spatially (e.g., EEZ or IFA), which is critical from a metacoupling perspective because the metacoupling framework is specifically designed to accommodate diverse systems for defining spatial boundaries and hence evaluating Type 1–3 interactions [19].
2.2. Metacoupling Catch and Flow Analysis
Type 1, Type 2, and Type 3 catches and associated fish flows were quantified in the world’s 280 EEZs from 1950 to 2014 using data on fisheries catch magnitude (metric tons) and value (2010 USD equivalent) for landings and discards of all species included in the Sea Around Us database [35]. For each EEZ, catches were subdivided by fishing nation, allowing Type 1, Type 2, and Type 3 fishing as well as metacouplings (sums of Type 1–3 catches) to be measured annually over the 65-year period. In addition, Type 1–3 catches were analyzed on a proportional basis (i.e., proportion of metacouplings that each fishing type represented) in all EEZs and years.
Beginning in the 1960s, the United Nations Convention on the Law of the Sea (UNCLOS) developed a system allowing nations to formally claim ocean areas along their shores, including 200 nautical-mile EEZs [35]. Because individual nations ratified UNCLOS at different times, EEZ declaration years are variable, ranging from 1950 to 2011 across the 280 EEZs studied herein. However, the Sea Around Us database contains fisheries catch data (e.g., fishing nation, year, tonnage, sector) for EEZ-equivalent waters in years prior to EEZ declaration. As such, Types 1, 2, and 3 fishing were defined consistently in 1950–2014 according to the geographic proximity between fishing nations and waters fished (i.e., nations’ own EEZs or EEZ-equivalent waters (Type 1), adjacent waters (Type 2), distant waters (Type 3)). This procedure is both logical and justifiable because fishing occurred both intranationally and internationally prior to the year each EEZ was declared [35], causing flows of fish within and beyond nations and thereby creating metacouplings that have not been evaluated, much less included in fisheries management and governance programs. Through a metacoupling lens, fishing known to have occurred and which is numerically supported in databases like Sea Around Us needs to be accounted for—rather than treated as a “zero” [8] until EEZ declaration—to comprehensively understand formation and evolution of human–nature interactions in fisheries in 1950–2014, and thereby yield insights for metacoupling-based fisheries management and governance. Moreover, rather than adhering to particular geographic designation systems, the metacoupling framework is specifically designed to promote flexibility in how spatial boundaries are defined and how Type 1–3 interactions are evaluated; catches in EEZs and EEZ-equivalent waters were thus sufficient for assessing fisheries metacouplings in a consistent, standardized manner in 1950–2014 [19].
Temporal trends in the number, tonnage, metacoupling proportion, and monetary value of Type 1–3 catches and flows were evaluated at three spatial scales: (1) across the world (all EEZs and the high seas); (2) EEZs within geographic regions; (3) within individual EEZs. Geographic regions included Africa (Western distinguished from rest of Africa), Asia, the Caribbean, Central America, Europe (Eastern/Southern, Northern, Western), North America, Oceania, and South America. Moreover, trends in catches relative to primary production (metric tons fish/metric kiloton carbon (C)) were evaluated in 1950–2014 to locate EEZs where fishing had a large effect on fish populations compared to the amount of inorganic carbon fixed by aquatic organisms [36]. Such fishing “hotspot EEZs” were identified as those with the largest mean annual catches relative to primary production in 1950–2014 (97.5th percentile, n = 7 EEZs) for the four types of fishing (metacoupling and Type 1–3). High-catch EEZs—those that were not fishing hotspots but which experienced large mean annual catches relative to primary production (between the 87.5th and 97.5th percentiles; n = 28 EEZs)—were identified for each fishing type to determine where fisheries catches were relatively large compared to carbon fixation, and thus where fisheries management/governance efforts may be especially important. Measurements of primary production were obtained for each of 280 EEZs and the high seas [35] and included 10-year (1998–2007) monthly averages that were depth-integrated based on chlorophyll pigment concentrations derived from SeaWiFS [37]. Estimates of primary production were averaged over 10 years because 65-year data were unavailable, and available data were representative of primary production over multiple decades [36].
2.3. Fisheries Metacoupling Typology
A metacoupling typology was developed to understand differences in the types and magnitudes of catches and associated fish flows within and among EEZs every year in 1950–2014. Annual classifications reflected fishing types (1 (Type 1), 2 (Type 2), 3 (Type 3)) and the order of catch and flow tonnage (e.g., 123 means 1 > 2 > 3; 1 means only Type 1). In this typology, Type-1-dominant fishing encompassed three classifications (1, 123, 132), as did Type-2-dominant fishing (2, 213, 231) and Type-3-dominant fishing (3, 312, 321). Ultimately, the typology was useful for evaluating local, regional, and global trends in the predominance of different fishing types and thereby promoting strategies for sustainable management and governance of diverse metacoupled fisheries across the world.
2.4. Correlation Analysis
It was predicted that Type 3 fishing would at times conflict with Type 1 fishing by, for instance, decreasing Type 1 artisanal and subsistence catches, altering species composition, or forcing small-scale fishers to migrate to new fishing locations [38]. As such, correlations between the number of Type-1-dominant and Type-3-dominant EEZs in 1950–2014, and the number of Type-1-only and Type-3-only EEZs, were evaluated by calculating Pearson product–moment correlation coefficients (one-sided, as correlations were predicted to be negative).
It was also important to assess how economic conditions influenced catches and fish flows, both globally and differentially across the world. As such, correlations between nations’ Gross Domestic Product (GDP, 2019 USD equivalent) and Type 1, Type 2, and Type 3 tonnages in 1950–2014 were measured for the 168 valid EEZ-nation combinations recognized by The World Bank [39], where GDP data were obtained. Pearson product–moment correlation coefficients (two-sided) were calculated and compared among geographic regions. Peru was identified as an outlier because it had the largest Type 1 tonnage but a moderate GDP, causing it to decrease the global correlation between GDP and Type 1 catches by 0.10. Western African EEZs warranted additional analysis as they had relatively large foreign (Type 3) catches due to historically limited fisheries governance and enforcement programs [38,40]. As such, correlations between Type 3 catches and fisheries policy effectiveness in Western Africa were evaluated, as were correlations involving Types 1 and 2 fishing. Correlation analysis was one-sided as correlations were predicted to be negative for Type 2/3 catches and positive for Type 1 catches. Measurements of policy effectiveness (prevention of overfishing and underutilization) were obtained from the Stable Seas Maritime Security Index [41].
2.5. Global Maps of Fisheries Catches and Flows
ArcMap was used to generate global maps depicting fisheries metacouplings as well as Type 1, Type 2, and Type 3 fishing across EEZs, particularly tonnages and proportions relative to metacouplings (n = 7 maps total). For each map, multiple data classification methods (equal interval, manual interval, quantile, natural breaks (Jenks)) were tested to determine which displayed trends in fishing types with the greatest information content, juxtaposition (i.e., discernible differences in fishing types across space), and legibility. For all maps, the natural breaks (Jenks) classification depicted these patterns most effectively, highlighting important differences among fishing types in an accurate, easily visible manner that maximized information content and juxtaposition relative to the other classification methods.
In addition, for each of the seven maps detailed above, multiple versions were created that varied in the number of color-coded categories used to depict fisheries catches and flows. Versions of each map with n = 2 to n = 24 categories were compared to determine which version displayed catches and flows with the most optimal combination of information content, juxtaposition, and legibility. Maps with n = 2–7 categories were readily legible but lacked the detailed local, regional, and global information content of maps with more categories. In contrast, maps with more than 10 categories had fine-grained information content for each fishing type but often low juxtaposition and legibility. Hence, maps with n = 8 categories are included here.
3. Results
3.1. Fisheries Catches Across Space and Time
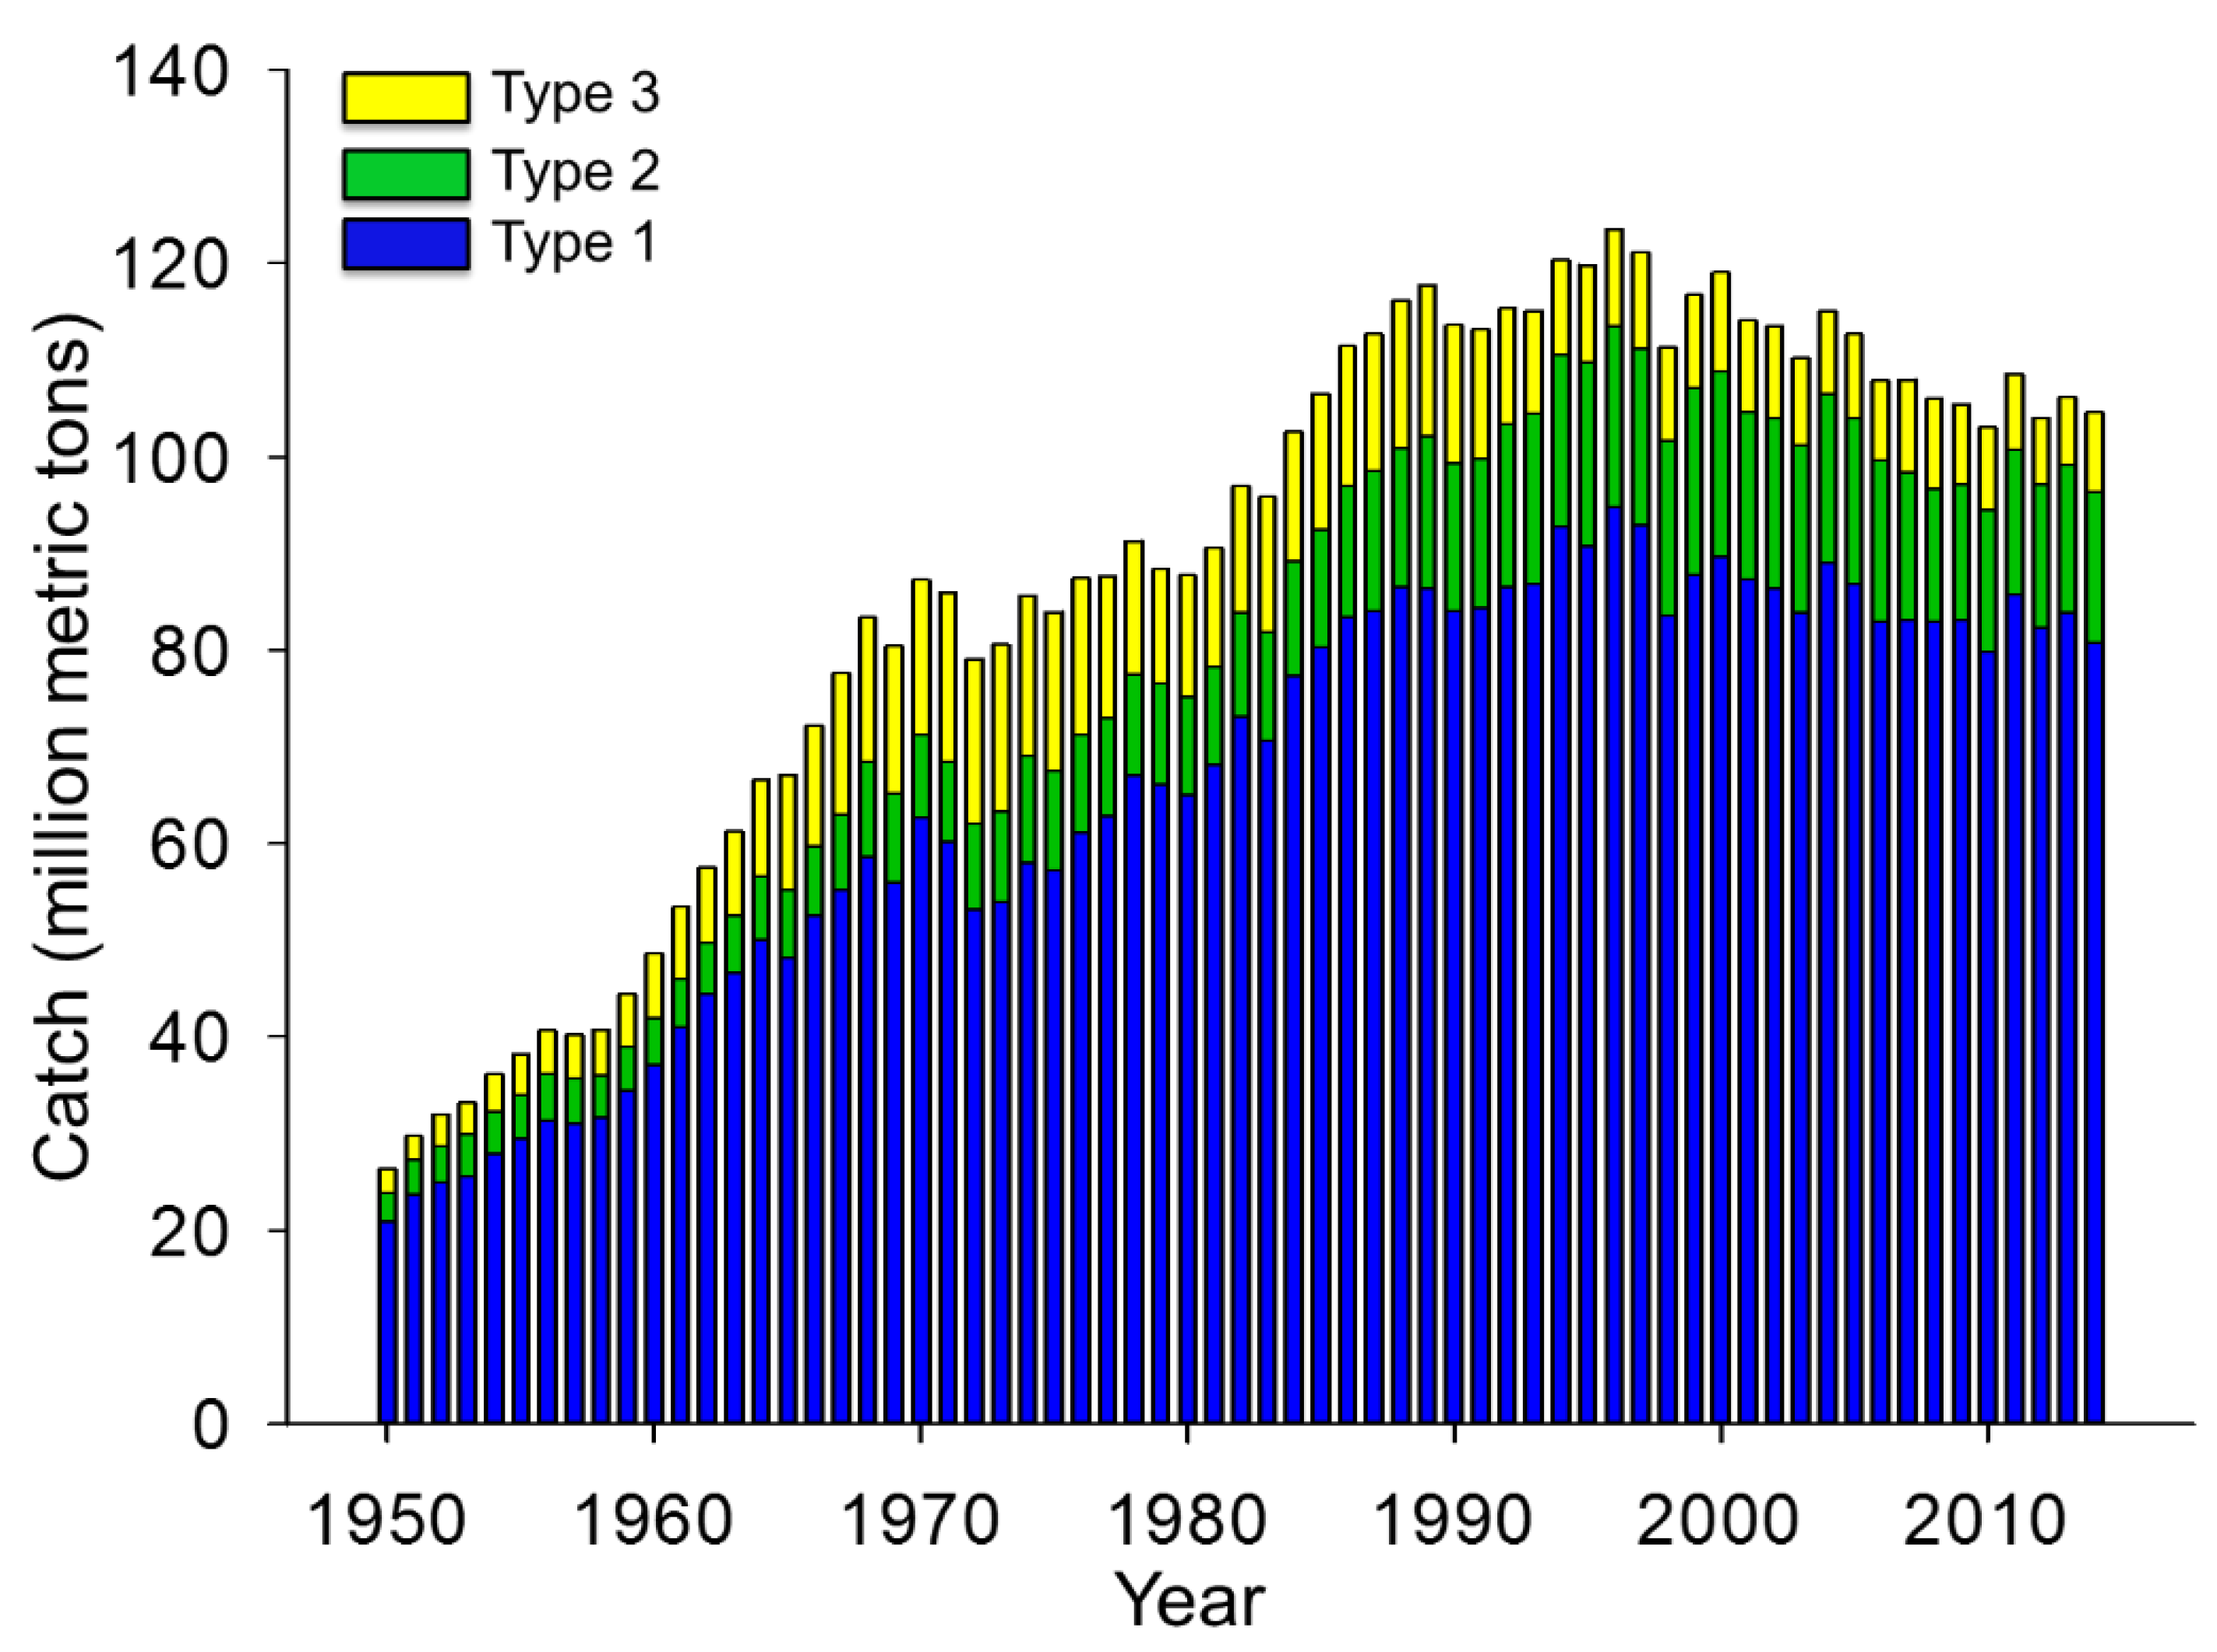
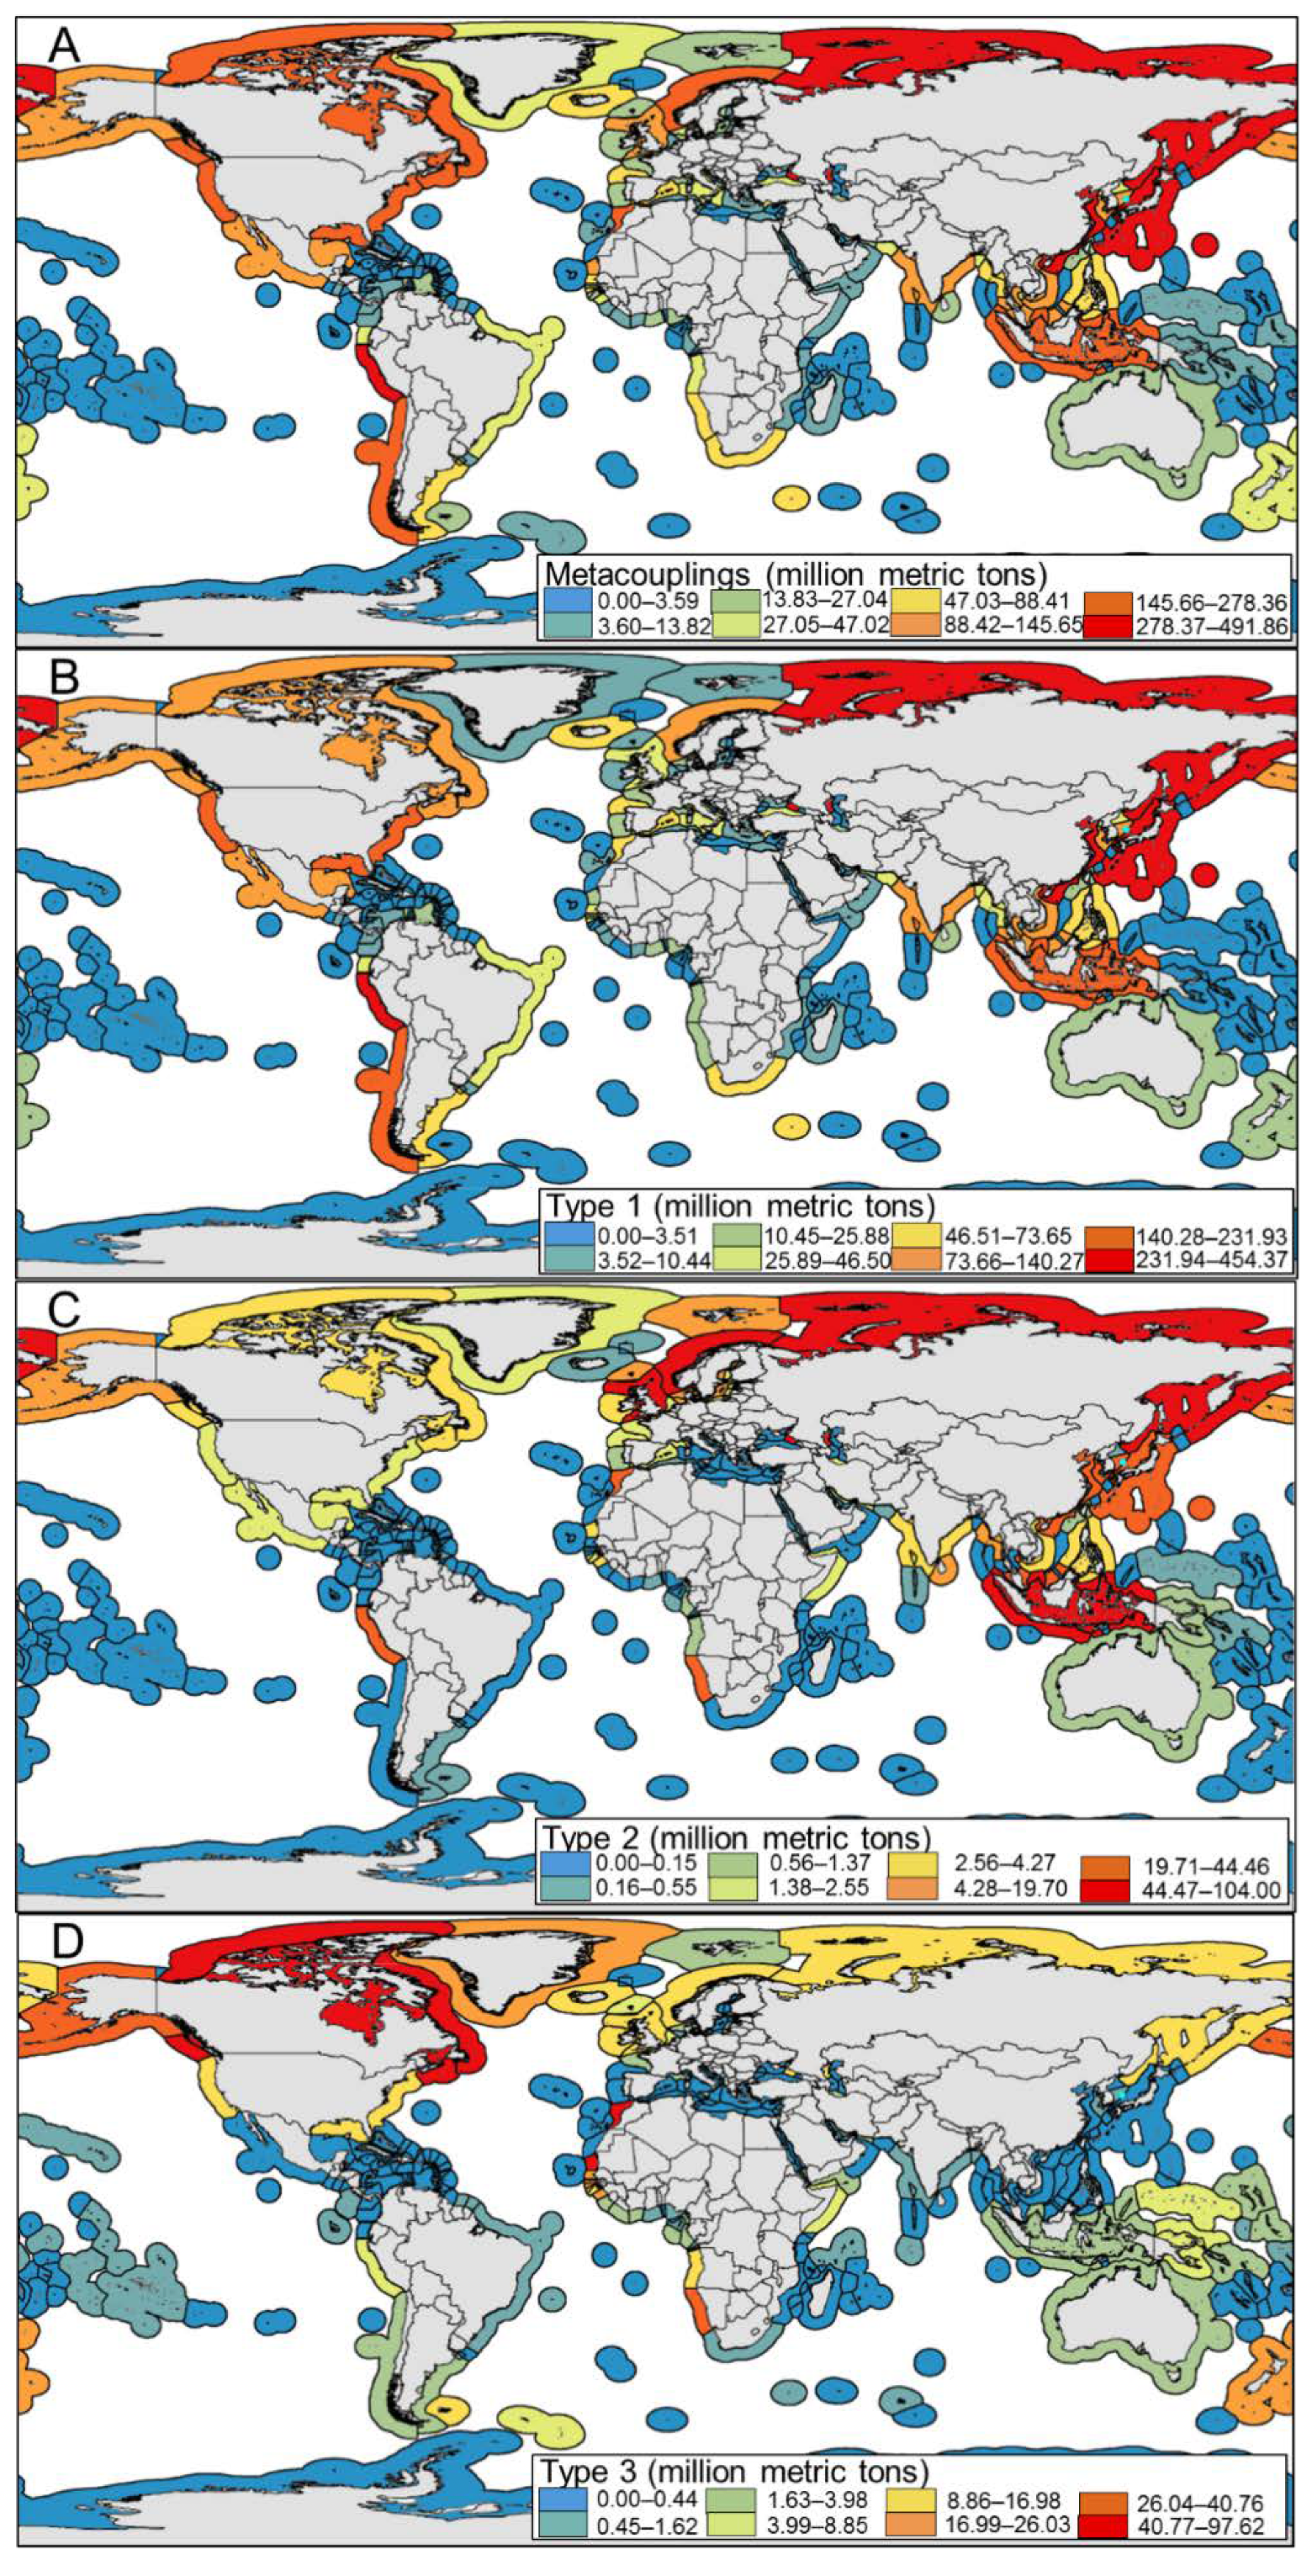
In 1950–2014, catches totaled 5.7 billion metric tons across EEZs (Figure 2 and Figure 3A; Table S1) and 5.8 billion metric tons including the high seas. Metacouplings (total catches) across EEZs increased from 26.3 million metric tons (MMT) in 1950 to 104.6 MMT in 2014—equivalent to a 431% increase in monetary value (USD 29.5 billion to 156.5 billion). Metacoupling hotspot EEZs—those in the 97.5th percentile of mean annual catch relative to primary production—included Cambodia (48.1 metric tons fish/metric kiloton C/yr), Israel (Red Sea, 41.3), Slovenia (37.5), Thailand (Gulf of Thailand, 26.7), Bosnia and Herzegovina (26.1), Peru (23.9), and Turkey (Marmara Sea, 22.5; Figure S1). Metacoupling high-catch EEZs (87.5–97.5th percentile; n = 28 EEZs) were primarily located in Asia (n = 14 EEZs; e.g., Malaysia, Hong Kong) and Northern/Western Africa (n = 7; e.g., Morocco, Guinea; Table S2).
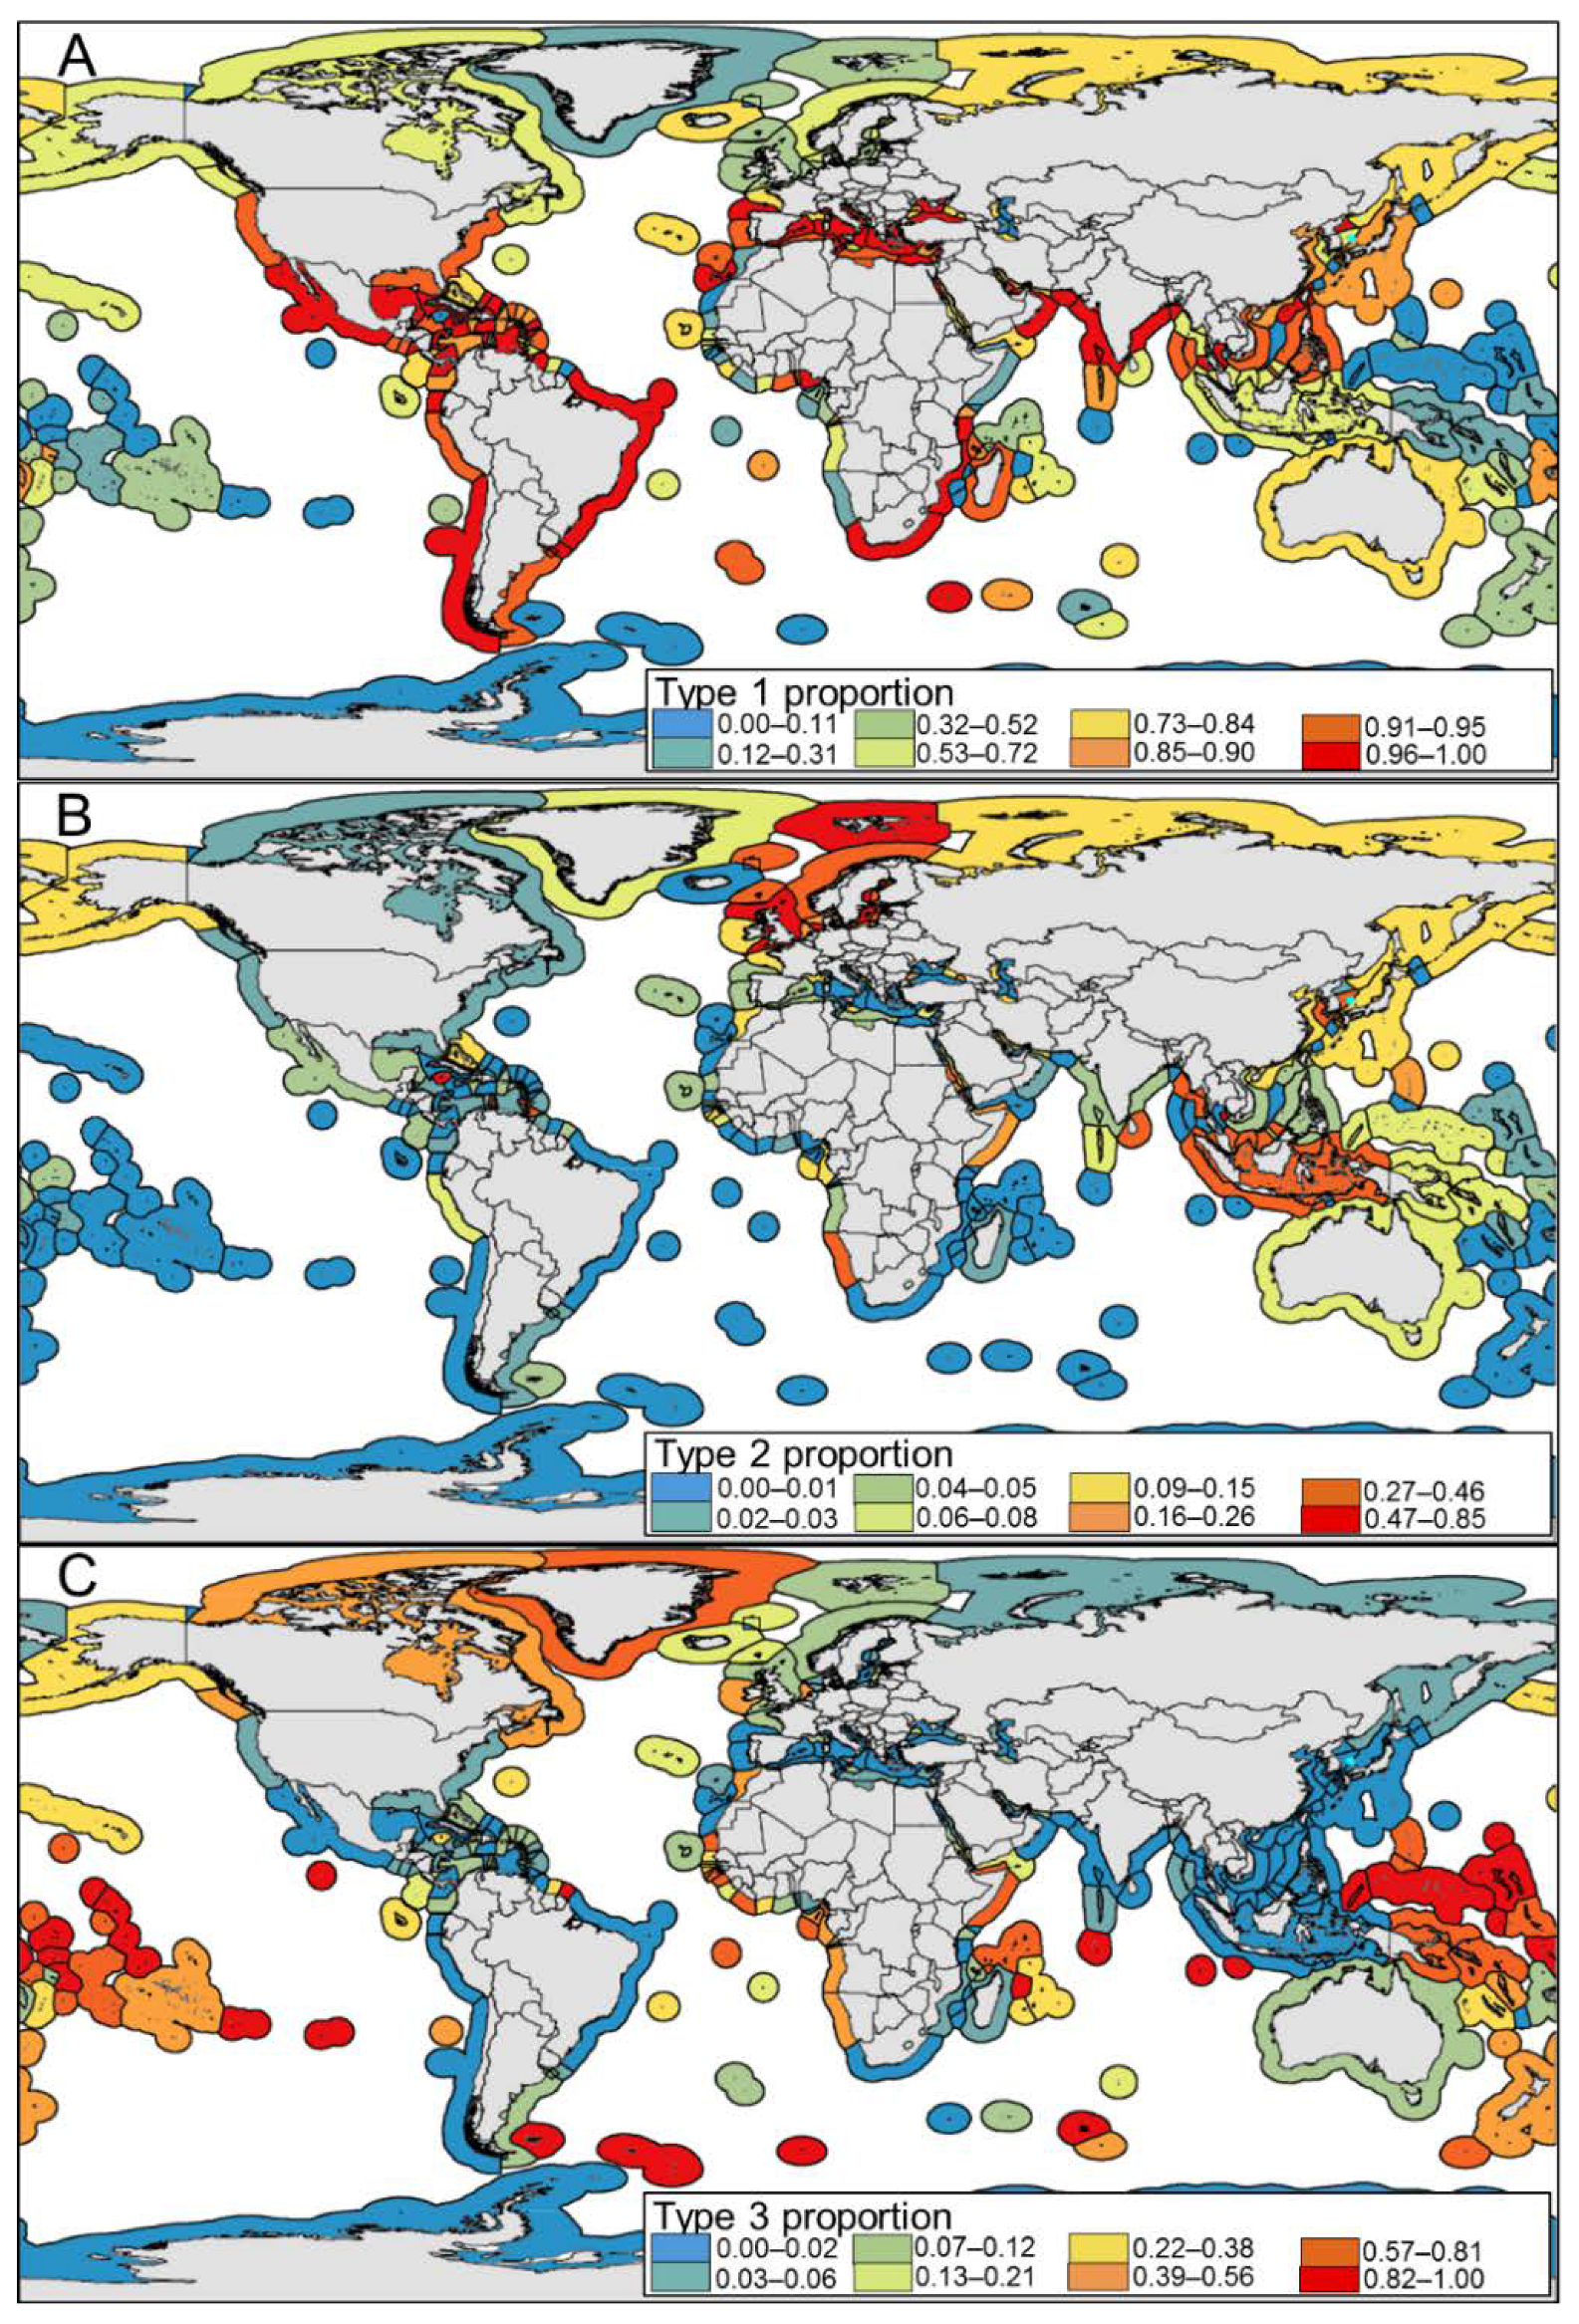
Type 1 fish flows totaled 4.3 billion metric tons in 1950–2014, accounting for 73% of metacouplings (Figure 2 and Figure 3B; Tables S1, S3 and S4). The monetary value increased almost fivefold from 1950 (USD 25.9 billion) to 2014 (USD 127.1 billion). During this period, EEZs with the largest Type 1 flows included Peru (454.4 MMT), Japan (main islands, 360.8 MMT), and China (315.3 MMT; Figure 3B). However, EEZs with the highest Type 1 proportions relative to total catches were concentrated in Central/South America, Southern Africa, and the Mediterranean and Arabian seas (Figure 4A). Type 1 hotspot EEZs included Israel (Red Sea, 41.3 metric tons fish/metric kiloton C/yr), Slovenia (37.5), Thailand (Gulf of Thailand, 26.6), Bosnia and Herzegovina (26.1), Turkey (Marmara Sea, 22.5), Peru (22.0), and Iraq (19.3; Figure S2). High-catch EEZs were primarily located in Eastern/South-eastern Asia (n = 12 EEZs; e.g., Malaysia, Singapore) and Northern/Southern Europe (n = 6; e.g., Denmark, Italy; Table S5).
Relative to Type 1 fish flows, Type 2 flows showed a similar trend but smaller magnitude (748.9 MMT, 13% of metacouplings) in 1950–2014 (Figure 2 and Figure 3C; Tables S1, S3 and S6). During this period, the monetary value increased elevenfold from USD 1.5 billion to 17.4 billion. Type 2 fishing happened at least once in 1950–2014 in 204 EEZs, making it less widespread than Type 1 (278 EEZs) and Type 3 (271 EEZs) fishing. EEZs with the largest Type 2 catches (Figure 3C) and highest proportions relative to total catches (Figure 4B) were concentrated in Northern/Western Europe and Oceania/Southeast Asia. Type 2 hotspot EEZs included Cambodia (41.1 metric tons fish/metric kiloton C/yr), Malaysia (Peninsula East, 6.1), Germany (North Sea, 5.9), Malaysia (Sabah, 5.3), Malaysia (Sarawak, 5.1), Lithuania (4.9), and the United Kingdom (4.8; Figure S3). High-catch EEZs were primarily located in Northern/Western Europe (n = 12 EEZs; e.g., Sweden, Germany) and Asia (n = 8; e.g., South Korea, Malaysia; Table S7).
Type 3 fish flows across EEZs (683.7 MMT, 12% of metacouplings; Figure 2 and Figure 3D; Tables S3 and S8) and in the high seas (108.0 MMT, 2% of metacouplings; Tables S1 and S9) were collectively larger than Type 2 flows but much smaller than Type 1 flows in 1950–2014. The monetary value increased nearly six-fold from 1950 (USD 2.2 billion) to 2014 (USD 12.0 billion), peaking at USD 20.7 billion in 1990. EEZs with the largest Type 3 catches included Mauritania (79.2 MMT), eastern Canada (77.1 MMT), and southern Morocco (71.7 MMT; Figure 3D). In contrast, EEZs with the highest Type 3 proportions relative to total catches were concentrated in Micronesia, Polynesia, and the South Atlantic Ocean (Figure 4C). Type 3 hotspot EEZs were primarily located in Northern/Western Africa, including Guinea (9.0 metric tons fish/metric kiloton C/yr), The Gambia (7.8), Morocco (South, 7.2), Morocco (Central, 7.1), Mauritania (6.6), Guinea-Bissau (6.4), and Senegal (3.8; Figure S4). High-catch EEZs were primarily located in Northern/Western Europe (n = 10 EEZs; e.g., Ireland, Netherlands), Middle/Western Africa (n = 9; e.g., Angola, Togo), and Northern America (n = 3; e.g., Canada, Greenland; Table S10).
Spatial differences in fishing types enabled global classification of EEZs based on metacoupled fish flows (Table S11). Type-1-dominant fishing (Type 1 catches and flows largest) was widespread across the globe in 1950–2014, annually representing 74% of EEZs (n = 208) on average (Figure 5A). Type-2-dominant fishing happened least frequently (mean 6% of EEZs, n = 17) but was significant in Northern/Western Europe (Figure 4B, Tables S11 and S12) due to the close proximity of developed nations with relatively high fishing capacity, a situation which lends itself to Type 2 fishing. Type-3-dominant fishing (mean 18% of EEZs, n = 51; Figure 5A) was prevalent in Oceania and Western Africa (Figure 4C, Tables S11 and S12). These regions have high fish productivity and relatively limited fishing infrastructure, governance, and enforcement systems [38,40,42], conditions that facilitate legal and illegal Type 3 catches by industrial fleets [43].
3.2. Metacoupling Relationships among Fishing Types
In 1950–2014, there were strong negative correlations between numbers of Type-1-dominant and Type-3-dominant EEZs (r = −0.94; Figure 5A) and Type-1-only and Type-3-only EEZs (r = −0.92; Figure 5B,C; Tables S13 and S14). For instance, the percentage of EEZs with Type-1-dominant fishing was highest in Central America (97%), the Caribbean (93%), Asia (91%), and South America (90%), regions where Type-3-dominant fishing was scarce (2–9%; Table S12). In contrast, Type 3 fishing predominated in Oceania (63% of EEZs), Western Africa (38%), and North America (25%), regions where Type-1-dominant fishing was comparatively uncommon (37–74%). These results indicate a negative metacoupling interaction between Type 1 and Type 3 fishing wherein global demographic, socioeconomic, and political conditions favored Type 1 fishing in certain regions and time periods and Type 3 fishing in others. For instance, increased Type 3 fishing in 1950–1965 (Figure 2 and Figure 5A) coincided with rapid human population growth and need for food, including fish caught in distant waters [4]. Type-2-only EEZs were virtually nonexistent in 1950–2014 (Figure 5C), and the percentage of Type-2-dominant fishing was relatively low and consistent across geographic regions (mean: 8% of EEZs; SEM: 4%) except for Northern Europe (47%) and Western Europe (15%; Table S12).
3.3. Economic and Policy Effects on Metacouplings
Correlation analysis also indicated that tonnage of Type 1 catches and fish flows in 1950–2014 tended to increase with gross domestic product (GDP) in nations across the world (r = 0.65 (0.55 including Peru); Tables S15 and S16). Strong positive correlations (≥ 0.71) characterized most geographic regions with the notable exception of Western Europe, where increased GDP was correlated with smaller Type 1 tonnage (r = −0.20) and larger Type 2 tonnage (r = 0.82). In addition, GDP was strongly correlated with Type 2 tonnage in Northern Europe (r = 0.81; Table S15), helping explain why these two European regions—with developed, high-fishing-capacity, high-GDP countries in close proximity [39]—were hotspots for Type 2 fishing (Figure 4B). Type 2 tonnage increased with GDP in North America and Central America (r = 0.99) but tended to decline with rising GDP in Western Africa (r = −0.26) and South America (r = −0.12). Correlations between GDP and Type 3 tonnage were positive (r = 0.07–0.60) in most geographic regions, but Type 3 tonnage tended to decrease as GDP increased in Western Africa (r = −0.20) and South America (r = −0.07; Table S15). Likewise, with increasing fisheries policy effectiveness (prevention of overfishing and underutilization) in Western African EEZs [41], Type 3 and Type 2 tonnages decreased (r = −0.52) whereas Type 1 tonnage increased (r = 0.52; Tables S17 and S18).
4. Discussion
The metacoupling framework advances fisheries science and management in important ways. First, it offers a systematic, broadly applicable method for understanding social-ecological complexities such as spatiotemporal catch and fish flow patterns and Type 1–Type 3 interactions, and gaining management insights such as fishery classifications by metacoupling type (Table S11) and catches relative to primary production (Figures S1–S4; Tables S2, S5, S7 and S10) [31,44,45]. Second, the metacoupling framework is an instrument for integrating social-ecological data spatially and temporally [19,25,26,27], which advances conventional research methods that are largely location-specific and either social or ecological. As a tool for operationalizing multiscalar human–environmental research, the metacoupling framework makes a unique contribution to a fisheries discipline wherein social-ecological knowledge gaps—including uncertainties regarding the frequency, spatiotemporal distribution, causes, and effects of metacouplings—are abundant and need to be addressed locally, regionally, and globally [4,20,46,47,48]. For instance, although global flows of fish and associated food and jobs created a small-world network of marine fisheries in 2005–2014 [49], local to global research spanning multiple decades is needed to comprehensively understand how metacouplings develop, change spatially and temporally, and influence fisheries management and human health and well-being. We contributed to this knowledge base by analyzing fisheries metacouplings locally to globally over 65 years and identifying hotspots where fisheries management and governance efforts are especially important. We also showed how economic growth and vitality are crucial for robust fisheries governance systems that optimize metacoupling relationships among fishing types, particularly in developing nations with limited fisheries management resources. For example, as GDP increased and fisheries policies became more effective in relatively poor Western African countries, fisheries management was strengthened to the extent that domestic catches grew and foreign catches—legal and illegal [43]—declined with positive outcomes for food/nutrition security and livelihoods.
The metacoupling framework also provides social-ecological insights about fisheries systems that broaden and deepen the scope of conventional monothematic (social or ecological, location-specific) research approaches. For instance, global classification of EEZs based on metacoupling relationships revealed how metacouplings are expressed in unique ways in different parts of the world. Types 1 and 2 fishing were predominant globally and in Northern/Western Europe, respectively, whereas Type 3 fishing was widespread in Oceania and Western Africa. Fisheries management strategies in these regions should not only encompass metacouplings and the relative predominance of different fishing types, they should account for cross-scalar interactions among fishing sectors. For example, negative interactions between Type 1 and Type 3 catches need to be accounted for in fisheries policies and management programs, especially in nations and regions where Types 1 and 3 fishing overlap directly in terms of locations and species. Likewise, metacoupling-informed fisheries management programs should consider nations’ socioeconomic statuses because they influence the predominance of different fishing types and metacoupling interactions across spatial scales, as demonstrated herein. Using a metacoupling lens, decision-makers can develop holistic fisheries management and governance approaches that balance multiple social-ecological objectives and tradeoffs locally, regionally, and globally.
The present study complements and advances previous research on fisheries catches at local, regional, and global levels. For instance, the Sea Around Us database [35] encompasses fisheries data reflecting within-EEZ research such as Nunoo et al. [10] (Ghana EEZ) and Smith and Zeller [11] (Bahamas EEZ). Fisheries research across multiple EEZs has also been conducted. Sumaila et al. [14] calculated the percentage of global fisheries catches represented by three zonal categories (EEZs only, high seas only, EEZs and high seas) in 2000–2010, and Belhabib et al. [15] compared industrial and artisanal catch per unit effort in 22 EEZs of Western Africa in 1950–2010. Similarly, Pauly and Zeller [8] reconstructed catches in the world’s EEZs, Pikitch et al. [16] calculated total catches and landed values of forage fishes such as herrings and anchovies across EEZs, and Zeller et al. [17] evaluated marine fisheries discards across EEZs. Some of this previous research was global but temporally limited [14] or temporally extensive but spatially restricted [15], whereas other studies [8,17] were conducted at the global, long-term (1950–2014) scales used in the present study. However, we advanced prior research by using a metacoupling lens to analyze fisheries catches and flows across the world over 65 years for all recorded species. In particular, we assessed local, regional, and global fish flows systematically and simultaneously within and across adjacent and distant EEZs and the high seas to inform development of multiscalar, metacoupled fisheries management programs. As such, the present study connects fish and fisheries locally, regionally, and globally over multiple decades in ways that previous studies have not, laying a foundation for continued fisheries metacoupling research, both basic and applied.
Importantly, metacouplings are currently unrecognized in fisheries management and thus absent from governance programs and associated human health, well-being, and biodiversity conservation initiatives. However, the metacoupling framework advances the concept of metacoupled governance, which explicitly accounts for and manages metacouplings to enhance fisheries sustainability locally to globally. Metacoupled governance requires transitioning from sectorial management of specific places and issues such as fish production and fishmeal trade to approaches that integrate local, regional, and global flows of fish, money, information, and people. By balancing benefits and costs of fisheries metacouplings for fish populations, economies, food/nutrition security, and livelihoods, metacoupled governance holistically links ecosystems and human systems and thereby optimizes fisheries management locally, regionally, and globally. Although the need for such multidimensional fisheries governance has been discussed [48,49], the metacoupling framework provides a tool for operationalizing it. Overall, the metacoupling framework is an effective approach for evaluating local, regional, and global human–nature interactions in fisheries. As pressures on the world’s marine ecosystems continue to rise, the metacoupling framework provides a holistic, adaptable method for advancing the science and sustainability of fisheries across the globe.
Supplementary Materials
The following are available online at https://www.mdpi.com/2071-1050/12/11/4714/s1. Figure S1: Metacouplings (total catches) relative to primary production in hotspot exclusive economic zones (EEZs). These EEZs were in the 97.5th percentile of mean annual metacoupling catch/primary production (metric tons fish/metric kiloton carbon) in 1950–2014. Figure S2: Type 1 fisheries catches (by nations in their own exclusive economic zones (EEZs)) relative to primary production in hotspot EEZs. These EEZs were in the 97.5th percentile of mean annual Type 1 catch/primary production (metric tons fish/metric kiloton carbon) in 1950–2014. Figure S3: Type 2 fisheries catches (by nations in adjacent exclusive economic zones (EEZs)) relative to primary production in hotspot EEZs. These EEZs were in the 97.5th percentile of mean annual Type 2 catch/primary production (metric tons fish/metric kiloton carbon) in 1950–2014. Figure S4: Type 3 fisheries catches (by nations in distant exclusive economic zones (EEZs)) relative to primary production in hotspot EEZs. These EEZs were in the 97.5th percentile of mean annual Type 3 catch/primary production (metric tons fish/metric kiloton carbon) in 1950–2014. Table S1: Fisheries metacoupling summary information. The table includes summary calculations of the number and tonnage (metric tons) of Type 1, Type 2, and Type 3 catches as well as metacouplings in the world’s exclusive economic zones (EEZs) and the high seas from 1950 to 2014. Table S2: Metacoupling high-catch exclusive economic zones (EEZs). These EEZs were between the 87.5th and 97.5th percentiles of mean annual catch relative to primary production (metric tons fish/metric kiloton carbon (MTfish/MkTC)) for metacouplings (total catches) in 1950–2014. Table S3: Overview of Type 1, Type 2, and Type 3 fishing in the world’s exclusive economic zones. Table entries are the number of nations that participated in Type 1, Type 2, and Type 3 fishing in each exclusive economic zone (EEZ) from 1950 to 2014. Different fishing types are included in separate spreadsheet tabs. Table S4: Type 1 fisheries catches in the world’s exclusive economic zones. Table entries are Type 1 catches in metric tons (first spreadsheet tab) and metric tons fish/metric kiloton carbon (primary production) (second tab) in each exclusive economic zone (EEZ) from 1950 to 2014. Table S5: High-catch exclusive economic zones (EEZs) for Type 1 fishing. These EEZs were between the 87.5th and 97.5th percentiles of mean annual catch relative to primary production (metric tons fish/metric kiloton carbon (MTfish/MkTC)) for Type 1 fishing in 1950–2014. Table S6: Type 2 fisheries catches in the world’s exclusive economic zones. Table entries are Type 2 catches in metric tons (first spreadsheet tab) and metric tons fish/metric kiloton carbon (primary production) (second tab) in each exclusive economic zone (EEZ) from 1950 to 2014. In the catch tab, the two columns for each EEZ represent the identities and catches of nations that participated in Type 2 fishing. The catch per primary production (PP) tab is organized similarly, with additional columns containing metric tons fish/metric kiloton carbon for each nation that participated in Type 2 fishing. Table S7: High-catch exclusive economic zones (EEZs) for Type 2 fishing. These EEZs were between the 87.5th and 97.5th percentiles of mean annual catch relative to primary production (metric tons fish/metric kiloton carbon (MTfish/MkTC)) for Type 2 fishing in 1950–2014. Table S8: Type 3 fisheries catches in the world’s exclusive economic zones. Table entries are Type 3 catches in metric tons (first spreadsheet tab) and metric tons fish/metric kiloton carbon (primary production) (second tab) in each exclusive economic zone (EEZ) from 1950 to 2014. In the catch tab, the two columns for each EEZ represent the identities and catches of nations that participated in Type 3 fishing. The catch per primary production (PP) tab is organized similarly, with additional columns containing metric tons fish/metric kiloton carbon for each nation that participated in Type 3 fishing. Table S9: Type 3 fisheries catches in the high seas. Table entries are Type 3 catches in metric tons (first spreadsheet tab) and metric tons fish/metric kiloton carbon (primary production) (second tab) in the high seas from 1950 to 2014. Table S10: High-catch exclusive economic zones (EEZs) for Type 3 fishing. These EEZs were between the 87.5th and 97.5th percentiles of mean annual catch relative to primary production (metric tons fish/metric kiloton carbon (MTfish/MkTC)) for Type 3 fishing in 1950–2014. Table S11: Fisheries metacoupling typology for the world’s exclusive economic zones. Table entries denote fishing types (1 (Type 1), 2 (Type 2), 3 (Type 3)) and the order of catch and flow tonnage for each exclusive economic zone (EEZ) and year. For instance, 123 means 1 > 2 > 3, whereas 1 means only Type 1. Type-1-dominant fishing encompasses three classifications (1, 123, 132), as does Type-2-dominant fishing (2, 213, 231) and Type-3-dominant fishing (3, 312, 321). N/A denotes no fishing in a particular EEZ and year. Table S12: Geographic trends in fishing-type predominance. Table entries are cumulative numbers of exclusive economic zones (EEZs) that exhibited particular fishing types in 1950–2014, where types denote the order of catch and flow tonnage. For instance, 123 means Type 1 tonnage > Type 2 tonnage > Type 3 tonnage, whereas 1 means Type 1 tonnage only. 1-dominant, 2-dominant, and 3-dominant refer to the number and percentage of EEZs in which Type 1, Type 2, and Type 3 tonnage was largest, respectively. Regions include: Western Africa (AfrW), the rest of Africa (Afr), Asia, the Caribbean (Caribb), Central America (CentAm), Northern Europe (EurN), Western Europe (EurW), Eastern and Southern Europe (EurE,S), North America (NA), Oceania, and South America (SA). Table S13: Correlations between numbers of exclusive economic zones that were Type 1/Type 3 dominant and Type 1/Type 3 only in 1950–2014. The table includes Pearson product–moment correlation coefficients (r, one-sided), t values, degrees of freedom (df), and P values. Table S14: Data used for calculating correlations between numbers of exclusive economic zones that were Type 1/Type 3 dominant and Type 1/Type 3 only in 1950–2014. The table includes numbers of exclusive economic zones that were Type 1/Type 3 dominant and Type 1/Type 3 only in 1950–2014. Table S15: Correlations between gross domestic product (GDP) and fisheries catches. The table includes Pearson product–moment correlation coefficients (r, two-sided), t values, degrees of freedom (df), and P values for correlations between national GDP values and Type 1, Type 2, and Type 3 fisheries catches in 1950–2014 across the world’s exclusive economic zones, organized by geographic region. GDP data were obtained from The World Bank (32). Table S16: Data used for calculating correlations between gross domestic product (GDP) and fisheries catches. The table includes cumulative national GDP values and cumulative Type 1, Type 2, and Type 3 fisheries catches (metric tons) within exclusive economic zones (EEZs) in 1950–2014. Data encompass the 168 nations that have: 1) EEZs, and 2) GDP values reported by The World Bank (32). Table S17: Correlations between fisheries policy effectiveness (prevention of overfishing and underutilization) and Type 1, Type 2, and Type 3 fisheries catches in Western Africa. The table includes Pearson product–moment correlation coefficients (r, one-sided), t values, degrees of freedom (df), and P values. Table S18: Data used for calculating correlations between fisheries policy effectiveness (prevention of overfishing and underutilization) and Type 1, Type 2, and Type 3 fisheries catches in Western Africa. The table includes policy effectiveness scores developed by the Stable Seas Maritime Security Index and cumulative Type 1, Type 2, and Type 3 fisheries catches in metric tons within Western African exclusive economic zones in 1950–2014.
Author Contributions
Conceptualization, A.K.C., W.W.T., J.L.; methodology, A.K.C., W.W.T., D.I.R., S.A.L., J.L.; software, A.K.C.; validation, A.K.C.; formal analysis, A.K.C.; investigation, A.K.C., W.W.T., D.I.R., S.A.L., J.L.; resources, A.K.C., W.W.T., D.I.R., S.A.L., J.L.; data curation, A.K.C.; writing—original draft preparation, A.K.C., W.W.T., J.L.; writing—review and editing, A.K.C., W.W.T., D.I.R., S.A.L., J.L.; visualization, A.K.C., S.A.L., J.L.; supervision, A.K.C., W.W.T., D.I.R., S.A.L., J.L.; project administration, A.K.C., W.W.T., D.I.R., S.A.L., J.L.; funding acquisition, A.K.C., W.W.T., D.I.R., S.A.L., J.L. All authors have read and agreed to the published version of the manuscript.
Funding
A.K.C. was supported by the University Distinguished Fellowship (Michigan State University), Robert C. Ball and Betty A. Ball Fisheries and Wildlife Fellowship (Michigan State University), and the Conservation Scholarship Award (Fly Fishers International). J.L. was supported by the U.S. National Science Foundation (1924111), National Aeronautics and Space Administration, Michigan State University (MSU), and MSU AgBioResearch. Funding in support of this research has been provided by Princeton University’s Dean For Research, Princeton Environmental Institute, Andlinger Center for Energy and the Environment, and the Office of the Provost.
Acknowledgments
We thank members of the Sea Around Us project, particularly D. Pauly and D. Zeller, for creating a remarkable fisheries database. We thank members of the Rubenstein and Levin labs at Princeton University (especially M. Andrews, J. Bak-Coleman, A. Gersick, S. Hex, J. Kariithi, Y. Li, and E. Krueger) for constructive feedback on this manuscript and related research.
Conflicts of Interest
The authors declare no conflict of interest.
References
- Liu, J.; Dietz, T.; Carpenter, S.R.; Alberti, M.; Folke, C.; Moran, E.; Pell, A.N.; Deadman, P.; Kratz, T.; Lubchenco, J.; et al. Complexity of coupled human and natural systems. Science 2007, 317, 1513−1516. [Google Scholar] [CrossRef] [PubMed] [Green Version]
- Liu, J.; Mooney, H.; Hull, V.; Davis, S.J.; Gaskell, J.; Hertel, T.; Lubchenco, J.; Seto, K.C.; Gleick, P.; Kremen, C.; et al. Systems integration for global sustainability. Science 2015, 347, 1258832. [Google Scholar] [CrossRef] [PubMed] [Green Version]
- Taylor, W.W.; Ferreri, C.P.; Poston, F.L.; Robertson, J.M. Educating fisheries professionals using a watershed approach to emphasize the ecosystem paradigm. Fisheries 1995, 20, 6–8. [Google Scholar] [CrossRef]
- Carlson, A.K.; Taylor, W.W.; Liu, J.; Orlic, I. Peruvian anchoveta as a telecoupled fisheries system. Ecol. Soc. 2018, 23, 35. [Google Scholar] [CrossRef] [Green Version]
- Cooke, S.J.; Allison, E.H.; Beard, T.D., Jr.; Arlinghaus, R.; Arthington, A.H.; Bartley, D.M.; Cowx, I.G.; Fuentevilla, C.; Leonard, N.J.; Lorenzen, K.; et al. On the sustainability of inland fisheries: Finding a future for the forgotten. Ambio 2016, 45, 753–764. [Google Scholar] [CrossRef] [Green Version]
- Béné, C.; Barange, M.; Subasinghe, R.; Pinstrup-Andersen, P.; Merino, G.; Hemre, G.-I.; Williams, M. Feeding 9 billion by 2050—Putting fish back on the menu. Food Secur. 2015, 7, 261–274. [Google Scholar] [CrossRef] [Green Version]
- Pinsky, M.L.; Fogarty, M. Lagged social-ecological responses to climate and range shifts in fisheries. Clim. Chang. 2012, 115, 883–891. [Google Scholar] [CrossRef]
- Pauly, D.; Zeller, D. Catch reconstructions reveal that global marine fisheries catches are higher than reported and declining. Nat. Commun. 2016, 7, 10244. [Google Scholar] [CrossRef]
- Golden, C.D.; Allison, E.H.; Cheung, W.W.L.; Dey, M.M.; Halpern, B.S.; McCauley, D.J.; Smith, M.; Vaitla, B.; Zeller, D.; Myers, S.S. Fall in fish catch threatens human health. Nature 2016, 534, 317–320. [Google Scholar] [CrossRef]
- Nunoo, F.K.E.; Asiedu, B.; Amador, K.; Belhabib, D.; Lam, V.; Sumaila, R.; Pauly, D. Marine fisheries catches in Ghana: Historic reconstruction for 1950 to 2010 and current economic impacts. Rev. Fish. Sci. Aquac. 2014, 22, 274–283. [Google Scholar] [CrossRef]
- Smith, N.S.; Zeller, D. Unreported catch and tourist demand on local fisheries of small island states: The case of The Bahamas, 1950–2010. Fish. Bull. NOAA 2016, 114, 117–131. [Google Scholar] [CrossRef] [Green Version]
- Swartz, W.; Ishimura, G. Baseline assessment of total fisheries-related biomass removal from Japan’s Exclusive Economic Zones: 1950–2010. Fish. Sci. 2014, 80, 643–651. [Google Scholar] [CrossRef]
- Schiller, L.; Bailey, M.; Jacquet, J.; Sala, E. High seas fisheries play a negligible role in addressing global food security. Sci. Adv. 2018, 4, eaat8351. [Google Scholar] [CrossRef] [PubMed] [Green Version]
- Sumaila, U.R.; Lam, V.W.Y.; Miller, D.D.; Teh, L.; Watson, R.A.; Zeller, D.; Cheung, W.W.L.; Côté, I.M.; Rogers, A.D.; Roberts, C.; et al. Winners and losers in a world where the high seas is closed to fishing. Sci. Rep. 2015, 5, 8481. [Google Scholar] [CrossRef] [PubMed]
- Belhabib, D.; Greer, K.; Pauly, D. Trends in industrial and artisanal catch per effort in West African fisheries. Conserv. Lett. 2018, 11, e12360. [Google Scholar] [CrossRef]
- Pikitch, E.K.; Rountos, K.J.; Essington, T.E.; Santora, C.; Pauly, D.; Watson, R.; Sumaila, U.R.; Boersma, P.D.; Boyd, I.L.; Conover, D.O. The global contribution of forage fish to marine fisheries and ecosystems. Fish Fish. 2014, 15, 43–64. [Google Scholar] [CrossRef]
- Zeller, D.; Cashion, T.; Palomares, M.; Pauly, D. Global marine fisheries discards: A synthesis of reconstructed data. Fish Fish. 2018, 19, 30–39. [Google Scholar] [CrossRef] [Green Version]
- Watson, R.A. A database of global marine commercial, small-scale, illegal and unreported fisheries catch 1950–2014. Sci. Data 2017, 41, 1–9. [Google Scholar] [CrossRef] [Green Version]
- Liu, J. Integration across a metacoupled world. Ecol. Soc. 2017, 22, 29. [Google Scholar] [CrossRef]
- Crona, B.I.; Van Holt, T.; Petersson, M.; Daw, T.M.; Buchary, E. Using social-ecological syndromes to understand impacts of international seafood trade on small-scale fisheries. Glob. Environ. Chang. 2015, 35, 162–175. [Google Scholar] [CrossRef] [Green Version]
- Dreher, A.; Gaston, N.; Martens, P. Measuring Globalisation: Gauging Its Consequences; Springer: New York, NY, USA, 2008. [Google Scholar]
- Bjerknes, J. Atmospheric teleconnections from the equatorial Pacific. Mon. Weather Rev. 1969, 97, 163–172. [Google Scholar] [CrossRef]
- Liu, J.; Hull, V.; Batistella, M.; DeFries, R.; Dietz, T.; Fu, F.; Hertel, T.W.; Izaurralde, R.C.; Lambin, E.F.; Li, S.; et al. Framing sustainability in a telecoupled world. Ecol. Soc. 2013, 18, 26. [Google Scholar] [CrossRef]
- Liu, J. An integrated framework for achieving sustainable development goals around the world. Ecol. Econ. Soc. (INSEE) 2018, 1, 11–17. [Google Scholar] [CrossRef]
- Schaffer-Smith, D.; Tomscha, S.A.; Jarvis, K.J.; Maguire, D.Y.; Treglia, M.L.; Liu, J. Network analysis as a tool for quantifying the dynamics of metacoupled systems: An example using global soybean trade. Ecol. Soc. 2018, 23, 3. [Google Scholar] [CrossRef] [Green Version]
- Zhao, W.; Liu, Y.; Daryanto, S.; Fu, B.; Wang, S.; Liu, Y. Metacoupling supply and demand for soil conservation service. Curr. Opin. Env. Sust. 2018, 33, 136–141. [Google Scholar] [CrossRef]
- Herzberger, A.; Chung, M.G.; Kapsar, K.; Frank, K.A.; Liu, J. Telecoupled food trade affects pericoupled trade and intracoupled production. Sustainability 2019, 11, 2908. [Google Scholar] [CrossRef] [Green Version]
- Liu, J.; Viña, A.; Yang, W.; Li, S.; Xu, W.; Zheng, H. China’s environment on a metacoupled planet. Annu. Rev. Environ. Resour. 2018, 43, 1–34. [Google Scholar] [CrossRef]
- Wang, S.; Fu, B.; Bodin, Ö.; Liu, J.; Zhang, M.; Liu, X. Alignment of social and ecological structures increased the ability of river management. Sci. Bull. 2019, 64, 1318–1324. [Google Scholar] [CrossRef] [Green Version]
- Eriksson, H.; Österblom, H.; Crona, B.; Troell, M.; Andrew, N.; Wilen, J.; Folke, C. Contagious exploitation of marine resources. Front. Ecol. Environ. 2015, 13, 435–440. [Google Scholar] [CrossRef] [Green Version]
- Carlson, A.K.; Taylor, W.W.; Liu, J.; Orlic, I. The telecoupling framework: An integrative tool for enhancing fisheries management. Fisheries 2017, 42, 395–397. [Google Scholar] [CrossRef]
- Carlson, A.K.; Taylor, W.W.; Hughes, S.M. The metacoupling framework informs stream salmonid management and governance. Front. Environ. Sci. 2020, 8, 27. [Google Scholar] [CrossRef] [Green Version]
- Food and Agriculture Organization of the United Nations (FAO). The State of World Fisheries and Aquaculture 2018; FAO: Rome, Italy, 2018; Available online: http://www.fao.org/documents/card/en/c/I9540EN/ (accessed on 2 April 2020).
- Chuenpagdee, R.; Liguori, L.; Palomares, M.D.; Pauly, D. Bottom-up, Global Estimates of Small-Scale Marine Fisheries Catches; University of British Columbia Fisheries Centre Research Reports: Vancouver, BC, Canada, 2006; Volume 14, 112p, Available online: https://open.library.ubc.ca/cIRcle/collections/facultyresearchandpublications/52383/items/1.0074761 (accessed on 1 May 2020).
- Pauly, D.; Zeller, D.; Palomares, M.L.D. Sea Around Us. Concepts, Design and Data. 2020. Available online: http://www.seaaroundus.org/ (accessed on 2 April 2020).
- Swartz, W.; Sala, E.; Tracey, S.; Watson, R.; Pauly, D. The spatial expansion and ecological footprint of fisheries (1950 to present). PLoS ONE 2010, 5, e15143. [Google Scholar] [CrossRef] [PubMed] [Green Version]
- National Aeronautics and Space Administration (NASA). SeaWiFS. 2020. Available online: https://oceancolor.gsfc.nasa.gov/data/seawifs/ (accessed on 1 May 2020).
- Belhabib, D.; Koutob, V.; Sali, A.; Lam, V.W.Y.; Pauly, D. Fisheries catch misreporting and its implications: The case of Senegal. Fish. Res. 2014, 151, 1–11. [Google Scholar] [CrossRef]
- The World Bank. GDP (current US$). 2019. Available online: https://data.worldbank.org/indicator/NY.GDP.MKTP.CD (accessed on 2 April 2020).
- Alder, J.; Sumaila, U.R. Western Africa: A fish basket of Europe past and present. J. Environ. Dev. 2004, 13, 156–178. [Google Scholar] [CrossRef]
- Bell, C. Stable Seas Maritime Security Index. One Earth Future. 2017. Available online: https://stableseas.org/issue-areas/overview#0 (accessed on 2 April 2020).
- Le Cornu, E.; Doerr, A.N.; Finkbeiner, E.M.; Gourlie, D.; Crowder, L.B. Spatial management in small-scale fisheries: A potential approach for climate change adaptation in Pacific Islands. Mar. Policy 2018, 88, 350358. [Google Scholar] [CrossRef]
- Agnew, D.J.; Pearce, J.; Pramod, G.; Peatman, T.; Watson, R.; Beddington, J.R.; Pitcher, T.J. Estimating the worldwide extent of illegal fishing. PLoS ONE 2009, 4, e4570. [Google Scholar] [CrossRef] [PubMed] [Green Version]
- Tapia-Lewin, S.; Vergara, K.; De La Barra, C.; Godoy, N.; Castilla, J.C.; Gelcich, S. Distal impacts of aquarium trade: Exploring the emerging sandhopper (Orchestoidea tuberculata) artisanal shore gathering fishery in Chile. Ambio 2017, 46, 706–716. [Google Scholar] [CrossRef]
- Carlson, A.K.; Taylor, W.W.; Liu, J. Using the telecoupling framework to improve Great Lakes fisheries management. Aquat. Ecosyst. Health 2019, 22, 342–354. [Google Scholar] [CrossRef]
- Crona, B.I.; Daw, T.M.; Swartz, W.; Norström, A.V.; Nyström, M.; Thyresson, M.; Folke, C.; Hentati-Sundberg, J.; Österblom, H.; Deutsch, L.; et al. Masked, diluted and drowned out: How global seafood trade weakens signals from marine ecosystems. Fish Fish. 2016, 17, 1175–1182. [Google Scholar] [CrossRef]
- Fuller, E.C.; Samhouri, J.F.; Stoll, J.S.; Levin, S.A.; Watson, J.R. Characterizing fisheries connectivity in marine social-ecological systems. ICES J. Mar. Sci. 2017, 74, 2087–2096. [Google Scholar] [CrossRef] [Green Version]
- Österblom, H.; Folke, C. Globalization, marine regime shifts and the Soviet Union. Philos. Trans. R. Soc. B 2015, 370, 20130278. [Google Scholar] [CrossRef] [Green Version]
- Ramesh, N.; Rising, J.A.; Oremus, K.L. The small world of global marine fisheries: The cross-boundary consequences of larval dispersal. Science 2019, 364, 1192–1196. [Google Scholar] [CrossRef] [PubMed] [Green Version]
Figure 1.
Diagram of metacoupling. White arrows are local human–nature interactions within particular coupled human and natural systems (CHANS; Type 1, intracoupling). Black arrows are human–nature interactions between adjacent CHANS (Type 2, pericoupling) and between distant CHANS (Type 3, telecoupling). Modified from [19].

Figure 2.
Metacoupled fisheries catches in 1950–2014. Type 1 denotes industrial, artisanal, subsistence, and recreational catches and intranational flows caused by nations fishing within their own exclusive economic zones (EEZs), including territories, collectivities, etc. Type 2 represents industrial catches in and flows from adjacent EEZs. Type 3 designates industrial catches in and flows from distant (nonadjacent) EEZs.

Figure 3.
Fishing in the world’s exclusive economic zones in 1950–2014. (A) Metacouplings (total catches). (B) Type 1: Intranational catches flowing within nations. (C) Type 2: International catches flowing between adjacent nations. (D) Type 3: International catches flowing between distant nations.
Figure 3.
Fishing in the world’s exclusive economic zones in 1950–2014. (A) Metacouplings (total catches). (B) Type 1: Intranational catches flowing within nations. (C) Type 2: International catches flowing between adjacent nations. (D) Type 3: International catches flowing between distant nations.

Figure 4.
Fisheries catches and flows as a proportion of metacouplings (total catches) in the world’s exclusive economic zones in 1950–2014. (A) Type 1: Intranational (flowing within nations). (B) Type 2: International-adjacent (flowing between adjacent nations). (C) Type 3: International-distant (flowing between distant nations).

Figure 5.
Temporal trends in fishing-type predominance in the world’s exclusive economic zones (EEZs). (A) The number of EEZs that were Type-1-dominant (Type 1 catches and flows largest), Type-2-dominant, and Type-3-dominant in 1950–2014. (B) The number of EEZs with Type-1-only fishing. (C) The number of EEZs with Type-2-only and Type-3-only fishing.

© 2020 by the authors. Licensee MDPI, Basel, Switzerland. This article is an open access article distributed under the terms and conditions of the Creative Commons Attribution (CC BY) license (http://creativecommons.org/licenses/by/4.0/).
Share and Cite
MDPI and ACS Style
Carlson, A.K.; Taylor, W.W.; Rubenstein, D.I.; Levin, S.A.; Liu, J. Global Marine Fishing across Space and Time. Sustainability 2020, 12, 4714. https://doi.org/10.3390/su12114714
AMA Style
Carlson AK, Taylor WW, Rubenstein DI, Levin SA, Liu J. Global Marine Fishing across Space and Time. Sustainability. 2020; 12(11):4714. https://doi.org/10.3390/su12114714
Chicago/Turabian StyleCarlson, Andrew K., William W. Taylor, Daniel I. Rubenstein, Simon A. Levin, and Jianguo Liu. 2020. "Global Marine Fishing across Space and Time" Sustainability 12, no. 11: 4714. https://doi.org/10.3390/su12114714
Note that from the first issue of 2016, this journal uses article numbers instead of page numbers. See further details here.