Metacoupled Tourism and Wildlife Translocations Affect Synergies and Trade-Offs among Sustainable Development Goals across Spillover Systems


Abstract
:1. Introduction
2. Materials and Methods
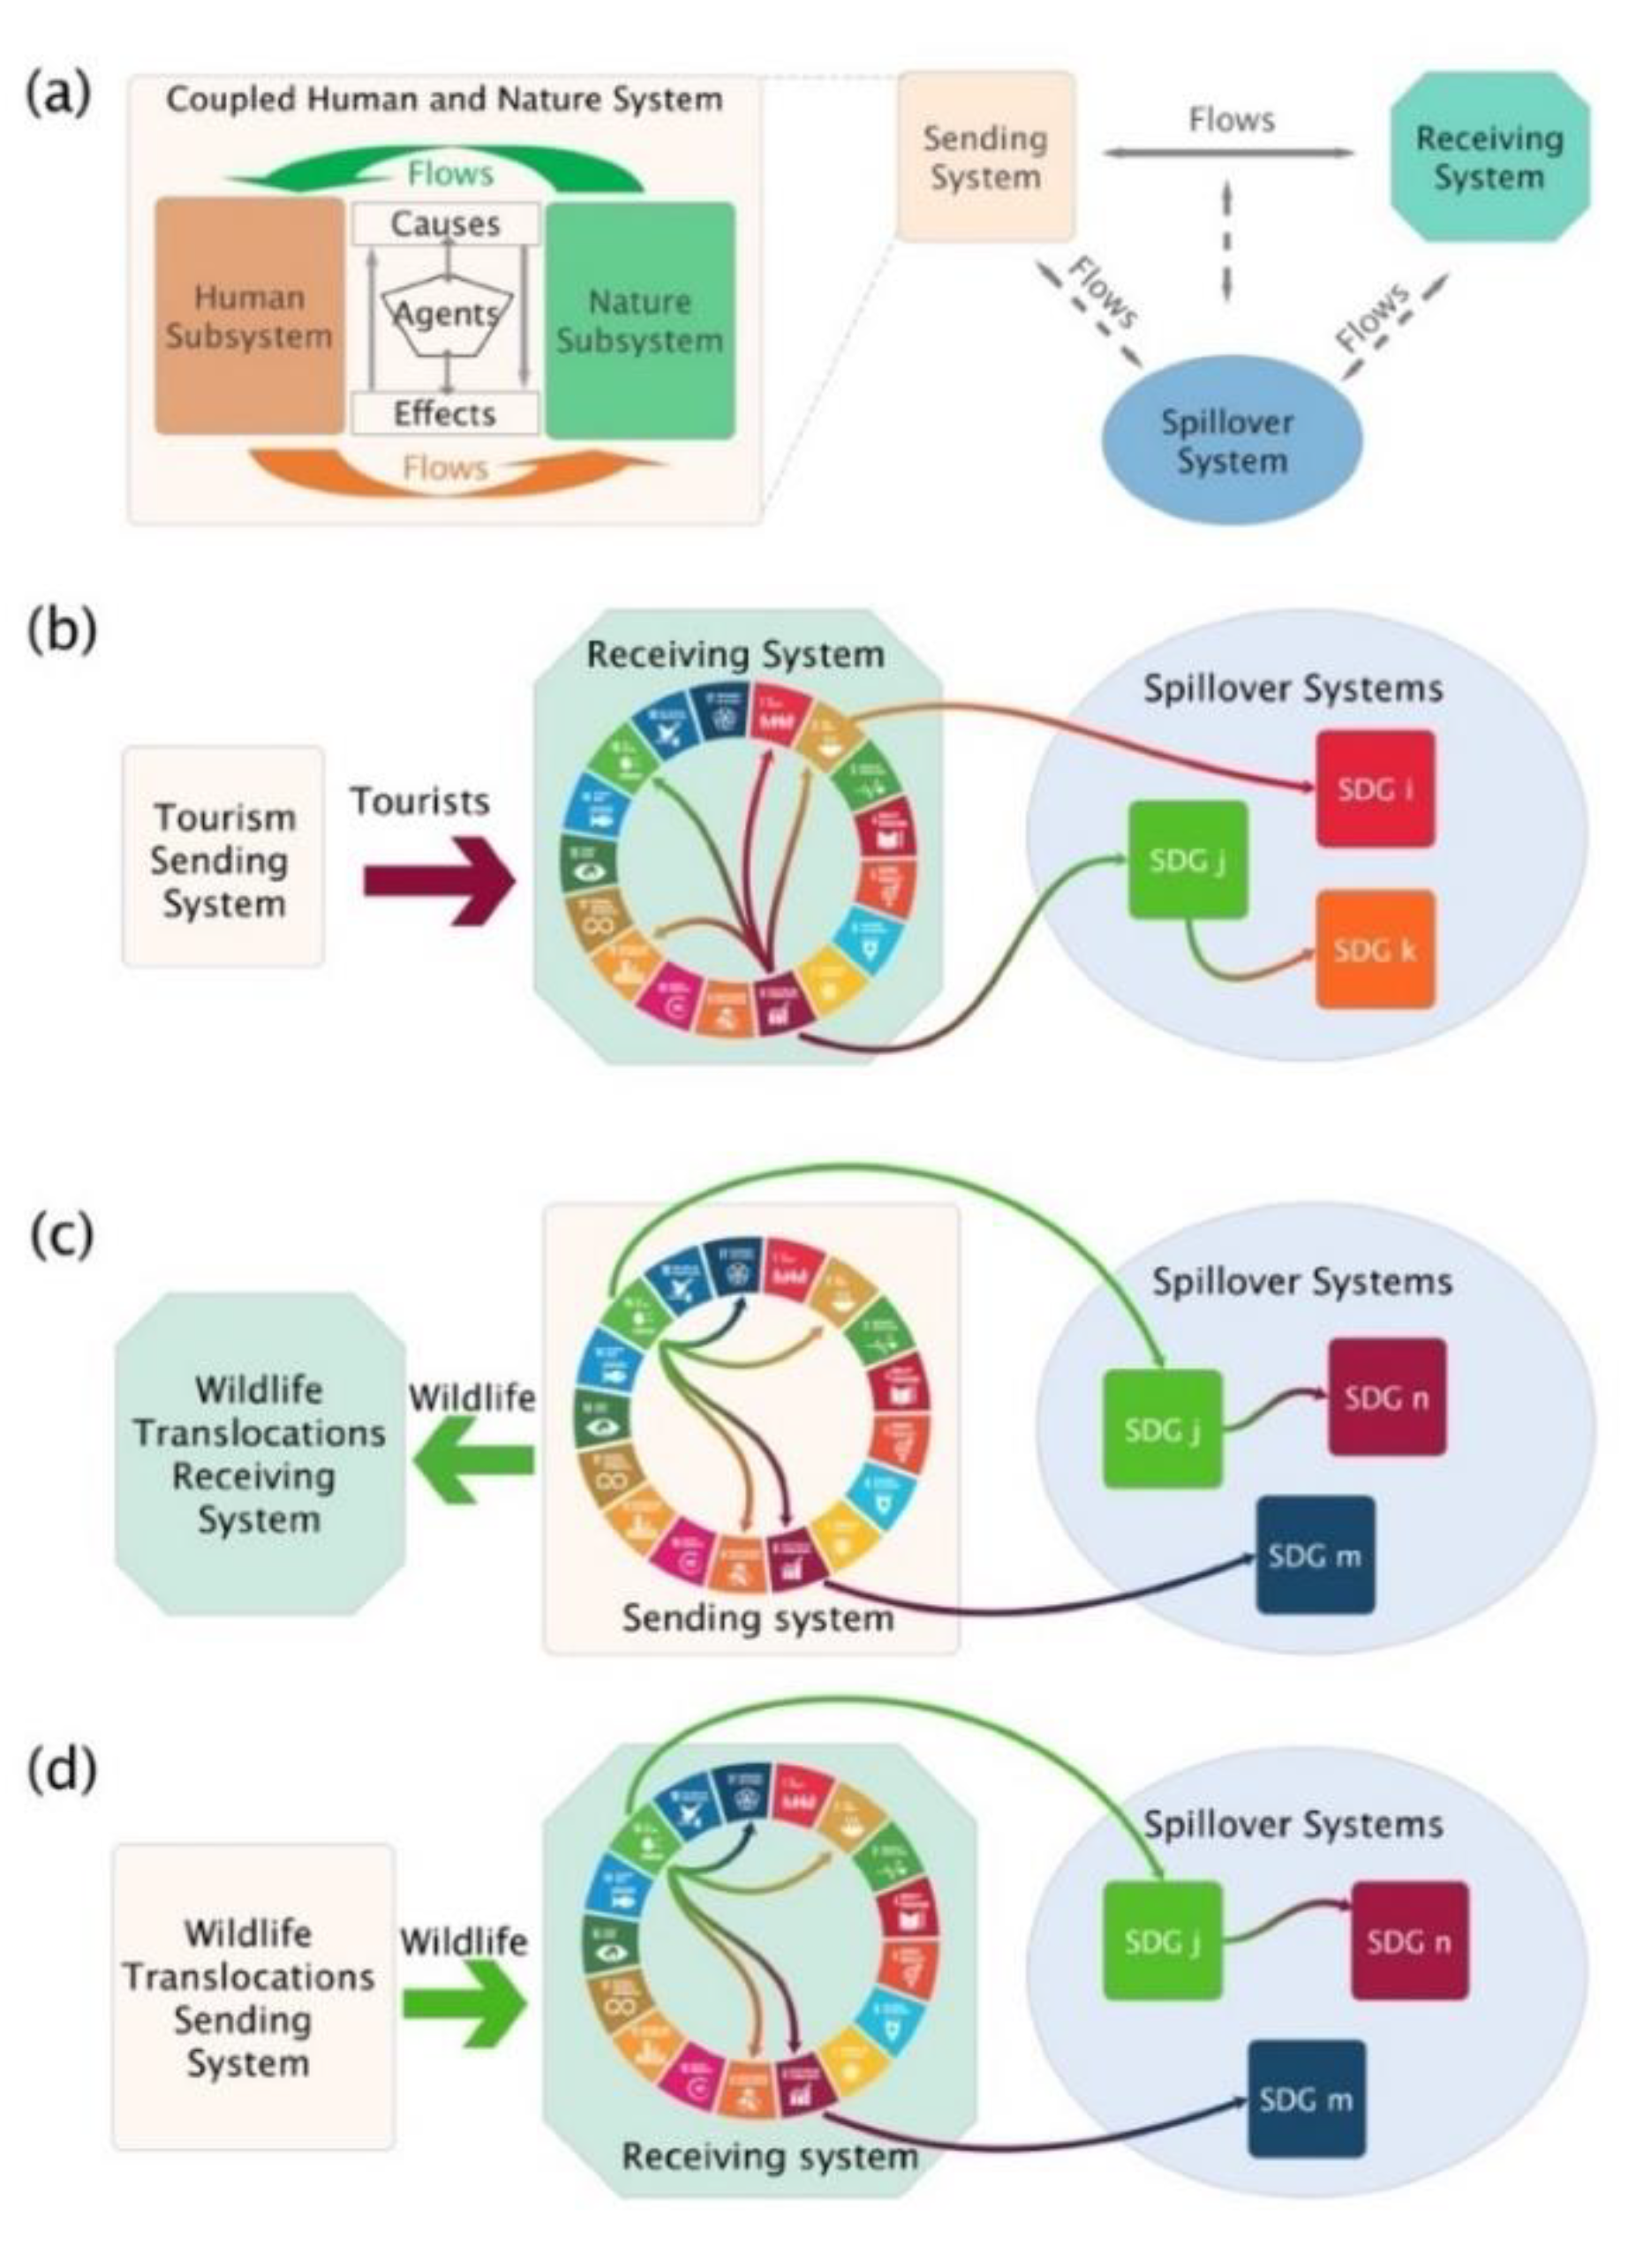
2.1. The Framework of Metacoupled Tourism and Wildlife Translocations Affect SDG Synergies and Trade-Offs across Spillover Systems
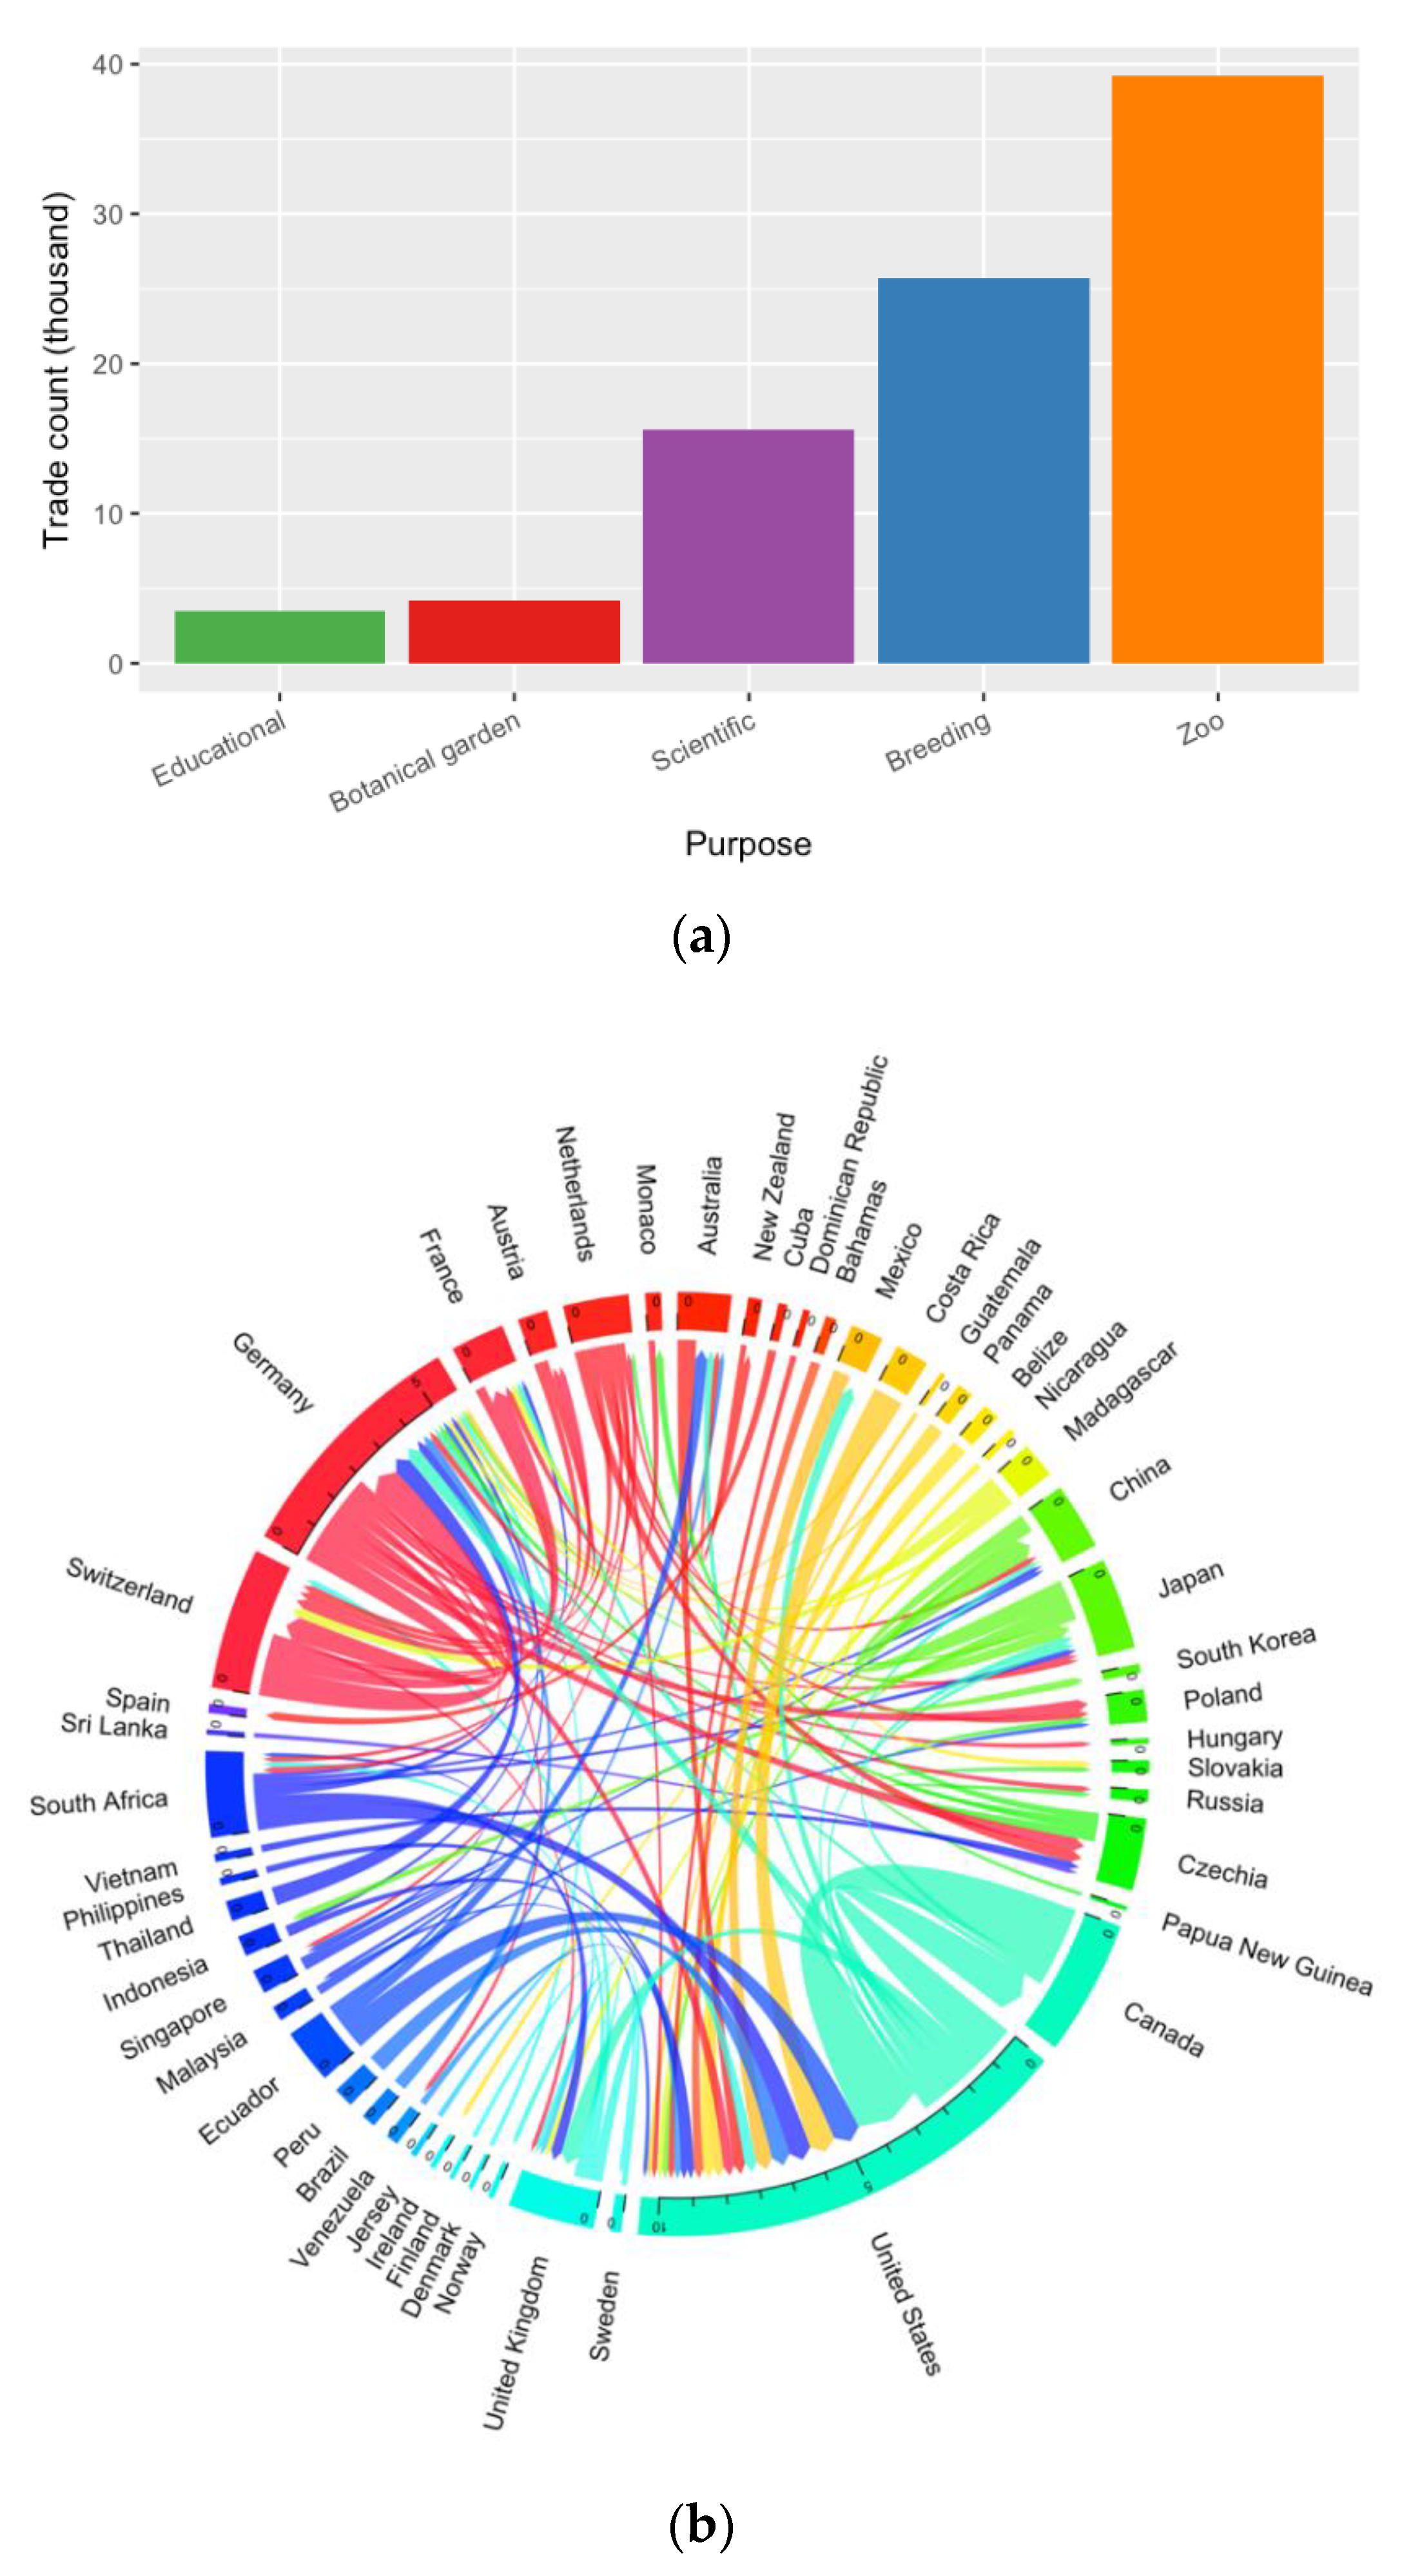
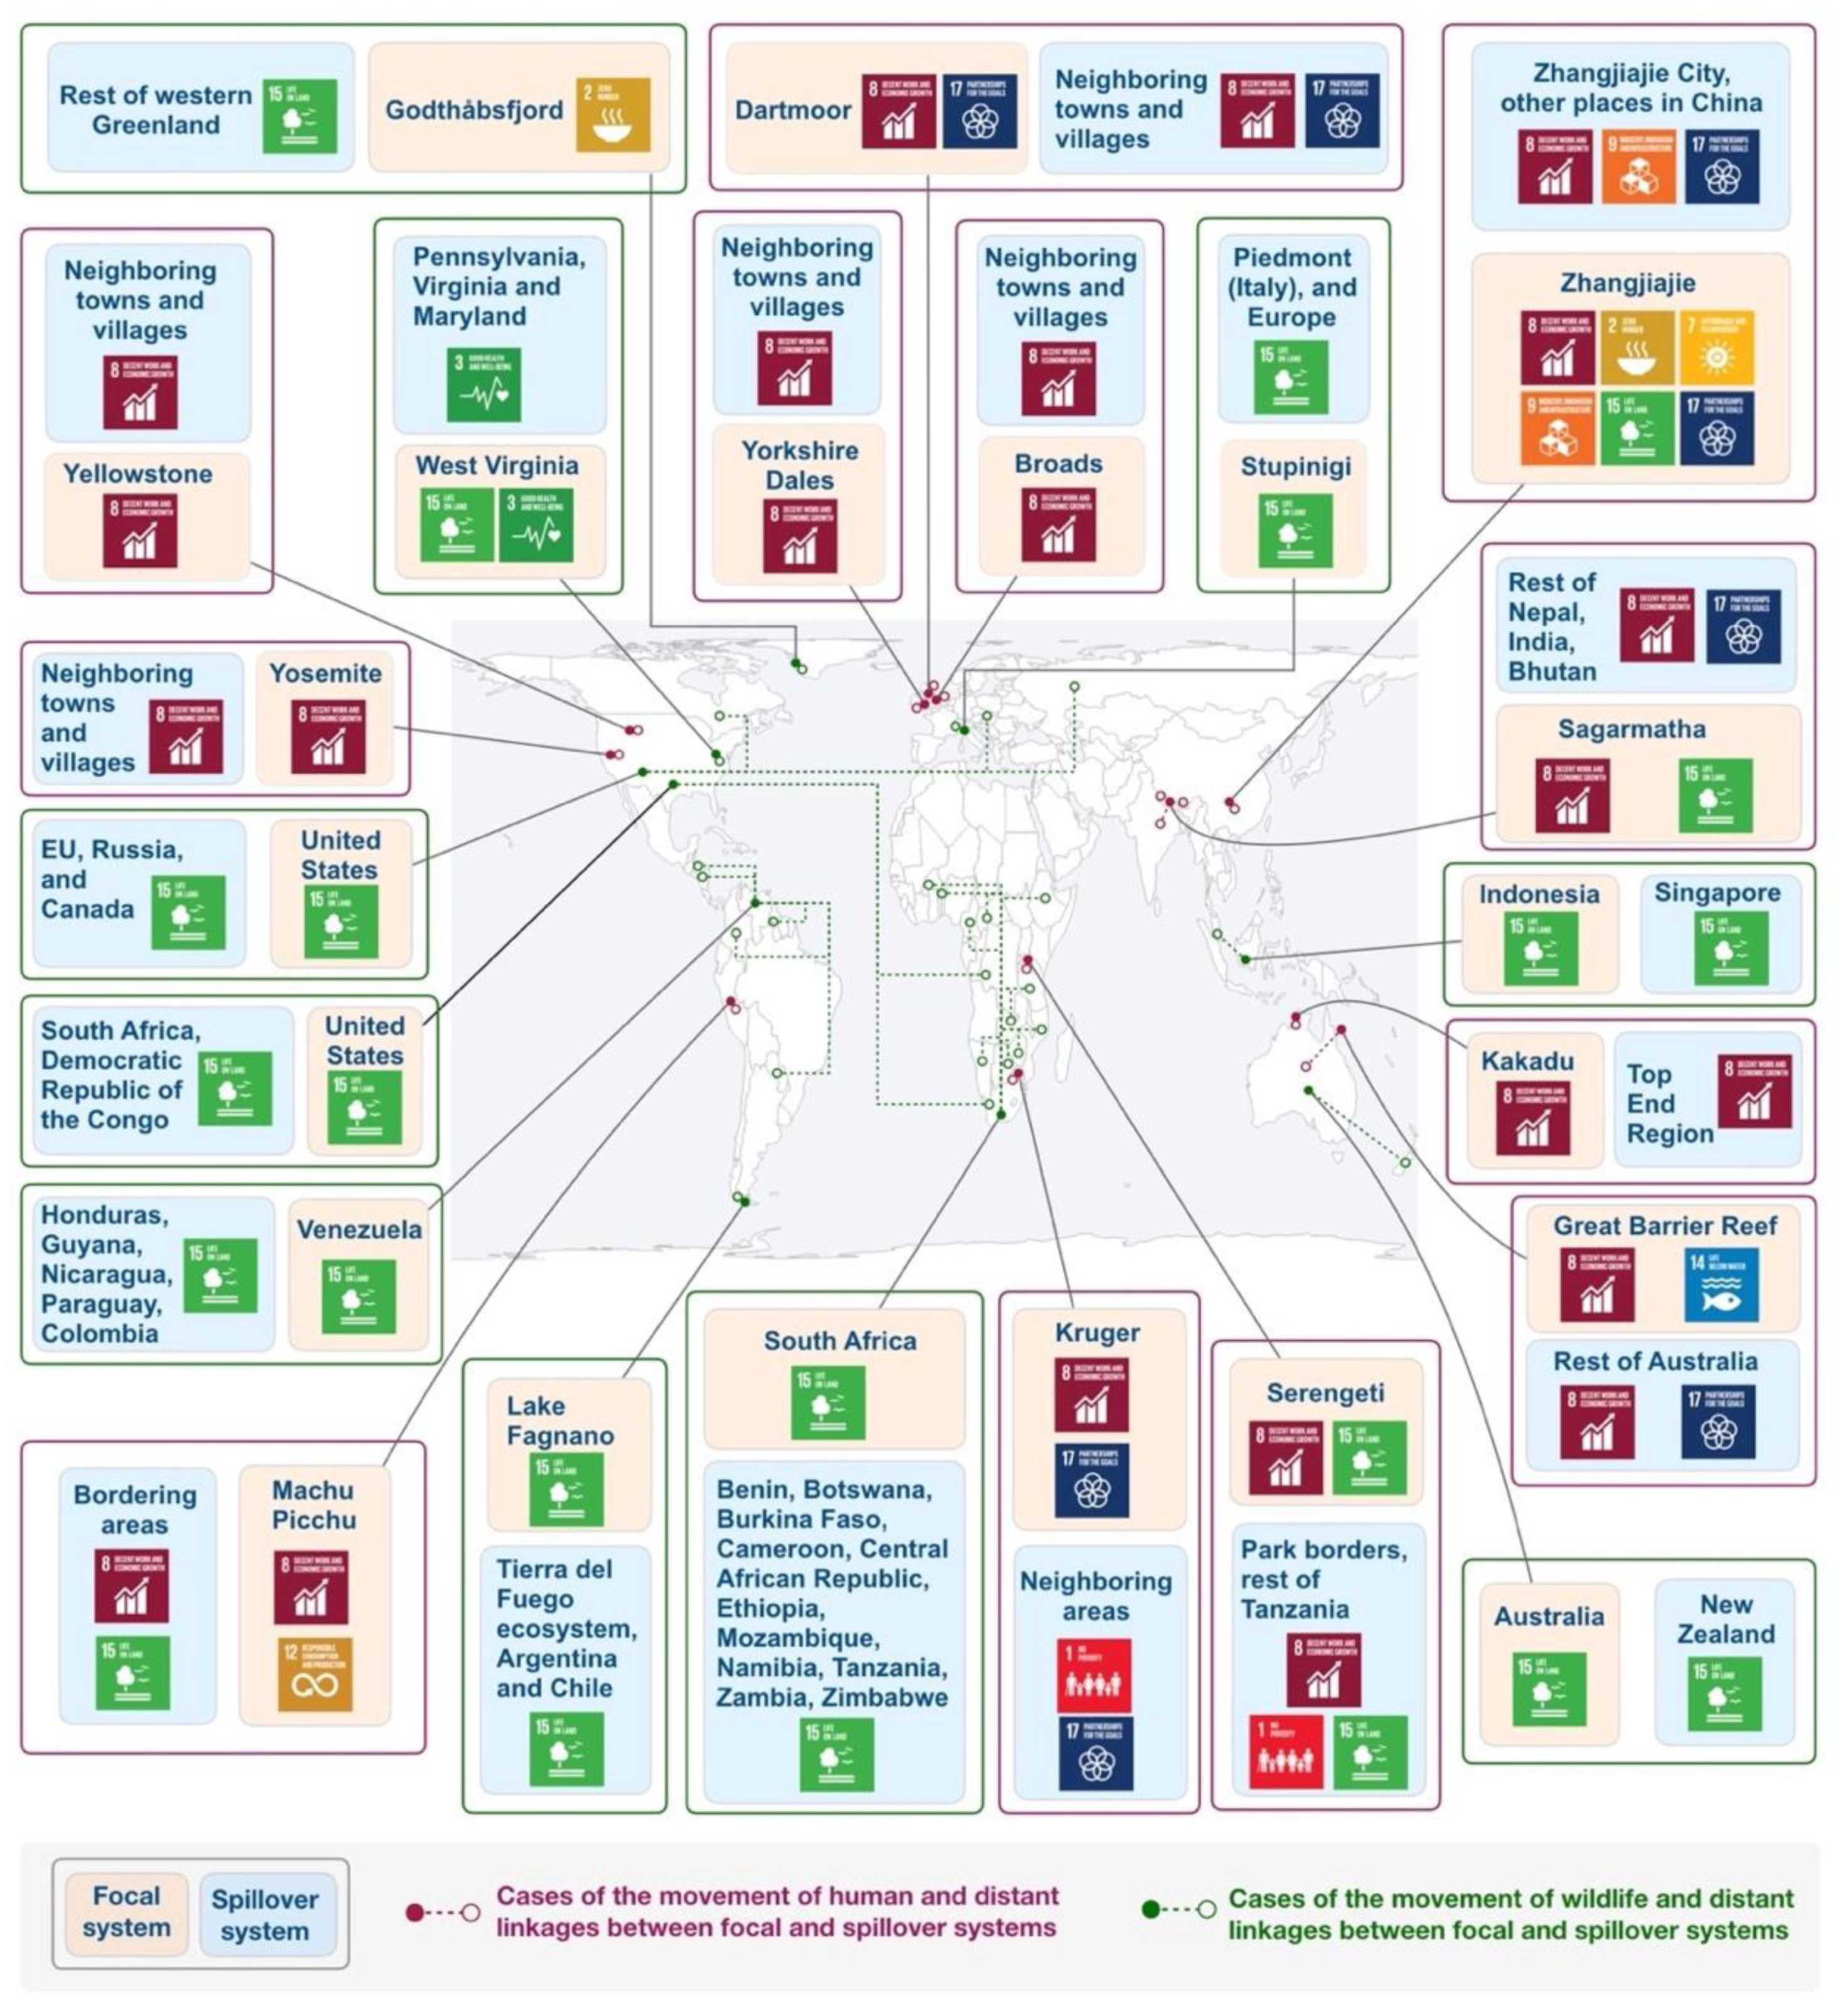
2.2. Metacoupled Tourism and Wildlife Translocation Cases
3. Results
3.1. SDG Synergies and Trade-Offs in the 12 Cases of Tourism
3.1.1. Within Focal Systems, Synergies and Trade-Offs between SDG 8 (Decent Work and Economic Growth) and Other SDGs Varied in Three Ways
3.1.2. Across Spillover Systems, Synergies and Trade-Offs between SDG 8 (Decent Work and Economic Growth) and Other SDGs Varied in Two Ways
3.1.3. Within SDG 8 (Decent Work and Economic Growth), both Synergies and Trade-Offs Existed within Focal Systems as well as across Spillover Systems
3.2. SDG Synergies and Trade-Offs in the 10 Cases of Wildlife Translocations
3.2.1. Within Focal Systems, SDG 15 (Life on Land) Synergized with SDG 1 (No Poverty) and Traded off with SDG 3 (Good Health and Well-Being)
3.2.2. Across Spillover Systems, Only Trade-Offs between SDG 15 (Life on Land) and SDGs 2 (Zero Hunger) and 3 (Good Health and Well-Being) Were Observed
3.2.3. Within SDG 15 (Life on Land), We Found Only Synergies in Focal Systems, and Both Synergies and Trade-Offs across Spillover Systems
3.2.4. One Indirect Trade-Off across Spillover Systems Was Identified in Wildlife Translocation
4. Discussion and Conclusions
Author Contributions
Funding
Acknowledgments
Conflicts of Interest
References
- United Nations, (UN). Transforming our World: The 2030 Agenda for Sustainable Development; Division for Sustainable Development Goals: New York, NY, USA, 2015. [Google Scholar]
- Nilsson, M.; Griggs, D.; Visbeck, M. Map the interactions between Sustainable Development Goals. Nature 2016, 534, 320. [Google Scholar] [CrossRef]
- Nilsson, M.; Chisholm, E.; Griggs, D.; Howden-Chapman, P.; McCollum, D.; Messerli, P.; Neumann, B.; Stevance, A.-S.; Visbeck, M.; Stafford-Smith, M. Mapping interactions between the sustainable development goals: Lessons learned and ways forward. Sustain. Sci. 2018, 13, 1489–1503. [Google Scholar] [CrossRef] [Green Version]
- Borrion, A.; Milligan, B.; Spataru, C.; Nerini, F.F.; Anandarajah, G.; Bisaga, I.; Tomei, J.; To, L.S.; Black, M.; Parikh, P.; et al. Mapping synergies and trade-offs between energy and the Sustainable Development Goals. Nat. Energy 2017, 3, 10–15. [Google Scholar] [CrossRef] [Green Version]
- Pradhan, P.; Costa, L.; Rybski, D.; Lucht, W.; Kropp, J.P. A Systematic Study of Sustainable Development Goal (SDG) Interactions. Earths Future 2017, 5, 1169–1179. [Google Scholar] [CrossRef] [Green Version]
- Zhao, Z.; Cai, M.; Wang, F.; Winkler, J.A.; Connor, T.; Chung, M.G.; Zhang, J.; Yang, H.; Xu, Z.; Tang, Y.; et al. Synergies and tradeoffs among Sustainable Development Goals across boundaries in a metacoupled world. Sci. Total Environ. 2021, 751, 141749. [Google Scholar] [CrossRef] [PubMed]
- Hutton, C.W.; Nicholls, R.J.; Lázár, A.N.; Chapman, A.; Schaafsma, M.; Salehin, M. Potential Trade-Offs between the Sustainable Development Goals in Coastal Bangladesh. Sustainability 2018, 10, 1108. [Google Scholar] [CrossRef] [Green Version]
- Mainali, B.; Luukkanen, J.; Silveira, S.; Kaivo-oja, J. Evaluating Synergies and Trade-Offs among Sustainable Development Goals (SDGs): Explorative Analyses of Development Paths in South Asia and Sub-Saharan Africa. Sustainability 2018, 10, 815. [Google Scholar] [CrossRef] [Green Version]
- Lusseau, D.; Mancini, F. Income-based variation in Sustainable Development Goal interaction networks. Nat. Sustain. 2019, 2, 242–247. [Google Scholar] [CrossRef] [Green Version]
- Maes, M.J.A.; Jones, K.E.; Toledano, M.B.; Milligan, B. Mapping synergies and trade-offs between urban ecosystems and the sustainable development goals. Environ. Sci. Policy 2019, 93, 181–188. [Google Scholar] [CrossRef]
- Elder, M.; Olsen, S.H. The Design of Environmental Priorities in the SDGs. Glob. Policy 2019, 10, 70–82. [Google Scholar] [CrossRef] [Green Version]
- Sachs, J.; Schmidt-Traub, G.; Kroll, C.; Durand-Delacre, D.; Teksoz, K. SDG Index and Dashboards Report 2017; Bertelsmann Stiftung and Sustainable Development Solutions Network (SDSN): New York, NY, USA, 2017. [Google Scholar]
- Sachs, J.; Schmidt-Traub, G.; Kroll, C.; Lafortune, G.; Fuller, G. SDG Index and Dashboards Report 2018; Bertelsmann Stiftung and Sustainable Development Solutions Network (SDSN): New York, NY, USA, 2018. [Google Scholar]
- Obersteiner, M.; Walsh, B.; Frank, S.; Havlík, P.; Cantele, M.; Liu, J.; Palazzo, A.; Herrero, M.; Lu, Y.; Mosnier, A.; et al. Assessing the land resource–food price nexus of the Sustainable Development Goals. Sci. Adv. 2016, 2, e1501499. [Google Scholar] [CrossRef] [PubMed] [Green Version]
- Engström, R.E.; Destouni, G.; Howells, M.; Ramaswamy, V.; Rogner, H.; Bazilian, M. Cross-Scale Water and Land Impacts of Local Climate and Energy Policy—A Local Swedish Analysis of Selected SDG Interactions. Sustainability 2019, 11, 1847. [Google Scholar] [CrossRef] [Green Version]
- Bennich, T.; Weitz, N.; Carlsen, H. Deciphering the scientific literature on SDG interactions: A review and reading guide. Sci. Total Environ. 2020, 728, 138405. [Google Scholar] [CrossRef]
- Xu, Z.; Li, Y.; Chau, S.N.; Dietz, T.; Li, C.; Wan, L.; Zhang, J.; Zhang, L.; Li, Y.; Chung, M.G.; et al. Impacts of international trade on global sustainable development. Nat. Sustain. 2020, 1–8. [Google Scholar] [CrossRef]
- Liu, J. An Integrated Framework for Achieving Sustainable Development Goals Around the World. Ecol. Econ. Soc. 2018, 1, 11–17. [Google Scholar] [CrossRef]
- Nesme, T.; Metson, G.S.; Bennett, E.M. Global phosphorus flows through agricultural trade. Glob. Environ. Chang. 2018, 50, 133–141. [Google Scholar] [CrossRef]
- Liu, J.; Mooney, H.; Hull, V.; Davis, S.J.; Gaskell, J.; Hertel, T.; Lubchenco, J.; Seto, K.C.; Gleick, P.; Kremen, C.; et al. Systems integration for global sustainability. Science 2015, 347, 1258832. [Google Scholar] [CrossRef] [Green Version]
- Liu, J. Integration across a metacoupled world. Ecol. Soc. 2017, 22. [Google Scholar] [CrossRef]
- Carlson, A.K.; Rubenstein, D.I.; Levin, S.A. Linking multiscalar fisheries using metacoupling models. Front. Mar. Sci. 2020, 7, 614. [Google Scholar] [CrossRef]
- Carlson, A.K.; Taylor, W.W.; Rubenstein, D.I.; Levin, S.A.; Liu, J. Global Marine Fishing across Space and Time. Sustainability 2020, 12, 4714. [Google Scholar] [CrossRef]
- Dou, Y.; Yao, G.; Herzberger, A.; da Silva, R.F.B.; Song, Q.; Hovis, C.; Batistella, M.; Moran, E.; Wu, W.; Liu, J. Land-Use Changes in Distant Places: Implementation of a Telecoupled Agent-Based Model. J. Artif. Soc. Soc. Simul. 2020, 23, 1–11. [Google Scholar] [CrossRef]
- Dou, Y.; da Silva, R.F.B.; McCord, P.; Zaehringer, J.G.; Yang, H.; Furumo, P.R.; Zhang, J.; Pizarro, J.C.; Liu, J. Understanding How Smallholders Integrated into Pericoupled and Telecoupled Systems. Sustainability 2020, 12, 1596. [Google Scholar] [CrossRef] [Green Version]
- Hull, V.; Rivera, C.J.; Wong, C. A Synthesis of Opportunities for Applying the Telecoupling Framework to Marine Protected Areas. Sustainability 2019, 11, 4450. [Google Scholar] [CrossRef] [Green Version]
- Hull, V.; Liu, J. Telecoupling: A new frontier for global sustainability. Ecol. Soc. 2018, 23. [Google Scholar] [CrossRef]
- Kapsar, K.E.; Hovis, C.L.; Bicudo da Silva, R.F.; Buchholtz, E.K.; Carlson, A.K.; Dou, Y.; Du, Y.; Furumo, P.R.; Li, Y.; Torres, A.; et al. Telecoupling Research: The First Five Years. Sustainability 2019, 11, 1033. [Google Scholar] [CrossRef] [Green Version]
- Liu, J.; Viña, A.; Yang, W.; Li, S.; Xu, W.; Zheng, H. China’s environment on a metacoupled planet. Annu. Rev. Environ. Resour. 2018, 43, 1–34. [Google Scholar] [CrossRef]
- Xu, Z.; Zhang, D.; McCord, P.; Gong, M.; Liu, J. Shift in a national virtual energy network. Appl. Energy 2019, 242, 561–569. [Google Scholar] [CrossRef]
- Zhao, W.; Liu, Y.; Daryanto, S.; Fu, B.; Wang, S.; Liu, Y. Metacoupling supply and demand for soil conservation service. Curr. Opin. Environ. Sustain. 2018, 33, 136–141. [Google Scholar] [CrossRef]
- Herzberger, A.; Chung, M.G.; Kapsar, K.; Frank, K.A.; Liu, J. Telecoupled food trade affects pericoupled trade and intracoupled production. Sustainability 2019, 11, 2908. [Google Scholar] [CrossRef] [Green Version]
- Merz, L.; Yang, D.; Hull, V. A Metacoupling Framework for Exploring Transboundary Watershed Management. Sustainability 2020, 12, 1879. [Google Scholar] [CrossRef] [Green Version]
- Liu, J.; Hull, V.; Batistella, M.; DeFries, R.; Dietz, T.; Fu, F.; Hertel, T.W.; Izaurralde, R.C.; Lambin, E.F.; Li, S.; et al. Framing Sustainability in a Telecoupled World. Ecol. Soc. 2013, 18. [Google Scholar] [CrossRef]
- Liu, J.; Dou, Y.; Batistella, M.; Challies, E.; Connor, T.; Friis, C.; Millington, J.D.; Parish, E.; Romulo, C.L.; Silva, R.F.B.; et al. Spillover systems in a telecoupled Anthropocene: Typology, methods, and governance for global sustainability. Curr. Opin. Environ. Sustain. 2018, 33, 58–69. [Google Scholar] [CrossRef] [Green Version]
- World Tourism Organization, (UNWTO). Tourism and the Sustainable Development Goals; World Tourism Organization (UNWTO): Madrid, Spain, 2015; ISBN 978-92-844-1725-4. [Google Scholar]
- Newsome, D.; Moore, S.A.; Dowling, R.K. Natural Area Tourism: Ecology, Impacts and Management; Channel View Publications: Bristol, UK, 2002. [Google Scholar]
- Balmford, A.; Beresford, J.; Green, J.; Naidoo, R.; Walpole, M.; Manica, A. A Global Perspective on Trends in Nature-Based Tourism. PLoS Biol. 2009, 7, e1000144. [Google Scholar] [CrossRef] [PubMed] [Green Version]
- Balmford, A.; Green, J.M.H.; Anderson, M.; Beresford, J.; Huang, C.; Naidoo, R.; Walpole, M.; Manica, A. Walk on the Wild Side: Estimating the Global Magnitude of Visits to Protected Areas. PLoS Biol. 2015, 13, e1002074. [Google Scholar] [CrossRef] [Green Version]
- CITES. A Guide to Using the CITES Trade Database; United Nations Environment Programme World Conservation Monitoring Centre, UNEP-WCMC: Cambridge, UK, 2013. [Google Scholar]
- Robinson, J.E.; Pablo, S. Challenges of analyzing the global trade in CITES-listed wildlife. Conserv. Biol. 2018. [Google Scholar] [CrossRef] [PubMed] [Green Version]
- Nijman, V. An overview of international wildlife trade from Southeast Asia. Biodivers. Conserv. 2010, 19, 1101–1114. [Google Scholar] [CrossRef] [Green Version]
- Borsky, S.; Hennighausen, H.; Leiter, A.; Williges, K. CITES and the Zoonotic Disease Content in International Wildlife Trade. Environ. Resour. Econ. 2020. [Google Scholar] [CrossRef]
- Zhou, P.; Yang, X.-L.; Wang, X.-G.; Hu, B.; Zhang, L.; Zhang, W.; Si, H.-R.; Zhu, Y.; Li, B.; Huang, C.-L.; et al. A pneumonia outbreak associated with a new coronavirus of probable bat origin. Nature 2020, 579, 270–273. [Google Scholar] [CrossRef] [Green Version]
- WHO. Coronavirus Disease (COVID-19)—World Health Organization. Available online: https://www.who.int/emergencies/diseases/novel-coronavirus-2019 (accessed on 24 August 2020).
- IAEG-SDGs, (UN). SDG Indicators—Official List of SDG Indicators: Report of the Inter-Agency and Expert Group on Sustainable Development Goal Indicators (E/CN.3/2016/2/Rev.1); Division for Sustainable Development Goals: New York, NY, USA, 2016. [Google Scholar]
- Silcock, P.; Rayment, M.; Kieboom, E.; White, A.; Brunyee, J. Valuing England’s National Parks: Final Report for National Parks England; National Parks England: London, UK, 2013. [Google Scholar]
- Huybers, T.; Bennett, J. Inter-firm cooperation at nature-based tourism destinations. J. Socio-Econ. 2003, 32, 571–587. [Google Scholar] [CrossRef]
- Great Barrier Reef Marine Park Authority. Great Barrier Reef Outlook Report 2014; GBRMPA: Townsville, QLD, Australia, 2014; ISBN 978-1-922126-52-8. [Google Scholar]
- Tremblay, P. Economic Contribution of Kakadu National Park to Tourism in the Northern Territory; Sustainable Tourism CRC Darwin: Darwin, Australia, 2007. [Google Scholar]
- Kakadu National Park Board of Management; Australia Government Director of National Parks. Kakadu National Park: Management Plan 2016–2026: A Living Cultural Landscape; Director of National Parks: Parkes ACT, Australia, 2016; ISBN 978-0-9807460-7-5. [Google Scholar]
- Zhong, L.; Deng, J.; Xiang, B. Tourism development and the tourism area life-cycle model: A case study of Zhangjiajie National Forest Park, China. Tour. Manag. 2008, 29, 841–856. [Google Scholar] [CrossRef]
- Spenceley, A.; Goodwin, H. Nature-Based Tourism and Poverty Alleviation: Impacts of Private Sector and Parastatal Enterprises in and around Kruger National Park, South Africa. Curr. Issues Tour. 2007, 10, 255–277. [Google Scholar] [CrossRef]
- Strickland-Munro, J.K.; Moore, S.A.; Freitag-Ronaldson, S. The impacts of tourism on two communities adjacent to the Kruger National Park, South Africa. Dev. South. Afr. 2010, 27, 663–678. [Google Scholar] [CrossRef]
- Bruner, A.; Kessy, B.; Mnaya, J.; Wakibara, J.; Maldonado, J. Tourists’ Willingness to Pay to Visit Tanzania’s National Parks: A Contingent Valuation Study; Conservation Strategy Fund: Washington, DC, USA, 2015. [Google Scholar]
- Kideghesho, J.R. Who pays for wildlife conservation in Tanzania and who benefits? In Proceedings of the 12th Biennal Conference of the International Association of the Study of the Commons, Cheltenham, UK, 14–18 July 2008; pp. 1–24. [Google Scholar]
- Kaltenborn, B.P.; Nyahongo, J.W.; Kidegesho, J.R.; Haaland, H. Serengeti National Park and its neighbours–Do they interact? J. Nat. Conserv. 2008, 16, 96–108. [Google Scholar] [CrossRef]
- Baral, N.; Kaul, S.; Heinen, J.T.; Ale, S.B. Estimating the value of the World Heritage Site designation: A case study from Sagarmatha (Mount Everest) National Park, Nepal. J. Sustain. Tour. 2017, 25, 1776–1791. [Google Scholar] [CrossRef]
- Larson, L.R.; Poudyal, N.C. Developing sustainable tourism through adaptive resource management: A case study of Machu Picchu, Peru. J. Sustain. Tour. 2012, 20, 917–938. [Google Scholar] [CrossRef]
- Barros, A.; Monz, C.; Pickering, C. Is tourism damaging ecosystems in the Andes? Current knowledge and an agenda for future research. Ambio 2015, 44, 82–98. [Google Scholar] [CrossRef]
- Cook, P.S. Impacts of Visitor Spending on the Local Economy: Yellowstone National Park, 2011; National Park Service: Fort Collins, CO, USA, 2013. [Google Scholar]
- Cook, P.S. Impacts of Visitor Spending on the Local Economy: Yosemite National Park, 2009; National Park Service: Fort Collins, CO, USA, 2011. [Google Scholar]
- CITES. Evaluation of the Review of Significant Trade 2012; CITES: Geneva, Switzerland, 2012. [Google Scholar]
- Martin, R.O. Grey areas: Temporal and geographical dynamics of international trade of Grey and Timneh Parrots (Psittacus erithacus and P. timneh) under CITES. Emu-Austral Ornithol. 2018, 118, 113–125. [Google Scholar] [CrossRef]
- Weber, D.S.; Mandler, T.; Dyck, M.; Van Coeverden De Groot, P.J.; Lee, D.S.; Clark, D.A. Unexpected and undesired conservation outcomes of wildlife trade bans—An emerging problem for stakeholders? Glob. Ecol. Conserv. 2015, 3, 389–400. [Google Scholar] [CrossRef] [Green Version]
- Woodford, M.H.; Rossiter, P.B. Disease risks associated with wildlife translocation projects. Rev. Sci. Tech. Int. Off. Epizoot. 1993, 12, 115–135. [Google Scholar] [CrossRef]
- Cuyler, C. Success and failure of reindeer herding in Greenland. Rangifer 1999, 19, 81. [Google Scholar] [CrossRef]
- Bertolino, S.; Genovesi, P. The application of the European strategy on invasive alien species: An example with introduced squirrels. Hystrix 2005, 16. [Google Scholar] [CrossRef]
- Bertolino, S.; di Montezemolo, N.C.; Preatoni, D.G.; Wauters, L.A.; Martinoli, A. A grey future for Europe: Sciurus carolinensis is replacing native red squirrels in Italy. Biol. Invasions 2014, 16, 53–62. [Google Scholar] [CrossRef]
- Choi, C. Tierra del Fuego: The beavers must die. Nature 2008, 453, 968. [Google Scholar] [CrossRef] [PubMed]
- Holden, J. (Ed.) Trade in Cites-Listed Birds to and from New Zealand; TRAFFIC Oceania: Sydney, Australia, 1997; ISBN 0-9587008-1-8. [Google Scholar]
- Wyatt, T. A comparative analysis of wildlife trafficking in Australia, New Zealand and the United Kingdom. J. Traffick. Organ. Crime Secur. 2016, 2, 62–81. [Google Scholar]
- Vall-llosera, M.; Cassey, P. ‘Do you come from a land down under?’ Characteristics of the international trade in Australian endemic parrots. Biol. Conserv. 2017, 207, 38–46. [Google Scholar] [CrossRef]
- Velasco, Á.; Colomine, G.; De Sola, R.; Villarroel, G. Effects of sustained harvests on wild populations of caiman crocodilus crocodilus in venezuela. Interciencia 2003, 28, 544–548. [Google Scholar]
- Thorbjarnarson, J. Crocodile Tears and Skins: International Trade, Economic Constraints, and Limits to the Sustainable Use of Crocodilians. Conserv. Biol. 1999, 13, 465–470. [Google Scholar] [CrossRef]
- Thorbjarnarson, J.; Velasco, A. Economic Incentives for Management of Venezuelan Caiman. Conserv. Biol. 1999, 13, 397–406. [Google Scholar] [CrossRef]
- Hutton, J.; Webb, G. Legal trade snaps back: Using the experience of crocodilians to draw lessons on regulation of the wildlife trade. In Crocodiles, Proceedings of the 16th Working Meeting of the CSG-IUCN-The World Conservation Union, Gainesville, Florida, 7–10 October 2002; IUCN: Gland, Switzerland, 2002; pp. 1–5. [Google Scholar]
- Oldfield, S. (Ed.) The Trade in Wildlife: Regulation for Conservation; Earthscan: London, UK, 2003; ISBN 978-1-84977-393-5. [Google Scholar]
- Lindsey, P.; Alexander, R.; Balme, G.; Midlane, N.; Craig, J. Possible relationships between the South African captive-bred lion hunting industry and the hunting and conservation of lions elsewhere in Africa. Afr. J. Wildl. Res. 2012, 42, 11–22. [Google Scholar] [CrossRef] [Green Version]
- Lindsey, P.A.; Balme, G.A.; Funston, P.; Henschel, P.; Hunter, L.; Madzikanda, H.; Midlane, N.; Nyirenda, V. The Trophy Hunting of African Lions: Scale, Current Management Practices and Factors Undermining Sustainability. PLoS ONE 2013, 8, e73808. [Google Scholar] [CrossRef] [PubMed] [Green Version]
- Schirpke, U.; Tappeiner, U.; Tasser, E. A transnational perspective of global and regional ecosystem service flows from and to mountain regions. Sci. Rep. 2019, 9, 1–11. [Google Scholar] [CrossRef] [Green Version]
- Chung, M.G.; Pan, T.; Zou, X.; Liu, J. Complex Interrelationships between Ecosystem Services Supply and Tourism Demand: General Framework and Evidence from the Origin of Three Asian Rivers. Sustainability 2018, 10, 4576. [Google Scholar] [CrossRef] [Green Version]
- Hulina, J.; Bocetti, C.; Iii, H.C.; Hull, V.; Yang, W.; Liu, J. Telecoupling framework for research on migratory species in the Anthropocene. Elem. Sci. Anthr. 2017, 5. [Google Scholar] [CrossRef] [Green Version]
- Liu, J.; Hull, V.; Luo, J.; Yang, W.; Liu, W.; Viña, A.; Vogt, C.; Xu, Z.; Yang, H.; Zhang, J.; et al. Multiple telecouplings and their complex interrelationships. Ecol. Soc. 2015, 20. [Google Scholar] [CrossRef] [Green Version]
- Sun, J.; Mooney, H.; Wu, W.; Tang, H.; Tong, Y.; Xu, Z.; Huang, B.; Cheng, Y.; Yang, X.; Wei, D.; et al. Importing food damages domestic environment: Evidence from global soybean trade. Proc. Natl. Acad. Sci. USA 2018, 115, 5415–5419. [Google Scholar] [CrossRef] [Green Version]
- Luo, Q.; Song, Y.; Hu, X.; Zhu, S.; Wang, H.; Ji, H. Effects of tourism disturbance on habitat quality and population size of the Chinese giant salamander (Andrias davidianus). Wildl. Res. 2018, 45, 411–420. [Google Scholar] [CrossRef]
- Lenzen, M.; Sun, Y.-Y.; Faturay, F.; Ting, Y.-P.; Geschke, A.; Malik, A. The carbon footprint of global tourism. Nat. Clim. Chang. 2018, 8, 522–528. [Google Scholar] [CrossRef]
- Sejvar, J.J.; Chowdary, Y.; Schomogyi, M.; Stevens, J.; Patel, J.; Karem, K.; Fischer, M.; Kuehnert, M.J.; Zaki, S.R.; Paddock, C.D.; et al. Human Monkeypox Infection: A Family Cluster in the Midwestern United States. J. Infect. Dis. 2004, 190, 1833–1840. [Google Scholar] [CrossRef]
- CDC. 2003 United States Outbreak of Monkeypox; CDC: Atlanta, GA, USA, 2018. [Google Scholar]
- Daszak, P.; Olival, K.J.; Li, H. A strategy to prevent future epidemics similar to the 2019-nCoV outbreak. Biosaf. Health 2020, 2, 6–8. [Google Scholar] [CrossRef] [PubMed]
- Moseley, W.G.; Battersby, J. The Vulnerability and Resilience of African Food Systems, Food Security, and Nutrition in the Context of the COVID-19 Pandemic. Afr. Stud. Rev. 2020, 1–13. [Google Scholar] [CrossRef]
- Patel, J.A.; Nielsen, F.B.H.; Badiani, A.A.; Assi, S.; Unadkat, V.A.; Patel, B.; Ravindrane, R.; Wardle, H. Poverty, inequality and COVID-19: The forgotten vulnerable. Public Health 2020, 183, 110–111. [Google Scholar] [CrossRef] [PubMed]
- United Nations (UN). Policy Brief: The Impact of COVID-19 on Food Security and Nutrition; UN Sustainable Development Group: New York, NY, USA, 2020. [Google Scholar]
- Azcona, G.; Bhatt, A.; Davies, S.E.; Harman, S.; Smith, J.; Wenham, C. Spotlight on Gender, COVID-19 and the SDGs: Will the Pandemic Derail Hard-Won Progress on Gender Equality? UN Women: New York, NY, USA, 2020. [Google Scholar]
- Lo, K. COVID-19 and Sustainable Energy Development: Agendas for Future Research. J. Asian Energy Stud. 2020, 4, 20–25. [Google Scholar] [CrossRef]
- Gaffney, C.; Eeckels, B. Covid-19 and Tourism Risk in the Americas. J. Lat. Am. Geogr. 2020, 19, 308–313. [Google Scholar] [CrossRef]
- Yeh, S.-S. Tourism recovery strategy against COVID-19 pandemic. Tour. Recreat. Res. 2020, 1–7. [Google Scholar] [CrossRef]
- Bhuiyan, M.A.H.; Hassan, S.; Darda, M.A.; Habib, M.W. Aspects of Sustainable Tourism Development and COVID-19 Pandemic. Preprints 2020, 2020080418. [Google Scholar]
- Norouzi, N.; Zarazua de Rubens, G.; Choupanpiesheh, S.; Enevoldsen, P. When pandemics impact economies and climate change: Exploring the impacts of COVID-19 on oil and electricity demand in China. Energy Res. Soc. Sci. 2020, 68, 101654. [Google Scholar] [CrossRef]
- Lokhandwala, S.; Gautam, P. Indirect impact of COVID-19 on environment: A brief study in Indian context. Environ. Res. 2020, 188, 109807. [Google Scholar] [CrossRef]
- He, G.; Pan, Y.; Tanaka, T. The short-term impacts of COVID-19 lockdown on urban air pollution in China. Nat. Sustain. 2020, 1–7. [Google Scholar] [CrossRef]
- Berman, J.D.; Ebisu, K. Changes in U.S. air pollution during the COVID-19 pandemic. Sci. Total Environ. 2020, 739, 139864. [Google Scholar] [CrossRef] [PubMed]
- Mupatsi, N. Observed and Potential Environmental Impacts of COVID-19 in Africa. Preprints 2020. [Google Scholar] [CrossRef]


| Country | Focal System and SDGs (Targets/Indicators) | Spillover System and SDGs (Targets/Indicators) | SDG Synergy and Trade-Off | Source |
|---|---|---|---|---|
| United Kingdom | The Broads National Park SDG 8 8.9 More than 6.9 million visitors each year 8.9.1 Annual visitor expenditure of £345 million 8.9.2 4420 jobs supported by visitor expenditures | Neighboring towns and villages SDG 8 8.9.1 Visitor expenditures influence £124 million within a wider “area of influence” 8.9.2 1937 jobs supported by visitor expenditures | One linkage within individual SDG across places. SDG 8 in the spillover systems synergized with SDG 8 in the focal system. | [47] |
| United Kingdom | Yorkshire Dales National Park SDG 8 8.9 More than 3.5 million visitors each year 8.9.1 Annual visitor expenditure of £199 million 8.9.2 3790 jobs supported by visitor expenditures | Neighboring towns and villages SDG 8 8.9 Visitor expenditures influence £327 million within a wider “area of influence” 8.9.1 5564 jobs supported by visitor expenditures | One linkage within individual SDG across places. SDG 8 in the spillover systems synergized with SDG 8 in the focal system. | [47] |
| United Kingdom | Dartmoor National Park SDG 8 8.9 2.3 million visitors each year 8.9.1 Annual visitor expenditure of £119 million 8.9.2 2172 jobs supported by visitor expenditures SDG 17 17.17 The Dartmoor Partnership, with more than 450 members | Neighboring towns and villages SDG 8 8.9.1 Visitor expenditures influence £38 million within a wider “area of influence” 8.9.2 942 jobs supported by visitor expenditures 8.9 The Dartmoor Partnership promotes local produce SDG 17 17.17 The Dartmoor Partnership, with more than 450 members | One linkage between different SDGs within one place. Within the focal system, SDG 17 synergized with SDG 8. One linkage within individual SDG across places. SDG 8 in the spillover systems synergized with SDG 8 in the focal system. One linkage between different SDGs across places. SDG 17 in the spillover systems synergized with SDG 8 in the focal system. | [47] |
| Australia | Great Barrier Reef Marine Park SDG 8 8.9 2,680,000 visitors each year 8.9.1 Contribution of approximately $480 million related expenditure 8.9.2 Supports 4800 full-time jobs SDG 14 14.2 $8 million visitor expenditure each year directly to the management of the Great Barrier Reef 14.1 Water quality decreased due to the tourism | Rest of Australia SDG 8 8.1 Contributes almost $5.2 billion (value-added) to Australia’s economy 8.3 Supports about 69,000 full-time jobs SDG 17 17.17 Tourism Tropical North Queensland, an Inter-firm organization, for joint destination promotion between the Great Barrier Reef and nearby areas (e.g., Cod Hole and Michaelmas Cay) | One linkage between different SDGs within one place. Within the focal system, SDG 14 synergized with SDG 8. One linkage within individual SDG across places. SDG 8 in the spillover systems synergized with SDG 8 in the focal system. One linkage between different SDGs across places. SDG 17 in the spillover systems synergized with SDG 8 in the focal system. | [48,49] |
| Australia | Kakadu National Park SDG 8 8.9 210,000 visitors each year | The Top End region SDG 8 8.9.1 Contributes approximately $15 million to the economy of the top end region each year | One linkage within individual SDG across places. SDG 8 in the spillover systems synergized with SDG 8 in the focal system. | [50,51] |
| China | Zhangjiajie National Forest Park SDG 8 8.9 Annual visits increased from 29,333 in early 1980s to 1,124,947 in 2000s 8.9.2 Non-agriculture population increased from 15.9% in 1982 to 75.3% in 2005 8.4.1 Coal consumption increased from 70 t in 1981 to 1200 t in 1985, and jumped to 6100 t in 1998 SDG 2 2.3.2 Average annual individual income increased from 193 RMB in 1981 to 4000 RMB in 2002; average tourism-related income (RMB 15,788) accounted for 60.8% of average total family income (25,958 RMB) in 2004 SDG 9 9.1 Road and other facilities in the park were improved due to tourism development SDG 15 15.5 Landscape fragmented; air quality and groundwater quality deteriorated; biodiversity decreased SDG 17 17.3.1 Foreign direct investments were used to build hotels and other tourism-related facilities 17.16 The park and two adjacent nature reserves (Tianzishan and Suoxiyu) were jointly listed as a World Natural Heritage site by the UNESCO in 1992 | Zhangjiajie City and other places in China SDG 8 8.9.1 Zhangjiajie City’s tourism-related industry accounted for 54.4% of the city’s GDP (2005); the city’s tax revenues from tourism and related sectors increased from 20% in the early 1990s to 59% in 2002 8.9.2 More than 2000 people migrated from the rest of the country to the park seeking better jobs and higher incomes from 1982 to 2005 SDG 9 9.1 Zhangjiajie airport opened for commercial use in 1994; A highway connecting Zhangjiajie to a major city of Changde, 137 km to the east, was completed in 2005 SDG 17 17.16 The first international cooperation agreement between Zhangjiajie City and travel agencies of the former Soviet Union was signed in 1989 due to tourism in the park | One linkage within individual SDG in one place. Within SDG 8 in Zhangjiajie National Forest Park, SDG target 8.4 traded off with target 8.9. Four linkages (three synergies and one trade-off) between different SDGs within one place. Within the focal system, SDGs 2, 9, and 17 synergized with SDG 8, while 15 traded off with SDG 8. One linkage within individual SDG across places. SDG 8 in the spillover systems synergized with SDG 8 in the focal system. Two linkages between different SDGs across places. SDGs 9 and 17 in the spillover systems synergized with SDG 8 in the focal system. | [52] |
| South Africa | Kruger National Park SDG 8 8.9 1.3 million visitors per year SDG 17 17.17 Partnerships with parastatal-owned enterprises (e.g., Pretoriuskop Rest Camp) to promote sustainable tourism | Neighboring communities SDG 1 1.1 4.1% of the local population were lifted above the absolute poverty line of $1 per day SDG 17 17.17 Partnerships with private sector enterprises (e.g., Ngala Private Game Reserve, Jackalberry Lodge, and Sabi Sabi Private Game Reserve) to promote sustainable tourism | One linkage between different SDGs within one place. Within the focal system, SDG 17 synergized with SDG 8. Two linkages between different SDGs across places. SDGs 1 and 17 in the spillover systems are synergized with SDG 8 in the focal system. | [53,54] |
| Tanzania | Serengeti National Park SDG 8 8.9 350,000 visitors per year SDG 15 15.2 Tourism fees are the only source of revenue for the management of Serengeti National Park | Neighboring communities, rest of Tanzania SDG 8 8.1 Spillover visitation from the park helps drive approximately 1,000,000 tourism- and travel-related jobs throughout Tanzania SDG 1 1.1 Local communities outside the park face exacerbated poverty due to limited tourism benefits and land availability and increased wildlife conflict SDG 15 15.2 Excess tourism revenue used to manage 11 additional less-visited national parks in Tanzania | One linkage between different SDGs within one place. Within the focal system, SDG 15 synergized with SDG 8. One linkage within individual SDG across places. SDG 8 in the spillover systems synergized with SDG 8 in the focal system. Two linkages between different SDGs across places. SDGs 1 and 15 in the spillover systems are synergized with SDG 8 in the focal system. | [55,56,57] |
| Nepal | Sagarmatha National Park SDG 8 8.9 Receives 35,000 visitors per year 8.9.2 Tourism is a major source of income for 3500 Sherpas living in the park SDG 15 15.2 Revenue from tourism funds management of the park | Rest of Nepal, India, Bhutan SDG 8 8.9 80% tourists to Sagarmatha national park travel to Nepal because of the park SDG 17 17.17 WWF-supported partnership and coordination for the conservation and promotion of ecotourism within the “Sacred Himalayan Landscape” across Nepal, India, and Bhutan | One linkage between different SDGs within one place. Within the focal system, SDG 15 synergized with SDG 8. One linkage within individual SDG across places. SDG 8 in the spillover systems synergized with SDG 8 in the focal system. One linkage between different SDGs across places. SDG 17 in the spillover systems synergized with SDG 8 in the focal system. | [58] |
| Peru | Machu Picchu SDG 8 8.9 Receives over 900,000 visitors per year SDG 12 SDG 12.b Large tourism volumes have resulted in limited access for indigenous peoples and degradation of the site. Tourists have now been limited to 2500 a day to address these issues | Bordering area, Inca Trail, Peru SDG 8 8.9 Approximately 70,000 tourists to Macchu Picchu per year combine the trip with a hike on the Inca Trail 8.9.1 Tourism entrance fees contribute about $20 million annually to the Peruvian government SDG 15 15.5 Large numbers of tourists had negative ecological effects in the surrounding area, including the loss in plant diversity and wildlife avoidance. Tourists hiking the Inca Trail have now been limited to 500 a day to address these issues. | One linkage between different SDGs within one place. Within the focal system, SDG 12 synergized with SDG 8. One linkage within individual SDG across places. SDG 8 in the spillover systems synergized with SDG 8 in the focal system. One linkage between different SDGs across places. SDG 15 in the spillover systems traded off with SDG 8 in the focal system. | [59,60] |
| United States | Yellowstone National Park SDG 8 8.9 Receives 3.4 million visitors per year 8.9.1 Visitor spending generates $135.7 million inside the park 8.9.2 4994 jobs supported by visitor spending | Neighboring towns and villages (within 150 miles of the park) SDG 8 8.9.1 Visitor spending generates $269.7 million outside the park 8.9.2 1317 jobs supported by visitor spending as secondary effects | One linkage within individual SDG across places. SDG 8 in the spillover systems synergized with SDG 8 in the focal system. | [61] |
| United States | Yosemite National Park SDG 8 8.9 Receives 3.7 million visitors per year 8.9.1 Visitor spending generates $184.9 million inside the park 8.9.2 3795 jobs supported by visitor spending | Neighboring towns and villages (within 50 miles of the park) SDG 8 8.9.1 Visitor spending generates $207.9 million outside the park 8.9.2 1132 jobs supported by visitor spending as secondary effects | One linkage within individual SDG across places. SDG 8 in the spillover systems synergized with SDG 8 in the focal system. | [62] |
| Movement of Wildlife | Focal System and SDGs (Targets/Indicators) | Spillover System and SDGs (Targets/Indicators) | SDG Synergy and Trade-Off | Source |
|---|---|---|---|---|
| Trade of grey and timneh parrots (Psittacus erithacus and Psittacus timneh) | United States (receiving system) SDG 15 15.7.1 The United States (US) passed the 1992 Wild Bird Conservation Act and its imports of wild parrots terminated. Before 1992, the US was a major importer of wild-sourced parrots (mainly from the west and central African countries), with 47% of annual imports of more than 50,000 parrots. | South Africa, Democratic Republic of the Congo (DRC) SDG 15 15.7.1 The import ban of wild birds into the US enhanced the development of the captive-breeding industry in South Africa, which had more than 1600 breeding facilities by 2015 and accounted for 67% of all captive-bred exports. 15.c Due to the development of the captive-breeding industry, South Africa became a major importer of wild-sourced parrots (being used as breeding stock) from the DRC. From 2006 to 2014, DRC exported 92% of 42, 965 wild-sourced parrots. | Two linkages within individual SDG across places. SDG 15 in South Africa synergized with SDG 15 in the focal system. Within SDG 15 in the spillover systems, the enhanced SDG 15 in South Africa generated one trade-off between DRC and South Africa. | [63,64] |
| Trade of polar bears (Ursus maritimus) | United States (receiving system) SDG 15 15.5 The US listed polar bears as “threatened” under the US Endangered Species Act (ESA) in 2008 and prohibited the import of polar bear trophies into the US. The proportion of US hunts in the total sport hunts of the Nunavut (Canada’s newest territory), which has management jurisdiction for 50%–60% of the world’s polar bears and where 400–500 polar bears are harvested per year by a quota system, notably decreased from 62% (1995–2008) to 5% (2009–2012). | EU, Russia, and Canada SDG 15 15.5 After the prohibition of polar bear trophies into the US, hunters from the EU, Russia, and Canada harvested more polar bears, and more trophies were imported into these areas due to the Nunavut polar bear quota (i.e., the number of polar bear tags allocated in Nunavut for sustainable harvest). | One linkage within individual SDG across places. SDG 15 in the spillover systems traded off with SDG 15 in the focal system. | [65] |
| Translocation of raccoons (Procyon lotor) | West Virginia, USA (receiving system) SDG 15 15.8 A few thousand raccoons were translocated from Florida to West Virginia to augment the local raccoon stock for hunting purposes in 1977. SDG 3 3.3 The translocation brought rabies epizootic in the local raccoon population. | Pennsylvania, Virginia, and Maryland, USA SDG 3 3.3 The current rabies epizootic in raccoons and skunks (Mephitis mephitis) in Pennsylvania, Virginia, and Maryland is because of the translocation of raccoons from Florida to West Virginia. | One linkage between different SDGs in one place. Within West Virginia, SDG 3 traded off with SDG 15. One linkage between different SDGs across places. SDG 3 in the spillover system traded off with SDG 15 in the focal system. | [66] |
| Trade and introduction of domestic reindeer (Rangifer tarandus) | Godthåbsfjord (mid-west Greenland, receiving system) SDG 2 2.3 In 1952, 263 domestic reindeer were traded and translocated from Norway to the local Inuit community in western Greenland, to provide a new livelihood. The reindeer husbandry succeeded; for example, from 1967 to 1972, Greenland export revenues from the sale of reindeer products increased dramatically from 0.1 to 1.8 million Danish kroner (1 Danish kroner = 0.15 US dollar). | The rest of western Greenland SDG 15 15.8 All indigenous wild Greenland caribou (R. tarandus groenlandicus) in western Greenland are infested with warble fly (Oedemagna tarandi) and nostril fly (Cephenemyia trompe), both of which did not occur in Greenland before 1952 and were brought with the imported domestic reindeer. The Greenland caribou are greatly reduced in number due to severe mortality associated with the severe harassment of these flies. | One linkage between different SDGs across places. SDG 15 in the spillover system traded off with SDG 2 in the focal system. | [66,67] |
| Introduction of American grey squirrels (Sciurus carolinensis) | Stupinigi, Italy (receiving system) SDG 15 15.8 Two pairs of American grey squirrels were introduced to Stupinigi from Washington, DC, in 1948. | Piedmont (Italy), and Europe SDG 15 15.8 By 2010, a large population of grey squirrels occupied a range of over 2000 km2 in Piedmont. In the same period, red squirrels (Sciurus vulgaris) went extinct in most of the forested areas occupied by grey squirrels. 15.8.1 Trade ban of grey squirrels in Italy (inter-ministerial decree) was approved to avoid further release of grey squirrels to the wild in 2012; trade restrictions at the European level (Commission Regulation n. 101/2012 of 6 February 2012 amending Council Regulation No 338/97 on the protection of species of wild fauna and flora by regulating trade therein) were adopted to reduce the invasive risk in the long term. 15.a.1 A project (2010–2015, € 2 million) was funded by the European Commission (co-financing 45.43%) and the Italian Ministry for the Environment, Land, and Sea, to control or eradicate the grey squirrels in North Italy, including Piedmont area. | One linkage within individual SDG across places. SDG 15 in the spillover systems traded off with SDG 15 in the focal system. | [68,69] |
| Introduction of North American Beavers (Castor canadensis) | Lake Fagnano, Argentina (receiving system) SDG 15 15.8 Fifty beavers were introduced to the lake Fagnano in 1946 to start a fur-trapping industry. | Tierra del Fuego ecosystem, Argentina and Chile SDG 15 15.1 A large population of beavers (over 100,000) is disrupting wetland ecosystems in lake Fagnano and destroying native forests of the neighboring area. 15.8 A massive control and eradication plan is underway across both Argentinean and Chilean Tierra del Fuego. | One linkage within individual SDG across places. SDG 15 in the spillover system traded off with SDG 15 in the focal system. | [70] |
| Trade of Australian endemic parrots | Australia (sending system) SDG 15 15.7 Australia banned the export of its native parrot species since 1960, and passed the Commonwealth Environmental Protection and Biodiversity Conservation Act 1999 (EPBC Act) to regulate the trade of all the species listed in the Convention on International Trade in Endangered Species of Wild Fauna and Flora (CITES) Appendices, including Australian endemic parrots. Between 1996 and 2008, 6% of recorded global illegal wildlife seizures occurred in Australia. The destinations of illegal exports from Australia were predominantly to New Zealand and the US. | New Zealand SDG 15 15.7.1 New Zealand was used as a stopover to launder and transport wild-caught native Australian endemic parrots to other countries by traffickers. For example, in 1993 a light plane smuggled 31 Australian birds into New Zealand; in 1997 over 600 Australian birds were smuggled through New Zealand destined for Europe, US, and Japan. This is because of the geographical proximity of Australia and New Zealand and the trade ban of Australia particularly increased the prices of endemic Australian parrots in the overseas black market (e.g., the price of Black Cockatoos (Calyptorhynchus ssp.) can be up to AU$30,000 (US$17,115)). Illegal import incidents of wildlife to New Zealand increased steadily from less than 50 in 1989 to 902 in 1998, meanwhile, the “legal” export of live endemic Australian parrots from New Zealand increased rapidly to 680 in 1995 from less than 50 before 1989. | One linkage within individual SDG across places. SDG 15 in the spillover system traded off with SDG 15 in the focal system. | [71,72,73] |
| Trade of caiman (Caiman crocodilus) | Venezuela (sending system) SDG 15 15.1 In 1983, Venezuela firstly initiated a large-scale sustainable harvesting program for caiman, which generated great economic values through export (mainly to Japan) and maintained the wild population at a sustainable level. For example, between 1983 and 1995, more than 1 million caimans were harvested and exported, with an export value of $US 115 million. Besides, censuses (1996 and 1999) indicated that wild caiman densities were generally higher in harvested than non-harvested areas, indicating that Venezuela’s caiman harvest was being sustained by the wild population. 15.a The caiman program generated substantial managing funds of the Venezuelan wildlife department for all wildlife programs nationwide. For example, the 1989 caiman harvest contributed $US 1.1 million to the Venezuelan wildlife department. | Honduras, Nicaragua, Guyana, Paraguay, and Colombia SDG 15 15.1 Honduras, Nicaragua, Guyana, Paraguay, and Colombia were encouraged by the sustainable use program and trade of caiman in Venezuela, and initiated the large-scale sustainable farming or captive-breeding program. 15.c Under the influence of CITES, crocodilian products supply from sustainable wild harvests, ranching, or captive breeding increased. 15.7.1 Illegal international trade was eradicated and displaced by legal trade. | One linkage within individual SDG in one place. Within SDG 15 in Venezuela, two different SDG targets (15.1 and 15.a) synergized. One linkage within individual SDG across places. SDG 15 in the spillover system is synergized with SDG 15 in the focal system. | [74,75,76,77] |
| Trade of reticulated python (Python reticulatus) | Indonesia (sending system) SDG 15 15.7.1 Indonesia’s direct exports of reticulated python to European Commission (EC) stopped due to the EC import suspensions between 1992 and 1994. | Singapore SDG 15 15.7.1 EC’s imports of reticulated python from Indonesia via Singapore increased about 20% to offset the suspended direct imports due to inadequate instructions about the application of the suspension. | One linkage within individual SDG across places. SDG 15 in the spillover system traded off with SDG 15 in the focal system. | [78] |
| Trade of African lions (Panthera leo) | South Africa (sending system) SDG 15 15.1 The captive-bred lion hunting industry in South Africa, an example of sustainable use of wildlife, has grown rapidly, with annual exports of lion trophies (57.8% to the United States) increasing sharply from less than 50 in the 1980s to 833 in 2008. The lion breeding and hunting industry was estimated to generate annual revenue of US$11.2 million directly from 2005 to 2007. Besides this, the lion breeding and hunting industry created 220 direct jobs. 15.7 Wild lions hunted in South Africa decreased significantly, so that only 0.9% and 1.1% of the total exported lions in 2009 and 2010 were wild lions. SDG 1 1.b The economic benefits from the lion breeding and hunting industry helped reduce poverty for the main beneficiary provinces (North West, Limpopo, and Free State), as these areas are among the poorest in South Africa. | Other African countries (Benin, Botswana, Burkina Faso, Cameroon, Central African Republic, Ethiopia, Mozambique, Namibia, Tanzania, Zambia, Zimbabwe) SDG 15 15.7 The number of lion trophies exported from other African countries declined rapidly from over 900 in 1994 to 318 in 2010, due to the increased captive-bred lion hunting in South Africa. | One linkage within individual SDG in one place. Within SDG 15 in South Africa, two different SDG targets (15.1 and 15.7) synergized. One linkage among SDGs within one place. Within South Africa, SDG 1 synergized with SDG 15. One linkage within individual SDG across places. SDG 15 in the spillover systems synergized with SDG 15 in the focal system. | [79,80] |
© 2020 by the authors. Licensee MDPI, Basel, Switzerland. This article is an open access article distributed under the terms and conditions of the Creative Commons Attribution (CC BY) license (http://creativecommons.org/licenses/by/4.0/).
Share and Cite
Zhao, Z.; Cai, M.; Connor, T.; Chung, M.G.; Liu, J. Metacoupled Tourism and Wildlife Translocations Affect Synergies and Trade-Offs among Sustainable Development Goals across Spillover Systems. Sustainability 2020, 12, 7677. https://doi.org/10.3390/su12187677
Zhao Z, Cai M, Connor T, Chung MG, Liu J. Metacoupled Tourism and Wildlife Translocations Affect Synergies and Trade-Offs among Sustainable Development Goals across Spillover Systems. Sustainability. 2020; 12(18):7677. https://doi.org/10.3390/su12187677
Chicago/Turabian StyleZhao, Zhiqiang, Meng Cai, Thomas Connor, Min Gon Chung, and Jianguo Liu. 2020. "Metacoupled Tourism and Wildlife Translocations Affect Synergies and Trade-Offs among Sustainable Development Goals across Spillover Systems" Sustainability 12, no. 18: 7677. https://doi.org/10.3390/su12187677