1. Introduction
Photovoltaics (PV) deals with the phenomenon of direct conversion of solar radiation into electricity [
1,
2,
3,
4]. Photovoltaics, as a renewable energy source, is at an early stage of development in Poland [
5]. Currently (1 July 2020), the total installed power of PV systems is about 2 GW
p (peak power) [
6]. PV systems with peak power up to 50 kW
p are recognized in Poland as micro-installations and are accounted for as prosumer on a “net metering” principle [
5]. In prosumer PV systems in Poland, the power grid is a virtual storage of electricity, which can be used in residential buildings at any time, e.g., to support heating systems. Due to the very small government subsidies for solar farms in Poland (only PLN 5000 for an installation up to 10 kW
p [
7]), its development is only conditioned by market considerations and the raising of pro-ecological awareness of the society. Other techno-economic conditions for grid-connected PV systems are in other regions, described in example works [
8,
9,
10] (examples for Malaysia, Turkey, and Saudi Arabia). It is closely dependent on the climatic conditions in the region. In these countries, the economic conditions for investing in PV installations are also different.
The performance of PV systems is influenced by many different factors, such as: changing sunlight conditions, ambient temperature, shading of PV modules, PV module pollution, “Hot-Spots” on PV modules, design errors, assembly errors, and others. Many research studies have analyzed the impact of temperature [
11,
12] and other environmental factors [
13,
14] on the operation of PV systems. The research was also carried out into the effects of partial shading [
15] and module pollution [
16] on the performance of PV systems. The studies mentioned here did not propose modeling methods for the described phenomena that would enable simulation research. Less scientific studies can be found on the impact of various types of design and assembly errors in PV systems, which was the genesis of the author’s taking on this topic. The analysis of PV strings failure and health monitoring with PV module fault identification was conducted in work [
17]. The disadvantage of this solution is the necessity to analyze the voltage and the electroluminescence both in parallel, which complicates the method. In turn, Gul et al. [
18] discussed a unified approach for analysis of faults in different configurations of PV arrays. The disadvantage of these tests is the consideration of only selected configurations of PV panels for selected technologies of making PV modules. An interesting method of evaluation performance of a PV system by clustering data for the normal and non-normal operation was discussed in work [
19]. The disadvantage of this solution is that it is difficult to distinguish the disadvantage of a PV module from ordinary shading, e.g., due to cloudy skies.
Inverters used in PV systems have built-in subsystems that monitor the most important input-output parameters. Averaged data is recorded and saved at a specified frequency (every 5–15 min). A simplified version of monitoring is available on mobile devices. Long-term analysis of data from PV installation monitoring enables the detection of any irregularities [
20,
21]. This work proposes the method of analysis of the performance of a PV system for different values of the nominal power ratio (
NPR): inverter-PV generator (PV array). We define nominal power ratio according to the formula [
22]:
where
PmaxDCin is the maximum input DC power, that can be used by the PV inverter, and
PPVgenSTC is the power peak of the PV generator, in STC (Standard Test Conditions).
The nominal power ratio (
NPR) characterizes the fundamental parameter of each PV system, adopted at the design stage. The recommended nominal power ratio for Central Europe is approximately 90%. Some inverter manufacturers allow its value to be up to 50% [
23]. The permissible range of values of this ratio is finally determined on the basis of a detailed analysis of the output parameters of the PV generator and the input parameters of the inverter. The operating temperature range of the PV generator is of particular importance [
24,
25].
In the article by Beránek et al. [
26], an innovative monitoring of the PV system has been developed, which aimed at measuring the main parameters and characteristics of solar plants; collecting, diagnosing and processing data. This monitoring system has been used to follow 65 solar plants in the Czech Republic and elsewhere for 175 MW
p. In the proposed method, it would be desirable to record monitoring data more frequently in order to increase their suitability for mathematical modeling of processes.
Monitoring systems in PV installations are not only a gadget but also a valuable source of information about the PV system and a tool for remote diagnostics. Increasingly, they also ensure the fire safety of PV installations [
27,
28,
29]. Often is used the advanced asset management tools in PV plant monitoring, based on the digital mapping method [
30]. They are also used more and more often an alternative solutions based on the Internet of Things in the field of monitoring and data management for PV systems [
31]. In the future, monitoring of PV installation parameters should be integrated with video imaging analysis performed periodically by drones, as discussed in [
32]. The most important problems in the methods described in these works are the integration of recorded data and their interpretation in real-time. This is necessary to generate quick responses to monitoring data.
The novelty of the proposed method is that the verification of simulation tests required modification of the test stand. For this reason, only selected results of simulation tests were verified. Important for the conducting was the parallel measurement of the electrical parameters of PV installations with the selected weather parameters and the recording of their averaged values at 5-min intervals.
2. Materials and Methods
2.1. Description of the Research Stand
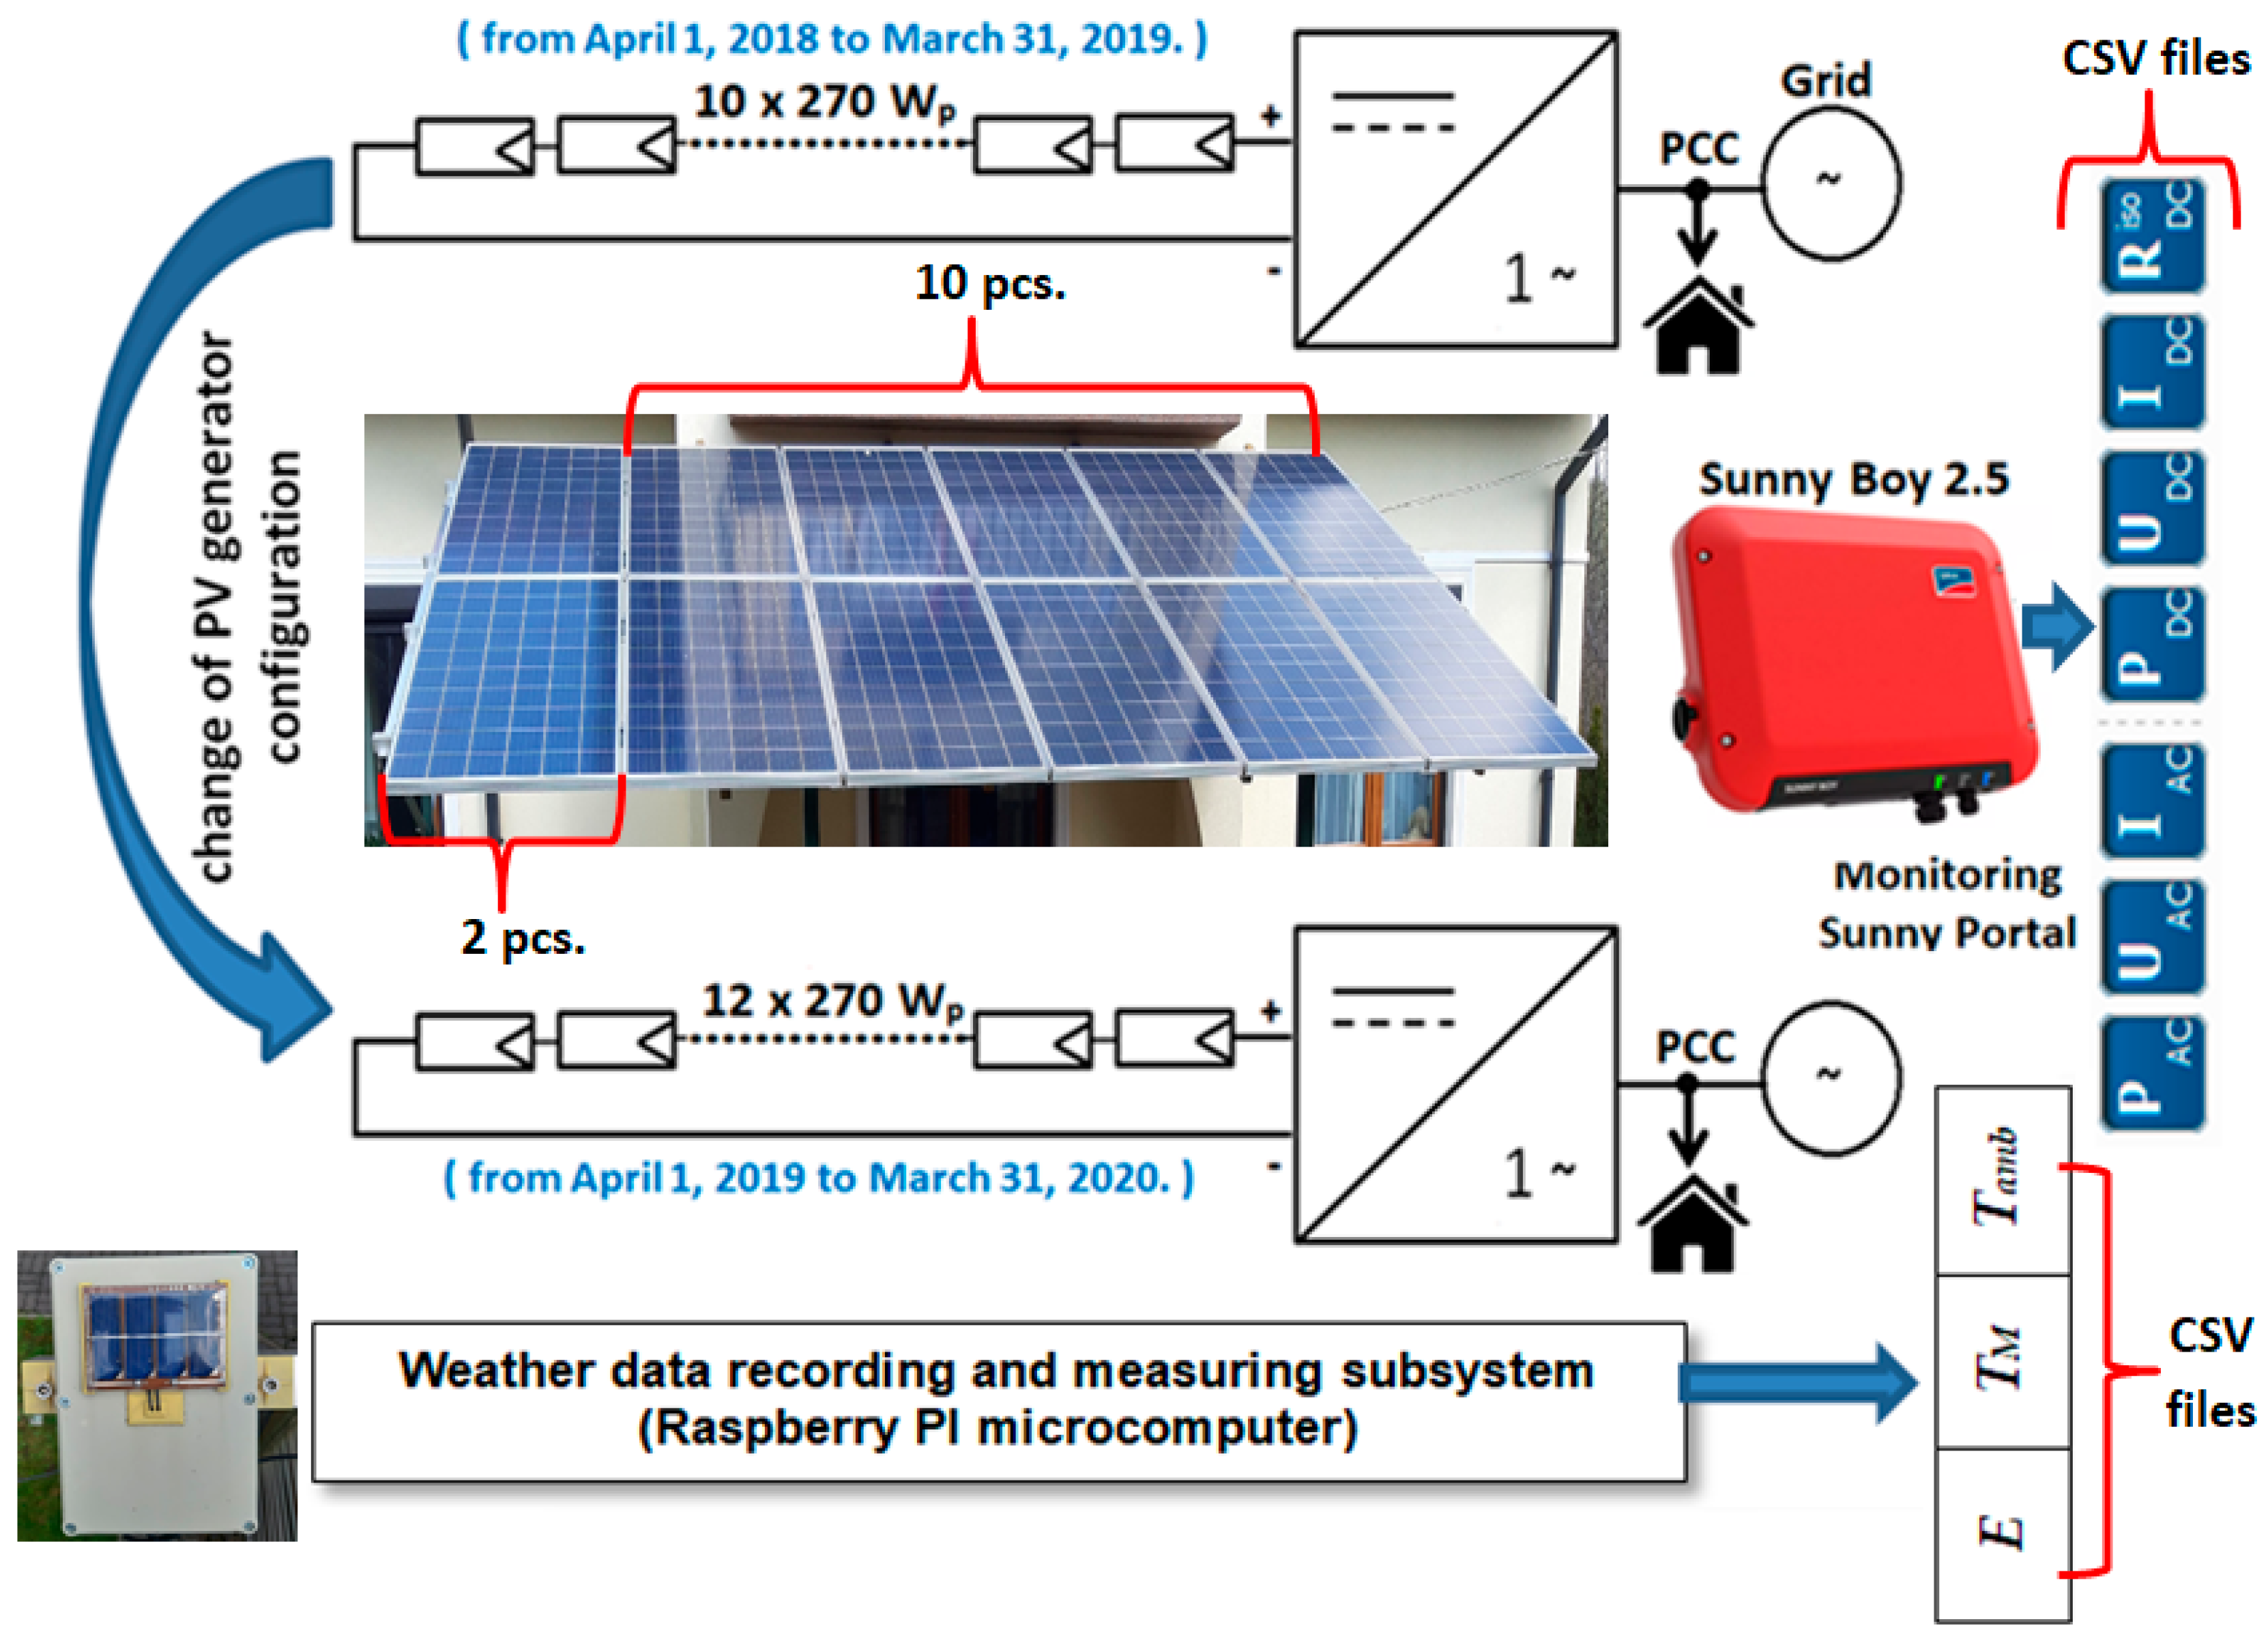
The research stand is the prosumer mini PV system, located in central Poland (GPS coordinates: 52.478613N, 19.672203E), which is the roofing of the terrace of a single-family residential house (
Figure 1). The PV generator was built of PV modules, made of polycrystalline silicon cells. The PV modules are installed at an angle of 22° to the horizontal, and azimuth angle is deviated by 2° from the south direction to the east.
The tested PV system is a classic example of a typical ON-GRID PV installation without local energy storage. PV system is connected to the local power grid operator at the Point of Common Coupling (PCC). The measuring element is a bidirectional electricity meter of the grid operator, which works independently of the monitoring system. For the purposes of testing, the PV system monitoring system has been equipped with a professional package that provides detailed recording of the input/output parameters (
Figure 1) of the PV inverter with a frequency of data recording every 5 min.
The average annual electricity consumption of the residential building in question has recently been 4200 kWh (this value is estimated by the network operator and given on invoices). In the Polish prosumer system, energy from the PV system fed into the power grid operators can be received based on “Net Metering”, which means that it can be stored in a network that is “virtual energy storage”. Still, then we lose a discount (20% for PPVgenSTC < 10 kWp, and 30% for PPVgenSTC ≥ 10 kWp). The second condition is the energy from the virtual storage must be used by the prosumer within 365 days, and then it is lost. In such a billing system, if there is no local energy storage, the size of the PV generator is limited by economic considerations.
The PV generator was built of identical PV modules connected in series, the most important parameters of which are given in
Table 1. The PV system generator was modified during the tests. In the first year of research, i.e., from 1 April 2018 to 31 March 2019, it consisted of ten modules, and in the second year of study, i.e., from 1 April 2019 to 31 March 2020, it consisted of twelve modules (
Figure 1).
The inverter in the PV system was unchanged during the tests. The PV system uses a single-phase inverter, the Sunny Boy 2.5 model (abbreviated as SB 2.5), whose basic parameters provided by the manufacturer are given in
Table 2. The inverter has one DC input and is dedicated to small prosumer PV installations. The inverter has the Wi-Fi network interface that allows you to send and register necessary input/output data. These data can be viewed in the Sunny Portal [
34] system or imported as CSV files, which will be subject to detailed analysis.
The test stand was also equipped with an independent subsystem (
Figure 1) for measuring basic weather parameters, such as module temperatures (
TM), ambient temperature (
Tamb) and solar radiation intensity (
E). The recording of parameters of the PV system and the climate subsystem was carried out in parallel, and the averaged parameters were saved in CSV files with a frequency of every 5 min. This data recording procedure has enabled comparative analysis. The solar irradiance sensor was mounted in the field plane of the PV modules, the temperature sensor of the PV modules was glued from below, and the ambient temperature sensor in the shade of the PV modules at a distance of 1 m from the PV modules. The measuring and recording subsystem was built on the basis of the Raspberry Pi microcomputer, and the methodology for measuring weather parameters was adopted on the basis of the IEC/PN-EN 60891 standard [
36].
2.2. Methodology of Simulation Research
The simulation researches were carried out using the Sunny Design software [
37], which is dedicated to the design of PV systems with SMA inverters and any types of PV modules. Simulation tests were carried out for real parameters of the PV system, assuming the ambient temperature (
Tamb) range from −20 °C to +35 °C for the location of the PV installation.
Regardless of the type of simulation software used, it is always recommended to check the maximum values of PV generator parameters (current and voltage) over the entire possible temperature range of PV modules. For central Poland, where the PV system is located, the range of likely temperatures for PV modules (
TM) is from −20 °C to +70 °C [
38]. The results of calculations according to Formulas (2), (3), and (4) [
5] for the given temperature range of the PV modules must not exceed the maximum value of the current and voltage of the PV inverter given in
Table 2:
where the signs in the Formulas (2), (3), and (4) are given in
Table 1, and
TM is the temperature of the PV modules.
2.3. The Method of Analysis of Data from the Monitoring PV System
Verification research was carried out based on data analysis from the monitoring of PV installations, conducted in two consecutive years of its operation. After the first considered period of operation of the PV installation, the power of the PV generator was increased by adding two PV modules. Verification tests were also carried out with the division of the year into summer and winter months. The months from October to March were adopted as the winter half-year and the months from April to September were the months of the summer half-year. Statistical analyses were also carried out in the form of PV inverter output power histograms for ten class intervals. A much better way to verify the simulation results would be to build two identical PV installations with a different number of modules in the PV generator (in the first ten PV modules, and twelve in the second). Then the results of the verification tests would not be affected by an error resulting from different climatic conditions in the following years at the PV installation site.
The analysis of PV system monitoring data was performed based on daily CSV files imported from Sunny Portal with basic installation parameters. These files contain averaged data recorded every five minutes for each day. Based on the data files, absolute yields and relative monthly and yearly yields were separated, followed by an analysis of the inverter output power distribution for the two considered periods of installation operation, broken down into summer and winter half-year. Daily diagrams of the inverter output power were also compared for sample days from summer and winter periods of PV installations before and after changing the configuration of the PV generator.
In order to perform the analysis of the influence of weather parameters on the output parameters of the PV generator, CSV files were synchronized by date and exact measurement time (averaged values every 5 min).
3. Results
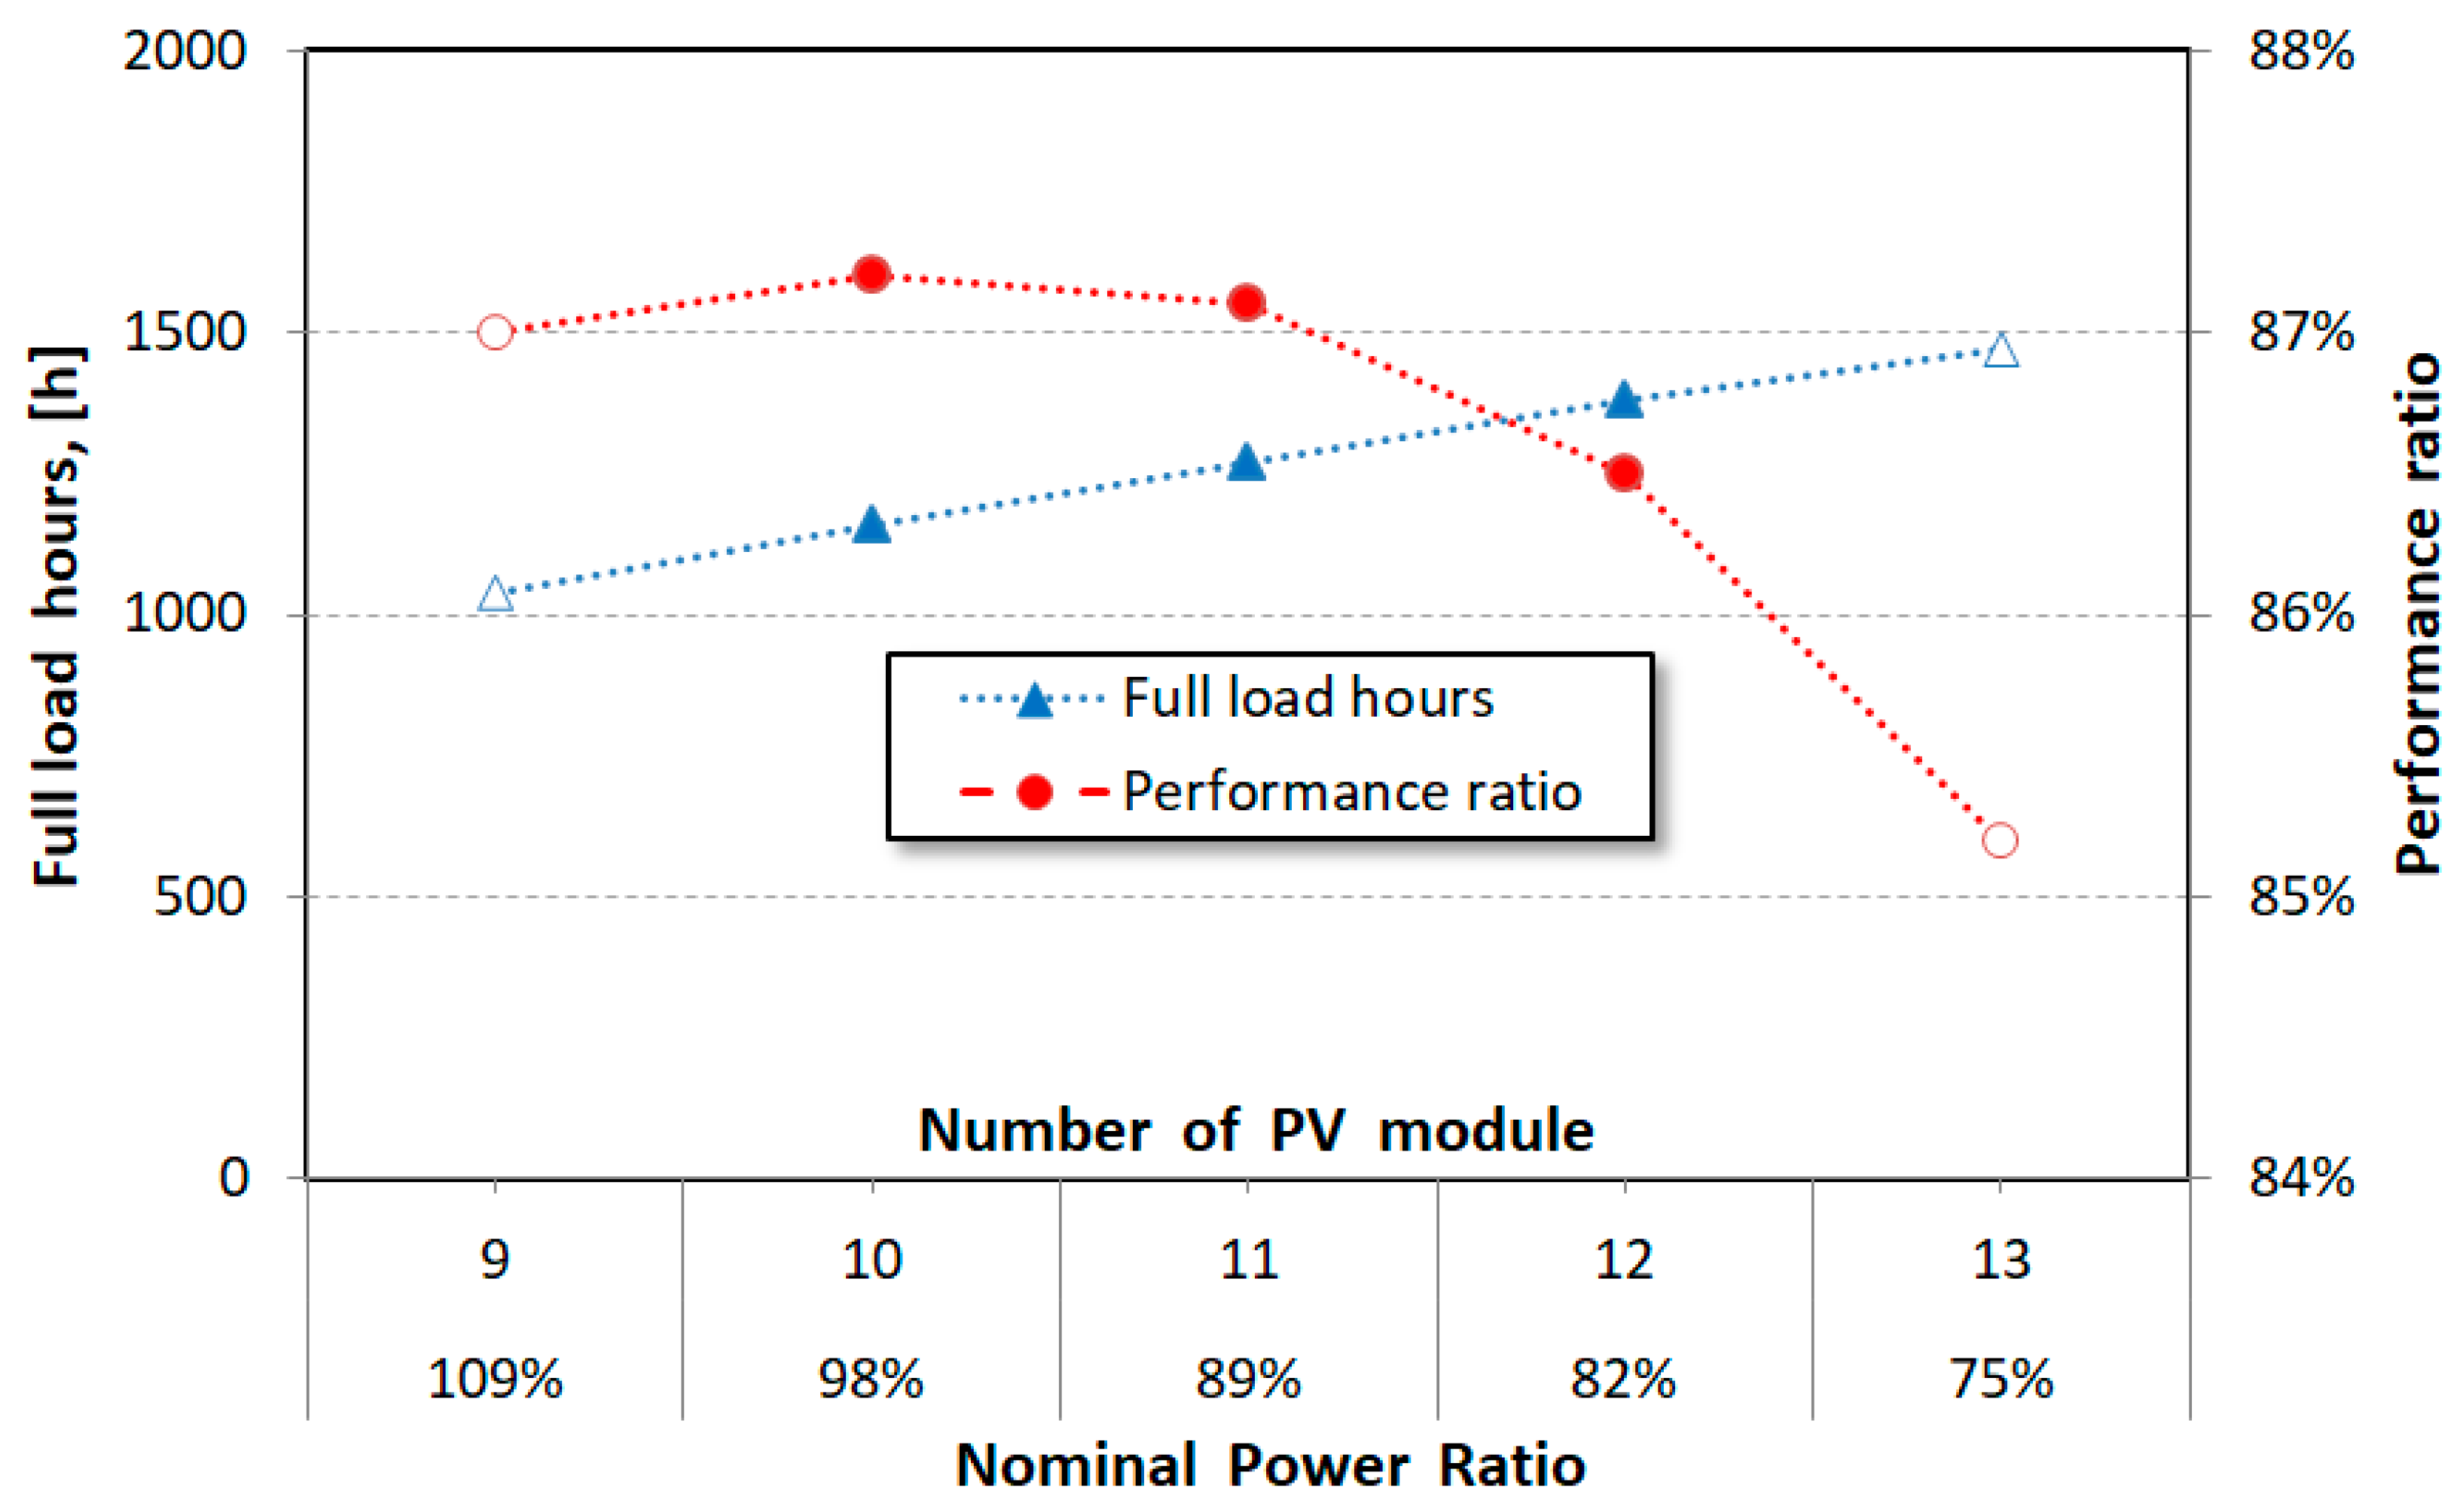
Table 3 presents the results of simulation calculations made in Sunny Design software for the considered PV system for the assumed numbers of PV modules in the range from 9 to 13 pieces. Among the calculated parameters is also the performance ratio (
PR) stated as the ratio between the obtained yield and nominal yield of the PV system.
Preliminary analysis of the simulation results showed that the numbers of PV modules 9 and 13 are unacceptable due to a mismatch between the parameters of the PV generator and the inverter of the PV system in question (critical parameters are marked in
Table 3 in red color). Therefore, in
Figure 2 and
Figure 3, data points for these variants are marked without filling the markers in the charts. Further verification tests were carried out for extreme cases of acceptable range, i.e., for 10 and 12 pieces of PV modules.
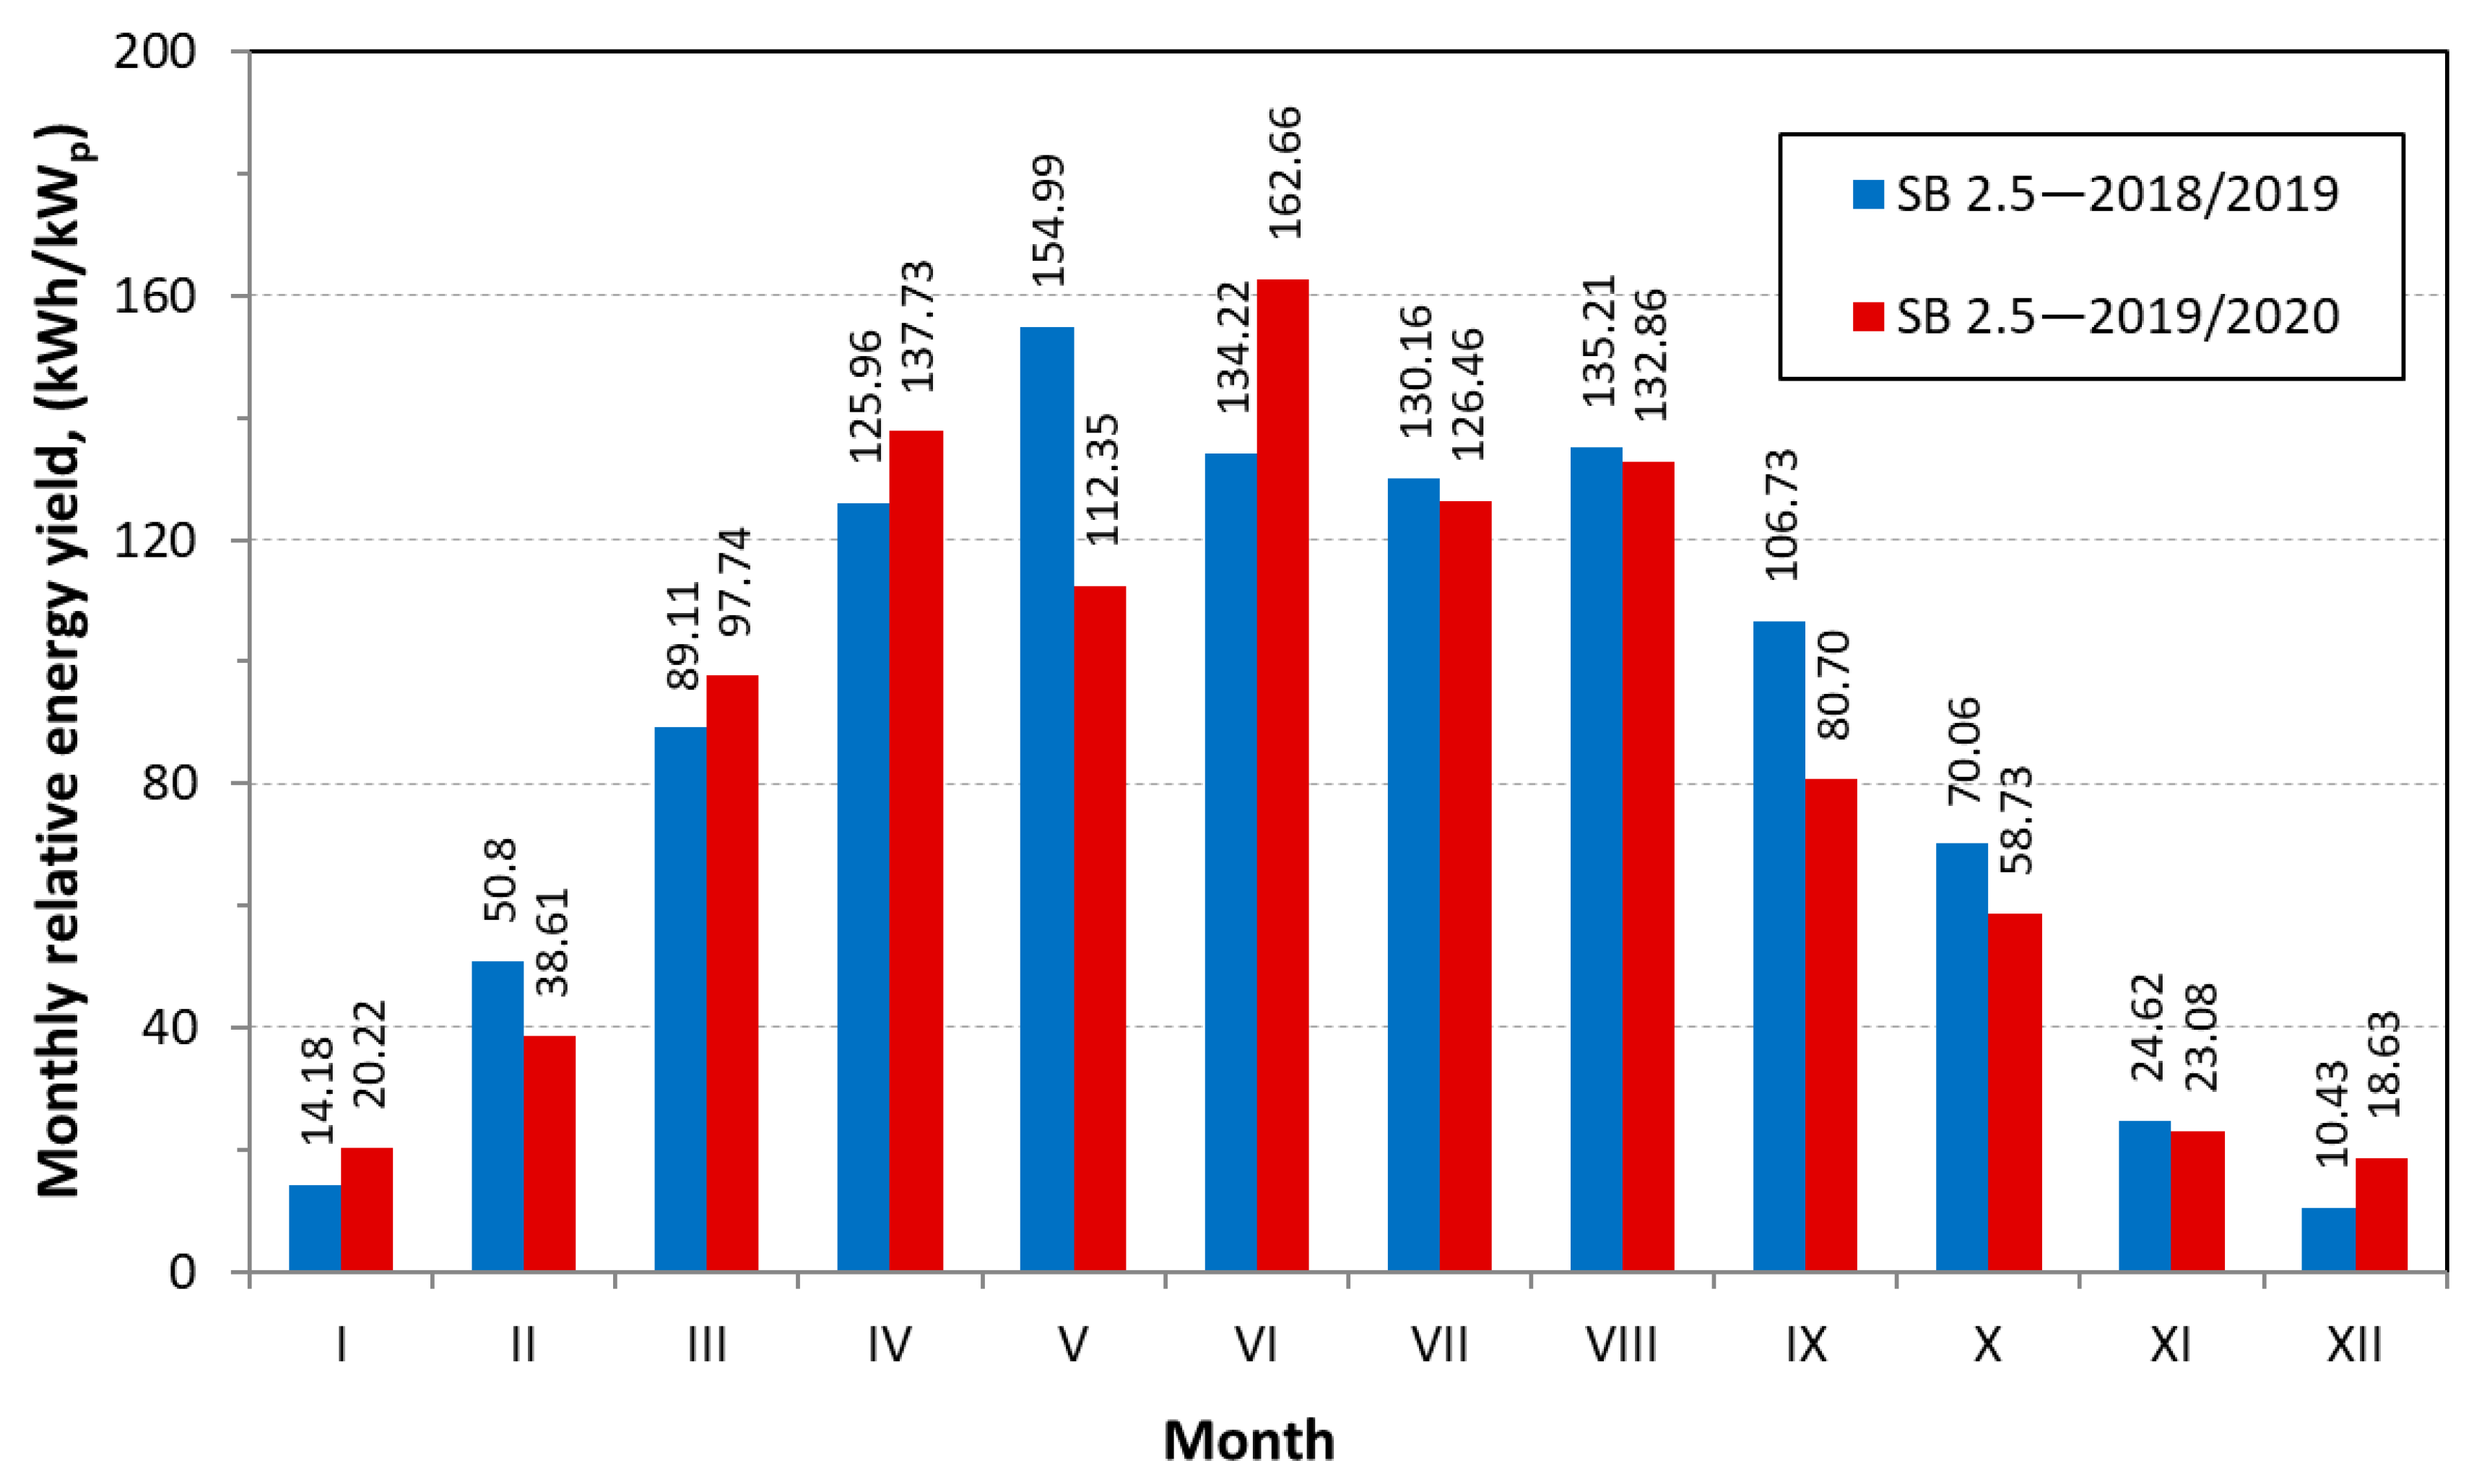
Figure 4 shows the monthly relative energy yield for the PV system before changing the generator configuration (from 1 April 2018 to 31 March 2019—marked in the chart legend as SB 2.5—2018/2019) and after adding two PV modules (from 1 April 2019 to 31 March 2020—marked in the chart legend as SB 2.5—2019/2020). These data come from the monitoring system of the PV installation and relate to energy transferred through the inverter to the power grid. The specificity of the verification tests was that the data from two different consecutive years of operation of the PV installation were analyzed. This is especially visible in the graph in
Figure 4 for the month of May, when there were significant differences in climatic conditions for the location of the PV system.
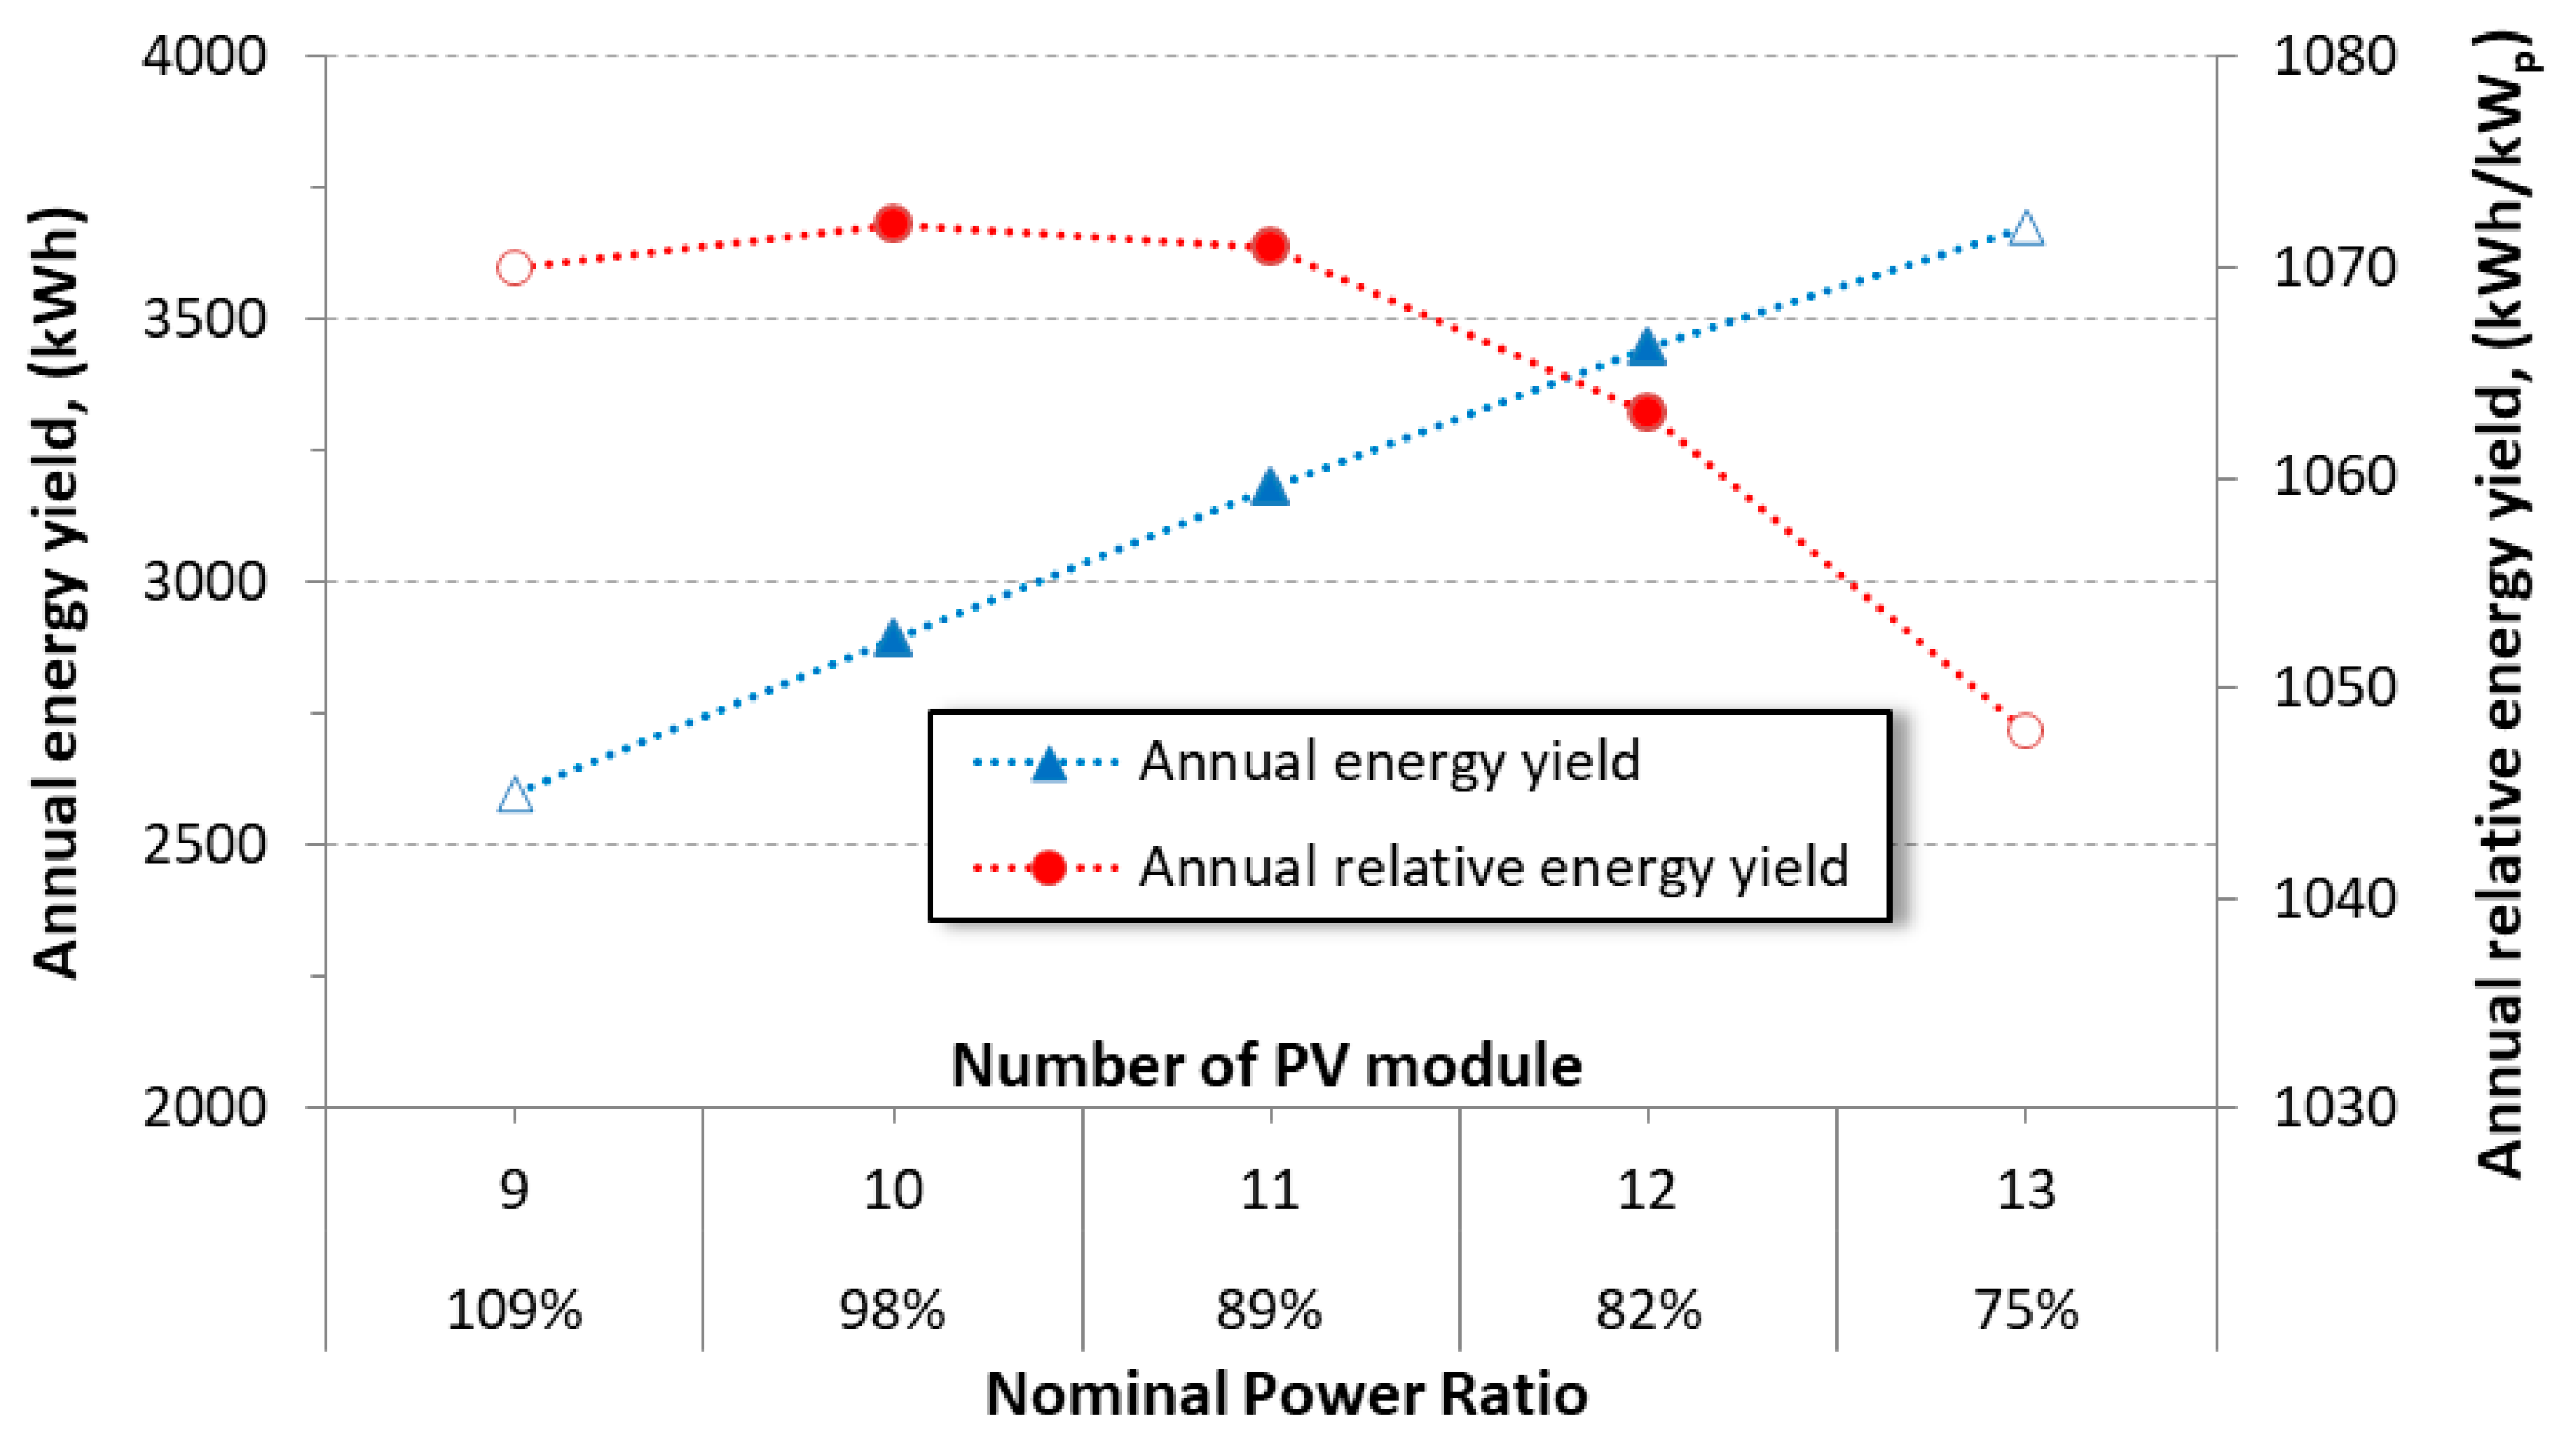
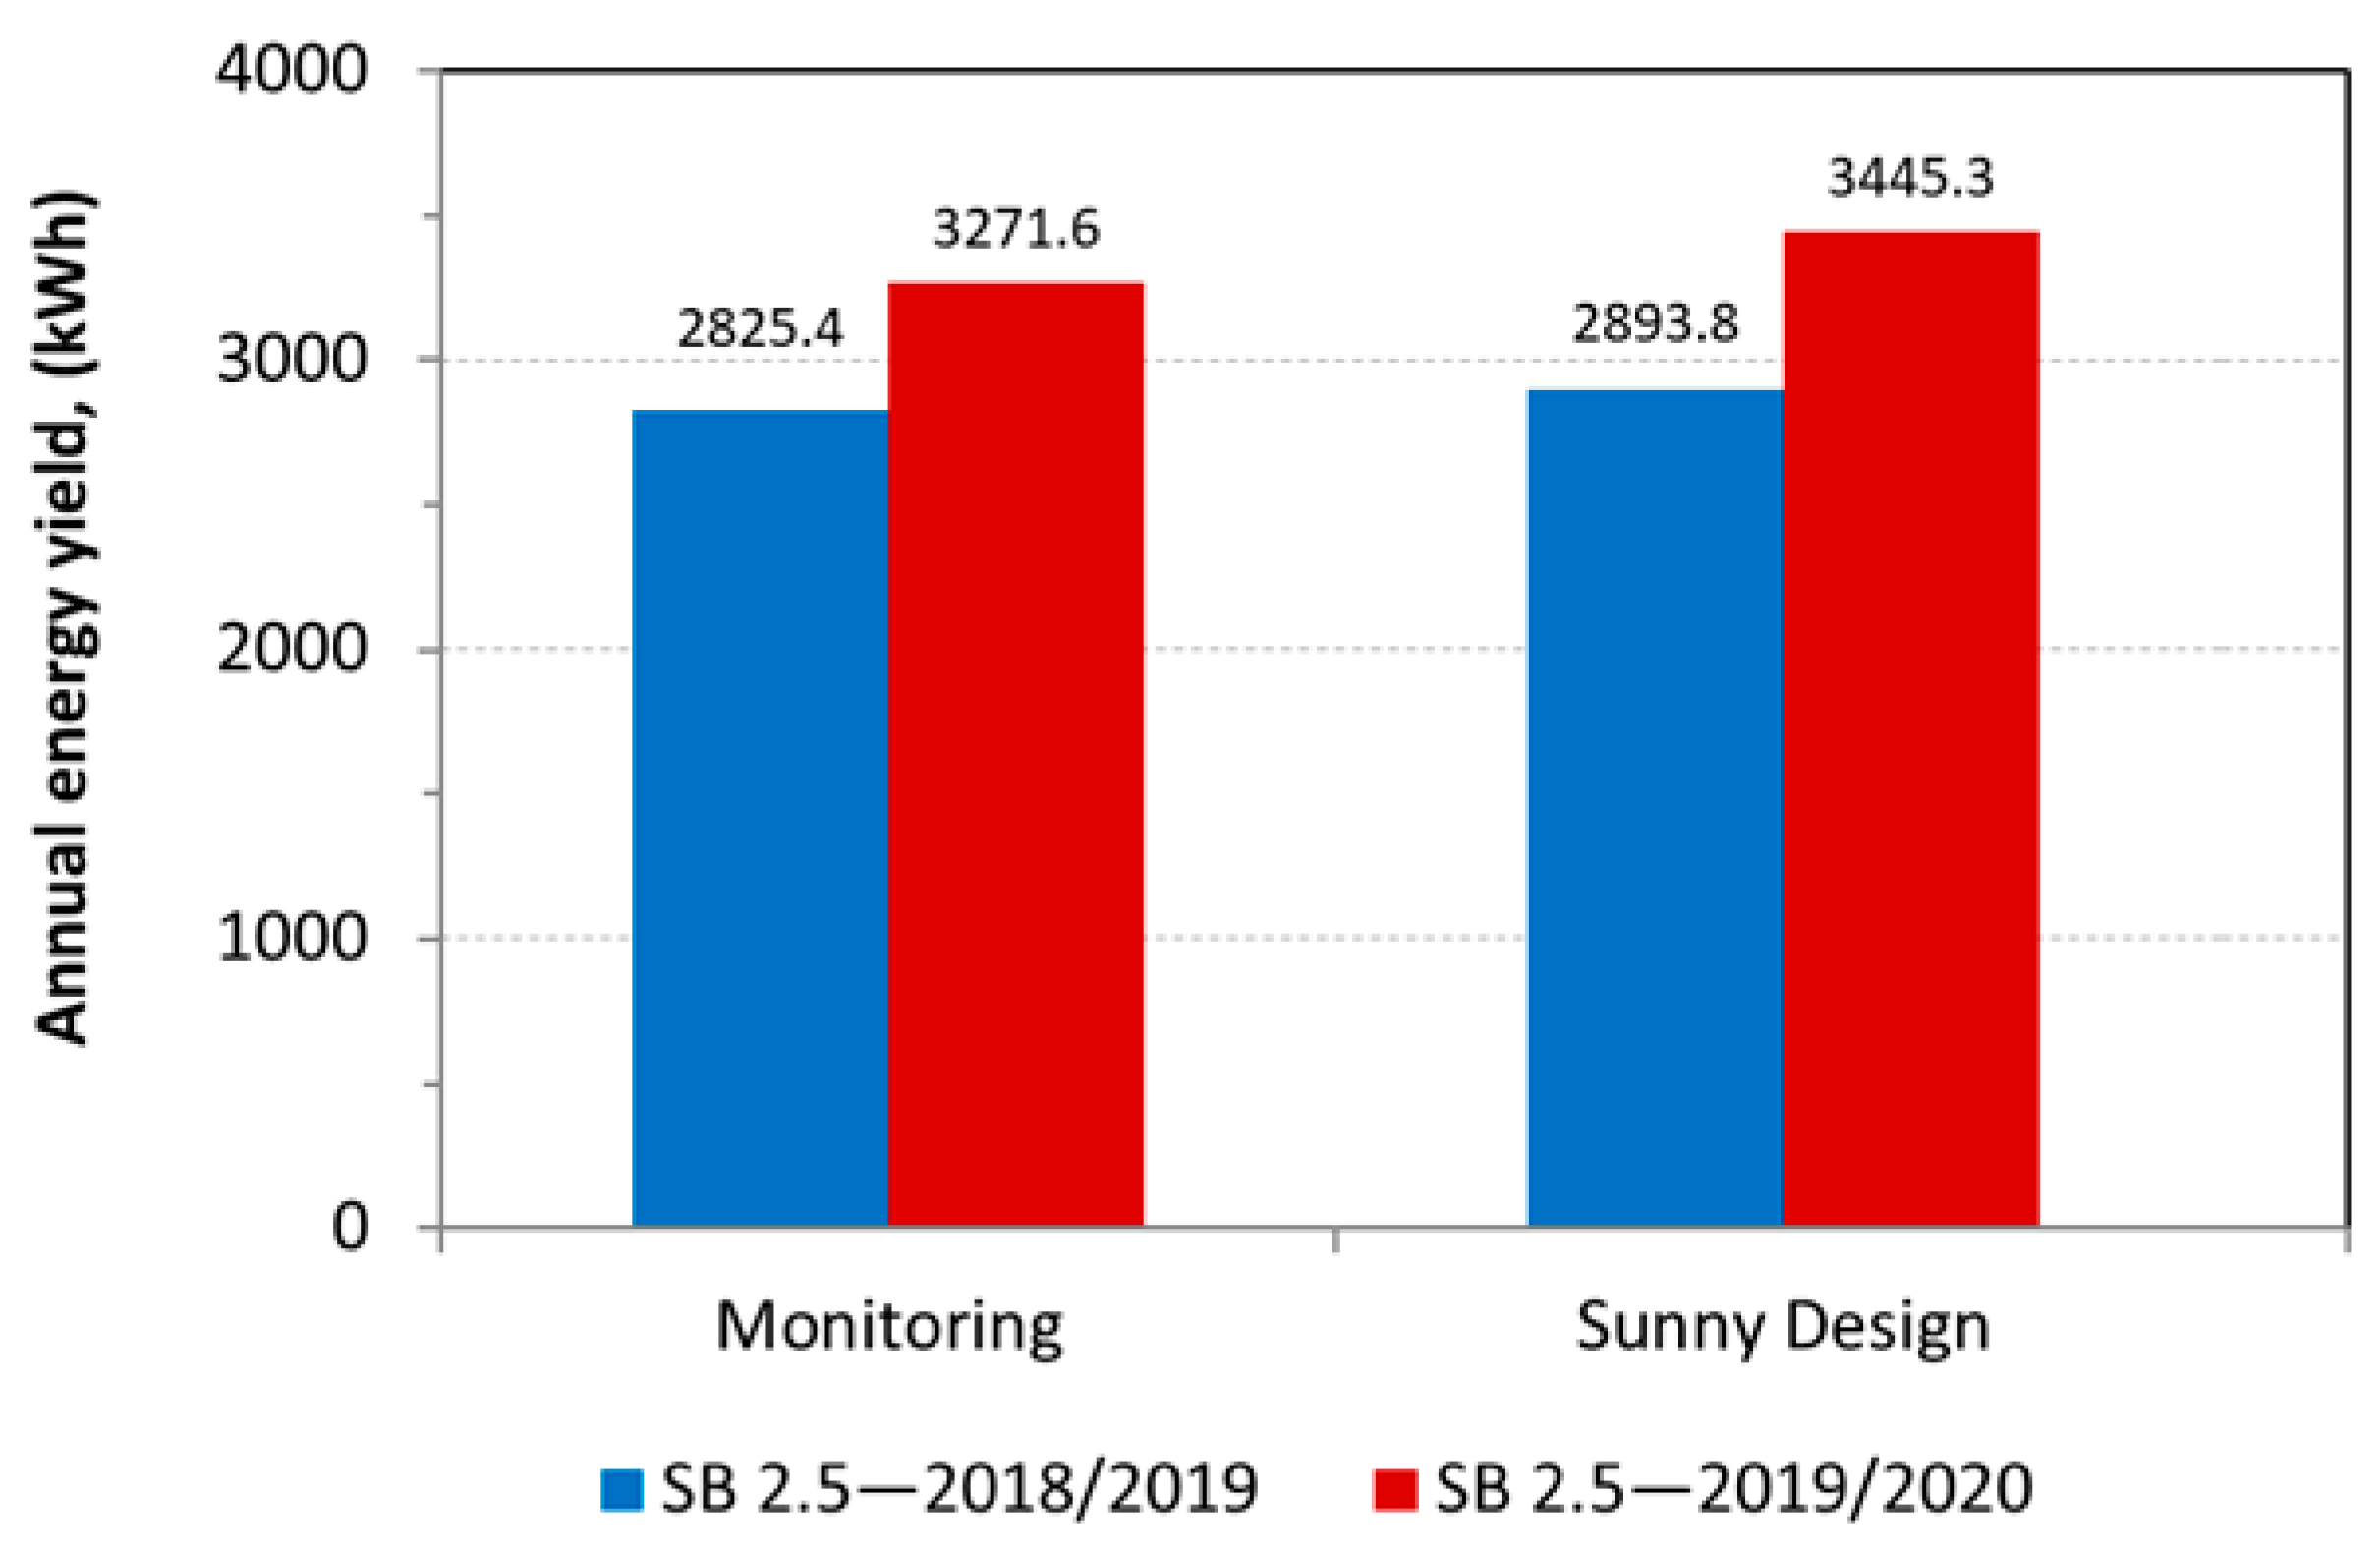
Figure 5 shows a comparison of the annual energy yields (in absolute terms in kWh) for the two periods under consideration (periods as before) of results of PV installation monitoring and simulation results in Sunny Design software. Simulation calculations in Sunny Design were made for real data of PV installations, lengths, and cross-sections of cables used were taken into account.
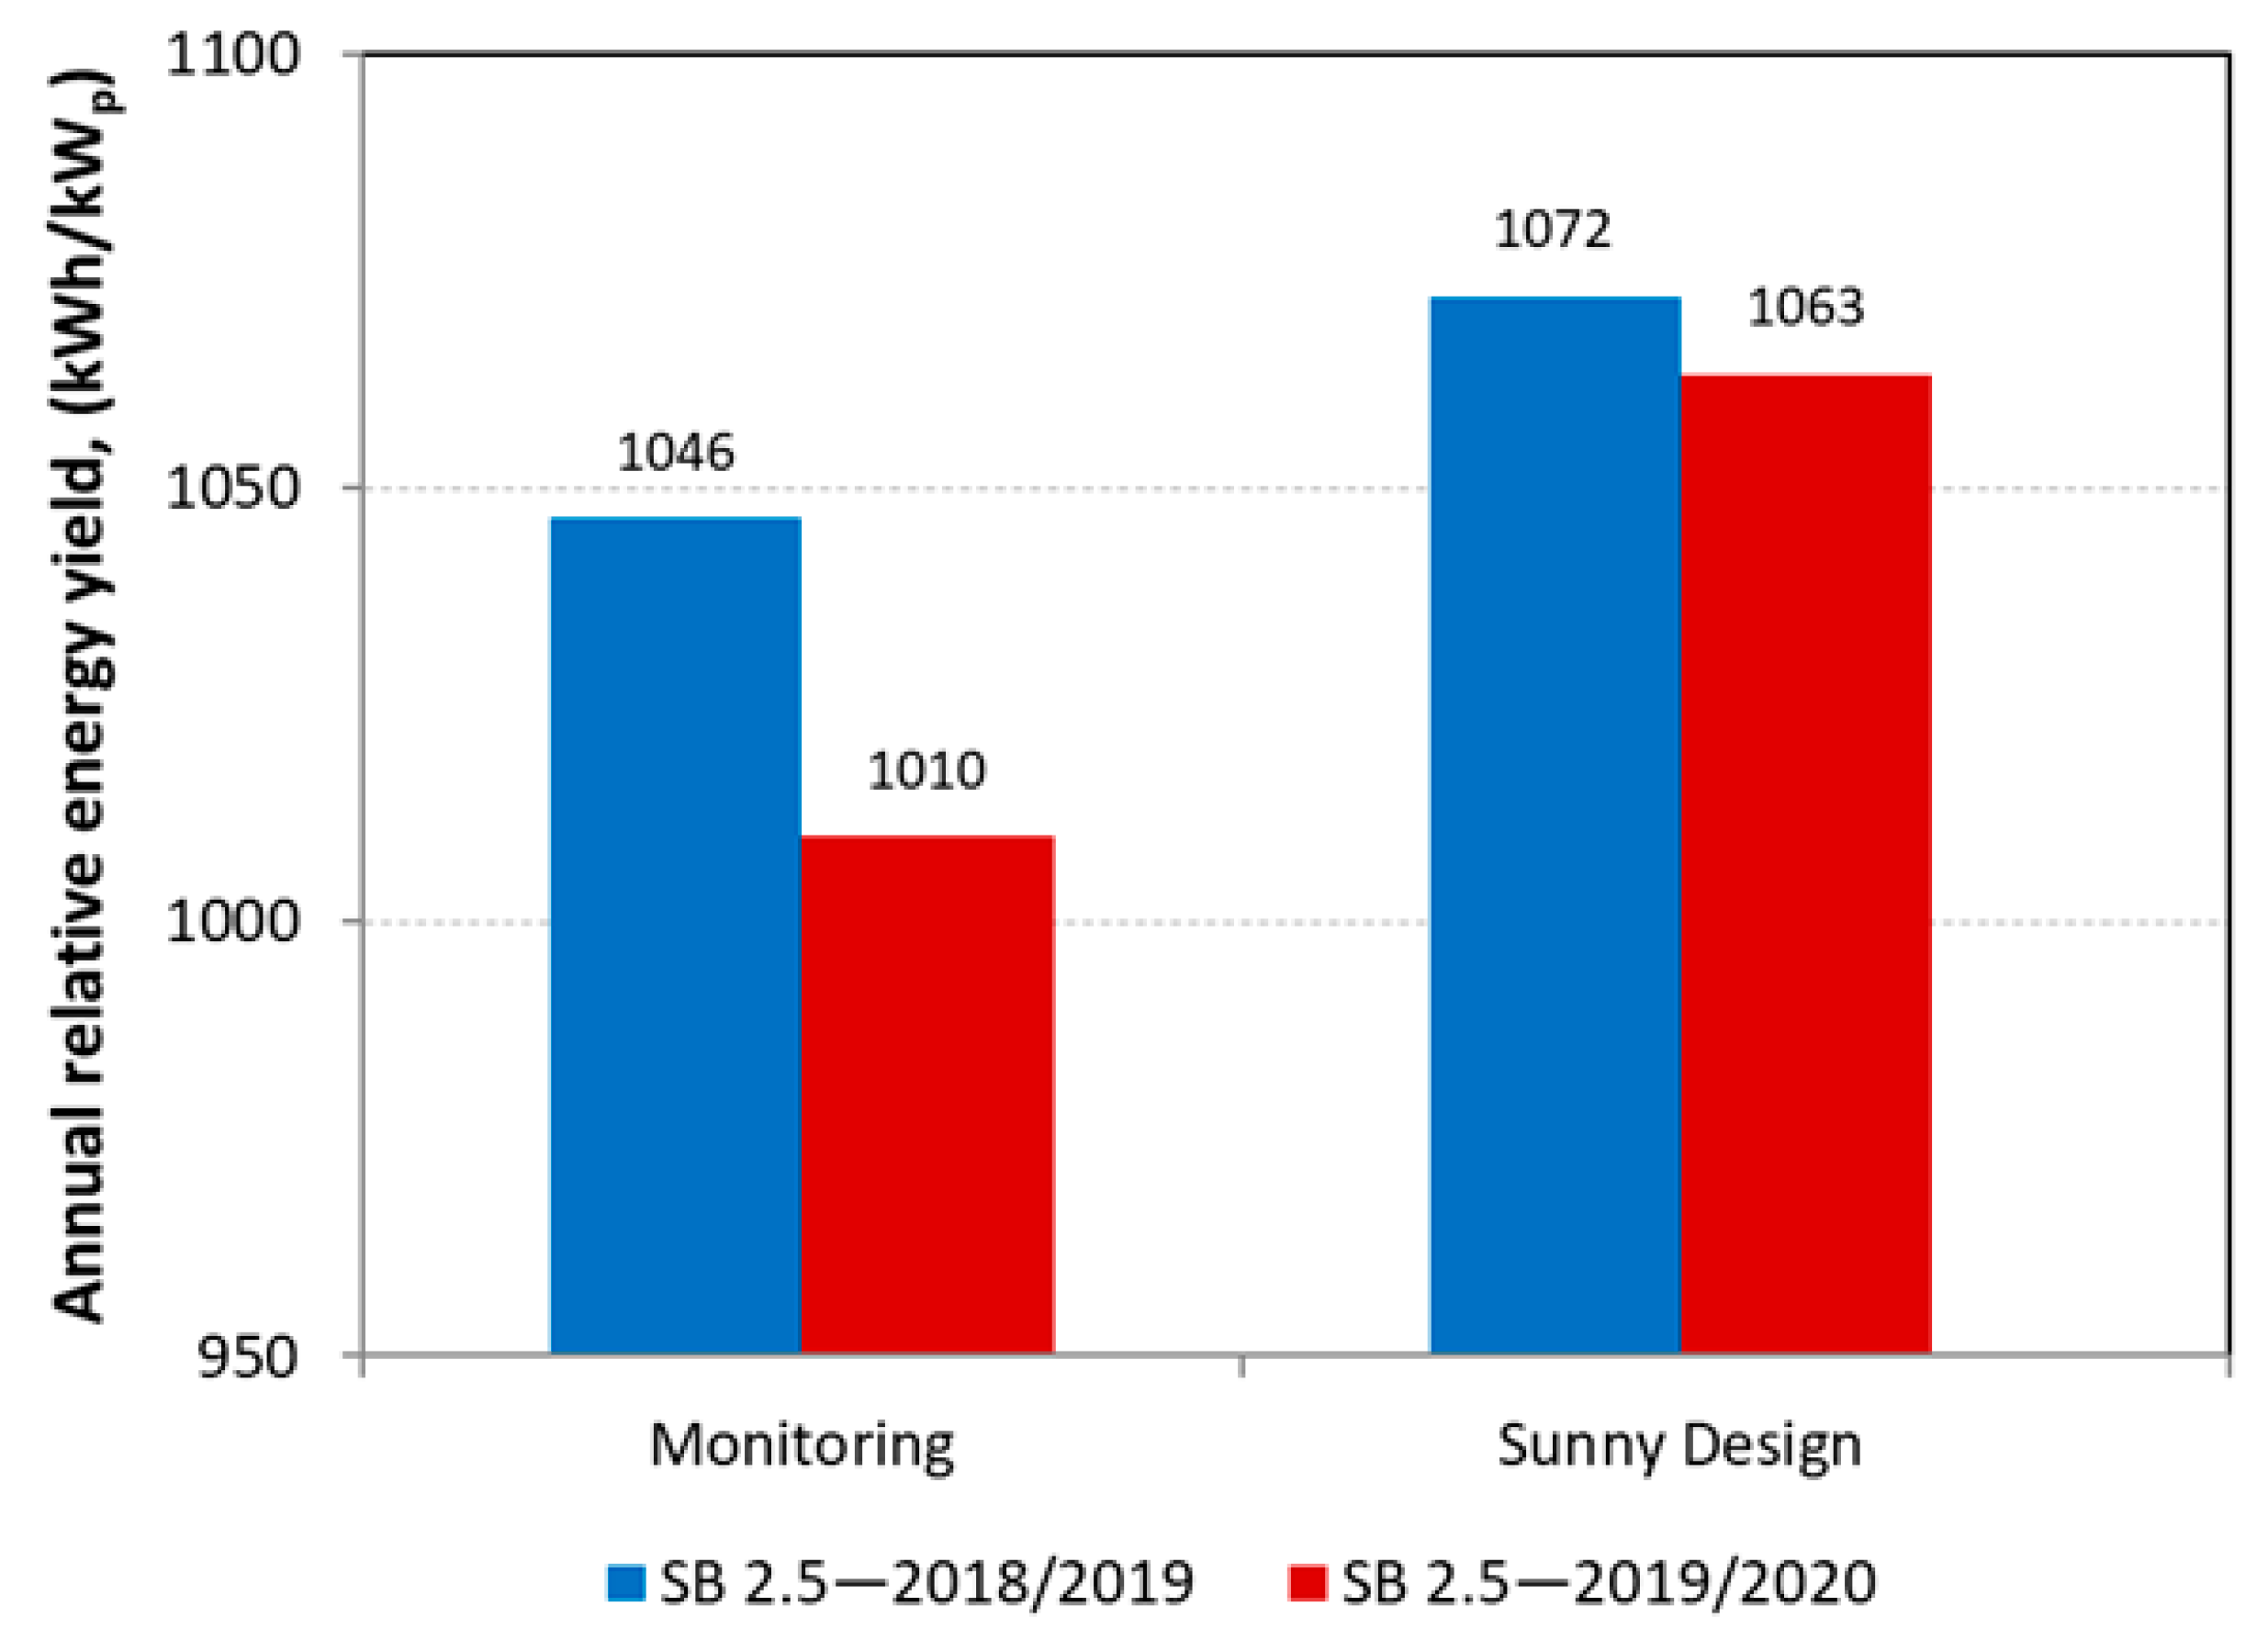
Figure 6 shows a comparison of the annual relative energy yields (in kWh/kW
p) for the two periods under consideration (periods as before) of the results of PV installation monitoring and simulation results.
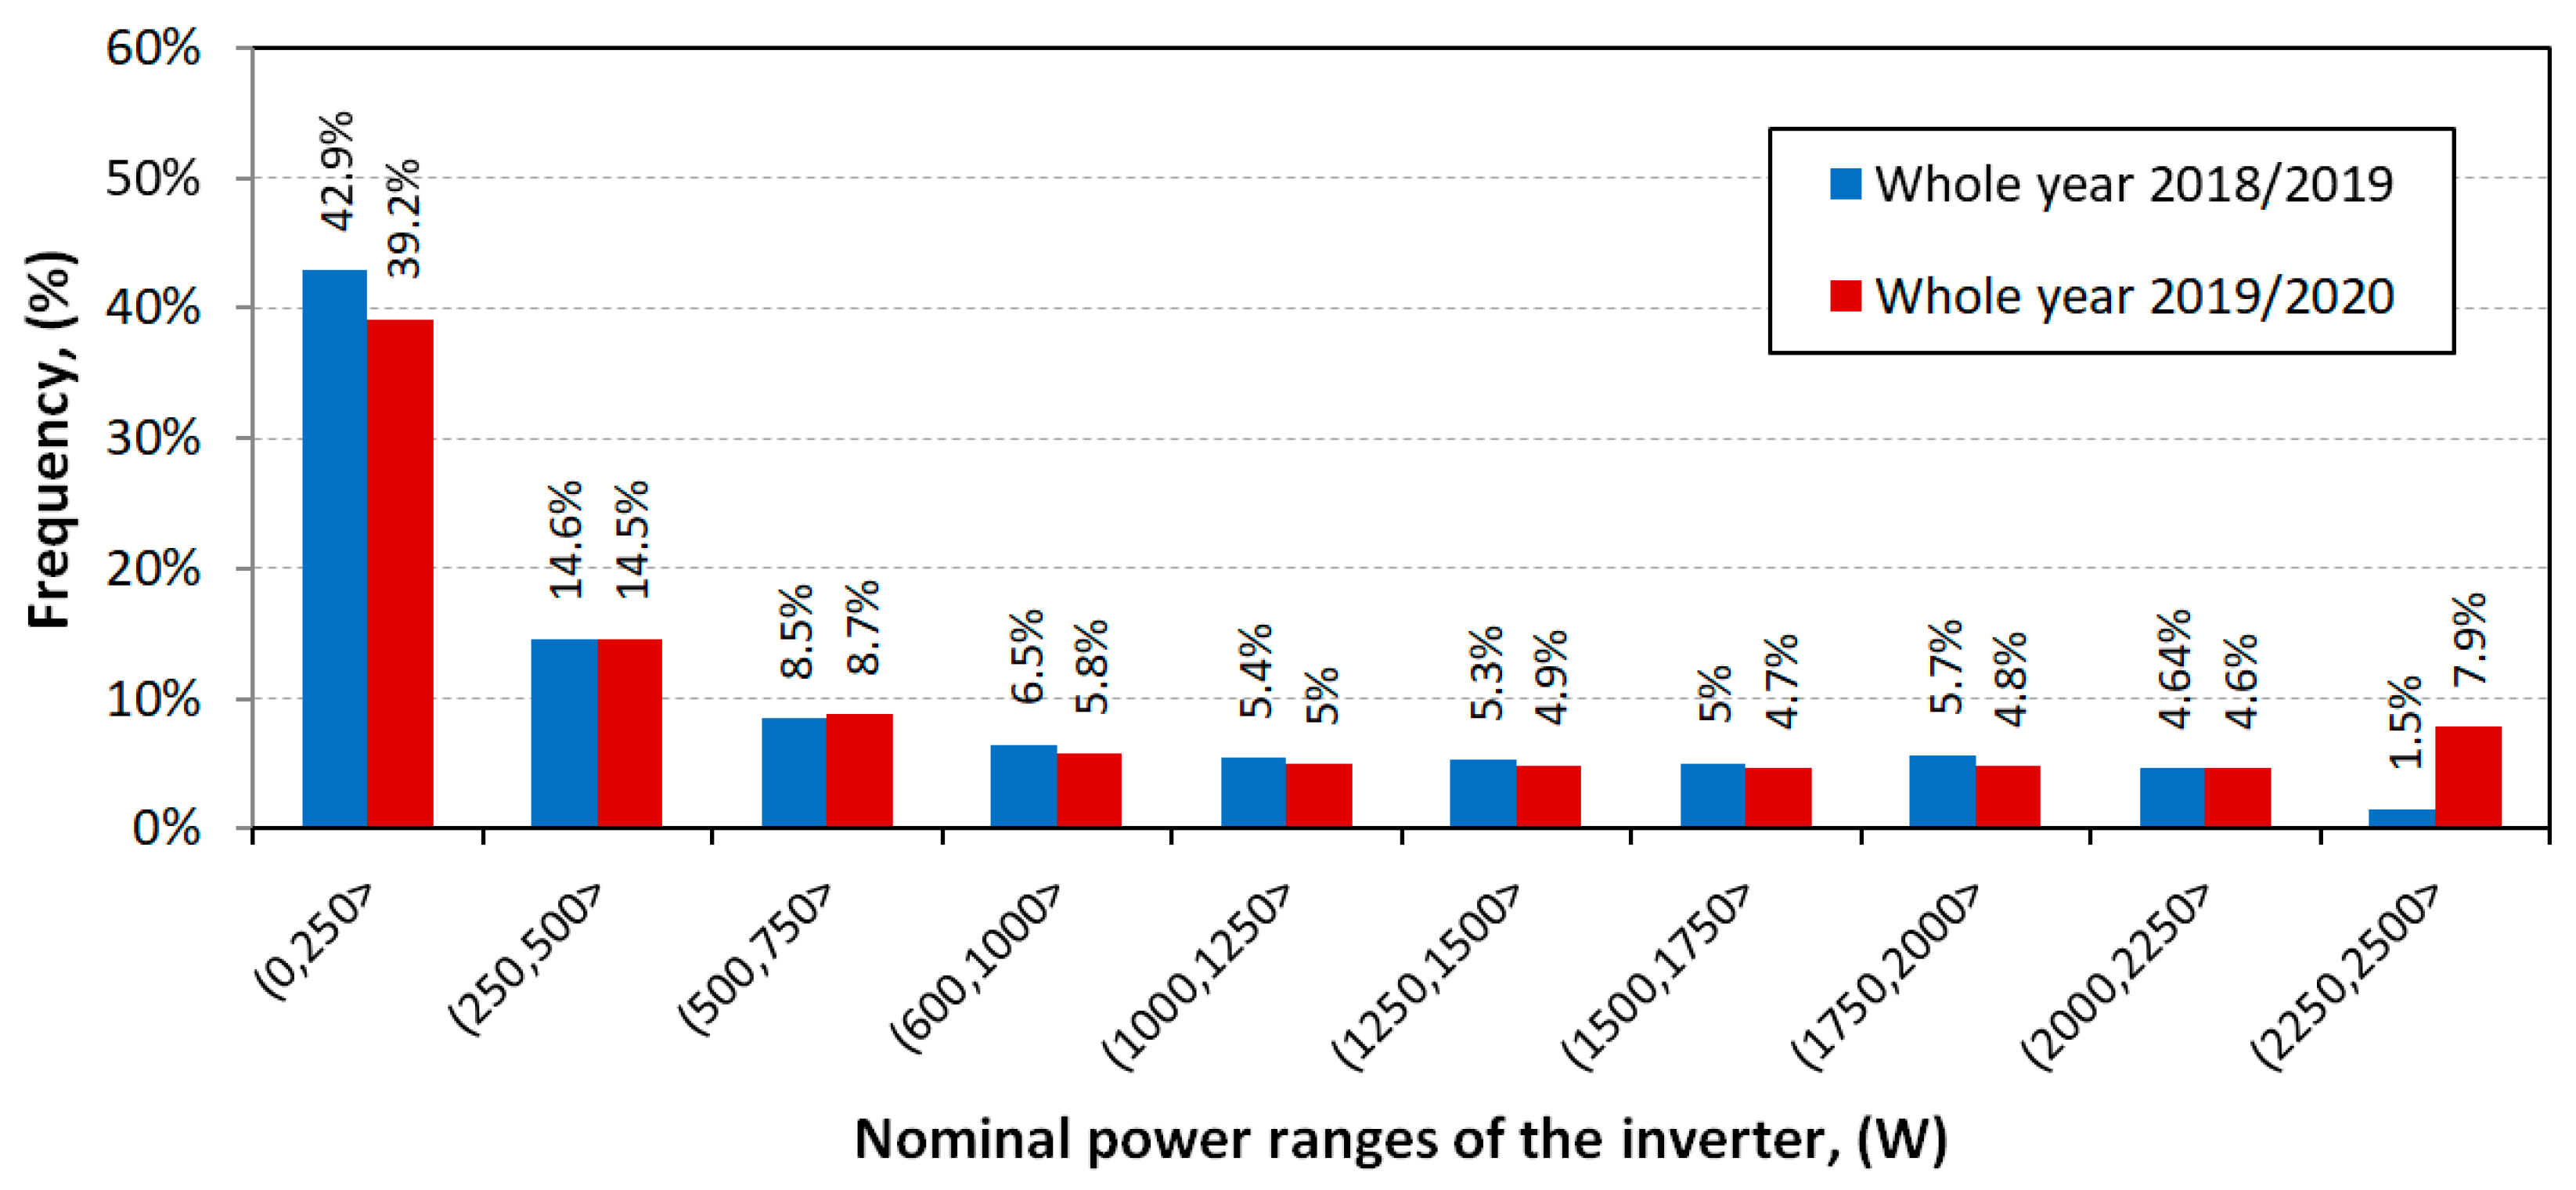
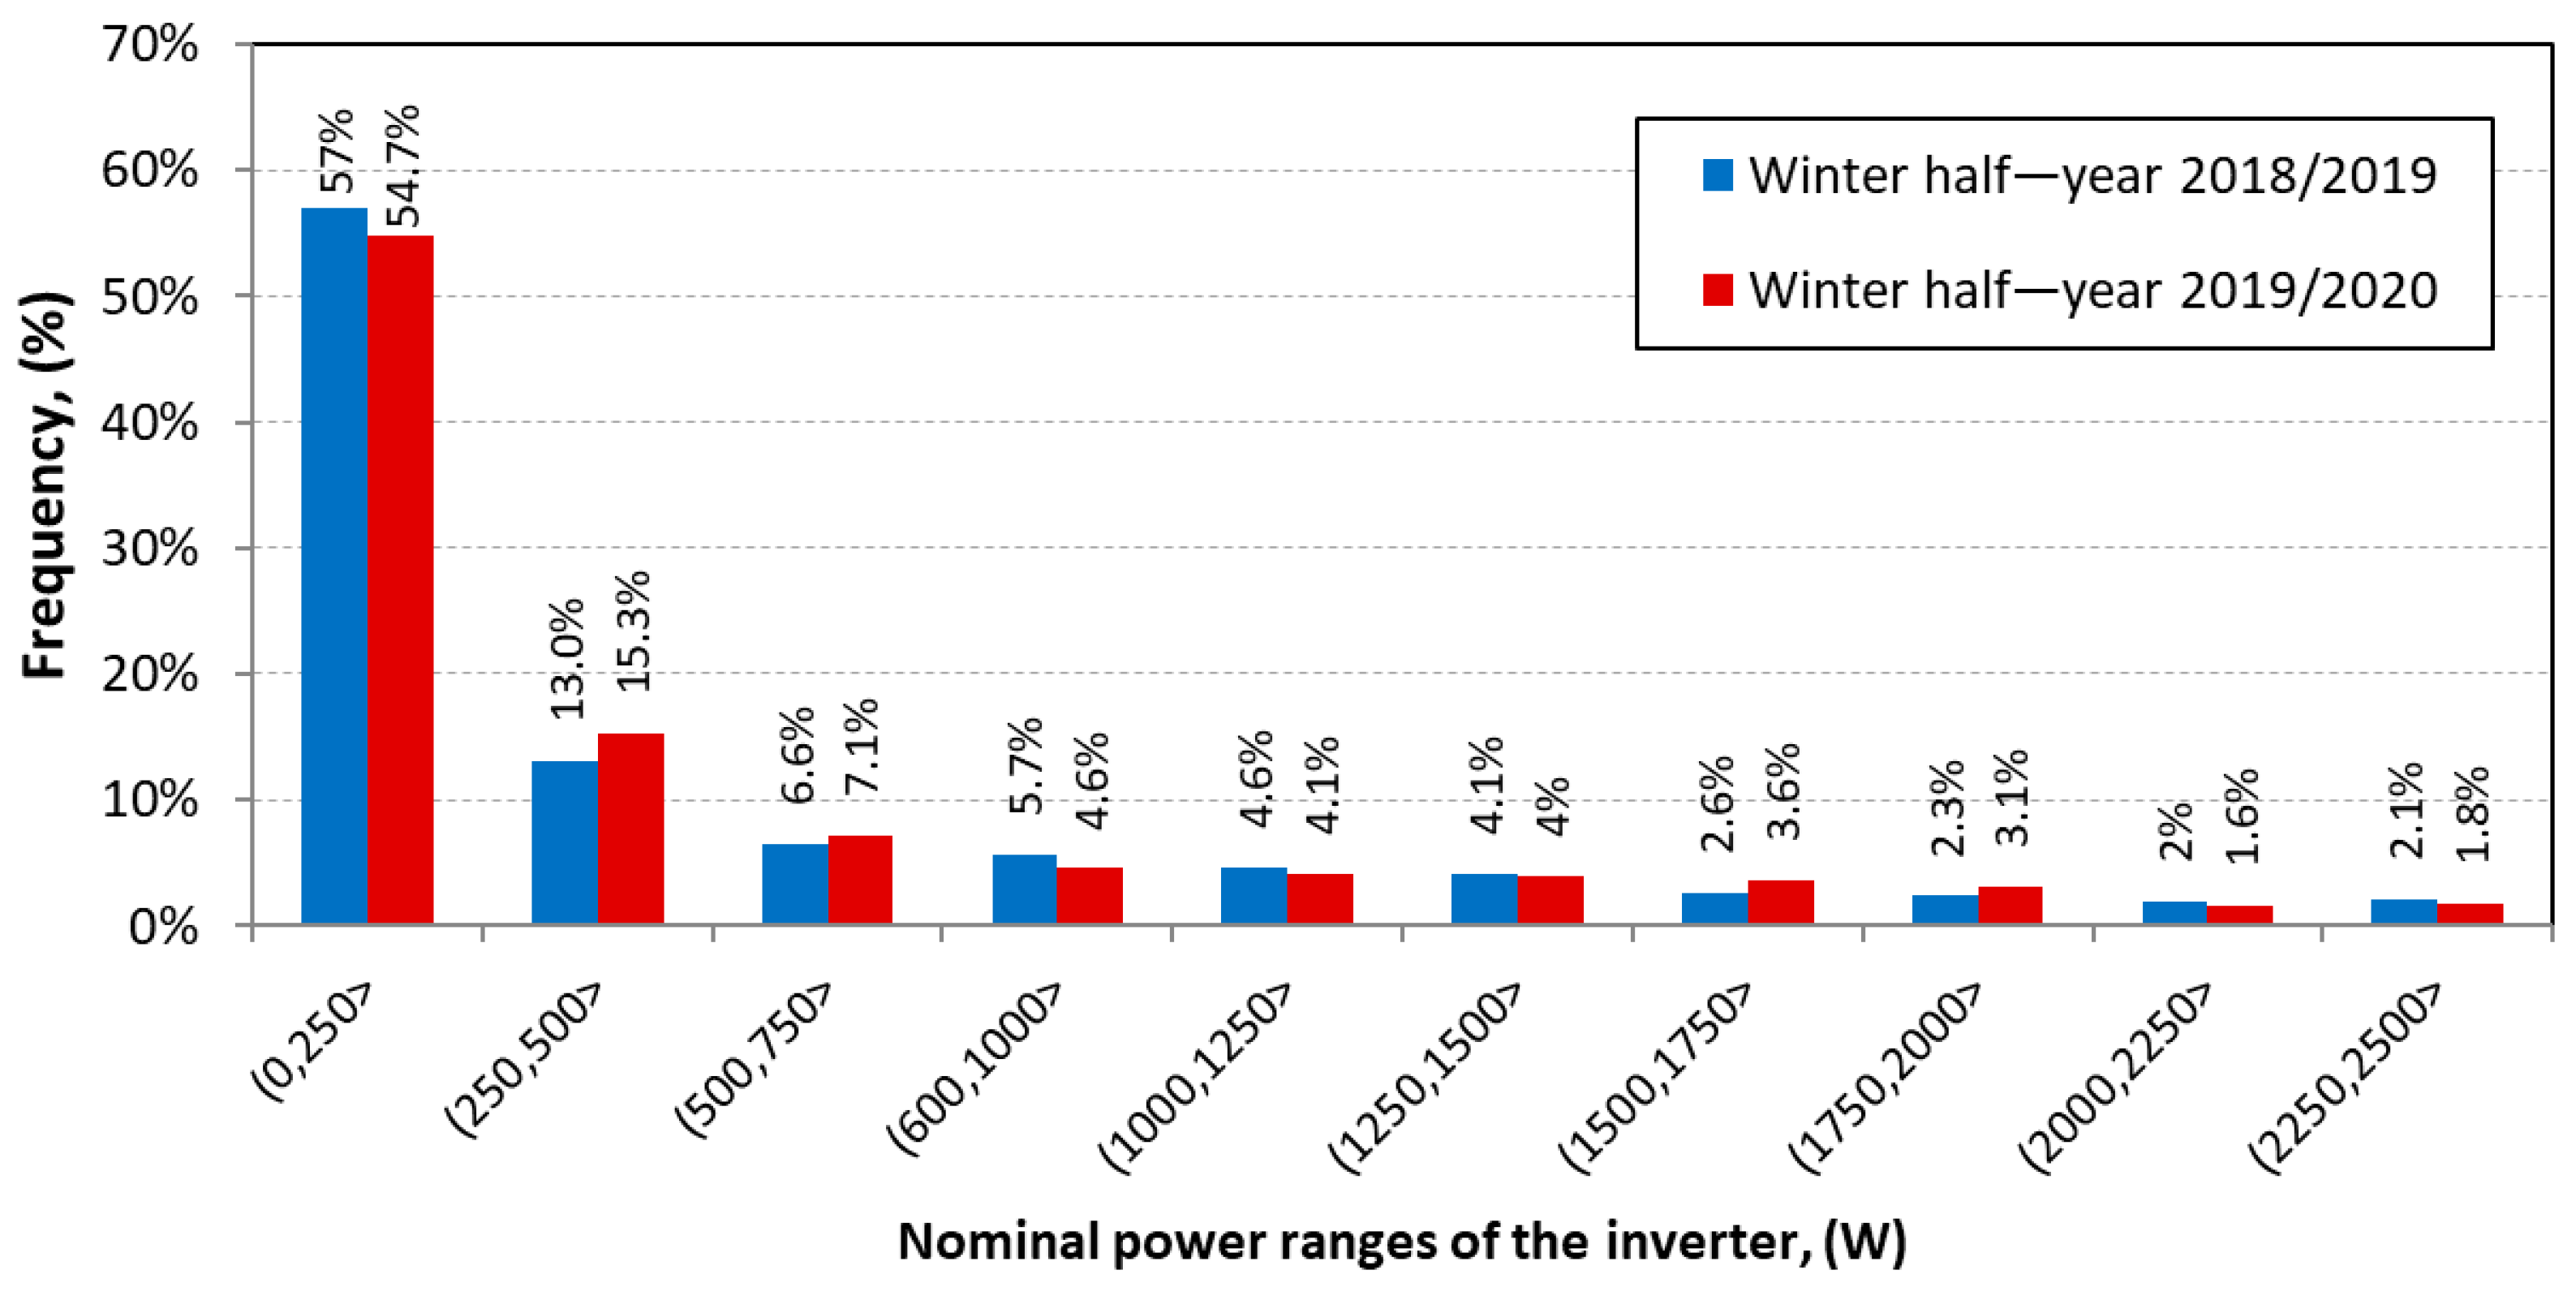
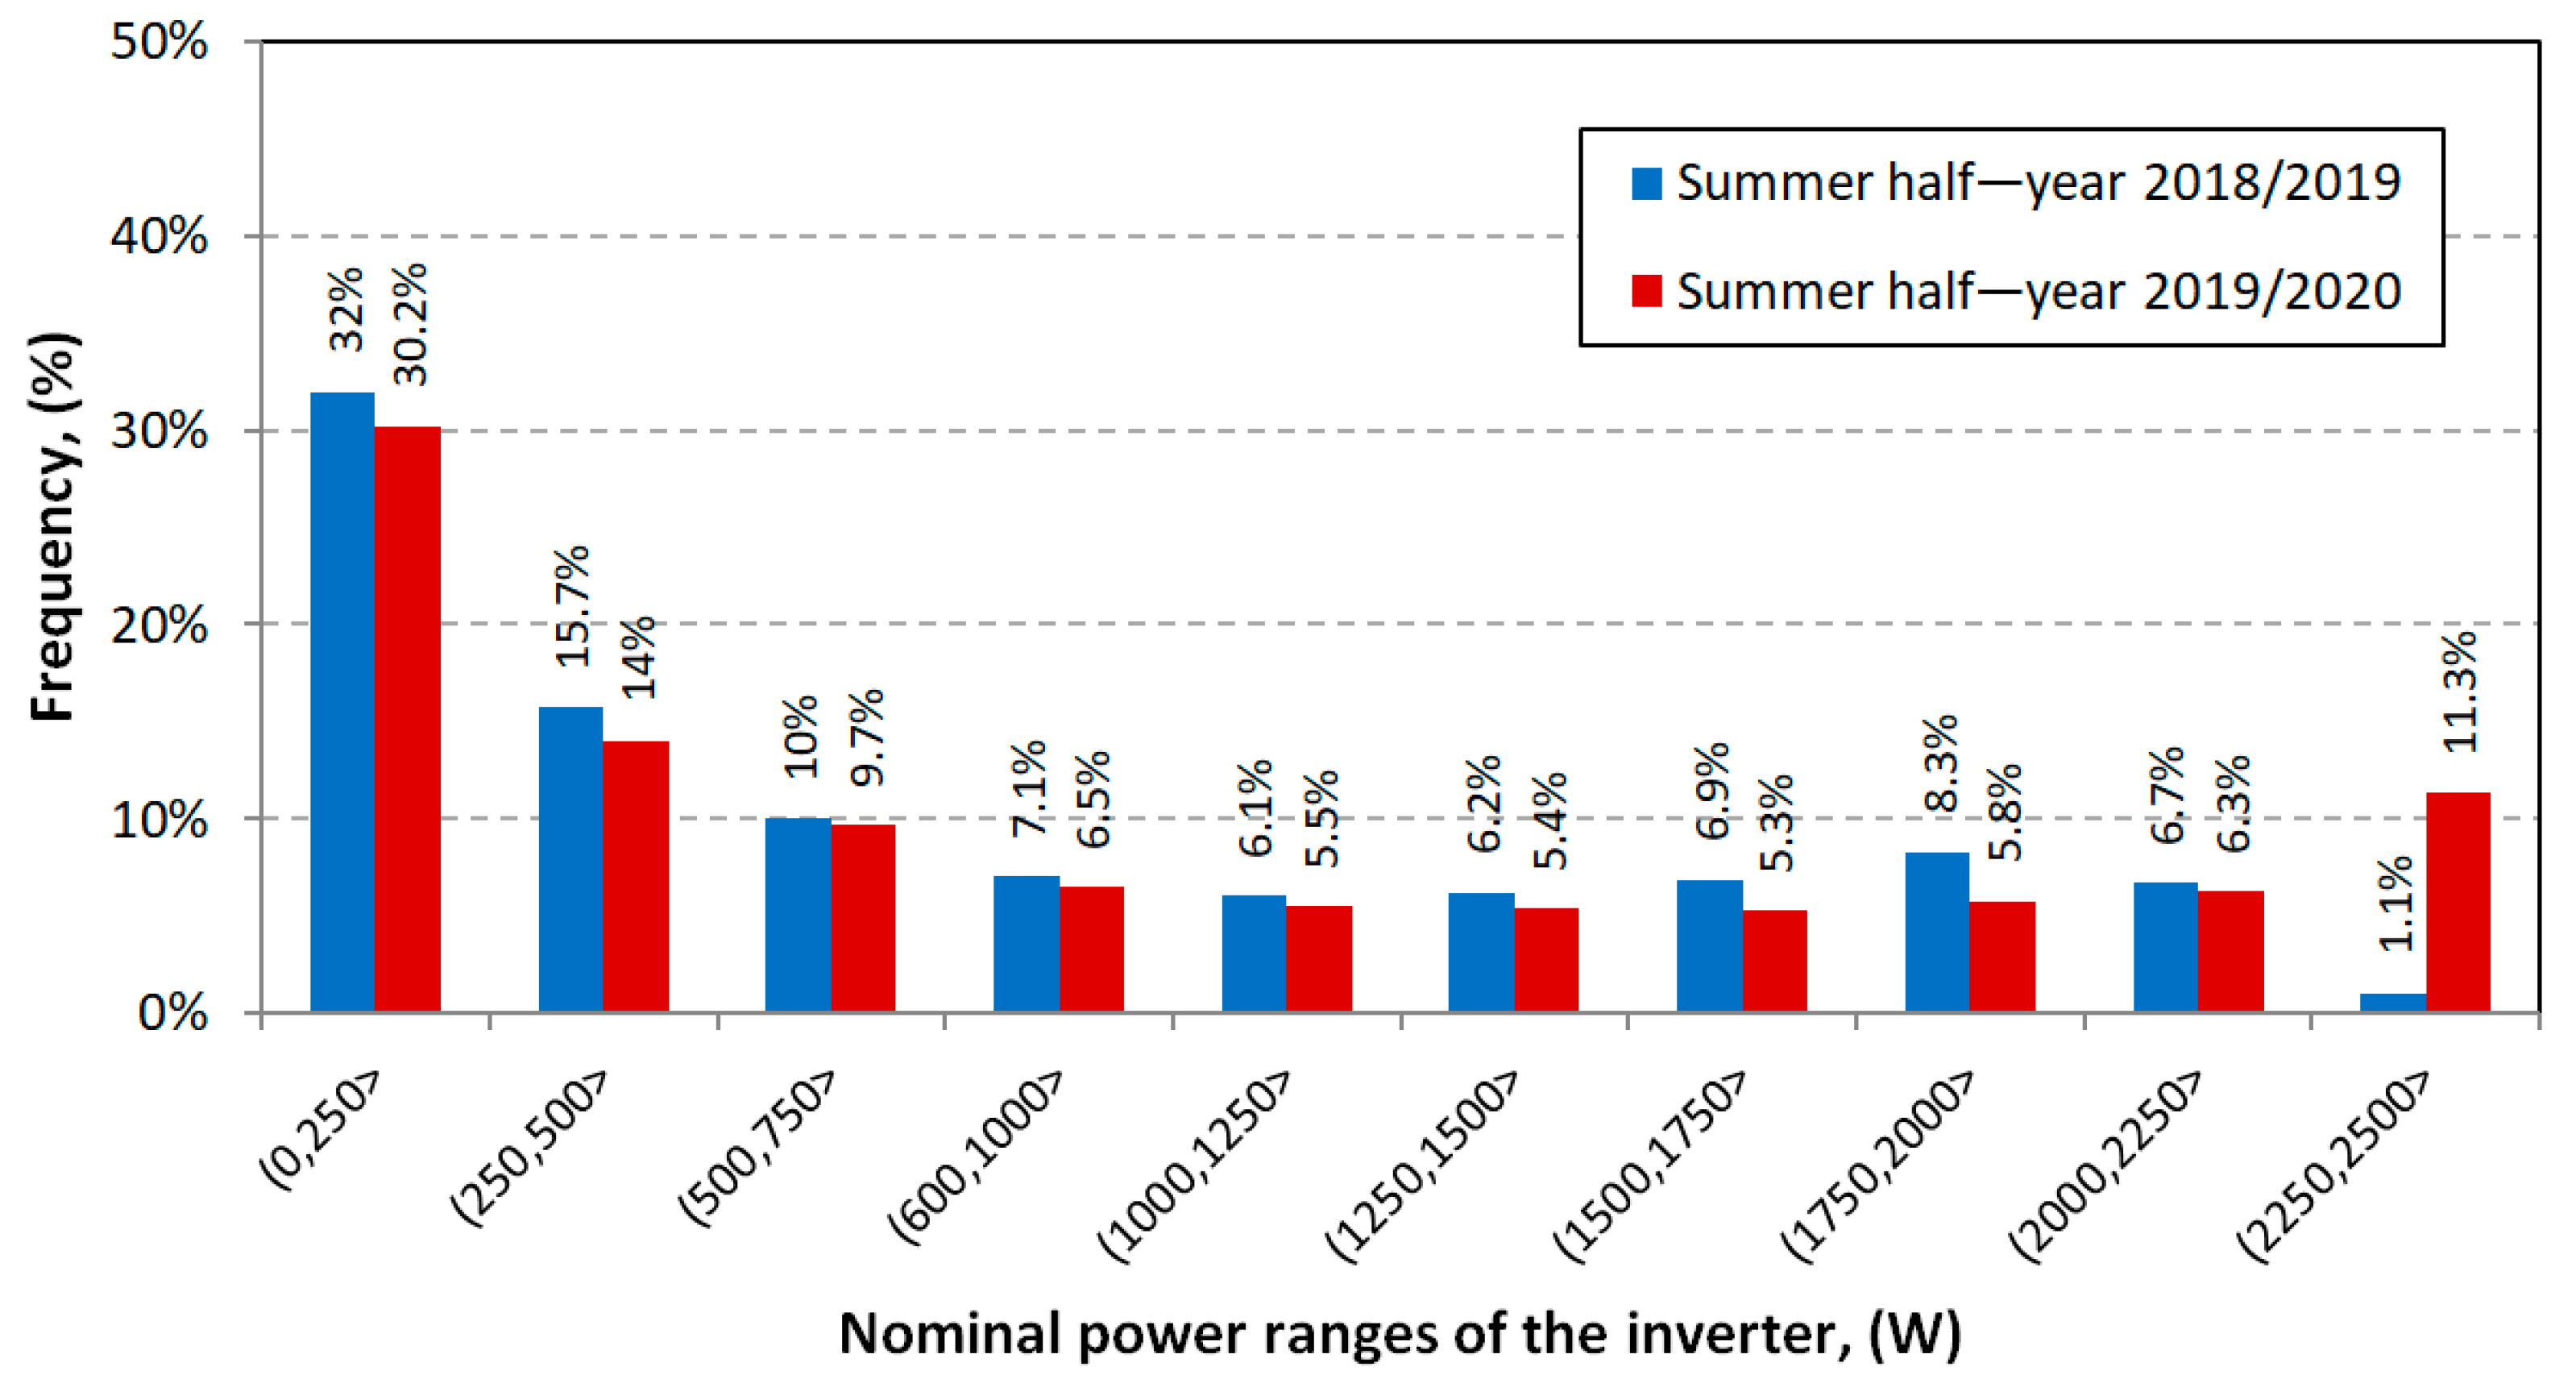
In
Figure 7,
Figure 8 and
Figure 9 are shown histograms of the PV inverter output power distribution for two considered whole years (
Figure 7), divided into winter (
Figure 8) and summer (
Figure 9) half-year. The nominal power of the PV inverter has been divided into ten class intervals. For each class interval, the frequency of occurrence of the averaged values of the inverter output power in five-minute ranges was counted. All daily CSV files (registered for two years) obtained from PV system monitoring were used for calculations.
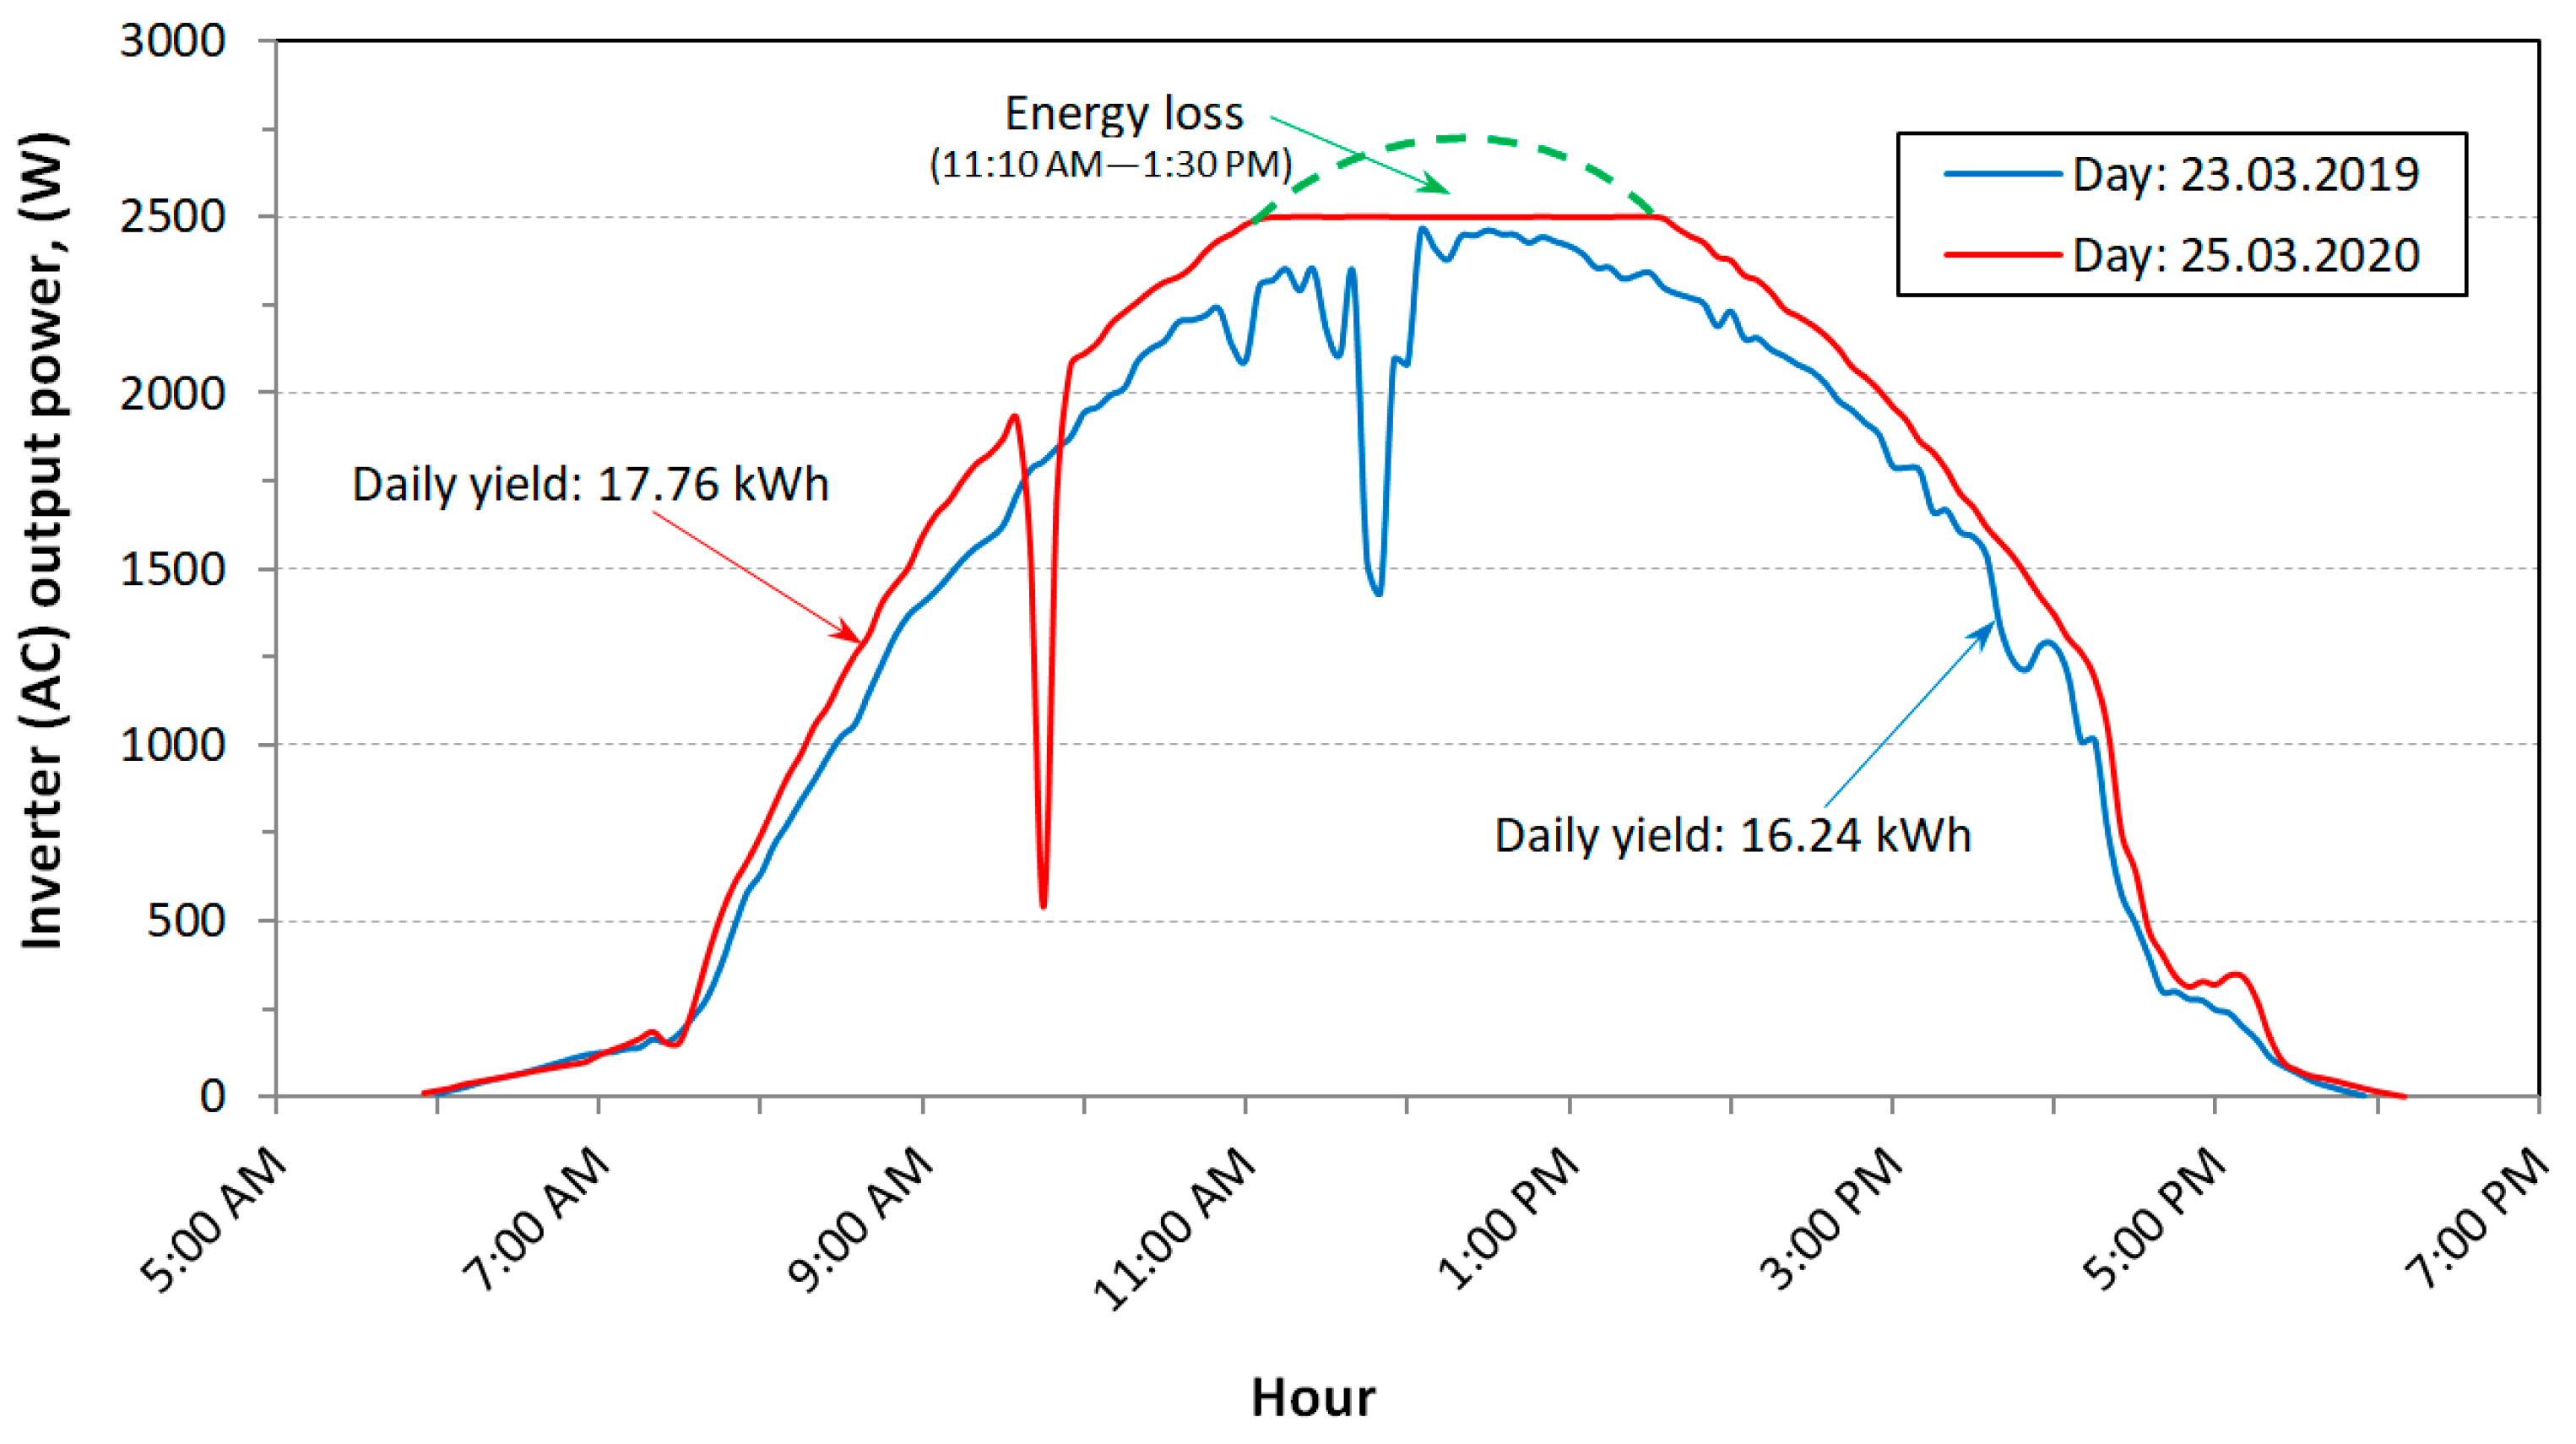
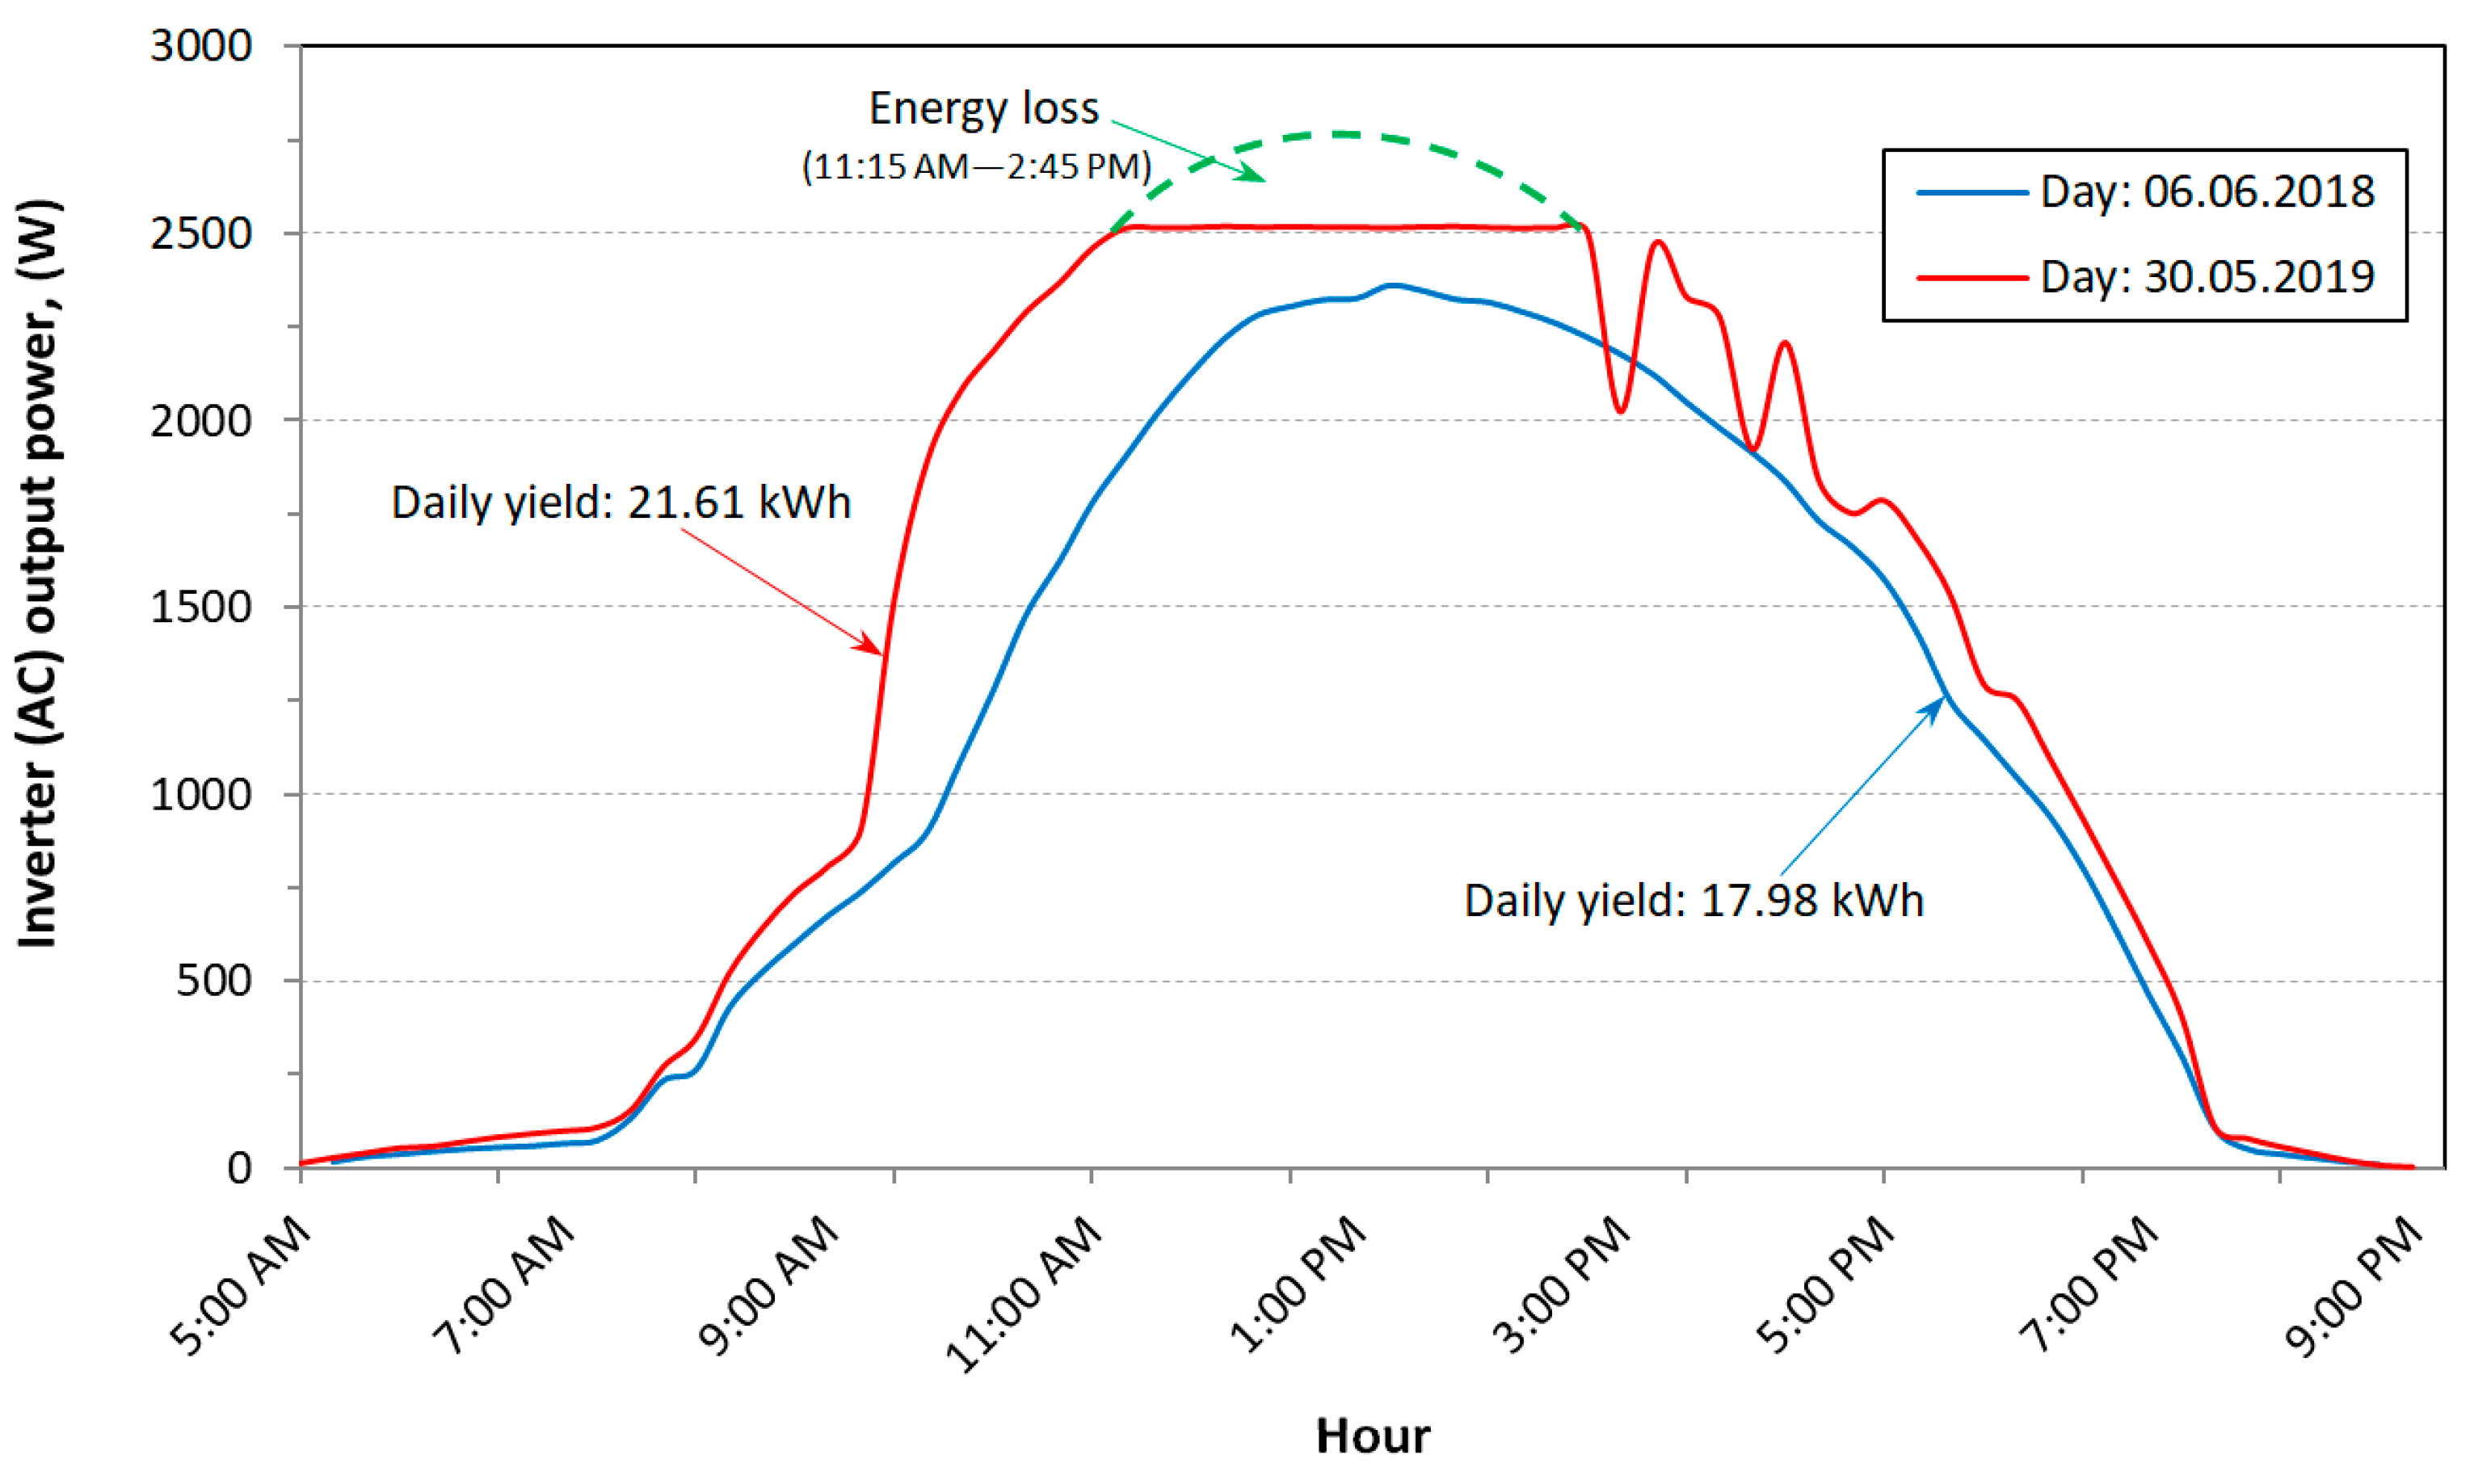
Figure 10 and
Figure 11 show examples of daily power charts of the output power of the PV inverter for two comparable periods (before and after changing the PV generator configuration) for two days of the winter half-year (
Figure 10), and the summer half-year (
Figure 11), with marked daily energy yields. These Figures also indicate potential energy losses resulting from the reduction of the output power of the PV inverter (in this case, up to 2.5 kW). Before the change of the
NPR coefficient (for ten pieces of PV modules), visible in
Figure 10 and
Figure 11, no energy losses were observed; after the change of the
NPR coefficient (for 12 pieces of PV modules), these losses occurred exactly on ten days during the year of observation. These losses are, therefore, marginal in relation to the benefits resulting from the improvement of the generator-inverter cooperation characteristics. In each case of losses, the total balance of generated energy was significantly higher. The indicator that quantitatively describes the energy losses resulting from the increase in oversizing of the PV generator in relation to the nominal power of the inverter is the relative yield of generated energy (
Figure 6).
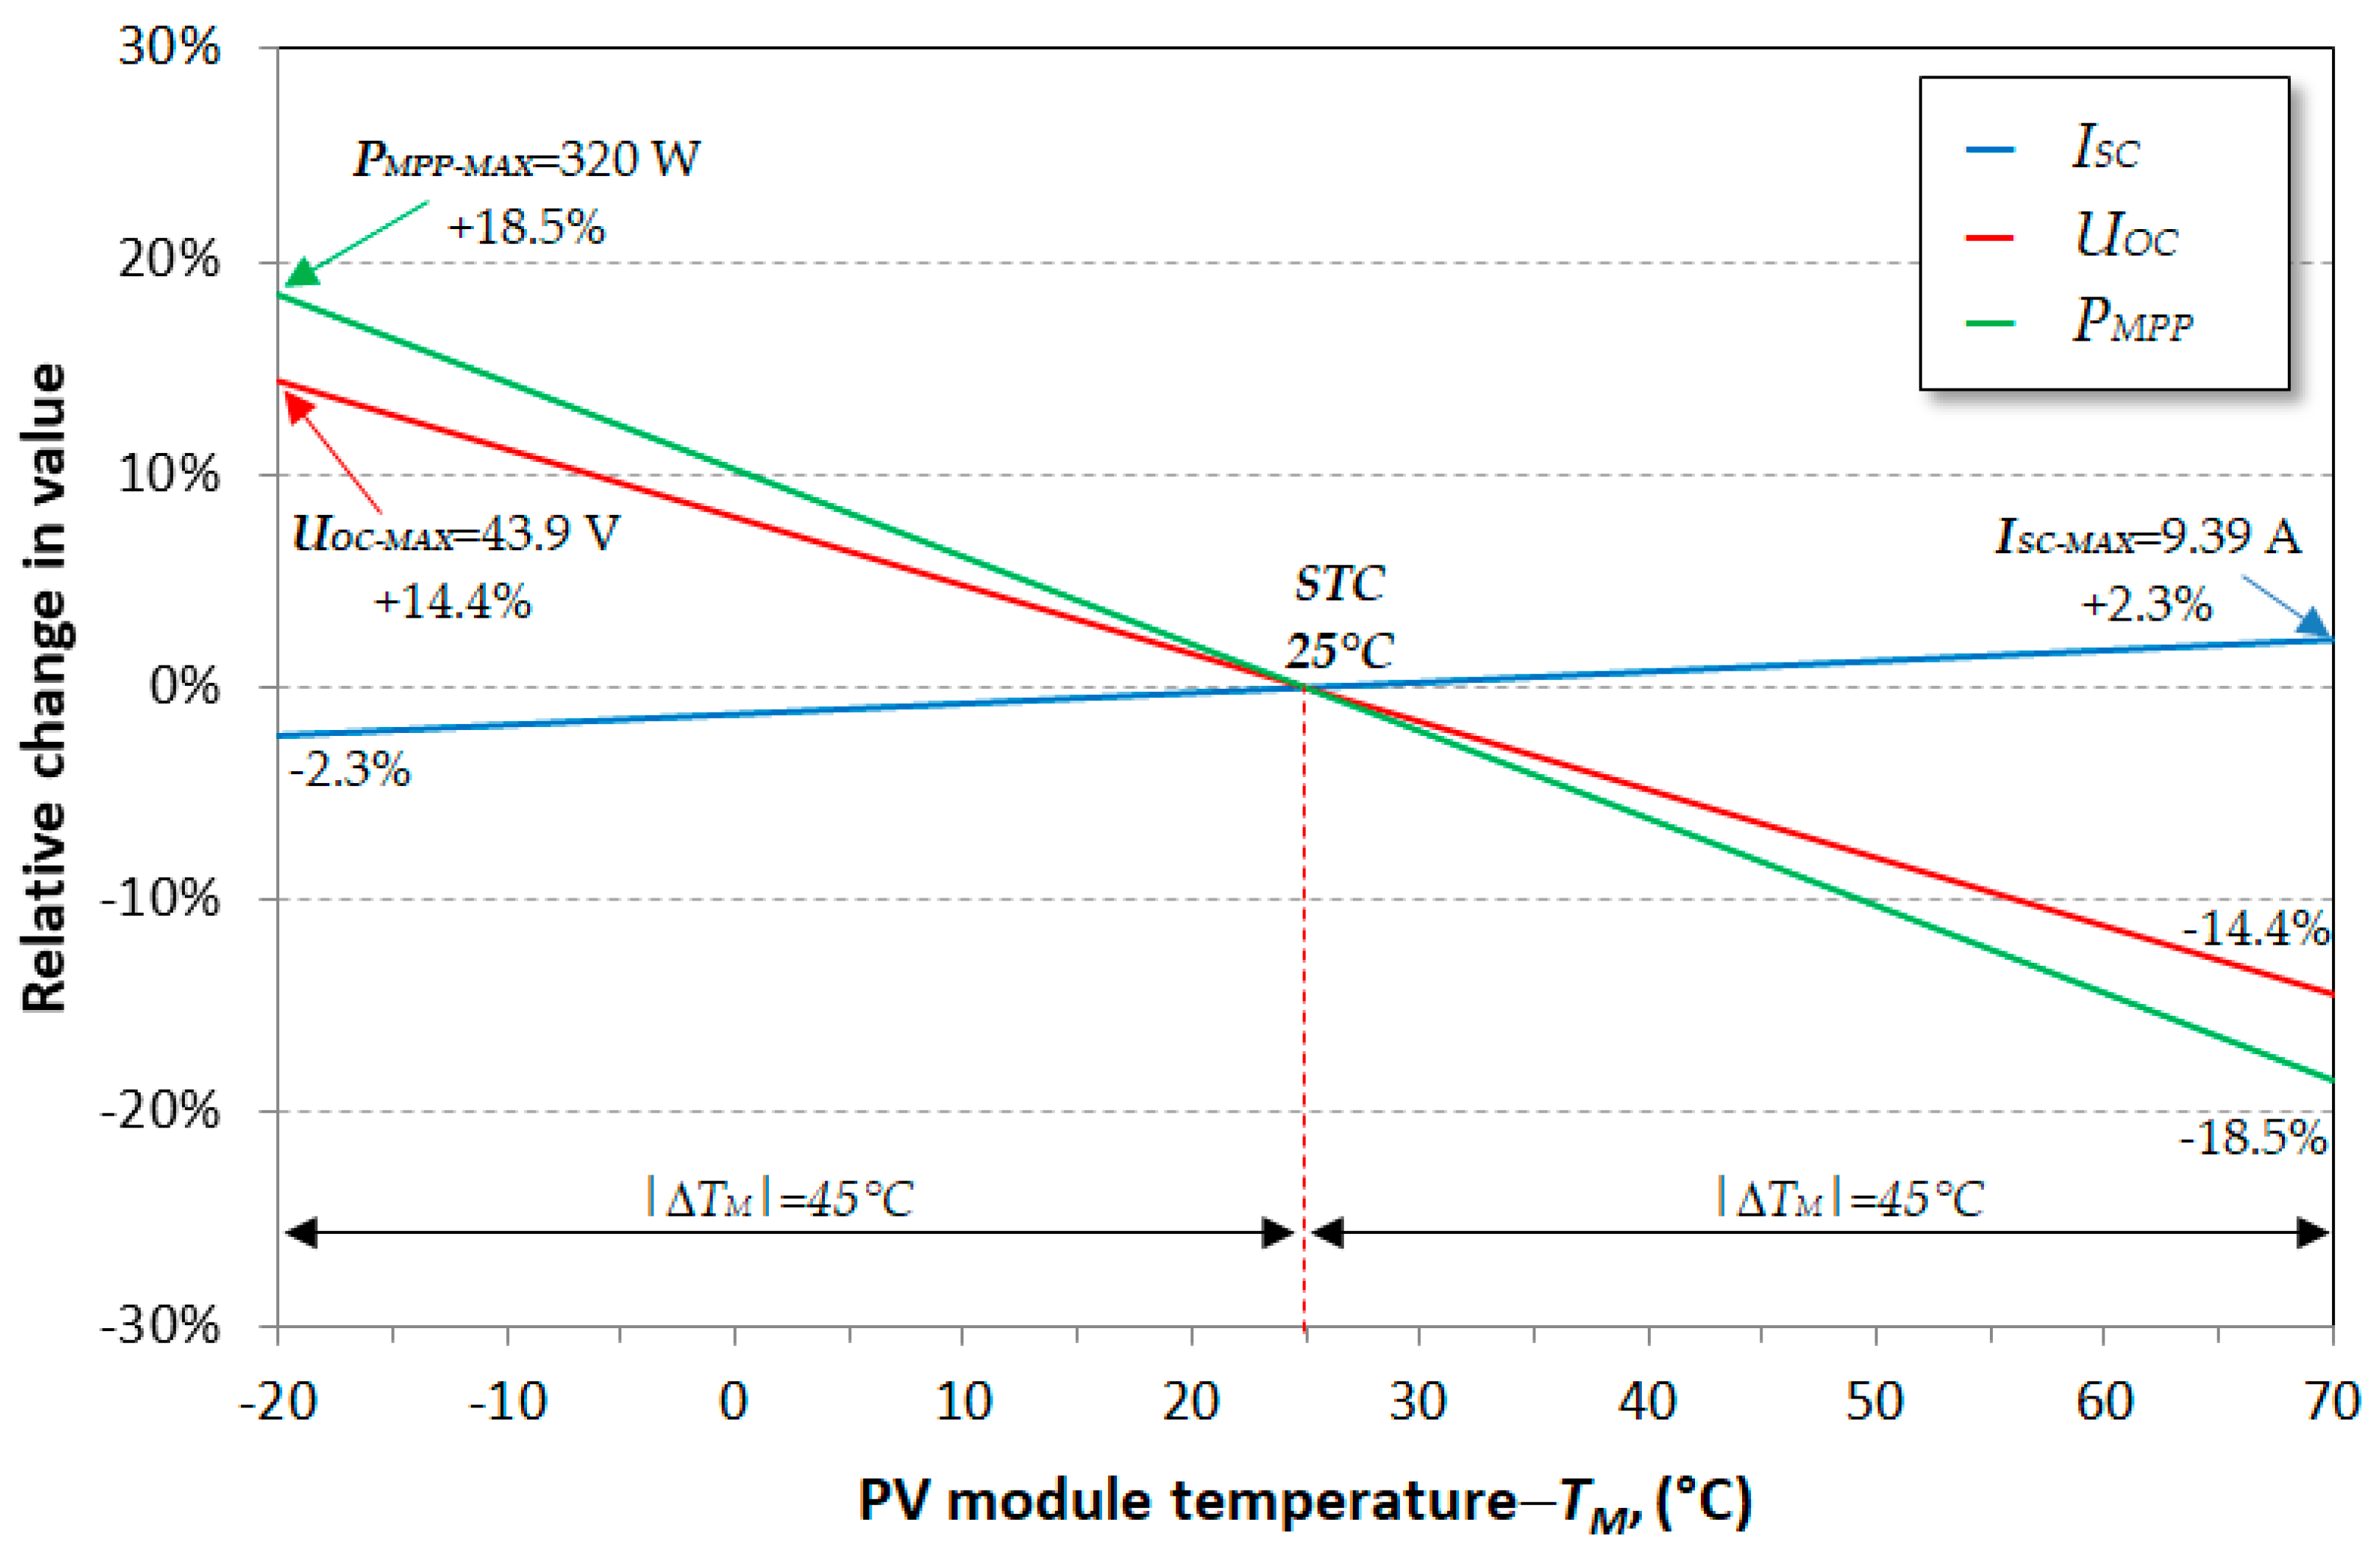
On the basis of the temperature coefficients (
αT,
βT,
γT in
Table 1) and Formulas (2), (3) and (4) provided by the PV module manufacturer, the allowable ranges of parameters in the permissible temperature range at the location of the tested PV system were determined. The results of these simulation calculations are shown in
Figure 12. Particularly dangerous are high voltage increases in installations at low temperatures when there is intense solar radiation. In the tested PV installation, such extreme conditions occur sporadically in early spring. The proportional linear relationships shown in
Figure 12 are, in fact, more complex as the local weather conditions ultimately decide.
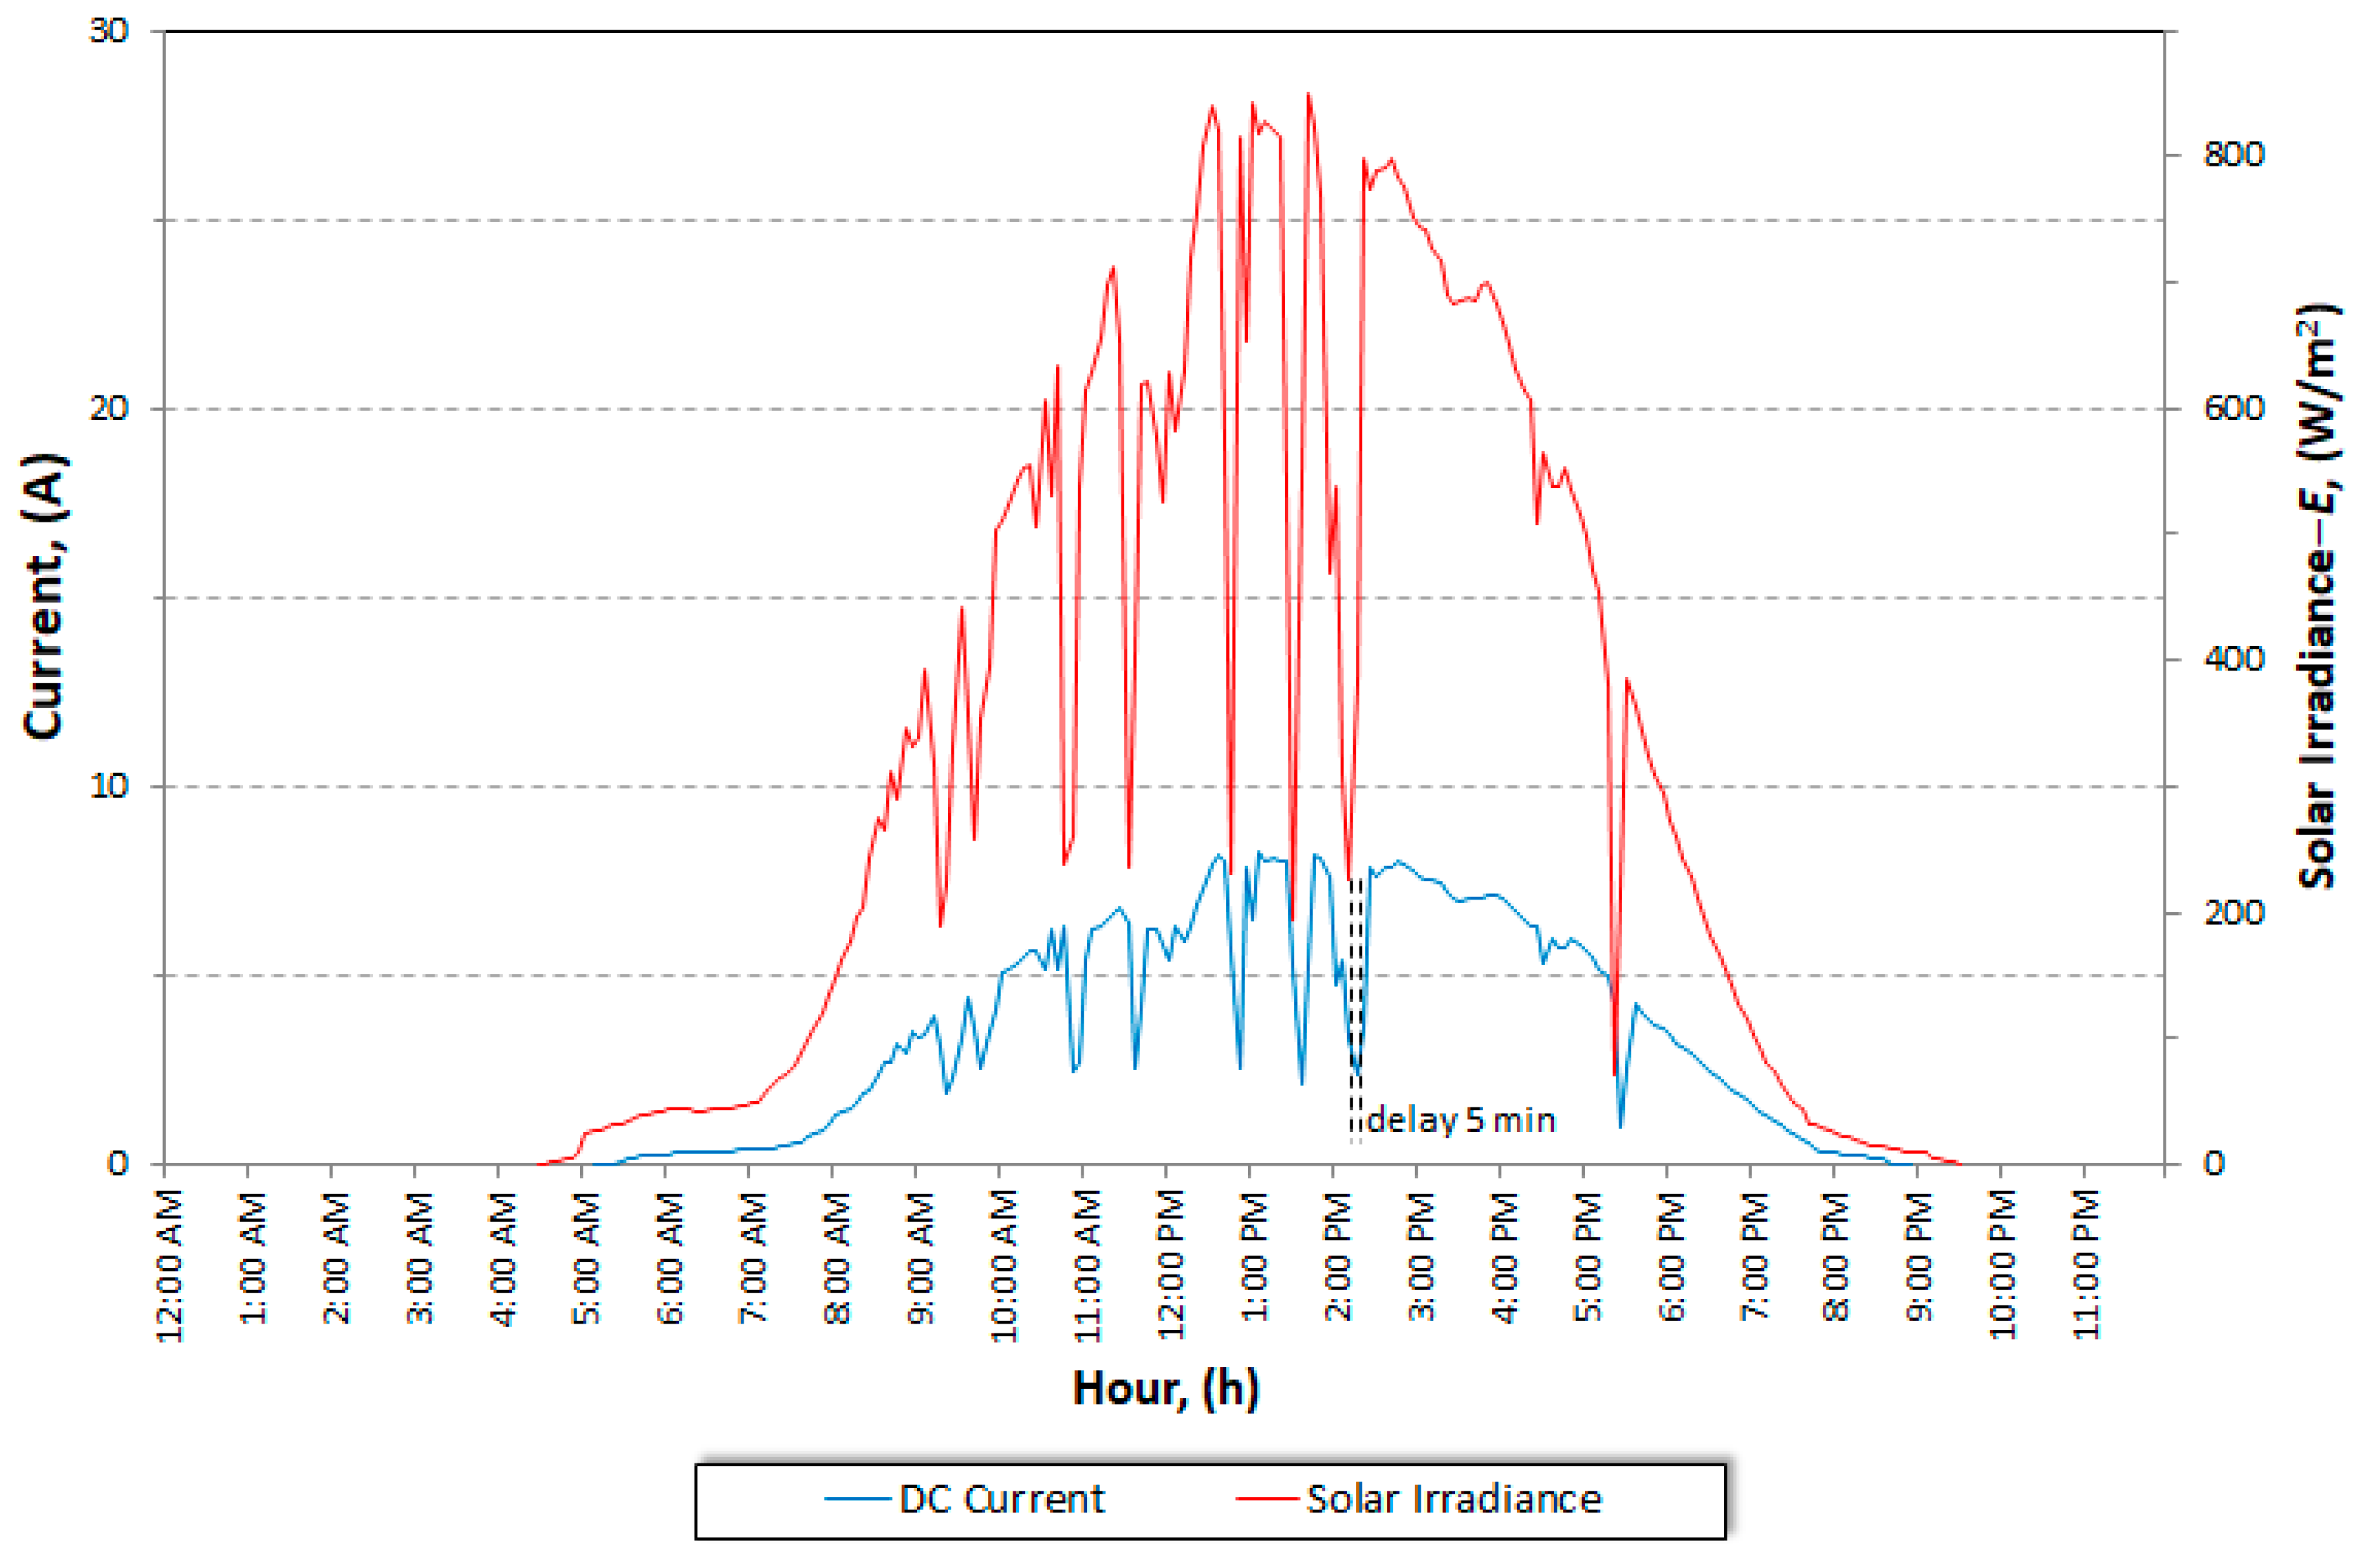
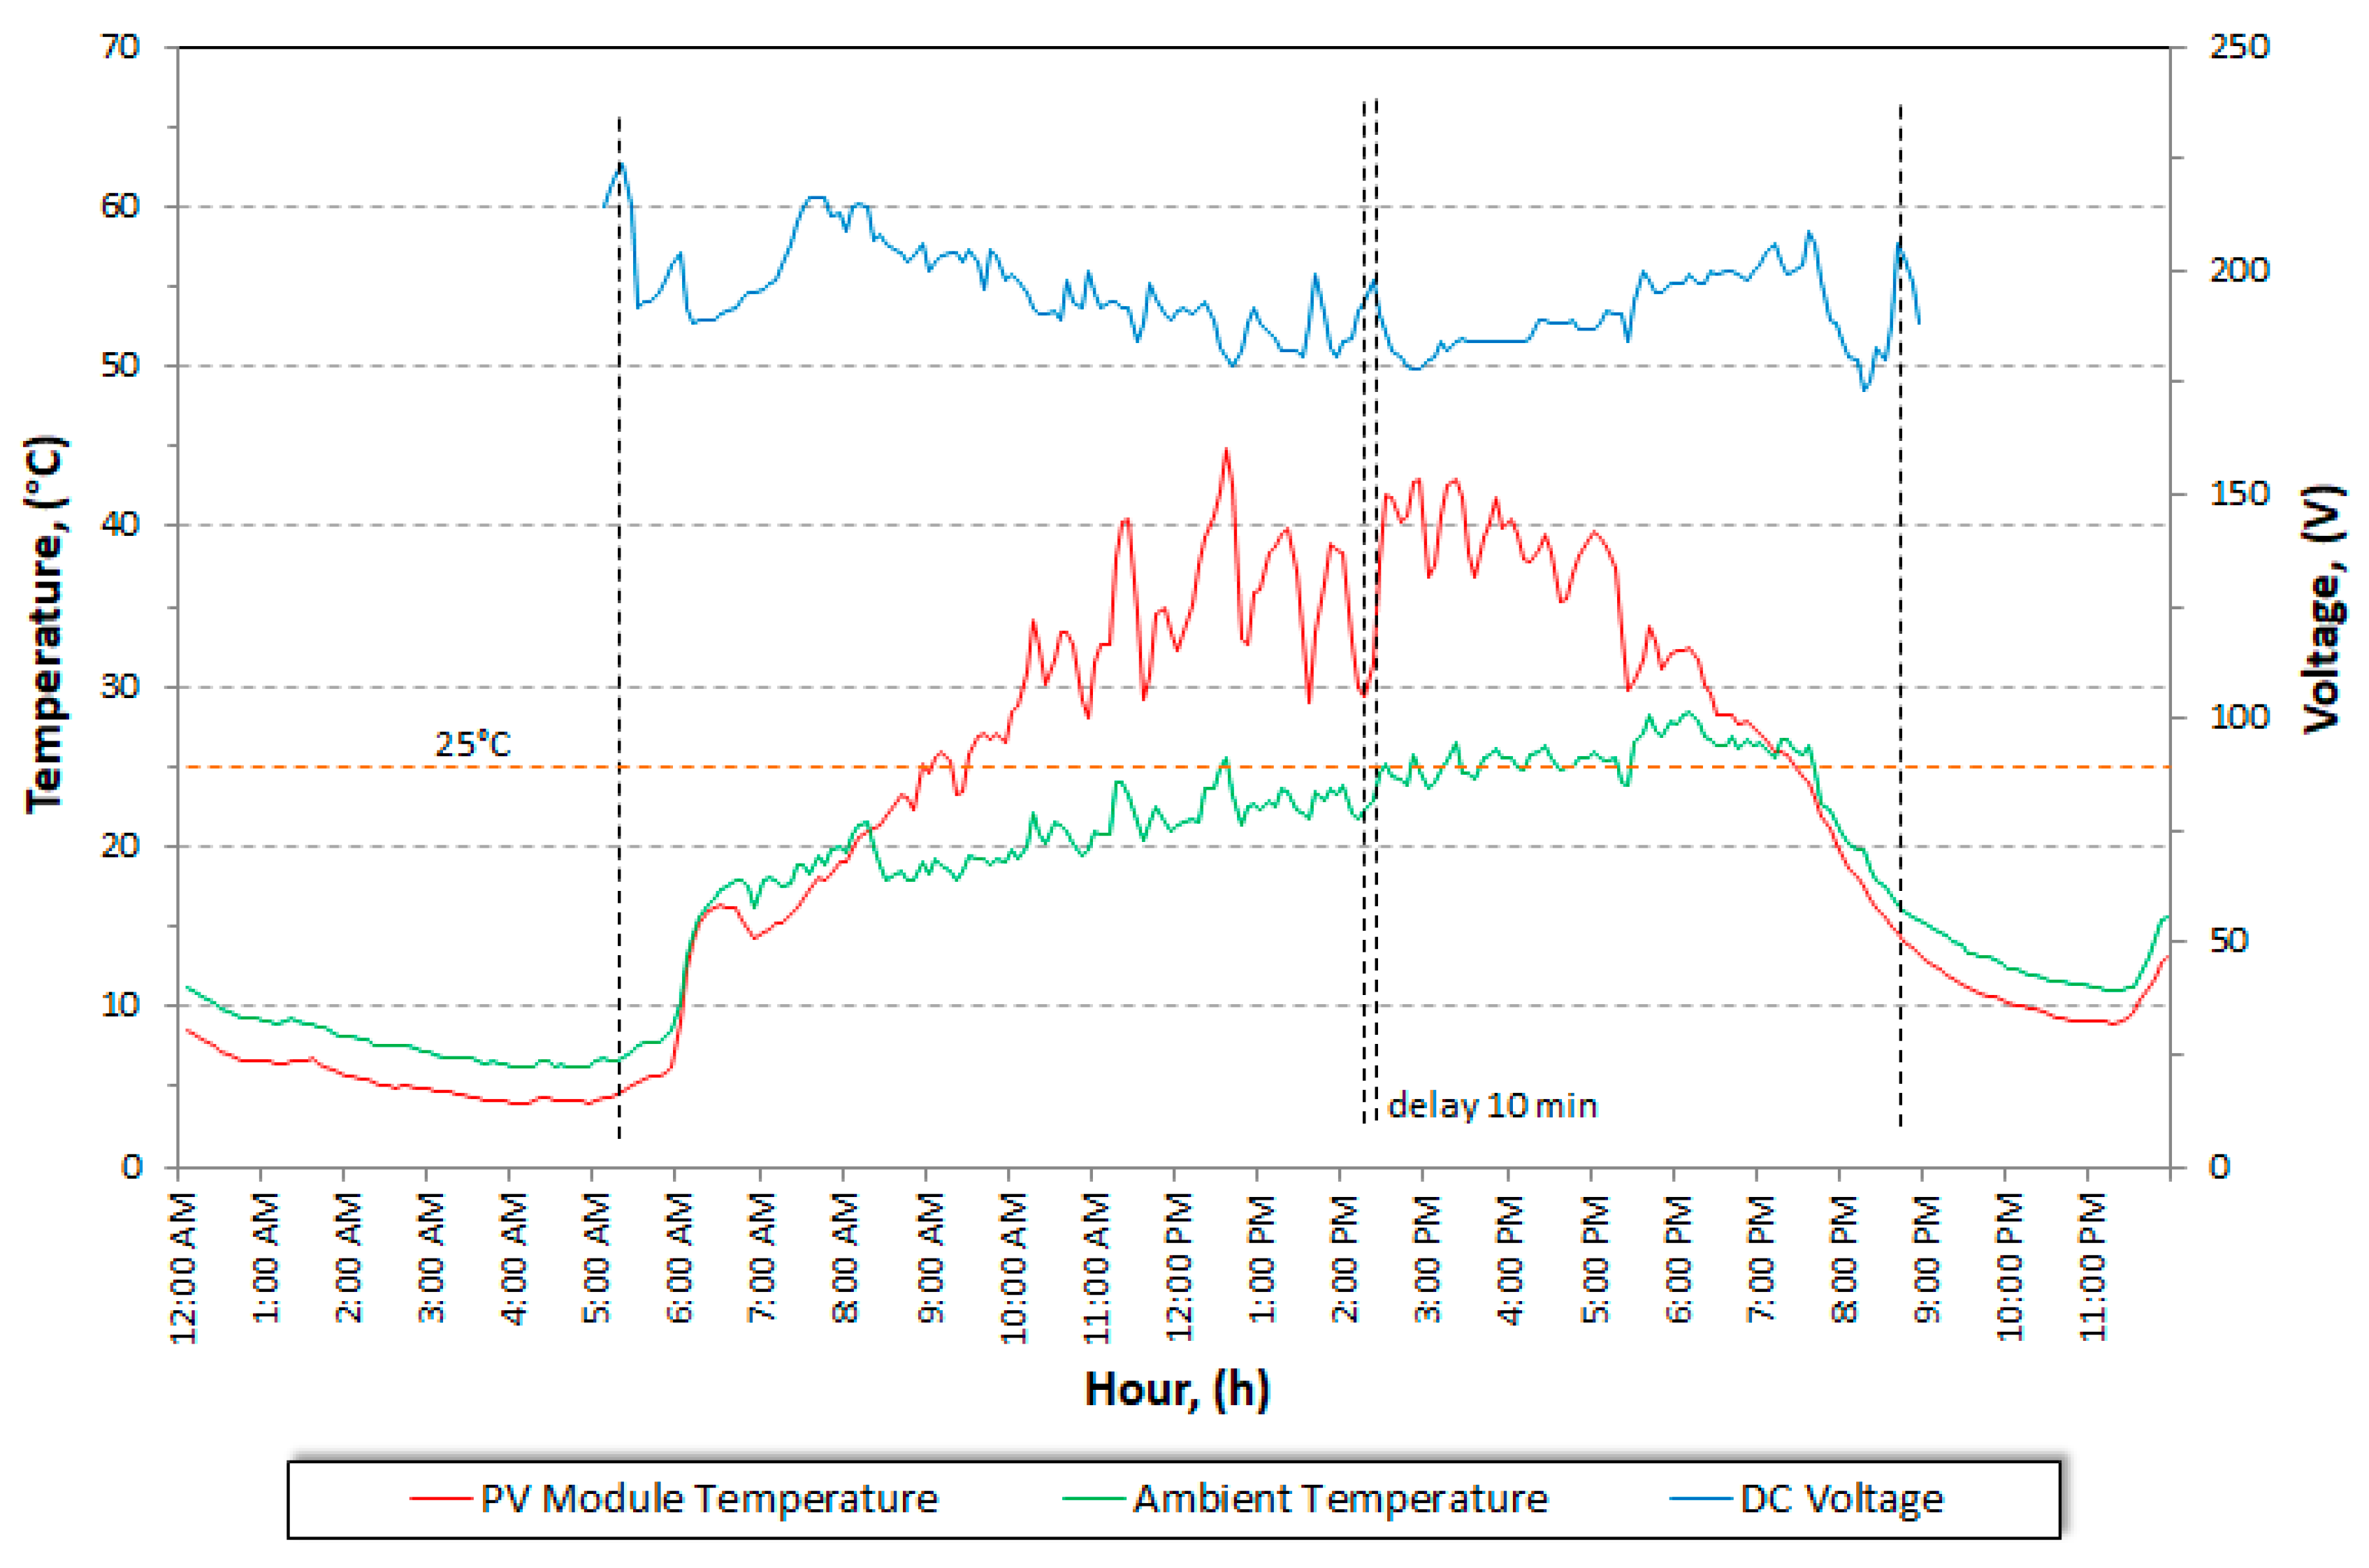
Figure 13 and
Figure 14 show the real impact of recorded weather parameters (solar irradiance, PV module temperature, and ambient temperature) on the values of DC current and DC voltage of the PV generator for the selected day 15 July 2019. The course of the curve for the intensity of solar radiation (
E) has a shape similar to the DC current curve of a PV generator (
Figure 13). The delay of the recorded DC current signal in relation to the intensity of solar radiation is about 5 min (this is the accuracy of the measurement recording system).
Figure 14 shows the real effect of the PV module temperature (
TM) on the DC voltage of the PV generator. In this case, the temperature drop of the PV module causes a DC voltage increase with a delay of about 10 min. You can also observe an interesting phenomenon during sunrise and sunset, consisting of an increase in DC voltage due to the cooling of PV modules (ambient temperature higher than the temperature of PV modules).
The simulation tests carried out in this work can be repeated for the same input parameters. In the case of verification studies, only a case study is presented due to the different observation periods of PV plant monitoring data. For the full verification of the scope of simulation studies, there was also no verification for the generator consisting of eleven PV modules (for NPR = 89%).
4. Discussion and Conclusions
Comparison of simulation results and data analysis from PV system monitoring for two variants of PV generator configuration show that the annual yields of generated energy increased (
Figure 4 and
Figure 6), but the annual relative yields are smaller (
Figure 4 and
Figure 7). Two extreme PV system configuration cases were verified for a generator built of ten and twelve PV modules for which the nominal power ratio (
NPR) value was 98% and 82%, respectively (
Table 3). Moreover, the performance ratio (
PR) of the PV system was lower for a generator built of twelve PV modules (
Figure 3). The explanation of the reason for this is shown in
Figure 11 and
Figure 12, where potential energy losses are highlighted. However, one should not be guided by these losses, because they occur very rarely (several hours throughout the year). Higher annual yield and longer full load time are, in this case, the factors determining the superiority of the generator variant built from twelve PV modules. The additional argument may be the fact that PV generators have an average annual power drop of around 0.8%, and that in the event of damage to one module, the PV generator can continue to operate without it (especially when there are no longer these PV modules on the market).
Histograms of the PV inverter output power presented in
Figure 8,
Figure 9 and
Figure 10, show a clear decrease in the frequency of the inverter in the smallest power range (0–250 W). The operating frequency also increased significantly in the largest range of PV inverter output power (2250–2500 W), especially in the summer half-year. The inverter used in the PV system achieves efficiency close to the maximum (97.2%—
Table 2) only after exceeding 500 W of output power. The increase of the PV generator power in relation to the nominal input power of the inverter must be preceded by the analysis of the generator voltage and current parameters in extreme weather conditions. The advantage of enlarging the PV generator by two modules was also the extension of the inverter operation time at maximum power, especially in the summer half-year (
Figure 9).
The energy losses shown in
Figure 10 and
Figure 11, which were not used by the PV inverter, were confirmed in verification tests in the form of a decrease in the relative energy yield by 36 kWh/kW
p, and the losses of relative energy yield calculated as a result of simulation tests were smaller and amounted to only 9 kWh/kW
p (
Figure 6).
The temperature coefficients provided by the producers of PV modules only determine the values of extreme points on the current-voltage characteristic. The actual impact of weather parameters can only be observed when observing weather parameters during the operation of the PV system. The intensity of solar radiation affects the current intensity of the PV generator proportionally, and the temperature of the PV module affects the voltage of the PV generator inversely. The current intensity of the PV generator also determines the distribution of its power, and the voltage remains fairly stable.
In the considered PV system, due to the operating conditions of prosumer installations in Poland, increasing the power of this PV system is profitable for the investor only up to a peak power of about 4.2 kWp (assuming a minimum relative yield of 1000 kWh/kWp). For the two considered cases of peak power of 2.7 kWp and 3.24 kWp, in the Sunny Design application, the estimated payback time and obtained results were 6 and 7 years, respectively. A further increase of the installed capacity would be justified only in the case of a planned increase in the load power.
In the future, it is also worth considering the use of a home energy storage system that will work with the PV system in the electrical installation of a residential building. This solution will eliminate losses resulting from the transmission and receipt of energy from the operator’s grid. Based on simulation calculations, this solution will unfortunately extend the payback time to around 15 years. Currently, with the net metering system in Poland (power grid as virtual energy storage), this solution is unprofitable, and it can only be justified if it is necessary to provide continuous power (UPS function).
The future in the field of PV installation monitoring should aim at the integration of electrical parameter monitoring with video monitoring and local energy management systems with storage options. In addition, these data should be analyzed by the artificial intelligence subsystem, which would diagnose any irregularities and order operational activities (e.g., washing PV modules or replacing a damaged module in a string).


