New Market Model with Social and Commercial Tiers for Improved Prosumer Trading in Microgrids
by
 , , ,
, , ,
Bogdan-Constantin Neagu
* ,
,
Ovidiu Ivanov
 ,
,
Gheorghe Grigoras
 ,
,
Mihai Gavrilas
and
Dumitru-Marcel Istrate
Department of Power Engineering, Gheorghe Asachi Technical University of Iasi, 700050 Iasi, Romania
*
Author to whom correspondence should be addressed.
Sustainability 2020, 12(18), 7265; https://doi.org/10.3390/su12187265
Submission received: 13 August 2020
/
Revised: 30 August 2020
/
Accepted: 2 September 2020
/
Published: 4 September 2020
(This article belongs to the Special Issue Efficiency and Sustainability of the Distributed Renewable Hybrid Power Systems Based on the Energy Internet, Blockchain Technology and Smart Contracts)
Abstract
:In the deregulated electricity markets, trading prices are determined by the offer-demand mechanism, and retail consumers can negotiate tariffs with their supplier of choice. For classic wholesale suppliers, the tariffs are determined by the prices of transactions performed on the wholesale market. In parallel with becoming eligible for participating in the market, the consumers use increasingly local generation sources based mostly on renewable electricity generation equipment such as Photovoltaic (PV) panels, and become prosumers. They want to be able to sell back to the market the generation surplus, in order to obtain the maximum benefits from their initial investment. This paper proposes a two-tier local market model oriented for prosumers and consumers connected in microgrids, based on the blockchain technologies and other technologies and concepts such as smart grids, crowdsourcing and energy poverty. Its goals are to improve the possibilities of local prosumers to sell electricity to local consumers and to increase their profitability, compared to the trading model often used in developing markets, of selling the surplus back to the grid via aggregators. The research aims to contribute to the sustainable development of the electricity sector using new and renewable sources of energy, state-of the art technologies and smart contracts, leading to prosumer proliferation and electricity cost reduction for consumers.
1. Introduction
The European Commission’s strategic framework envisages an improved and modernized European energy market, aimed at creating secure, sustainable, accessible and decentralized energy networks in response to the global challenge of greenhouse gas emissions [1]. In the context of the next generation of digital energy networks, and in the presence of multiple decentralized microgrids, managing the energy generation from various and complementary sources will result in gaining more flexibility in meeting demand and lowering costs for the community. The adoption of a decentralized electricity distribution network, in which ordinary consumers can also be energy producers, named ‘prosumers’, and can sell their surplus generation to the network, thus getting involved in market transactions inside a community represents an alternative to current traditional networks. It is expected that an increasing number of end-users will want to become active in the electricity sector, which will lead to a large number of transactions. A possible tool for enabling the creation of such microgrid-level markets is the blockchain technology which could provide secure and reliable means of communication and data management between the end-users [2].
Blockchain technology was created as a solution to the problem of mistrust and data security. The first steps in the development of the technology were taken in 1991, when Stuart Haber and W. Scott Stornetta first spoke about a cryptographically secure blockchain [3]. In 1993, together with Dave Bayer, they integrated optimal Merkel type trees in the concept [4]. Following the financial crisis of 2008, the concept of blockchain as a distributed database was developed, proposing a solution to change the way monetary transactions are carried out through various financial institutions. With the help of a peer-to-peer (P2P) communications network and a distributed data server, a blockchain database can be autonomous [5].
In the recent years, billions of dollars have been invested in research on blockchain technology in an attempt to make the most of its potential and understand how appropriate it is in the different economic domains [6]. But not all domains are fully ready to assimilate the blockchain technology. In each particular case, the current technological opportunities must be analyzed, as well as the challenges that the end-users face and how a new decentralized architecture could create value for them. The electricity industry is an extremely suitable candidate for blockchain technology-based innovation, with its complex supply chain that requires transparency and improved data processing and its highly transactional trading market that would gain advantage from faster settlement. The transparency and immutability of the blockchain can empower end-users of this industry and consumers.
A blockchain system is primarily based on a decentralized ledger of transactions that take place in a network. This network consists of nodes owned by independent entities that use a cryptographic protocol to validate the transactions that are entered in the ledger and to ensure that the entered data cannot be altered or changed. It is immutable, secure and completely transparent. Fully decentralized and replicated to node level, blockchain networks are harder to penetrate and manipulate by dangerous entities.
The blockchain system, coupled with other innovative technologies such as smart grids, big data mining and remote sensing, has the potential to provide solutions to various challenges in the energy sector and to contribute to the achievement of energy efficiency objectives, including to compensate for the funding gap for various projects in the field [7]. The technologies regarding blockchain-based platforms will lead to fundamental changes that will require the involvement of the distribution and supply companies, manufacturers of equipment, regulators and, last but not least, end-users [8,9].
A review of renewable and sustainable energy published in [6] provides a thorough analysis of more than 140 blockchain research projects and startups in the energy sector, from countries belonging all around the world. The electricity sector has a high potential to implement the blockchain technology as part of addressing several challenges [7,10,11]:
- Climate change. The need to integrate in existing electricity distribution systems renewable energy sources (RES) has led to the development of technologies such as PV panels and wind turbines, whose costs are constantly decreasing. The consumers who choose to install such generation sources become prosumers, which presents a challenge for the current structure of electricity networks. They can create technical difficulties for the Distribution Network Operators (DNOs) in ensuring the energy balance. However, electricity generation at the household level (classically with PV panels on the roof) is a great opportunity for the development of blockchain technology-based architectures, because it capitalizes on the distributed nature of electricity generation with unprecedented efficiency.
- The development of technologies that allow the transition to active distribution networks. The technological solutions refer to the communications and networking components, inverters, bidirectional smart metering systems, energy storage solutions. This evolution allows greater control at network level. Electricity becomes a controllable, storable and easily quantifiable product, suitable for trading through smart contracts.
- The creation of energy communities managed by local energy production cooperatives formed by community members. The microgrids which integrate the blockchain technology can represent a solution for connecting the poorest consumers to cleaner and cheaper energy, but also for energy savings and more responsible and accessible consumption. In some EU member states, European Federation of Renewable Energy Cooperatives (REScoop) have explicitly set social goals, such as reducing energy poverty. They meet those objectives by developing solidarity schemes aimed at lowering the energy bills of vulnerable members, providing them with services and training in reducing consumption. They also use the gains from RES energy generation to increase the living standards of vulnerable and low-income households.
- Simplifying the architecture of the current trading models. The implementation of a blockchain-based prosumer network leads to the elimination of a large number of intermediaries in the electricity trading process.
Among the technical advantages of this technology can be underlined the following: better management of power generation, fewer hours of supply interruption, secure energy transactions, increased distributed generation. The main economic advantages refer to protecting the identities of the traders, creating a distributed economy, reducing the tax burdens, data protection and control, and compensation for producers [12,13].
Another concept that can be associated with local electricity trading in microgrids is the mitigation of energy poverty. ‘Energy poverty’ can be defined as the lack of access to clean, renewable, affordable energy, which leads to costly energy bills [14]. The concept lies at the intersection of energy sustainability and social issues mitigation, being characterized by three realities: high energy prices, low or stagnating incomes, and energy inefficient homes in urgent need of renovations.
The mitigation of energy poverty can be achieved using crowdsourcing, a concept first introduced in 2005 by James Surowiecki [15], which can be defined as utilizing contributions from peers and the collective wisdom of the crowd to alleviate a problem. It can also be an effective approach to enable the crowd to provide a service in a community within a limited geographical area by using smart metering [16].
In Romania, according to Order 228/28.12.2018 published by ANRE (Romanian Energy Regulatory Authority), the prosumers can trade electricity generated from renewable sources such as photovoltaics (PV), biomass, wind, cogeneration. The suppliers are bound to buy the surplus at the weighted average day-ahead market price from the previous year [17], with the advantage of the exemption from the payment of the distribution network tariff. This trading system is the most basic, limiting the options of both parties [18]. More advanced trading models should be considered to increase the benefits of the prosumers and consumers who trade electricity in a local market organized at the microgrid or community level.
Usually, in classic wholesale electricity markets, electricity is traded using bilateral contracts with negotiated prices, for long periods (years, months, weeks). This trading manner helps to reduce the prices for the buyers, and provides stability and predictability for the producers. For shorter trading intervals, such as in the day-ahead (SPOT) markets, the merit order price setting mechanism is preferred, which ensures maximum benefits for producers when the demand is high and can lead to higher prices for suppliers and end-users.
On the other hand, the electricity quantities traded in local grids by prosumers are much smaller, and the trading intervals need to be smaller, because of renewable generation uncertainty. At the same time, the generation from prosumers needs to be incentivized to promote the proliferation of renewable electricity. Thus, a market model for microgrids should take into consideration creating advantages simultaneously for prosumers and consumers.
In this regard, the paper presents a new trading approach for prosumers that uses the blockchain technology for creating a local market at microgrid level, forecasts for consumer buy offers, obtained using technologies such as remote sensing tools, and the energy crowdsourcing concept for energy poverty mitigation. The proposed model takes as reference the trading model for excess prosumer generation used in Romania and applicable to developing markets, which consists in selling back the available electricity at fixed tariffs back to the grid. The authors propose a diversification of the trading methods and settlement procedures by creating a local trading mechanism intended to provide flexible market model that can be adapted to specific microgrid conditions and rules agreed at the community level. The proposed market model has two trading levels. The primary level is intended for main trading. The secondary, two-tier market is designed by the authors for increasing the prosumer profitability and lowering consumer electricity cost while accommodating particular scenarios that can arise in real conditions. The considered scenarios are: mitigating energy poverty for vulnerable consumers, selling remaining prosumer surplus to consumers who do not participate in the primary market but have bilateral contracts with certain prosumers, allowing occasional access to the market in exchange for a tariff, and reducing the effect of erroneous consumer buy offers caused by inaccurate forecasts or temporary unusual consumption patterns. The primary market model offers two trading alternatives: ‘first-come-first-served’ (FCFS), and merit-order (MO). The secondary market proposes two tiers with three trading methodologies, which can be optionally used, in number and order, according to the specific needs of particular microgrids: energy poverty mitigation, tariff access and invite access. The proposed alternatives are tested in a case study, on an existing low voltage (LV) electricity distribution network from Romania which has microgrid characteristics, in order to assess the effects of the chosen trading methods on the profits achieved by prosumers and consumers.
The proposed market model provides flexible tools for incentivizing the sustainable development of local communities based on environment protection and economic and social inequality mitigation through the use of modern technology tools, by encouraging local trading of electricity generated from renewable, clean primary sources.
The results of the case study show that by using the local trading mechanisms designed for the primary and secondary markets, the prosumers can sell more electricity, at lower prices for the community and better individual profit. If the benefits are consistent, this can lead to the increase of distributed generation sources in microgrids, thus a more sustainable development of the electricity generation sector.
By lowering consumer prices, the sustainable economic and social development of communities is also encouraged. Not least, these goals are envisioned to be achieved by obtaining in parallel the modernization of the electricity distribution infrastructure, by using smart grid communication and energy management tools and involving digital instruments (specialized trading software and blockchain).
The remainder of the paper is structured as follows. Section 2 presents a literature review regarding the research proposed in the paper. Section 3 describes the proposed market model for microgrids. In Section 4 are presented the results of the case study, with a comparison between the proposed trading strategies, outlining their particularities. The paper ends with the sections dedicated for discussions and references, and annexes.
2. Literature Review
Recent studies have considered combining the operation of small-scale renewable energy sources (SSRES) in distribution networks and deregulated electricity markets. The range of these studies is covering unit commitment [19] and economic dispatch problems [20], in addition to scheduling of SSRES [21], and the uncertainty of renewable generation [22]. The main trends and approaches currently described in the literature are briefly summarized in the following paragraphs.
As it was presented in the introduction section, in Europe there are currently over 3400 green energy cooperatives (REScoop). In accordance with [23,24,25,26], the REScoop notion is defined in EU directives as “local energy communities”, according to data from the Federation of Green Energy Cooperatives in Europe. More than one million European citizens are participating in REScoops to invest together in the transition from fossil fuels to clean primary energy resources and energy efficiency. In Romania, starting in 2020, the first established REScoop proposes that future members who generate energy (prosumers) will be able to sell the surplus to other members, rather than to an aggregator, following the concept of ‘prosumer-friendly’ [27].
In another perspective, paper [28] considers a P2P electricity trading method using a private Ethereum blockchain ledger where all bids are encrypted for anonymity and peer matching is done by a functional encryption-based contract.
Regarding the energy crowdsourcing in prosumer-enabled electrical networks, a small number of published papers is available in the literature [16,29]. The existing studies consider a two-stage algorithm for minimizing the cost of generation and the energy losses by prior rescheduling of user loads and SSRES.
In other work, a particular local energy market model was considered in [30], which integrates different P2P energy trading platforms based on unidirectional market clearing price (MCP) for a microgrid. Moreover, the settlement considers an MCP or P2P mechanism.
The future active distribution network (ADN) is a P2P community based on active energy agent (AEA) users [31]. The maximization of social welfare in local prosumer generation trading with an auction-based mechanism is used in [32]. The same first author considers that in a microgrid the energy flows in a transactive way and the transactions are based on bilateral contracts between peers [33]. Another concept of prosumer surplus trading based on the transactive energy concept is proposed in the literature [34,35,36,37]. Paper [34] uses a Stackelberg game-based method for solving the transactive energy problem, in which the DNO and the SSRES aggregators are participating simultaneously in the Local Electricity Market (LEM) and Wholesale Electricity Market (WEM). A comprehensive cost–benefit model for prosumer load sharing was proposed in [35], using game theory and considering non-cooperative game models of the microgrids for prosumers energy surplus. In the same context, a particular social welfare-based concept on transactive energy or demand response (DR) is applied in [36,37] using negotiated prices.
Another way to trade surplus are DR programs, whereby the LEM operators play a vital role in managing the exchange of data, to ensure the notification flow between balancing authorities, service companies and end-users. First, the microgrid operator assesses the electricity consumption patterns based on the structure of variable electricity tariffs and prices to establish trading plans. They also sign bilateral P2P contracts with end-users to take direct control of specific energy assets [38]. This information is aggregated to create commitment portfolios—load reduction schedules that are provided to network operators in exchange for compensation commensurate with the size of the capacity involved [39]. In the event of a system emergency or demand, the DSO shall request the aggregator to reduce or increase a portion of the contracted portfolio. For this reason, the aggregator receives additional compensation which can take the form of tariff reductions, incentive payments and invoice credits.
Using online platforms [40,41,42,43,44,45,46], the consumers can become prosumers who create and distribute their own information about the energy generation. Some authors proposed a demurrage mechanism (DM) and Home Energy Management (HEM) for prosumers’ energy surplus in an LEM based on blockchain [41]. A particular P2P business model for 48 residential prosumers with PV panels installed in a Swedish village is proposed in [42]. This article identifies some new potential opportunities for optimizing the LEM and its variables for the best gain, taking into account that a significant influence is represented by the integration of energy demand, generation supply, and LEM rules. The aforementioned study can be used to provide information for regulatory bodies to create a fair, useful and cost-effective P2P electricity trading framework for prosumers. Another comprehensive platform for prosumers’ digitalization was recommended in [43], and market simulations are developed in [44,45] for consumers integration in microgrids. In the same manner, a virtual platform was proposed in [46] for efficient management of multiple energy prosumers (MEP).
The presence of decentralized energy sources demands the analysis of the problem of continuity of energy supply to operators whose activities significantly depend on electricity. There are EU countries where power outages amount to about 20 min per year, but in other cases the average power outages range from 450 to 500 min [47]. Prosumers’ microinstallations ensure the business continuity for producers in such countries and negotiated surplus trading increases social welfare [48]. Because the SSRES efficiency depends on atmospheric conditions and regional climate, even minor temporary changes in weather conditions can cause significant variability in power generation at different time and space scales. Methodologies based on the remote sensing of atmospheric conditions are the primary source of information for the development of numerical forecasting models that support the planning and operation of power systems in the presence of intermittent energy sources [49]. For local trading of such electricity surplus, the LEM operators consider the blockchain concept [11,12,16,28,29,40,41,48] or direct bilateral contracts [50,51]. These market models aim to provide secure and affordable energy supply for the end user, which is essential for the functioning of an economy in which energy poverty is reduced and the needs of vulnerable social groups are taken into account [52,53,54]. Social welfare is obtained by the authors in [53], where the smart P2P contracts are considered as a distributed optimization problem, solved with a virtual aggregator based on the Alternating Direction Method of Multipliers (ADMM). All the LEM actions can be completed by the peers who do not necessarily trust each other through an agreement algorithm which defines the speed of the transactions. One of the most used algorithms is the Proof-of-Work (PoW) [55]. Nonetheless, previous articles about energy sustainability have paid limited attention to prosumer engagement, management and administration. For example, according to [56,57] each of the providers can have a proper trading platform with specific architecture for sustainable planning of the local microgrid or region.
From other perspectives, the prosumer surplus trading process based on the specific transactive energy microgrids are examined by the researchers in [58,59,60]. The prosumers’ aggregation to one group with the same interest based on virtual microgrids is analyzed by the authors in [61] for bill cost reduction as a particular energy poverty mitigation or social welfare. The aforementioned problem can be solved in smart buildings by using ADMM for energy sharing between the players, as is shown in [62,63].
In [64] remarkable directions for cost-effective use of digital cryptocurrencies in smart grid dynamic management are thoroughly explained to cover the challenging viewpoints of blockchain technology. The LEM is favorable for prosumers because the participation of the before-mentioned players is concrete in the purchase of energy surplus, but the revenues from the surplus traded are proportional between sellers [65]. Common consumers do not produce electricity and are only active in the purchasing process [66]. The load flexibility can change the trading offers. Other perspectives consider peak loads in the prosumer’s vicinity with smart P2P subscribed capacity prices in [67], or the crowdsourcing concept for surplus energy planning or sharing, as is used in [68], or considering the indispensable local energy storage systems [69].
The main concepts taken from the literature and discussed above are compared with the market model proposed in the paper, in Table 1. In addition, the last column considers the type of settlement used in the market.
The objective of the local market is to enable an overlay social network of smart devices that facilitates the communication and trading process between players from LEM, prosumers, consumers and microgrid. They should share a common goal, such as optimal energy management, taking into account that the solution with local energy storage systems (as is battery banks) is too expensive [70,71], and without technical possibility for energy poverty mitigation.
3. Materials and Methods
In LV electricity distribution networks or local microgrids, there is an increasingly larger number of residential consumers who are opting to install local generation resources to gain independence from the grid. The predominant choice is the use of PV panels systems that are easier to install at household residences and provide energy by converting the solar irradiation into electricity. This trend is incentivized by the subsidies offered by governments worldwide. As the number of individual houses adopting this technology increases, new opportunities arise regarding the trading models used for selling the excess generation. Residences become prosumers, entities capable of consuming, producing and selling electricity. The prosumers will use their own generated electricity mainly to cover their individual consumption and when the generation exceeds this amount, they will sell the surplus to the grid. The simplest method of surplus trading is to sell the entire available quantity back to the supplier, though an aggregator entity, at a regulated price. However, this is the least profitable approach, as the regulated prices are usually low [72], and the benefits can be seen only by the suppliers/network operators, and the prosumers. New trading methods for microgrids are currently envisioned in the literature, aiming to create local electricity markets that would provide benefits for all the players involved (aggregators, prosumers and consumers). A main requirement for implementing such initiatives is the conversion of the classic electricity distribution infrastructures into intelligent or smart grids, capable of real-time communication between the supply and consumer buses, and centralized operation management and data processing at microgrid level.
In line with these trends, previous research efforts by the authors, published in [40], proposed an algorithm for prosumer surplus transactions at the microgrid level, using P2P contracts and blockchain technology. The market mechanism considers trading priorities set at central level and based on consumer or prosumer prices, or custom priorities determined by the prosumer–consumer geographical distances and the ‘first-come-first-served’ (FCFS) principle.
This paper extends the previous research considering an improved and extended market model, with two trading phases (primary and secondary). The basic flowchart of the proposed market model is depicted in Figure 1.
The primary market includes the blockchain approach from [40] and adds a supplementary trading method based on the merit order used in wholesale markets. These methods can be used as alternatives for trading.
A second market segment, with two tiers, is proposed to help the prosumers and consumers to better manage the sell and buy offers that can be affected by errors. Crowdsourcing and energy poverty mitigation are used for this purpose.
The sell offers are the result of the surplus that the prosumers can generate but cannot use locally. The buy offers placed by the consumers in the local market are usually the result of forecasts made with variable precision. In the case of trading electricity obtained from PV panels, the forecasts must consider weather data obtained with technologies such as remote sensing and big data mining. Thus, the offers placed by the consumers in the market can be affected by errors which will result in mismatches between the needed and traded quantities.
In the Romanian market model, when the electricity acquired from the local market is less than the demand, the consumers would buy the rest at higher prices from the national grid, and the generators would be forced to sell any surplus to the aggregator, at a lower price.
On the other hand, if trading is performed in a local market, when the consumers forecasts are higher than the actual demand, the buyers would be forced to sell the excess quantities to the aggregator if sufficient and cheap storage facilities are not available.
The newly proposed algorithm provides market mechanisms designed to alleviate these problems.
The following general assumptions are made:
- The prosumer and consumer selling and buying offers are managed by the local non-profit aggregator using two possible market mechanisms integrated in a blockchain trading system:
- ○
- A primary market built on the blockchain technology, ensuring anonymity and security for the placed orders.
- ○
- A secondary market with a two-tier trading mechanism for minimizing the imbalance between the offers placed in the blockchain system and the actual traded quantities.
- The primary market can use two alternative price-setting methods based on blockchain technology: the ‘first-come-first-served’ (FCFS) method or the merit-order method used in traditional day-ahead markets.
- The secondary market provides two optional trading tiers:
- ○
- The energy poverty mitigation tier, aimed at low-income consumers who otherwise could not afford to participate in the market.
- ○
- The commercial tier, with two options, aimed for expanding the market through crowdsourcing, with two types of consumers: those participating occasionally, in exchange for a fee, and consumers who do not participate directly with offers but are represented (invited) in the market by other consumers.
- For the invite option of the commercial tier, any consumer Ci can acquire electricity from the second market layer only if has signed previously a P2P contract with a specific prosumer Pj.
- The selling price of a prosumer or consumer can vary hourly, but in the paper is set constant for all trading intervals. This approach is modelling the practice used for traditional differentiated tariffs where the peak and night prices are outside the hours when PV panels can generate electricity, and the case where no storage capabilities are installed in the network. Electricity is sold on the market for the surplus intervals, and settlement is performed at the end of each trading interval.
- If the local surplus exceeds the demand traded in the market, the surplus will be sold to the aggregator/market administrator, at regulated tariffs.
- The secondary two-tier market components are optional, but the case study considers all the available options, in order to better demonstrate the advantages of the proposed trading algorithm.
3.1. Input Data for the Local Market
The input data required for trading consist of the quantities and prices associated with the consumption and local generation measured in the market. This information is provided in six matrices: C = C (h, i) ∈ ℝnhxNCM, CO = CO (h, i) ∈ ℝnhxNCM and PCO = PCO (h, i) ∈ ℝnh×NCM for consumption quantity, offers and price offers, and G = G (h, j) ∈ ℝnh×NPM, GO = GO (h, j) ∈ ℝnh×NPM, PGO = PGO (h, j) ∈ ℝnh×NPM for generation quantity, offers and price offers, where NCM and NPM are the number of consumers and prosumers participating at hour h in the market. It is considered that generally NCM < NC and NPM < NP, NC and NP being the number of consumers and prosumers connected in the microgrid.
Trading in the primary market can occur at any hour h when there are consumer buying offers placed in the blockchain system (1), and there is generation surplus offered for selling (2).
Surplus occurs when the local generation of a prosumer exceeds its individual consumption (3) and the surplus is traded in the market (4).
The consumer quantity offers for the primary market use two types of representation:
- as actual consumption value measured in [W], when the price is set according to the blockchain priority model, as in [40];
- as a multiple of 100 W for the price setting according to the day-ahead merit order model used in wholesale markets.
The prosumers can choose to sell their surplus directly to the aggregator for a fixed regulated tariff, or in the primary local market. In the paper, it is considered that all the available surplus is traded through sell offers placed in the market blockchain system.
The secondary market is activated at any hour h when at least one of the following conditions is fulfilled:
- The sum of the buy offers is lower than the aggregated offers placed by the prosumers, i.e., the prosumers need to sell the remaining surplus:
- The buy offer of a consumer i is greater than the actual consumption because of the forecast error or representation model used in the market (multiple of 100 kW).where TCO(h,i) is the quantity of electricity actually traded by the consumer i at hour h, which can be equal to or less than the offer placed on the market.
3.2. The Primary Market
This market segment is the main trading tool for the prosumers and consumers in the microgrid. As outlined previously, two alternatives are provided for determining the consumer and prosumer trading priority: ‘first-come-first-served’ and merit order. Both methods use the consumer (buy) and prosumer (sell) offers placed in a centralized secure and anonymous blockchain system established at the microgrid or market level. The blockchain system is preferred because it guarantees trading fairness, all players being unaware of the offers placed by others, thus minimizing the risk of market manipulation.
Another assumption used in the paper is that, by means of an automated system comprising smart metering, two-way communication and continuous monitoring at the microgrid level, the algorithm has immediate access to measured and forecasted data at consumer and prosumer buses. For examining the possible effects on trading, two consumer offer mechanisms are considered:
- Consumers place on the market buy offers for the entire consumption at hour h, in order to minimize their electricity bill by attempting to buy the maximum quantity of electricity from the local market, at lower prices, rather than from the main grid, at higher prices.
- Consumers place on the market buy offers determined by forecast techniques using big data analysis or remote sensing techniques.
The first type of offer is used in the FCFS trading method, where a generic consumer i places fixed-price-per-kWh and variable quantity offers, the trading order being determined by the time tag of the offer. The quantities for these offers are determined in the settlement phase, based on consumption measurements taken from the microgrid. The flowchart of this trading method is given in Figure 2.
The second type of offer is used in the merit-order trading mechanism. The buy offer prices and quantities are placed in the blockchain system by the consumers before the trading interval. Quantities are given as multiples of 100 W and prices are given for each kWh. The flowchart of this trading method is given in Figure 3. The trading order and price are determined by the standard merit-order method, provided in Figure 4, where the trading price is determined as the market clearing price (MCP).
For both methods, the prosumer sell offers are given as the full available surplus S(i,h), in kWh.
The maximum amount of traded electricity TC is determined by the minimum between the aggregated buy and sell offers:
The settlement price of a transaction t made by a prosumer j or consumer i is given by the amount of traded electricity C(h,t) and its price P(h,t), determined by each transaction, TP(h,t), which can be different from the sell or buy offer price submitted by the players in the market, PCO(h,i), PGO(h,j).
The basic flowchart of the primary market algorithm uses the steps presented in Figure 5.
The trading mechanisms used in the primary market can lead to electricity quantities that cannot be traded locally. Three scenarios can lead to this situation:
- At given hours, the total local generation available in the market (sell offers) exceed the total consumption (buy offers).
- If the merit-order method is used, the buy offers are given as multiples of 100 W, while the sell offers are the S(h,i) quantities. This leads to S(h,i) fractions that cannot be fulfilled.
- The consumers place in the market buy offers that exceed their real consumption, following forecast errors or significant accidental deviations from the daily demand pattern.
All these quantities can amount to an important value over longer time periods. If they are not traded in the local market, the prosumers would sell at minimum price to the aggregator, while the consumers would buy electricity at standard, high tariffs.
The algorithm proposed in the paper offers the possibility of extending the primary market with a two-tier secondary market, in order to make prosumer and consumer surplus quantities available for trading in the local network.
3.3. The Secondary Market—The Energy Poverty Tier
The local market is profitable mostly to consumers with high demand, who can better benefit from the energy cost reduction obtained from the difference between the grid tariffs and the price per kWh offered by the local producers. These consumers are also usually those who have the financial resources to install the physical and software infrastructure required to access the market.
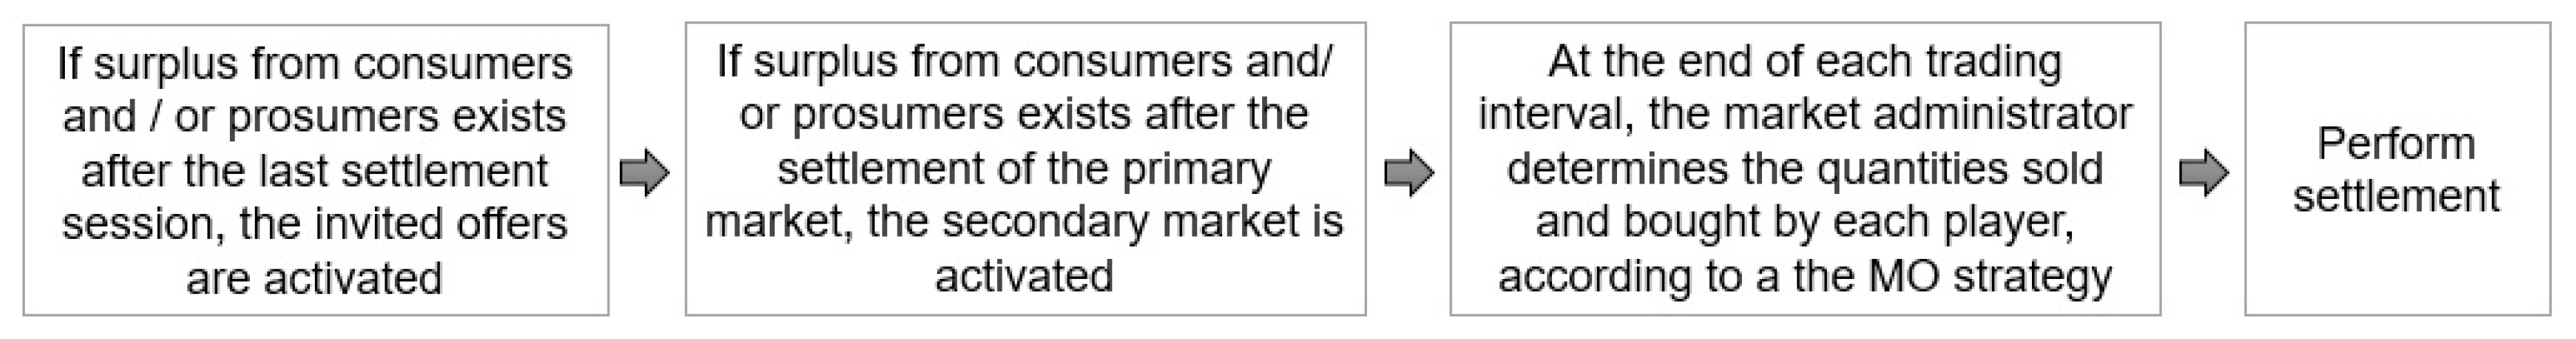
On the other hand, amongst the consumers connected in a microgrid can exist a number of low-income consumers, who in traditional networks would be classified as belonging to vulnerable categories and suffer from energy poverty. The paper proposes an optional secondary market tier in which the surplus that cannot be traded in the primary market would be automatically allocated in the initial settlement phase (see Figure 1) to such vulnerable consumers who, in normal conditions, would not be able to access the local market.
The surplus can come from both prosumers and consumers, as summarized in the previous subsection. In all the cases, the electricity quantities will result from the mismatch between the quantities offered for trading (higher)—CO(h,i) or GO(h,j)—and actual traded quantity, determined by the existing (lower) generation availability TC(h,j) or realized consumption TC(h,i):
Thus, consumers who were buyers in the primary market can act as sellers in the secondary market, together with the prosumers.
The quantities sold to vulnerable consumers in the secondary market are determined using the merit-order method where the buyers’ prices are set as 0 mu/kWh (mu is the monetary units) and the quantities are ranked in descending order. The cost for traded kWh can be set using as reference the price obtained by the seller in the primary market, the original price offer placed by the seller in the primary market or an agreed fixed tariff, according to the policy agreed in the local market.
This trading scheme offers two benefits. The vulnerable consumers from the microgrid will see social welfare increase by the reduction of their electricity bill, which will be proportional to their consumption in the trading hours interval and the market price. On the other hand, the prosumers with remaining generation surplus and the consumers who have surplus to sell after the initial settlement of the primary market can sell electricity at higher prices than the tariff used by the aggregator.
The flowchart of the first tier of the secondary market is presented in Figure 6.
Since the demand of the vulnerable consumers selected for the energy poverty tier is expected to be low, the remaining surplus after the settlement of the first tier can be further traded in a second tier reserved for commercial trading.
3.4. The Secondary Market—The Commercial Tier
The commercial tier of the secondary market is designed to incentivize market diversity by allowing other consumers to participate in trading. Several consumer categories are envisioned. Some consumers would not trade continuously and would seek only occasional access to the market, buying the local generation surplus to supply automated receptors such as greenhouse irrigation systems in given hours of preset days. Other types of occasional consumers could benefit from the price difference when trading on the local market, but the initial investment for the infrastructure required to get access to the market would be prohibitive.
Two options are available in the algorithm for this trading segment:
- Option 1: Fee access.
- Option 2: Invite access.
In the fee-access model, the consumers who need only occasional access to the market can submit offers in the secondary market to gain priority access for the surplus remaining after the settlement of the primary market offers. The trading model considers the merit-order priority method described in Figure 5 for the primary market, but where the consumers offer to buy from the market their entire consumption measured in the trading interval, at the lowest price plus a fixed percent fee from the value of the transaction. The merit order is used to determine the succession in which the offers are fulfilled. The financial settlement is made using the MCP, the consumer or the prosumer price offers for all transactions, according to the market policy, and then a fee f% is added to the price resulting from the trading mechanism.
The basic flowchart of the fee-access secondary market model is given in Figure 7.
In the invite-access model, existing market players can act as subcontractors for other consumers from the microgrid. Certain prosumers or consumers can still have surplus quantities unsold after the previous settlement sessions have been completed. In order to avoid getting the lowest price per kWh from the market aggregator, they can optionally choose a partner from the microgrid to which the remaining quantities will be sold. The transactions are based on P2P contracts existing between the two entities and notified to the market administrator, who is responsible for the final settlement at market level. The settlement price is agreed between the parties, chosen from the vendor and buyer offers.
The flowchart of the secondary market invite-access model is provided in Figure 8.
It should be noted that the secondary market models are optional, and their order of activation can be changed according to the priorities of a specific microgrid. Instances can exist where the energy poverty mitigation tier is absent or one or both segments of the secondary commercial tier are used.
4. Results
The new market was tested on an LV distribution network from Romania, with 28 buses and two four-wire three-phase bundled feeders, with an average distance between the connection points of 40 m. The network supplies only single-phase residential consumers, some of whom also have PV generation capabilities. The load and generation profiles used in the study are considered as daily 24-hour measured values, as provided from the smart metering infrastructure existing in the LV microgrid. The 24-hour load profiles for the network buses are presented in Table A1 in Appendix A.
Each bus, except bus 1, which is a branching point, has one residence connected. The prosumers are located at buses 3, 6, 7, 10, 15, 25 and 27, as shown in the one-line diagram from Figure 9. Their 24-hour generation profiles were modeled using representative data for this type of generation and are provided in Appendix A, Table A2. The prosumers will use the generated electricity primarily for supplying their own hourly demand, and wish to sell the remaining surplus to the consumers participating in the local market set up at microgrid level and managed by a non-profit aggregator. From Table 2 and Figure 10, it is seen that generation occurs only in the 06:00–18.00 interval, when solar energy is available. The surplus is maximized in the 10:00–13:00 interval and minimized towards the evening time, when the peak load hours are near.
4.1. The Primary Market
From the 27 consumers existing in the microgrid, the case study considers that only 11 are participating in the primary market as buyers (from buses 5, 8, 9, 11, 12, 14, 16, 19, 20, 24, 26), chosen mainly between the residences with high daily electricity demand. For each hour h, they can submit to the market two types of offers according to the traded quantity: the entire hourly demand and forecasted values, in multiples of 100 kW, as discussed in Section 3.2. For the forecasted offers, the values used in the case study are given in Table A3 in Appendix A, and in Figure 11, only for the hour intervals in which prosumer generation exists.
The sellers who place offers in the primary market are the prosumers with generation surplus. It is considered that they wish to sell the entire surplus on the market to maximize their revenue. The quantities offered, derived from Table A1 and Table A2, are presented in Table 2 and Figure 10, where it can be seen that surplus exists for trading in all hourly intervals from 06:00 to 18:00, but there are prosumers who cannot trade electricity at some hours (for example, P27 or P6).
For all quantity offers, the consumers and the prosumers must also provide in the blockchain system of the primary market the desired price offers, which are given in Table A4 and Table A5 in Appendix A. These values were set between 0.39 and 0.6 mu/kWh for consumers, and in the 0.4–0.55 mu/kWh range for prosumers. The higher maximum prices for consumers were chosen taking into account the merit-order method, in which the offers with the highest prices are prioritized. Furthermore, both the prosumers’ and consumers’ price offers were set higher than the regulated tariff to incentivize the trading in the local market.
If the market would not be present, the total electricity surplus quantity (167.97 kWh) would be traded by the aggregator back in the grid, at a regulated tariff. Using the reference value of 0.251 mu/kWh applied in Romania [73,74], the total revenue of the prosumers would be of 42.16 mu/day.
For demonstrating the advantages and disadvantages of each trading priority method used in the market, FCFS and MO, the case study results are be provided as comparisons between these alternatives.
As it can be seen from Figure 11, there are hours when the MO offers differ from the total demand used in the FCFS offers. This can happen because of two reasons: the forecast error and the standardized offer type (multiple of 100 W) used by the MO method. On the other hand, the offers placed by the consumers in the market are identical for both trading methods, and equal to the available surplus (Figure 10), because one of the main objectives of the local market is to enable prosumers to sell the entire surplus locally, and offers given as multiples of 100 W would impede the achievement of this goal.
The traded quantities and revenues/costs for each prosumer/consumer and hourly interval are given in Figure 12 and Figure 13 and Table 3, Table 4, Table 5 and Table 6.
The data from Table 3, Table 4, Table 5 and Table 6 show some interesting results regarding the hourly and daily offers and traded quantities for the consumers and prosumers.
The local generation surplus (167.97 kW) is insufficient to supply all the consumer needs (203.43 kWh). From Table 3, it is seen that, for the chosen consumption, local generation and primary market offers, when using the FCFS trading priority, the consumers can trade quantities lower than their consumption, and will need to buy the rest from the grid, at higher tariffs. If the MO trading priority is used, Table 4 shows that the hourly buy offers placed by the consumers are usually not fully fulfilled, but the traded quantities exceed the consumption. This leads to a surplus with the consumers, which will be traded to the grid, at regulated tariffs, or sold in the secondary market.
For prosumers, there are trading intervals where the surplus exceeds the traded prosumer offer and traded consumer quantities which are equal (for example, at h11, as seen from Table 4 and Table 6). This suggests that the prosumer will not be able to sell their entire surplus because of lack of demand. Additionally, applying the FCFS and MO trading priorities in fulfilling the market offers has different effects on the traded quantities, both hourly and for individual prosumers or consumers. If the FCFS trading priority is used, the total quantity traded by the prosumers is larger (Table 5) because the prosumer surplus offers can be matched more closely by the consumer offers. This means that if the MO trading priority is used, it is expected to have more surplus unsold to the local consumers, thus reducing the profitability of the prosumers. In this case, they would have to sell extra surplus to the grid in exchange for the regulated tariff, which is lower than the local consumer offers. As it can be seen from Table 6, the generation surplus remaining after the primary market is concentrated in the 09:00–14:00 interval, while the evening and morning intervals see the highest deficit in local generation (Table 4).
The profitability of the FCFS and MO trading priorities can be assessed from Figure 14 and Table 7 and Table 8 for the buyers and Figure 15 and Table 9 and Table 10 for the sellers. The market model offers the possibility of performing financial settlement in three assumptions for the prices: using the market clearing price (MCP), the consumer offers (COP) and the prosumer offers (POP), because different microgrids can pursue different objectives when establishing the local market. For example, using POP coupled with MO in the primary market can be an advantage for the buying consumers, who will buy electricity at lower prices from the local prosumers instead of paying the standard residential tariff. Using the MCP favors the prosumers with lower prices. In generation surplus scenarios, they can sell electricity at a higher clearing price. Using the COP will be an advantage for the prosumers, who will be able to obtain settlement prices larger than their initial offers.
The sellers/vendors with the highest cost/revenue can be considered as making the most profit because quantities are bought by consumers at a price lower than the standard LV residential tariff, while the sell offers are settled by the vendors at a price higher than the resell tariff to the grid.
For the scenario considered in the case study, Figure 14 and Figure 15 show that the highest revenues are obtained by prosumers when the consumer offer prices (COP) are used for settlement. If the FCFS trading priority is used, the MCP and POP settlements give the same results, because the methodology from [40] uses as settlement price the prosumer offers, and the MCP and POP trading priorities would result the same, as the buy offer price is not relevant and thus considered 0 um/kWh for all buyers. For the MO trading priority, the MCP settlement results in higher trading prices than POP, because the trading price for all sellers and buyers is determined by the price unrestricted merit order used in wholesale markets (Figure 4).
4.2. The Secondary Market—The Energy Poverty Mitigation Tier
The proposed local market model uses in the secondary market an optional energy poverty mitigation tier, designed to include a category of consumers that can usually will not be able to trade on the market because of their low income or other social vulnerabilities. The microgrid community can decide to assist these consumers by supporting the reduction of their electricity bill. The simplest way to achieve this goal is to automatically allocate the prosumer surplus available after the settlement of the primary market to cover the demand of such consumers. In the data used for the case study, a single consumer, C28, fulfills the requirements of a vulnerable consumer. As seen in Table A1, its total daily consumption amounts to 3.31 kWh, with 1.79 kWh in the 06:00–18:00 interval.
Since the two trading priority methods (FCFS and MO) give in the primary market different results regarding the trading participants and quantities at each hour, a similar behavior is propagated in the secondary market. Thus, the trading results will be presented in the same manner as for the primary market, as a comparison between the cases in which the primary market uses the FCFS or the MO in determining the priorities of the traded quantities. It is considered that the secondary market uses the same price offers entered in the blockchain system for the primary market.
According to the data from Table 3 and Table 5, after the settlement of the primary market, prosumers P21, P7, P15, P6, P3, P25 have unsold surplus if the FCFS trading priority is used. No consumers can participate in the secondary market, because they cannot have surplus after trading. If the MO priority is used, the prosumers with available surplus are P21, P15, P3, and also there are consumers which have placed in the primary market offers exceeding their real consumption, and can become sellers on the secondary market (C5, C9, C11, C12, C16, C19, C20, C24, and C26). The hours in which the sellers are having surplus after the primary market are presented in Appendix B, Table A6 and Table A7. The only entity buying in this market is C28, and its hourly buy offer match its entire consumption (See Table A1). However, these are total quantities, and each seller can trade different surplus quantities in each hour. This will lead to the necessity of prioritization of the sell offers, and subsequent settlement between C28 and possibly multiple sellers. The quantities traded hourly are presented in Appendix B, Table A8 and Table A9. The sell offers and traded quantities are given in Figure 16 and Figure 17. Table 11, Table 12, Table 13 and Table 14 summarize the daily and hourly offers and quantities traded by buyers and sellers.
Figure 16 and Figure 17 and Table 11, Table 12, Table 13 and Table 14 reveal significantly different trading scenarios on the energy poverty mitigation market when the two trading priority methods (FCFS and MO) are used in the primary market. For FCFS, 3 out of 5 prosumers will trade electricity with C28, while if MO were to be used, only P15 and P3 will sell electricity, the rest of the buying offer being fulfilled by just one consumer, C19. Also, if the secondary market is activated, the available surplus rises when MO is used from 13.88 kWh in the primary market to 63.18 kWh, due to the presence of the consumers who need to sell the surplus generated by the forecast error or offer quantity rounding. In the absence of the secondary market, these two quantities would be sold back to the grid at minimal price. Thus, in addition to allowing prosumer to sell more surplus, the secondary market offers a mechanism for minimizing the effect of consumption forecast errors at the consumer side when the MO trading priority method is used. However, the prosumer and consumer surplus to be sold back to the grid remain high, at 13.27 kWh and 48.12 kWh respectively (Table 13).
The costs of the consumer C28 and revenues of the vendors in the energy poverty market tier are given in Table 15, Table 16, Table 17 and Table 18 and Figure 18 and Figure 19. The financial settlement is performed in this case using as reference only the vendor price offer, similar to POP from Table 7, Table 8, Table 9 and Table 10, because with just one vulnerable consumer trading in the market, the COP is viable only if the consumer would buy at a fixed tariff, and MCP results are the same as POP when COP is not specified.
The results show that the vendor revenues are lower than in the primary market, because of the smaller traded quantities, but they can become significant if they are averaged over longer periods (months, years). The consumer C28 will pay less in the local market than when buying electricity from the grid, and the MO trading priority maximizes its earnings and the number of hourly intervals in which trading can be made. A more profitability analysis will follow in the Discussions section, for all the trading segments considered in the market algorithm.
4.3. The Secondary Market—The Commercial Tariff Access Tier
As seen previously, the vendors can remain after the primary market with surplus available for selling. Both prosumers and consumers can become sellers on the secondary market. The energy poverty mitigation tier can help to reduce the surplus, but, if the vulnerable consumers have low demand and are in low numbers, the quantities still remaining after the settlement can be significant. For the demand-generation balance and the set of offers used in the case study, the total primary market surplus is of 63.18 kWh and reduces only to 61.39 kWh after the energy poverty mitigation market, if the MO trading method is used. For the FCFS method, the remaining surplus decreases from to 11.58 kWh to 10.86 kW. For further reducing the quantity sold to the grid, the local market model uses the second tier of the secondary market, operated according to the MO trading priority method used in the primary market, but with different market participants.
The sellers that can enter this market segment are the same as for the energy poverty mitigation market: prosumers with remaining surplus and consumers whose offers placed in the blockchain system of the primary market exceed their actual demand, thus becoming surplus. The buyers are consumers from the same microgrid who did not participate in the primary market, but are ready to occasionally buy surplus from the secondary market when it is available, at market prices. In exchange for this facility, they pay an extra fee, according to the formula from Equation (10). The quantities are determined automatically in the settlement phase of the energy poverty market or at the end of the primary market, if the EP tier is not used. The sell price offers are the offer prices entered by prosumers in the blockchain system of the primary market. For consumers the buy prices are: C13–0.47 mu/kWh, C17–0.30 mu/kWh, C18–0.42 mu/kWh, lower than the average offers from the primary market, in order to minimize the effect of the added tariffs. The fulfilment priority for the buy and sell offers is determined using the MO strategy from Figure 4, and the actual quantities and financial exchanges between sellers and buyers are settled as in the primary market.
Using as reference the trading data from Table 13, the sellers participating in the market are P21, P15, P6 and P3, if the FCFS method is used in the primary market, and P21, P15, P3, C5, C9, C11, C12, C16, C19, C20, C24, and C26. The buyers are three consumers that did not participate in the primary market, namely C13, C17 and C18. The fee applied for all the consumers is a 10% increase of the final buy price, and it is charged by the market administrator. For evaluating all the possibilities regarding the financial settlement, all three price alternatives will be considered: MCP, COP and POP, similar to the primary market. The quantities offered and actually traded by each vendor and buyer in the two primary market methodologies (FCFS and MO) are given in Appendix C, Table A10, Table A11, Table A12, Table A13 and Table A14.
The results show that the use of the MO in the primary market leads to higher quantities traded in the tariff-access market tier, while if the FCFS priority is chosen, prosumer surplus is lower. The hourly results for the market and the daily quantities traded by the prosumers and the consumers are summarized, as for the previous market tiers, in Figure 20, Figure 21, Figure 22 and Figure 23 and Table 19, Table 20, Table 21 and Table 22.
The results from Table 19, Table 20, Table 21 and Table 22 show that the tariff-access consumers are able to acquire 7.67 kWh for the FCFS primary market trading priority, exclusively from prosumer surplus. 21.28 kWh are bought for the MO trading priority method, mainly from consumer surplus, as it can be seen in Table 21. When the MO method is used, the consumer buy offers are fulfilled from the most part from the local market (Table 20), only 1.2 kWh remaining to be bought from the grid. After the settlement of the two commercial market tiers, the prosumers lower their unsold surplus to only 3.19 kWh (FCFS) or 4.7 kWh (MO), while the consumer surplus remains high, at 35.94 kWh. The prosumer surplus is available mainly in the 09:00–14:00 interval, while the consumer surplus can be accessed outside this interval, between 06:00–8:00 and 15:00–18:00 (see Table A11).
The costs of the buyers and the revenues of the vendors in this market tier are summarized in Figure 24 and Figure 25 and Table 23, Table 24, Table 25 and Table 26, for all three available settlement policies (MCP, COP, POP).
Because of the larger quantities bought by the three consumers, the fee-access tier is more profitable for the surplus vendors, compared to the energy poverty mitigation market. In addition, considering the lower price offers used for the tariff-access consumers, the COP settlement option is the best choice for the consumers, incurring the lowest costs (see Table 25). For the FCFS trading priority method, MCP and POP give the same results, which suggests that the merit order clearing price is determined by higher vendor price offers (Table 26).
4.4. The Secondary Market—The Commercial Invite Access Tier
An alternative proposed in the local market model for the tariff-access secondary market is an invite-access market tier. This solution, while it has lower impact on the surplus reduction at market level, is viable for individual prosumers and consumers which are in the situation of frequently having unsold surplus after the final settlement. The invite-access strategy proposes that long-term P2P contracts can be established between seller–buyer pairs, stipulating that the buyer can automatically access the unsold surplus of the seller when it is available. In this case, the settlement is not performed at market level, but only for the two parties involved, and it can be considered that the buyer is an ‘invited guest’ in the local market.
The market diagram from Figure 1 considers the invite-access market as an alternative to the tariff-access market, but this approach is not mandatory, as the energy mitigation market, the tariff-access market and the invite-access market can be used in any desired order or number in the architecture of the local market.
Considering the layout from Figure 1 and the data from Table 2, Table A2, Table A7 and Table A13, the evolution of the surplus of prosumer P21 in the MO primary market priority case is the one seen in Table 27. The prosumer is able to sell 4.844 kWh on the tariff-access market.
On the other hand, if the prosumer has a P2P contract with consumer C22 who did not participate in the primary market, and the tariff access option is not activated, then it would be possible to sell in the invite-access market almost the same quantity, as can be seen in Table 28. Furthermore, a scenario can be imagined in which the invite market is activated first, followed by the tariff-access market, in which case prosumer P21 would be able to sell their entire surplus in the local blockchain market. Thus, if the market model is optimally configured, it can lead to the maximization of the local trading, thus minimizing the surplus sold to the grid at regulated tariffs.
5. Discussion
The results presented in the case study show that the secondary market has a positive effect regarding the surplus quantities sold by the prosumers in the local market. A key aspect that still needs to be discussed is the profitability of the local market, with its two components. Using Table 3, Table 5, Table 11, Table 13, Table 19 and Table 21 for quantities, the influence of the primary and secondary markets on the quantities sold by the prosumers and consumers back to the grid is determined in Table 29 and Table 30.
Table 29 shows that the offer quantities used in the MO trading priority determine a 49.3 kWh surplus at the consumers, which represents electricity traded but not consumed. This represents a high value, at 25% of the total consumption, and is mainly determined by hourly demand forecast errors. In the absence of the secondary market, the entire quantity would be sold to the grid, and the price mismatch between the buy price on the market (high) and sell price to the grid (low) would represent a cost increase for the consumers. Thus, accurate demand forecasts could reduce the costs for the consumers participating in the market. Additionally, it can be seen that the FCFS trading priority results in lower quantities sold back to the grid, as consumer surplus is absent.
Table 30 shows that the secondary market makes a significant contribution to reducing the prosumer surplus from 11.58/13.88 kWh to 3.18/4.17 kWh. Here, it can be seen that while the bulk of the surplus is sold on the primary market, the secondary market allows an important increase of local generation sold locally. The primary market helps prosumers to sell the majority of their surplus in the local market, and the supplementary market tiers allow consumers to mitigate forecast errors by acting as sellers, and also reduce the share of surplus prosumer generation sold back to the grid. These trading options can have, depending on local conditions, positive effects in increasing the number of prosumers in the microgrid and reducing the electricity acquired by the consumers from the grid, at higher prices and taxes. In other words, social and environmental sustainability can be improved.
The reduction of local generation quantities sold back to the grid has positive financial effects for both prosumers and consumers. In the absence of the local market, the prosumers would sell any surplus to the grid at the regulated price. The market allows them to obtain better prices, which are still attractive for consumers as long as they do not exceed the tariff paid for the electricity imported from the grid. On the other hand, by participating in the local market, the consumers have the chance of paying less for electricity. From Table 7, Table 9, Table 15, Table 17, Table 23 and Table 25, the costs and revenues for the sellers and vendors on each market segment can be summarized in Table 31 and Table 32, for the 06:00–18:00 interval of the analyzed day.
Table 31 shows that the highest costs for the consumers occur when the COP settlement is used, while the POP settlement offers the best buy prices from the market. In Table 32, it can be seen that the prosumer revenues can double when the primary and secondary markets are used, with the highest profits being achieved on the primary market. The secondary market is, however, useful for the consumers who need to sell surplus remaining from the primary market, increasing their daily revenue by up to 200% (14.89 mu, compared to 12.38 mu).
Using the traded quantities and factoring the costs and revenues presented above, a comparison can be made between the daily electricity costs for the aggregated network demand in the 06:00–18:00 interval. Table 33 shows that the combined effect of the primary and secondary markets can decrease the cost by up to 26% when the FCFS trading prioritization is used. For MO prioritization, because of the significant consumer surplus in the primary market, the cost increases when MCP or COP settlement is used, but the effect of the secondary market is to compensate a fraction of the increase.
It is important to note that the results presented in the paper are highly dependent on the input data used for the case study. The profits of the prosumers and the cost reductions for the consumers are affected by the quantities and prices offered in the market by both parties and can vary significantly from the results presented in the paper. Also, depending on local constraints, the trading tiers of the secondary market can be used only partially and in a different order. The case study presents a scenario of a complete market trading sequence to show the capabilities of the proposed model.
6. Conclusions
The paper proposes a new local market for active microgrids, designed to maximize the surplus sold by the prosumers to the local consumers. The local market requires smart grid features in the microgrid and a blockchain ledger for submitting buy and sell offers. Trading is performed in two phases, first on a primary marked, followed by a two-tier secondary market. The case study shows that the secondary market can help the prosumers to sell more surplus to the local consumers, increasing their profitability. The advantages of the local market can be discussed from several perspectives:
- The reduction of electricity quantities traded back to the grid (at lower prices) for prosumers;
- The reduction of electricity costs for consumers, brought by acquiring cheaper electricity from the local prosumers;
- The increase of profits for prosumers, by selling larger quantities to local consumers, at higher prices than the regulated tariff used to sell back to the grid. This can also be seen as an incentive for increasing sustainable electricity generation from renewable resources;
- The energy poverty mitigation for some consumers, an aspect regarding economic and social sustainability.
However, as main disadvantages, accurate demand forecasts are necessary for the consumers if the MO trading method is used, for optimal market benefits. Furthermore, the implementation of the proposed market model is dependent on several prerequisites: the implementation of smart grid capabilities in the microgrid, the creation of adequate regulations by regional or national authorities, and the development of residential renewable electricity generation, all these being in incipient development stages across the world.
The proposed algorithm is a comprehensive tool of the trading process for consumers and prosumers in microgrids, considering the current regulation framework regarding prosumer activity in the Romanian electricity market, and future research directions considered by the authors aim to extend its capabilities for social inclusion, analyzing the influence of storage capabilities on local market trading dynamics and profitability, and considering new trading options, by comparison with similar real local market models, as they become available in the literature.
7. Patents
National Patent Application “Innovative method of decision-making assistance aimed at streamlining the management of prosumer activity”, Romania, 2020, in press.
Author Contributions
Conceptualization, B.-C.N., O.I. and G.G.; methodology, B.-C.N. and O.I.; software, B.-C.N. and O.I.; validation, O.I. and B.-C.N.; formal analysis, M.G. and D.-M.I.; investigation, O.I. and G.G.; data curation, O.I.; writing—original draft preparation, B.-C.N. and O.I.; writing—O.I., G.G., D.-M.I. and M.G.; supervision, M.G. and D.-M.I. All the figures and tables used in the paper were created by the authors. All authors have read and agreed to the published version of the manuscript.
Funding
This research was funded by “Gheorghe Asachi” Technical University of Iasi, Romania, through the support of national project PNIII-1.2.PDI-PFC-C1–2018, as COMPETE project no. 9PFE/2018, financed by the Romanian Government.
Acknowledgments
The authors would like to express their gratitude to Maria Carmen Loghin, the Vice Rector of the “Gheorghe Asachi” Technical University of Iasi for his technical support, supporting logistics and open access of this journal publication.
Conflicts of Interest
The authors declare no conflict of interest.
Abbreviations
| ADMM | Alternating Direction Method of Multipliers |
| ADN | Active Distribution Network |
| AEA | Active Energy Agent |
| ANRE | Romanian Energy Regulatory Authority |
| C | Consumers/Consumption Quantity |
| CO | Consumption Offers |
| COP | Consumer Offers Price |
| DM | Demurrage Mechanism |
| DNOs | Distribution Network Operators |
| DR | Demand Response |
| EU | European Union |
| f% | fee added to the price resulting from trading mechanism |
| FCFS | First-Come-First-Served |
| G | Generation Quantity |
| GO | Generation Offers |
| HEM | Home Energy Management |
| kWh | kilowatt-hours |
| LEM | Local Electricity Market |
| LV | Low Voltage |
| MCP | Market Clearing Price |
| MEP | Multiple Energy Prosumers |
| MO | Merit-order |
| mu | Monetary units |
| NC | Total Number of Consumers |
| NCM | Number of Consumers participating in the Market |
| NP | Total Number of Prosumers |
| NPM | Number of Prosumers participating in the Market |
| P | Prosumer/Price |
| P2P | Peer-to-Peer |
| PCO | Price of Consumption Offers |
| PGO | Price of Generation Offers |
| PM | Primary Market |
| POP | Prosumer Offers Price |
| PoW | Proof-of-Work |
| PV | Photovoltaic |
| REScoop | European Federation of Renewable Energy Cooperatives |
| S | Surplus |
| SM | Secondary Market |
| SSRES | Small-Scale Renewable Energy Sources |
| TC | The Maximum Amount of Traded Electricity by Consumers |
| TP | Transaction of Prosumers |
| TCO | The Quantity of Electricity Actually Traded |
| WEM | Wholesale Electricity Market |
Appendix A. Input Data for the Primary Market

Table A1.
The hourly demand profiles for the entire microgrid, in kW (27 consumers).
| Hour | C2 | C3 | C4 | C5 | C6 | C7 | C8 | C9 | C10 |
|---|---|---|---|---|---|---|---|---|---|
| h1 | 0.616 | 2.010 | 0.273 | 0.000 | 1.370 | 2.418 | 1.152 | 1.936 | 0.310 |
| h2 | 0.608 | 1.908 | 0.078 | 0.020 | 1.520 | 2.210 | 1.664 | 1.368 | 0.678 |
| h3 | 0.557 | 2.004 | 0.048 | 0.260 | 1.910 | 2.149 | 2.056 | 1.376 | 0.300 |
| h4 | 0.522 | 2.010 | 0.306 | 0.040 | 1.770 | 2.151 | 2.048 | 2.048 | 0.640 |
| h5 | 0.522 | 1.902 | 0.063 | 0.050 | 1.990 | 2.192 | 1.816 | 1.528 | 0.360 |
| h6 | 0.571 | 2.004 | 0.165 | 0.250 | 2.070 | 2.299 | 1.168 | 2.992 | 0.468 |
| h7 | 0.529 | 1.836 | 0.213 | 0.125 | 2.280 | 2.364 | 0.720 | 3.352 | 0.748 |
| h8 | 0.592 | 1.236 | 0.060 | 4.710 | 2.530 | 2.543 | 1.704 | 2.240 | 3.208 |
| h9 | 0.562 | 1.302 | 0.312 | 1.290 | 1.850 | 2.382 | 1.976 | 2.112 | 2.815 |
| h10 | 0.616 | 1.200 | 0.258 | 0.525 | 1.850 | 2.549 | 1.944 | 2.192 | 1.483 |
| h11 | 0.860 | 1.188 | 0.243 | 2.985 | 1.460 | 2.426 | 1.904 | 2.232 | 4.538 |
| h12 | 0.535 | 1.146 | 0.423 | 1.895 | 1.180 | 2.414 | 1.872 | 2.144 | 3.295 |
| h13 | 0.641 | 1.140 | 0.198 | 4.595 | 1.650 | 2.450 | 2.456 | 2.048 | 3.650 |
| h14 | 0.322 | 1.374 | 0.378 | 0.930 | 1.950 | 2.418 | 2.632 | 2.176 | 5.230 |
| h15 | 0.181 | 1.944 | 0.321 | 0.260 | 1.810 | 2.444 | 1.896 | 2.256 | 4.293 |
| h16 | 0.214 | 1.542 | 0.207 | 0.535 | 2.640 | 2.467 | 2.072 | 2.328 | 3.895 |
| h17 | 0.781 | 2.148 | 0.495 | 2.125 | 2.810 | 2.553 | 2.080 | 2.288 | 3.028 |
| h18 | 0.764 | 1.902 | 0.282 | 1.025 | 2.720 | 2.757 | 2.016 | 2.336 | 1.980 |
| h19 | 0.426 | 1.968 | 0.336 | 0.140 | 3.580 | 3.042 | 2.720 | 2.464 | 1.768 |
| h20 | 0.426 | 1.968 | 0.336 | 0.140 | 3.580 | 3.042 | 2.720 | 2.464 | 1.768 |
| h21 | 0.496 | 1.956 | 0.207 | 0.210 | 5.310 | 3.515 | 2.672 | 3.136 | 3.033 |
| h22 | 0.561 | 1.986 | 0.405 | 0.480 | 5.390 | 3.248 | 2.488 | 1.312 | 5.695 |
| h23 | 0.554 | 1.872 | 0.246 | 0.195 | 4.750 | 3.075 | 2.432 | 1.336 | 4.033 |
| h24 | 0.578 | 1.986 | 0.045 | 0.100 | 3.170 | 2.713 | 2.088 | 1.184 | 1.180 |
| h06–18 | 7.168 | 19.962 | 3.555 | 21.250 | 26.800 | 32.066 | 24.440 | 30.696 | 38.631 |
| Hour | C11 | C12 | C13 | C14 | C15 | C16 | C17 | C18 | C19 |
| h1 | 0.230 | 0.585 | 0.142 | 0.910 | 2.783 | 2.220 | 0.210 | 0.360 | 0.345 |
| h2 | 0.220 | 0.765 | 0.078 | 0.920 | 2.411 | 1.320 | 0.000 | 0.525 | 0.286 |
| h3 | 0.200 | 0.585 | 0.352 | 0.925 | 2.548 | 0.942 | 0.000 | 0.534 | 0.243 |
| h4 | 0.200 | 0.675 | 0.440 | 1.225 | 2.313 | 0.972 | 0.045 | 0.636 | 0.213 |
| h5 | 0.200 | 0.660 | 0.062 | 1.345 | 2.288 | 0.954 | 0.000 | 0.444 | 0.237 |
| h6 | 1.240 | 0.570 | 1.416 | 1.290 | 2.426 | 1.044 | 0.115 | 0.462 | 0.242 |
| h7 | 1.400 | 0.900 | 0.482 | 1.325 | 3.239 | 1.374 | 0.075 | 0.477 | 0.281 |
| h8 | 1.440 | 0.630 | 0.182 | 1.520 | 3.798 | 3.984 | 0.475 | 0.450 | 0.287 |
| h9 | 1.170 | 0.765 | 0.502 | 1.430 | 3.097 | 2.184 | 0.380 | 0.504 | 0.278 |
| h10 | 1.130 | 0.645 | 1.046 | 1.120 | 4.371 | 1.986 | 0.495 | 0.579 | 0.268 |
| h11 | 1.390 | 0.555 | 0.150 | 1.170 | 2.994 | 1.986 | 1.130 | 0.573 | 0.285 |
| h12 | 1.740 | 0.630 | 1.032 | 1.265 | 3.763 | 2.844 | 0.630 | 0.498 | 0.315 |
| h13 | 1.760 | 0.615 | 0.056 | 1.760 | 2.999 | 1.566 | 0.420 | 0.600 | 0.301 |
| h14 | 1.200 | 0.570 | 0.056 | 2.000 | 2.759 | 0.930 | 0.980 | 0.540 | 0.329 |
| h15 | 0.280 | 0.750 | 0.236 | 1.840 | 3.807 | 0.798 | 0.955 | 0.357 | 0.312 |
| h16 | 0.460 | 0.555 | 1.024 | 1.815 | 3.317 | 1.152 | 0.965 | 0.423 | 0.350 |
| h17 | 3.180 | 0.825 | 0.232 | 2.015 | 3.214 | 1.944 | 0.970 | 0.588 | 0.366 |
| h18 | 2.570 | 0.780 | 0.890 | 2.365 | 2.940 | 2.046 | 0.960 | 0.570 | 0.468 |
| h19 | 2.890 | 0.780 | 0.458 | 2.480 | 3.445 | 2.460 | 1.450 | 0.678 | 0.443 |
| h20 | 2.890 | 0.780 | 0.458 | 2.480 | 3.445 | 2.460 | 1.450 | 0.678 | 0.443 |
| h21 | 3.210 | 0.630 | 0.864 | 2.580 | 3.278 | 1.884 | 1.385 | 0.753 | 0.454 |
| h22 | 3.260 | 0.570 | 1.326 | 2.365 | 2.475 | 1.374 | 1.660 | 0.621 | 0.482 |
| h23 | 2.815 | 0.720 | 0.376 | 2.060 | 2.073 | 1.380 | 1.235 | 0.750 | 0.509 |
| h24 | 1.780 | 0.570 | 0.200 | 1.495 | 2.769 | 1.158 | 0.880 | 0.390 | 0.328 |
| h06–18 | 18.960 | 8.790 | 7.304 | 20.915 | 42.724 | 23.838 | 8.550 | 6.621 | 4.082 |
| Hour | C20 | C21 | C22 | C23 | C24 | C25 | C26 | C27 | C28 |
| h1 | 0.973 | 0.636 | 0.790 | 0.049 | 1.266 | 0.384 | 0.248 | 0.024 | 0.973 |
| h2 | 1.013 | 0.484 | 0.780 | 0.056 | 1.194 | 0.384 | 0.296 | 0.000 | 1.013 |
| h3 | 0.733 | 0.448 | 0.730 | 0.749 | 1.056 | 0.388 | 0.260 | 0.000 | 0.733 |
| h4 | 0.453 | 0.460 | 0.920 | 1.148 | 1.032 | 0.392 | 0.292 | 0.000 | 0.453 |
| h5 | 0.680 | 0.520 | 0.800 | 1.148 | 1.014 | 0.400 | 0.208 | 0.000 | 0.680 |
| h6 | 0.773 | 0.512 | 1.340 | 1.148 | 1.020 | 0.396 | 0.356 | 0.192 | 0.773 |
| h7 | 0.980 | 0.428 | 0.960 | 1.946 | 1.122 | 0.376 | 0.700 | 0.140 | 0.980 |
| h8 | 1.560 | 0.368 | 0.270 | 1.393 | 1.116 | 0.352 | 0.336 | 0.152 | 1.560 |
| h9 | 1.580 | 0.408 | 0.420 | 1.596 | 1.110 | 0.356 | 0.144 | 0.000 | 1.580 |
| h10 | 1.347 | 0.408 | 1.000 | 2.975 | 1.110 | 0.360 | 0.128 | 0.004 | 1.347 |
| h11 | 1.713 | 0.668 | 0.930 | 1.519 | 1.242 | 0.620 | 0.204 | 0.076 | 1.713 |
| h12 | 1.913 | 0.412 | 1.050 | 2.492 | 1.260 | 0.344 | 0.320 | 0.508 | 1.913 |
| h13 | 3.127 | 0.344 | 1.020 | 1.974 | 1.266 | 0.324 | 0.476 | 0.056 | 3.127 |
| h14 | 2.560 | 0.428 | 0.970 | 1.974 | 1.260 | 0.332 | 0.384 | 0.020 | 2.560 |
| h15 | 1.433 | 1.068 | 1.010 | 2.240 | 1.206 | 0.940 | 0.456 | 0.244 | 1.433 |
| h16 | 2.013 | 0.424 | 1.110 | 2.296 | 1.134 | 2.500 | 0.352 | 0.088 | 2.013 |
| h17 | 4.000 | 0.448 | 1.540 | 1.778 | 1.140 | 2.544 | 2.000 | 0.080 | 4.000 |
| h18 | 1.067 | 0.468 | 1.630 | 1.939 | 1.260 | 2.820 | 0.876 | 0.228 | 1.067 |
| h19 | 1.907 | 0.436 | 1.570 | 1.750 | 1.296 | 2.104 | 1.824 | 0.000 | 1.907 |
| h20 | 1.907 | 0.436 | 1.570 | 1.750 | 1.296 | 2.104 | 1.824 | 0.000 | 1.907 |
| h21 | 2.473 | 1.092 | 1.280 | 1.106 | 1.212 | 2.144 | 0.728 | 0.408 | 2.473 |
| h22 | 2.253 | 1.484 | 1.110 | 1.092 | 1.194 | 2.084 | 0.688 | 0.412 | 2.253 |
| h23 | 1.933 | 1.364 | 0.710 | 1.092 | 1.194 | 2.248 | 0.256 | 0.532 | 1.933 |
| h24 | 1.260 | 0.880 | 0.840 | 0.763 | 1.176 | 2.008 | 0.324 | 0.144 | 1.260 |
| h06–18 | 12.900 | 24.066 | 6.384 | 13.250 | 25.270 | 15.246 | 12.264 | 6.732 | 1.788 |
Table A2.
The hourly generation profiles for the prosumers in the microgrid, in kW (8 prosumers).
| Hour | P27 | P21 | P7 | P15 | P6 | P3 | P10 | P25 |
|---|---|---|---|---|---|---|---|---|
| h1 | 0 | 0 | 0 | 0 | 0 | 0 | 0 | 0 |
| h2 | 0 | 0 | 0 | 0 | 0 | 0 | 0 | 0 |
| h3 | 0 | 0 | 0 | 0 | 0 | 0 | 0 | 0 |
| h4 | 0 | 0 | 0 | 0 | 0 | 0 | 0 | 0 |
| h5 | 0 | 0 | 0 | 0 | 0 | 0 | 0 | 0 |
| h6 | 0.249 | 2.361 | 2.183 | 4.374 | 2.011 | 2.212 | 1.965 | 4.072 |
| h7 | 0.518 | 2.785 | 2.627 | 4.824 | 2.132 | 2.642 | 2.364 | 4.609 |
| h8 | 1.004 | 3.286 | 3.247 | 5.384 | 2.357 | 3.115 | 2.922 | 4.942 |
| h9 | 1.581 | 3.329 | 3.438 | 5.325 | 2.592 | 3.139 | 3.094 | 5.066 |
| h10 | 1.735 | 3.639 | 3.642 | 5.673 | 2.966 | 3.451 | 3.278 | 5.342 |
| h11 | 1.859 | 3.751 | 3.826 | 5.769 | 3.346 | 3.561 | 3.443 | 5.417 |
| h12 | 1.915 | 3.735 | 3.639 | 5.643 | 3.509 | 3.539 | 3.275 | 5.320 |
| h13 | 1.984 | 3.812 | 3.863 | 5.825 | 3.945 | 3.603 | 3.477 | 5.506 |
| h14 | 1.756 | 3.742 | 3.803 | 5.704 | 3.297 | 3.553 | 3.423 | 5.474 |
| h15 | 1.562 | 3.461 | 3.492 | 5.353 | 2.994 | 3.276 | 3.143 | 4.908 |
| h16 | 0.915 | 2.832 | 2.877 | 4.642 | 2.541 | 2.675 | 2.589 | 4.343 |
| h17 | 0.495 | 2.403 | 2.305 | 4.276 | 2.352 | 2.283 | 2.075 | 4.017 |
| h18 | 0.308 | 2.237 | 2.105 | 4.101 | 1.791 | 2.123 | 1.895 | 3.859 |
| h19 | 0 | 0 | 0 | 0 | 0 | 0 | 0 | 0 |
| h20 | 0 | 0 | 0 | 0 | 0 | 0 | 0 | 0 |
| h21 | 0 | 0 | 0 | 0 | 0 | 0 | 0 | 0 |
| h22 | 0 | 0 | 0 | 0 | 0 | 0 | 0 | 0 |
| h23 | 0 | 0 | 0 | 0 | 0 | 0 | 0 | 0 |
| h24 | 0 | 0 | 0 | 0 | 0 | 0 | 0 | 0 |
Table A3.
The forecasted quantity offers of the buyers (consumers) for the primary market, MO trading priority, in kWh (11 consumers).
Table A3.
The forecasted quantity offers of the buyers (consumers) for the primary market, MO trading priority, in kWh (11 consumers).
| Trading Interval | C5 | C8 | C9 | C11 | C12 | C14 | C16 | C19 | C20 | C24 | C26 |
|---|---|---|---|---|---|---|---|---|---|---|---|
| h6 | 0.30 | 1.10 | 3.20 | 1.30 | 0.60 | 1.20 | 2.00 | 0.20 | 0.50 | 1.20 | 0.50 |
| h7 | 0.40 | 0.80 | 3.40 | 1.40 | 0.80 | 1.30 | 2.00 | 0.30 | 2.10 | 2.00 | 0.40 |
| h8 | 4.10 | 1.70 | 2.10 | 1.30 | 0.60 | 1.40 | 3.50 | 0.30 | 0.60 | 1.50 | 0.40 |
| h9 | 1.50 | 2.00 | 2.20 | 1.00 | 0.80 | 1.50 | 2.00 | 0.20 | 0.40 | 1.60 | 0.40 |
| h10 | 0.80 | 1.90 | 2.10 | 1.00 | 0.80 | 1.10 | 2.00 | 0.30 | 0.40 | 2.80 | 0.40 |
| h11 | 3.20 | 1.90 | 2.20 | 0.90 | 0.60 | 1.20 | 2.00 | 0.30 | 0.30 | 1.50 | 0.60 |
| h12 | 2.00 | 2.00 | 2.10 | 0.00 | 0.60 | 1.30 | 2.00 | 0.30 | 0.50 | 2.40 | 0.40 |
| h13 | 4.70 | 2.50 | 2.00 | 1.50 | 0.70 | 1.80 | 1.80 | 0.30 | 0.70 | 2.00 | 0.30 |
| h14 | 1.10 | 2.40 | 2.20 | 1.20 | 0.70 | 2.00 | 1.00 | 0.30 | 0.60 | 2.00 | 0.30 |
| h15 | 0.60 | 2.10 | 2.20 | 0.70 | 0.80 | 1.80 | 1.00 | 0.30 | 1.30 | 2.20 | 1.00 |
| h16 | 0.60 | 2.20 | 2.30 | 0.70 | 0.70 | 1.90 | 1.00 | 0.40 | 1.20 | 2.30 | 2.50 |
| h17 | 2.60 | 2.40 | 2.40 | 2.50 | 0.70 | 2.10 | 1.50 | 0.40 | 1.60 | 1.80 | 2.50 |
| h18 | 1.30 | 2.30 | 2.50 | 3.00 | 0.90 | 2.20 | 2.00 | 0.50 | 1.60 | 1.90 | 2.80 |
Table A4.
The offer prices submitted by the buyers (consumers) in the primary market, in mu/kWh.
| Trading Interval | C5 | C8 | C9 | C11 | C12 | C14 | C16 | C19 | C20 | C24 | C26 |
|---|---|---|---|---|---|---|---|---|---|---|---|
| h6–h18 | 0.45 | 0.6 | 0.55 | 0.52 | 0.48 | 0.6 | 0.49 | 0.39 | 0.55 | 0.57 | 0.5 |
Table A5.
The offer prices submitted by the sellers (prosumers) in the primary market, in mu/kWh.
| Trading Interval | P27 | P21 | P7 | P15 | P6 | P3 | P10 | P25 |
|---|---|---|---|---|---|---|---|---|
| h6–h18 | 0.43 | 0.55 | 0.4 | 0.48 | 0.43 | 0.47 | 0.42 | 0.43 |
Appendix B. Data for the Energy Poverty Mitigation Market
Table A6.
The sell offer quantities for the energy poverty mitigation tier (kWh), FCFS trading priority.
Table A6.
The sell offer quantities for the energy poverty mitigation tier (kWh), FCFS trading priority.
| Hour | P21 | P7 | P15 | P6 | P3 | Total |
|---|---|---|---|---|---|---|
| h06 | 0 | 0 | 0 | 0 | 0 | 0 |
| h07 | 0 | 0 | 0 | 0 | 0 | 0 |
| h08 | 0 | 0 | 0 | 0 | 0 | 0 |
| h09 | 0 | 0 | 0 | 0 | 1.815 | 1.815 |
| h10 | 0 | 0 | 1.302 | 0 | 2.840 | 4.142 |
| h11 | 0 | 0 | 0 | 0 | 2.345 | 2.345 |
| h12 | 0 | 0 | 0 | 1.241 | 0 | 1.241 |
| h13 | 0 | 0 | 0 | 0 | 0 | 0 |
| h14 | 1.182 | 0 | 0 | 0.739 | 0 | 1.921 |
| h15 | 0 | 0.113 | 0 | 0 | 0 | 0.113 |
| h16 | 0 | 0 | 0 | 0 | 0 | 0 |
| h17 | 0 | 0 | 0 | 0 | 0 | 0 |
| h18 | 0 | 0 | 0 | 0 | 0 | 0 |
| Total | 1.182 | 0.113 | 1.302 | 1.980 | 7.000 | 11.576 |
Table A7.
The sell offer quantities for the energy poverty mitigation tier, MO trading priority, in kWh.
Table A7.
The sell offer quantities for the energy poverty mitigation tier, MO trading priority, in kWh.
| Hour | P21 | P15 | P3 | C5 | C9 | C11 | C12 | C16 | C19 | C20 | C24 | C26 | Total |
|---|---|---|---|---|---|---|---|---|---|---|---|---|---|
| h06 | 0 | 0 | 0 | 0.300 | 0 | 0 | 0.600 | 0.708 | 0.200 | 0 | 0 | 0 | 1.808 |
| h07 | 0 | 0 | 0 | 0.400 | 0 | 0 | 0.800 | 1.838 | 0.300 | 0 | 0 | 0 | 3.338 |
| h08 | 0 | 0 | 0 | 4.100 | 0 | 0 | 0.600 | 0.397 | 0.300 | 0 | 0 | 0 | 5.397 |
| h09 | 1.682 | 0 | 0 | 0 | 0 | 0 | 0 | 0 | 0 | 0 | 0 | 0 | 1.682 |
| h10 | 2.292 | 1.302 | 0.493 | 0 | 0 | 0 | 0 | 0 | 0 | 0 | 0 | 0 | 4.087 |
| h11 | 2.038 | 0.563 | 0 | 0 | 0 | 0 | 0 | 0 | 0 | 0 | 0 | 0 | 2.601 |
| h12 | 1.822 | 1.860 | 0 | 0 | 0 | 0 | 0 | 0 | 0 | 0 | 0 | 0 | 3.682 |
| h13 | 0 | 0 | 0 | 0.746 | 0 | 0 | 0 | 0 | 0.3 | 0 | 0 | 0 | 1.046 |
| h14 | 1.182 | 0.641 | 0 | 0 | 0 | 0 | 0 | 0 | 0 | 0 | 0 | 0 | 1.823 |
| h15 | 0 | 0 | 0 | 0.600 | 0 | 0 | 0.155 | 0 | 0.300 | 0 | 0 | 0 | 1.055 |
| h16 | 0 | 0 | 0 | 0.600 | 0.241 | 0.700 | 0.700 | 1 | 0.400 | 1.200 | 0 | 2.500 | 7.341 |
| h17 | 0 | 0 | 0 | 2.600 | 2.400 | 2.500 | 0.700 | 1.5 | 0.400 | 1.600 | 1.181 | 2.500 | 15.381 |
| h18 | 0 | 0 | 0 | 1.300 | 1.835 | 3.000 | 0.900 | 2 | 0.500 | 1.600 | 0 | 2.800 | 13.935 |
| Total | 9.016 | 4.366 | 0.493 | 10.646 | 4.476 | 6.200 | 4.455 | 7.443 | 2.700 | 4.400 | 1.181 | 7.800 | 63.176 |
Table A8.
The sell quantities traded in the energy poverty mitigation tier, FCFS priority, in kWh.
| Hour | P21 | P7 | P15 | P6 | P3 | Total |
|---|---|---|---|---|---|---|
| h06 | 0 | 0 | 0 | 0 | 0 | 0 |
| h07 | 0 | 0 | 0 | 0 | 0 | 0 |
| h08 | 0 | 0 | 0 | 0 | 0 | 0 |
| h09 | 0 | 0 | 0 | 0 | 0 | 0 |
| h10 | 0 | 0 | 0 | 0 | 0.004 | 0.004 |
| h11 | 0 | 0 | 0 | 0 | 0.076 | 0.076 |
| h12 | 0 | 0 | 0 | 0.508 | 0 | 0.508 |
| h13 | 0 | 0 | 0 | 0 | 0 | 0 |
| h14 | 0 | 0 | 0 | 0.020 | 0 | 0.020 |
| h15 | 0 | 0.113 | 0 | 0 | 0 | 0.113 |
| h16 | 0 | 0 | 0 | 0 | 0 | 0 |
| h17 | 0 | 0 | 0 | 0 | 0 | 0 |
| h18 | 0 | 0 | 0 | 0 | 0 | 0 |
| Total | 0 | 0.113 | 0 | 0.528 | 0.08 | 0.721 |
Table A9.
The sell quantities traded in the energy poverty mitigation tier, MO priority, in kWh.
| Hour | P21 | P15 | P3 | C5 | C9 | C11 | C12 | C16 | C19 | C20 | C24 | C26 | Total |
|---|---|---|---|---|---|---|---|---|---|---|---|---|---|
| h06 | 0 | 0 | 0 | 0 | 0 | 0 | 0 | 0 | 0.192 | 0 | 0 | 0 | 0.192 |
| h07 | 0 | 0 | 0 | 0 | 0 | 0 | 0 | 0 | 0.140 | 0 | 0 | 0 | 0.140 |
| h08 | 0 | 0 | 0 | 0 | 0 | 0 | 0 | 0 | 0.152 | 0 | 0 | 0 | 0.152 |
| h09 | 0 | 0 | 0 | 0 | 0 | 0 | 0 | 0 | 0 | 0 | 0 | 0 | 0 |
| h10 | 0 | 0 | 0.004 | 0 | 0 | 0 | 0 | 0 | 0 | 0 | 0 | 0 | 0.004 |
| h11 | 0 | 0.076 | 0 | 0 | 0 | 0 | 0 | 0 | 0 | 0 | 0 | 0 | 0.076 |
| h12 | 0 | 0.508 | 0 | 0 | 0 | 0 | 0 | 0 | 0 | 0 | 0 | 0 | 0.508 |
| h13 | 0 | 0 | 0 | 0 | 0 | 0 | 0 | 0 | 0.056 | 0 | 0 | 0 | 0.056 |
| h14 | 0 | 0.020 | 0 | 0 | 0 | 0 | 0 | 0 | 0 | 0 | 0 | 0 | 0.020 |
| h15 | 0 | 0 | 0 | 0 | 0 | 0 | 0 | 0 | 0.244 | 0 | 0 | 0 | 0.244 |
| h16 | 0 | 0 | 0 | 0 | 0 | 0 | 0 | 0 | 0.088 | 0 | 0 | 0 | 0.088 |
| h17 | 0 | 0 | 0 | 0 | 0 | 0 | 0 | 0 | 0.080 | 0 | 0 | 0 | 0.080 |
| h18 | 0 | 0 | 0 | 0 | 0 | 0 | 0 | 0 | 0.228 | 0 | 0 | 0 | 0.228 |
| Total | 0 | 0.604 | 0.004 | 0 | 0 | 0 | 0 | 0 | 1.180 | 0 | 0 | 0 | 1.788 |
Appendix C. Data for the Commercial Secondary Market, Fee-Access Method
Table A10.
The sell offer quantities for the commercial fee-access tier, FCFS trading priority, in kWh.
Table A10.
The sell offer quantities for the commercial fee-access tier, FCFS trading priority, in kWh.
| Hour | P21 | P15 | P6 | P3 | Total |
|---|---|---|---|---|---|
| h06 | 0 | 0 | 0 | 0 | 0 |
| h07 | 0 | 0 | 0 | 0 | 0 |
| h08 | 0 | 0 | 0 | 0 | 0 |
| h09 | 0 | 0 | 0 | 1.815 | 1.815 |
| h10 | 0 | 1.302 | 0 | 2.836 | 4.138 |
| h11 | 0 | 0 | 0 | 2.269 | 2.269 |
| h12 | 0 | 0 | 0.733 | 0 | 0.733 |
| h13 | 0 | 0 | 0 | 0 | 0 |
| h14 | 1.182 | 0 | 0.719 | 0 | 1.901 |
| h15 | 0 | 0 | 0 | 0 | 0 |
| h16 | 0 | 0 | 0 | 0 | 0 |
| h17 | 0 | 0 | 0 | 0 | 0 |
| h18 | 0 | 0 | 0 | 0 | 0 |
| Total | 1.182 | 1.302 | 1.452 | 6.920 | 10.855 |
Table A11.
The sell offer quantities for the commercial fee-access tier, MO trading priority, in kWh.
Table A11.
The sell offer quantities for the commercial fee-access tier, MO trading priority, in kWh.
| Vendor | P21 | P15 | P3 | C5 | C9 | C11 | C12 | C16 | C19 | C20 | C24 | C26 | Total |
|---|---|---|---|---|---|---|---|---|---|---|---|---|---|
| h06 | 0 | 0 | 0 | 0.300 | 0 | 0 | 0.600 | 0.708 | 0.008 | 0 | 0 | 0 | 1.616 |
| h07 | 0 | 0 | 0 | 0.400 | 0 | 0 | 0.800 | 1.838 | 0.160 | 0 | 0 | 0 | 3.198 |
| h08 | 0 | 0 | 0 | 4.100 | 0 | 0 | 0.600 | 0.397 | 0.148 | 0 | 0 | 0 | 5.245 |
| h09 | 1.682 | 0 | 0 | 0 | 0 | 0 | 0 | 0 | 0 | 0 | 0 | 0 | 1.682 |
| h10 | 2.292 | 1.302 | 0.489 | 0 | 0 | 0 | 0 | 0 | 0 | 0 | 0 | 0 | 4.083 |
| h11 | 2.038 | 0.487 | 0 | 0 | 0 | 0 | 0 | 0 | 0 | 0 | 0 | 0 | 2.525 |
| h12 | 1.822 | 1.352 | 0 | 0 | 0 | 0 | 0 | 0 | 0 | 0 | 0 | 0 | 3.174 |
| h13 | 0 | 0 | 0 | 0.746 | 0 | 0 | 0 | 0 | 0.244 | 0 | 0 | 0 | 0.990 |
| h14 | 1.182 | 0.621 | 0 | 0 | 0 | 0 | 0 | 0 | 0 | 0 | 0 | 0 | 1.803 |
| h15 | 0 | 0 | 0 | 0.600 | 0 | 0 | 0.155 | 0 | 0.056 | 0 | 0 | 0 | 0.811 |
| h16 | 0 | 0 | 0 | 0.600 | 0.241 | 0.700 | 0.700 | 1.000 | 0.312 | 1.200 | 0 | 2.500 | 7.253 |
| h17 | 0 | 0 | 0 | 2.600 | 2.400 | 2.500 | 0.700 | 1.500 | 0.320 | 1.600 | 1.181 | 2.500 | 15.301 |
| h18 | 0 | 0 | 0 | 1.300 | 1.835 | 3.000 | 0.900 | 2.000 | 0.272 | 1.600 | 0 | 2.800 | 13.707 |
| Total | 9.016 | 3.762 | 0.489 | 10.646 | 4.476 | 6.200 | 4.455 | 7.443 | 1.520 | 4.400 | 1.181 | 7.800 | 61.388 |
Table A12.
The sell quantities traded in the commercial fee-access tier, FCFS trading priority.
| Hour | 21 | 15 | 6 | 3 | Total |
|---|---|---|---|---|---|
| h06 | 0 | 0 | 0 | 0 | 0 |
| h07 | 0 | 0 | 0 | 0 | 0 |
| h08 | 0 | 0 | 0 | 0 | 0 |
| h09 | 0 | 0 | 0 | 1.386 | 1.386 |
| h10 | 0 | 0 | 0 | 2.120 | 2.120 |
| h11 | 0 | 0 | 0 | 1.853 | 1.853 |
| h12 | 0 | 0 | 0.733 | 0 | 0.733 |
| h13 | 0 | 0 | 0 | 0 | 0 |
| h14 | 0.858 | 0 | 0.719 | 0 | 1.576 |
| h15 | 0 | 0 | 0 | 0 | 0 |
| h16 | 0 | 0 | 0 | 0 | 0 |
| h17 | 0 | 0 | 0 | 0 | 0 |
| h18 | 0 | 0 | 0 | 0 | 0 |
| Total | 0.858 | 0 | 1.452 | 5.359 | 7.668 |
Table A13.
The sell quantities traded in the commercial fee-access tier, MO trading priority, in kWh.
Table A13.
The sell quantities traded in the commercial fee-access tier, MO trading priority, in kWh.
| Hour | P21 | P15 | P3 | C5 | C9 | C11 | C12 | C16 | C19 | C20 | C24 | C26 | Total |
|---|---|---|---|---|---|---|---|---|---|---|---|---|---|
| h06 | 0 | 0 | 0 | 0.300 | 0 | 0 | 0.600 | 0.708 | 0.008 | 0 | 0 | 0 | 1.616 |
| h07 | 0 | 0 | 0 | 0.400 | 0 | 0 | 0.474 | 0 | 0.160 | 0 | 0 | 0 | 1.034 |
| h08 | 0 | 0 | 0 | 0.959 | 0 | 0 | 0 | 0 | 0.148 | 0 | 0 | 0 | 1.107 |
| h09 | 1.386 | 0 | 0 | 0 | 0 | 0 | 0 | 0 | 0 | 0 | 0 | 0 | 1.386 |
| h10 | 0.329 | 1.302 | 0.489 | 0 | 0 | 0 | 0 | 0 | 0 | 0 | 0 | 0 | 2.120 |
| h11 | 1.366 | 0.487 | 0 | 0 | 0 | 0 | 0 | 0 | 0 | 0 | 0 | 0 | 1.853 |
| h12 | 0.808 | 1.352 | 0 | 0 | 0 | 0 | 0 | 0 | 0 | 0 | 0 | 0 | 2.160 |
| h13 | 0 | 0 | 0 | 0.746 | 0 | 0 | 0 | 0 | 0.244 | 0 | 0 | 0 | 0.990 |
| h14 | 0.955 | 0.621 | 0 | 0 | 0 | 0 | 0 | 0 | 0 | 0 | 0 | 0 | 1.576 |
| h15 | 0 | 0 | 0 | 0.600 | 0 | 0 | 0.155 | 0 | 0.056 | 0 | 0 | 0 | 0.811 |
| h16 | 0 | 0 | 0 | 0.600 | 0 | 0 | 0.700 | 0.8 | 0.312 | 0 | 0 | 0 | 2.412 |
| h17 | 0 | 0 | 0 | 1.470 | 0 | 0 | 0 | 0 | 0.320 | 0 | 0 | 0 | 1.790 |
| h18 | 0 | 0 | 0 | 1.300 | 0 | 0 | 0.848 | 0 | 0.272 | 0 | 0 | 0 | 2.420 |
| Total | 4.844 | 3.762 | 0.489 | 6.375 | 0 | 0 | 2.777 | 1.508 | 1.520 | 0 | 0 | 0 | 21.275 |
Table A14.
The buy quantities traded in the commercial fee-access tier, MO trading priority, in kWh.
Table A14.
The buy quantities traded in the commercial fee-access tier, MO trading priority, in kWh.
| Hour | C13 | C17 | C18 | Total |
|---|---|---|---|---|
| h06 | 0 | 0 | 0 | 0 |
| h07 | 0 | 0 | 0 | 0 |
| h08 | 0 | 0 | 0 | 0 |
| h09 | 0.502 | 0.380 | 0.504 | 1.386 |
| h10 | 1.046 | 0.495 | 0.579 | 2.120 |
| h11 | 0.150 | 1.130 | 0.573 | 1.853 |
| h12 | 0.733 | 0 | 0 | 0.733 |
| h13 | 0 | 0 | 0 | 0 |
| h14 | 0.056 | 0.980 | 0.540 | 1.576 |
| h15 | 0 | 0 | 0 | 0 |
| h16 | 0 | 0 | 0 | 0 |
| h17 | 0 | 0 | 0 | 0 |
| h18 | 0 | 0 | 0 | 0 |
| Total | 2.487 | 2.985 | 2.196 | 7.668 |
Table A15.
The buy quantities traded in the commercial fee-access tier, MO trading priority, in kWh.
Table A15.
The buy quantities traded in the commercial fee-access tier, MO trading priority, in kWh.
| Hour | C13 | C17 | C18 | Total |
|---|---|---|---|---|
| h06 | 1.416 | 0 | 0.200 | 1.616 |
| h07 | 0.482 | 0.075 | 0.477 | 1.034 |
| h08 | 0.182 | 0.475 | 0.450 | 1.107 |
| h09 | 0.502 | 0.380 | 0.504 | 1.386 |
| h10 | 1.046 | 0.495 | 0.579 | 2.120 |
| h11 | 0.150 | 1.130 | 0.573 | 1.853 |
| h12 | 1.032 | 0.630 | 0.498 | 2.160 |
| h13 | 0.056 | 0.334 | 0.600 | 0.990 |
| h14 | 0.056 | 0.980 | 0.540 | 1.576 |
| h15 | 0.236 | 0.218 | 0.357 | 0.811 |
| h16 | 1.024 | 0.965 | 0.423 | 2.412 |
| h17 | 0.232 | 0.970 | 0.588 | 1.790 |
| h18 | 0.890 | 0.960 | 0.570 | 2.420 |
| Total | 7.304 | 7.612 | 6.359 | 21.275 |
References
- Agora-Energiewende, European Energy Transition 2030: The Big Picture. Available online: https://www.agora-energiewende.de/fileadmin2/Projekte/2019/EU_Big_Picture/153_EU-Big-Pic_WEB.pdf (accessed on 1 August 2020).
- Saevelect, What Is eDREAM? Available online: https://www.todaysoftmag.ro/article/2469/tehnologia-blockchain (accessed on 1 August 2020).
- Haber, S.; Scott Stornetta, W. How to time-stamp a digital document. J. Cryptol. 1991, 3, 99–111. [Google Scholar] [CrossRef]
- Bayer, D.; Haber, S.; Scott Stornetta, W. Improving the Efficiency and Reliability of Digital Time-Stamping; Capocelli, R., de Santis, A., Vaccaro, U., Eds.; Sequences II; Springer: New York, NY, USA, 1993. [Google Scholar]
- Toth, L.A. Blockchain Technology, Today Software Magazine. Available online: https://www.todaysoftmag.ro/article/2469/tehnologia-blockchain (accessed on 1 August 2020).
- Tradesilvania. Why Use Blockchain Technology? Available online: https://tradesilvania.com/ro/ (accessed on 1 August 2020).
- Stratulat, A.M. Blockchain: A New Paradigm for the Energy System. Available online: https://medium.com/@adrianmihaistratulat/blockchain-o-noua-paradigma-pentru-sistemul-energetic-ac95761b12a2 (accessed on 1 August 2020).
- Unlimited Energy for Energy Communities from Renewable Sources. Available online: http://fiiprosumator.ro/static/brosura-greenpeace-energie-fara-limite.pdf (accessed on 1 August 2020).
- Unguru, M. Blockchain technology: Opportunities for the energy sector. Euro Infor 2018, 2, 53–58. [Google Scholar]
- NewsEnergy, Blockchain Technology and Renewables, the Next “Power Couple”. Available online: https://newsenergy.ro/tehnologia-blockchain-si-regenerabilele-urmatorul-power-couple/ (accessed on 1 August 2020).
- Andoni, M.; Robu, V.; Flynn, D.; Abram, S.; Geach, D.; Jenkins, D.; McCallum, P.; Peacock, A. Blockchain technology in the energy sector: A systematic review of challenges and opportunities. Renew. Sustain. Energy Rev. 2019, 100, 143–174. [Google Scholar] [CrossRef]
- Mika, B.; Goudz, A. Blockchain-technology in the energy industry: Blockchain as a driver of the energy revolution? With focus on the situation in Germany. Energy Syst. 2020. [Google Scholar] [CrossRef]
- PwC Global Power & Utilities, Blockchain an Opportunity for Energy Producers and Consumers? Available online: https://www.pwc.com/gx/en/industries/assets/pwc-blockchain-opportunity-for-energy-producers-and-consumers.pdf (accessed on 1 August 2020).
- Maxim, A.; Mihai, C.; Apostoaie, C.-M.; Popescu, C.; Istrate, C.; Bostan, I. Implications and Measurement of Energy Poverty across the European Union. Sustainability 2016, 8, 483. [Google Scholar] [CrossRef] [Green Version]
- Surowiecki, J. The Wisdom of Crowds; Anchor: San Diego, CA, USA, 2005. [Google Scholar]
- Wang, S.; Taha, A.F.; Wang, J.; Kvaternik, K.; Hahn, A. Energy crowdsourcing and peer-to-peer energy trading in blockchain-enabled smart grids. IEEE Trans. Syst. Man Cybern. B Cybern. 2019, 49, 1612–1623. [Google Scholar] [CrossRef] [Green Version]
- National Regulatory Authority for Energy. The 228 Order for the Approval of the Technical Norm Technical Conditions for Connection to the Public Electrical Networks of the Prosumers; National Regulatory Authority for Energy: Bucharest, Romania, 2018. [Google Scholar]
- Neagu, B.C.; Grigoras, G.; Ivanov, O. An Efficient Peer-to-Peer Based Blokchain Approach for Prosumers Energy Trading in Microgrids. In Proceedings of the International Conference on Modern Power Systems (MPS), Cluj Napoca, Romania, 21–23 May 2019; pp. 1–4. [Google Scholar]
- Mohan, V.; Bu, S.; Jisma, M.; Rijinlal, V.C.; Thirumala, K.; Thomas, M.S.; Xu, Z. Realistic energy commitments in peer-to-peer transactive market with risk adjusted prosumer welfare maximization. Int. J. Electr. Power Energy Syst. 2020, 124, 106377. [Google Scholar] [CrossRef]
- De La Nieta, A.A.S.; Gibescu, M.; Wang, X.; Song, M.; Jensen, E.; Saleem, A.; Bremdal, B.; Ilieva, I. Local economic dispatch with local renewable generation and flexible load management. In Proceedings of the International Conference on Smart Energy Systems and Technologies (SEST), Sevilla, Spain, 10–12 September 2018; pp. 1–6. [Google Scholar]
- Ottesen, S.Ø.; Tomasgard, A.; Fleten, S.-E. Prosumer bidding and scheduling in electricity markets. Energy 2016, 94, 828–843. [Google Scholar] [CrossRef]
- Ferruzzi, G.; Cervone, G.; Delle Monache, L.; Graditi, G.; Jacobone, F. Optimal bidding in a Day-Ahead energy market for Micro Grid under uncertainty in renewable energy production. Energy 2016, 106, 194–202. [Google Scholar] [CrossRef]
- Gregg, J.S.; Nyborg, S.; Hansen, M.; Schwanitz, V.J.; Wierling, A.; Zeiss, J.P.; Delvaux, S.; Saenz, V.; Polo-Alvarez, L.; Candelise, C.; et al. Collective action and social innovation in the energy sector: A mobilization model perspective. Energies 2020, 13, 651. [Google Scholar] [CrossRef] [Green Version]
- Candelise, C.; Ruggieri, G. Status and evolution of the community energy sector in Italy. Energies 2020, 13, 1888. [Google Scholar] [CrossRef] [Green Version]
- Marinakis, V.; Doukas, H.; Koasidis, K.; Albuflasa, H. From intelligent energy management to value economy through a digital energy currency: Bahrain city case study. Sensors 2020, 20, 1456. [Google Scholar] [CrossRef] [PubMed] [Green Version]
- Horstink, L.; Wittmayer, J.M.; Ng, K.; Luz, G.P.; Marín-González, E.; Gährs, S.; Campos, I.; Holstenkamp, L.; Oxenaar, S.; Brown, D. Collective renewable energy prosumers and the promises of the energy union: Taking stock. Energies 2020, 13, 421. [Google Scholar] [CrossRef] [Green Version]
- The First Green Energy Cooperative in Romania Will “Open Its Doors” Soon, Including for Prosumers. Available online: https://newsenergy.ro/prima-cooperativa-de-energie-verde-din-romania-isi-va-deschide-portile-in-curand-inclusiv-pentru-prosumatori/ (accessed on 1 August 2020).
- Son, Y.-B.; Im, J.-H.; Kwon, H.-Y.; Jeon, S.-Y.; Lee, M.-K. Privacy-preserving peer-to-peer energy trading in blockchain-enabled smart grids using functional encryption. Energies 2020, 13, 1321. [Google Scholar] [CrossRef] [Green Version]
- Wang, S.; Taha, A.F.; Wang, J. Blockchain-assisted crowdsourced energy systems. In Proceedings of the IEEE Power & Energy Society General Meeting (PESGM), Porto, Portugal, 9–11 September 2018; pp. 1–5. [Google Scholar]
- Morstyn, T.; Teytelboym, A.; Hepburn, C.; McCulloch, M.D. Integrating P2P Energy Trading with Probabilistic Distribution Locational Marginal Pricing. IEEE Trans. Smart Grid 2019, 11, 3095–3106. [Google Scholar] [CrossRef]
- Fu, M.; Xu, Z.; Wang, N.; Lyu, X.; Xu, W. “Peer-to-Peer Plus” electricity transaction within community of active energy agents regarding distribution network constraints. Energies 2020, 13, 2408. [Google Scholar] [CrossRef]
- Khorasany, M.; Mishra, Y.; Ledwich, G. Design of auction-based approach for market clearing in peer-to-peer market platform. J. Eng. 2019, 4813–4818. [Google Scholar] [CrossRef]
- Khorasany, M.; Azuatalam, D.; Glasgow, R.; Liebman, A.; Razzaghi, R. Transactive energy market for energy management in microgrids: The monash microgrid case study. Energies 2020, 13, 2010. [Google Scholar] [CrossRef]
- Haghifam, S.; Zare, K.; Abapour, M.; Muñoz-Delgado, G.; Contreras, J. A stackelberg game-based approach for transactive energy management in smart distribution networks. Energies 2020, 13, 3621. [Google Scholar] [CrossRef]
- Liu, Z.; Gao, J.; Yu, H.; Wang, X. Operation mechanism and strategies for transactive electricity market with multi-microgrid in grid-connected mode. IEEE Access 2020, 8, 79594–79603. [Google Scholar] [CrossRef]
- Hwang, Y.M.; Sim, I.; Sun, Y.G.; Lee, H.-J.; Kim, J.Y. Game-theory modeling for social welfare maximization in smart grids. Energies 2018, 11, 2315. [Google Scholar] [CrossRef] [Green Version]
- Singh, P.; Talwariya, A.; Kolhe, M. Demand response management in the presence of renewable energy sources using Stackelberg game theory. IOP Conf. Ser. Mater. Sci. Eng. 2019, 605, 012004. [Google Scholar] [CrossRef]
- Arun, S.L.; Selvan, M.P. Prosumer based demand response for profitable power exchange between end-user and utility. In Proceedings of the 2018 20th National Power Systems Conference (NPSC), Iruchirappalli, India, 14–16 December 2018; pp. 1–6. [Google Scholar]
- Liu, T.; Tan, X.; Sun, B.; Wu, Y.; Guan, X.; Tsang, D.H. Energy management of cooperative microgrids with p2p energy sharing in distribution networks. In Proceedings of the 2015 IEEE International Conference on Smart Grid Communications (SmartGridComm), Miami, FL, USA, 2–5 November 2015; pp. 410–415. [Google Scholar]
- Neagu, B.-C.; Ivanov, O.; Grigoras, G.; Gavrilas, M. A new vision on the prosumers energy surplus trading considering smart peer-to-peer contracts. Mathematics 2020, 8, 235. [Google Scholar] [CrossRef] [Green Version]
- Yahaya, A.S.; Javaid, N.; Alzahrani, F.A.; Rehman, A.; Ullah, I.; Shahid, A.; Shafiq, M. Blockchain based sustainable local energy trading considering home energy management and demurrage mechanism. Sustainability 2020, 12, 3385. [Google Scholar] [CrossRef] [Green Version]
- Lovati, M.; Zhang, X.; Huang, P.; Olsmats, C.; Maturi, L. Optimal simulation of three peer to peer (p2p) business models for individual pv prosumers in a local electricity market using agent-based modelling. Buildings 2020, 10, 138. [Google Scholar] [CrossRef]
- Martín, D.; Bordel, B.; Alcarria, R.; Sánchez-Picot, Á.; de Rivera, D.S.; Robles, T. Prosumerization Approach to Semantic Ambient Intelligence Platforms. In Proceedings of the International Conference on Ubiquitous Computing and Ambient Intelligence, Philadelphia, PA, USA, 7–10 November 2017; pp. 109–120. [Google Scholar]
- Parag, Y. Beyond energy efficiency: A prosumer market as an integrated platform for consumer engagement with the energy system. Eur. Counc. Energy Effic. Econ. Summer Study 2015, 1, 15–23. [Google Scholar]
- Bytschkow, D.; Capone, A.; Mayer, J.; Kramer, M.; Licklederer, T. An OPC UA-based Energy Management Platform for Multi-Energy Prosumers in Districts. In Proceedings of the 2019 IEEE PES Innovative Smart Grid Technologies Europe (ISGT-Europe), Bucharest, Romania, 29 September–2 October 2019; pp. 1–5. [Google Scholar]
- Mamounakis, I.; Vergados, D.J.; Makris, P.; Varvarigos, E.; Mavridis, T. A virtual microgrid platform for the efficient orchestration of multiple energy prosumers. In Proceedings of the 19th Panhellenic Conference on Informatics (PCI’15), Athens, Greece, 1–3 October 2015. [Google Scholar]
- Küfeoğlu, S.; Lehtonen, M. Comparison of different models for estimating the residential sector customer interruption costs. Electr. Power Syst. Res. 2015, 122, 50–55. [Google Scholar] [CrossRef] [Green Version]
- Samuel, O.; Almogren, A.; Javaid, A.; Zuair, M.; Ullah, I.; Javaid, N. Leveraging blockchain technology for secure energy trading and least-cost evaluation of decentralized contributions to electrification in Sub-Saharan Africa. Entropy 2020, 22, 226. [Google Scholar] [CrossRef] [Green Version]
- Engeland, K.; Borga, M.; Creutin, J.-D.; François, B.; Ramos, M.-H.; Vidal, J.-P. Space-time variability of climate variables and intermittent renewable electricity production—A review. Renew. Sustain. Energy Rev. 2017, 79, 600–617. [Google Scholar] [CrossRef]
- Etukudor, C.; Couraud, B.; Robu, V.; Früh, W.-G.; Flynn, D.; Okereke, C. Automated negotiation for peer-to-peer electricity trading in local energy markets. Energies 2020, 13, 920. [Google Scholar] [CrossRef] [Green Version]
- Narayanan, A.; Haapaniemi, J.; Kaipia, T.; Partanen, J. Economic impacts of power-based tariffs on peer-to-peer electricity exchange in community microgrids. In Proceedings of the International Conference on the European Energy Market, EEM, Lodz, Poland, 27–29 June 2018. [Google Scholar]
- Kuzemko, C.; Lawrence, A.; Watson, M. New directions in the international political economy of energy. Rev. Int. Polit. Econ. 2019, 26, 1–24. [Google Scholar] [CrossRef] [Green Version]
- Van Leeuwen, G.; AlSkaif, T.; Gibescu, M.; van Sark, W. An integrated blockchain-based energy management platform with bilateral trading for microgrid communities. Appl. Energy 2020, 263, 114613. [Google Scholar] [CrossRef]
- Huang, H.; Nie, S.; Lin, J.; Wang, Y.; Dong, J. Optimization of peer-to-peer power trading in a microgrid with distributed PV and battery energy storage systems. Sustainability 2020, 12, 923. [Google Scholar] [CrossRef] [Green Version]
- Ghaemi, S.; Khazaei, H.; Musilek, P. ChainFaaS: An open blockchain-based serverless platform. IEEE Access 2020, 8, 131760–131778. [Google Scholar] [CrossRef]
- Anthony, B.; Petersen, S.A.; Ahlers, D.; Krogstie, J.; Livik, K. Big data-oriented energy prosumption service in smart community districts: A multi-case study perspective. Energy Inform. 2019, 2, 36. [Google Scholar] [CrossRef]
- Cornélusse, B.; Savelli, I.; Paoletti, S.; Giannitrapani, A.; Vicino, A. A community microgrid architecture with an internal local market. Appl. Energy 2019, 242, 547–560. [Google Scholar] [CrossRef] [Green Version]
- Eisele, S.; Eghtesad, T.; Campanelli, K.; Agrawal, P.; Laszka, A.; Dubey, A. Safe and private forward-trading platform for transactive microgrids. arXiv 2019, arXiv:1910.12579. [Google Scholar]
- Laszka, A.; Eisele, S.; Dubey, A.; Karsai, G.; Kvaternik, K. TRANSAX: A blockchain-based decentralized forward-trading energy exchanged for transactive microgrids. In Proceedings of the 24th International Conference on Parallel and Distributed Systems (ICPADS), Singapore, Singapore, 11–13 December 2018; pp. 918–927. [Google Scholar]
- Li, S.; Lian, J.; Conejo, A.; Zhang, W. Transactive energy system: Market-Based coordination of distributed energy resources. arXiv 2019, arXiv:1908.03641. [Google Scholar]
- Vergados, D.J.; Mamounakis, I.; Makris, P.; Varvarigos, E. Prosumer clustering into virtual microgrids for cost reduction in renewable energy trading markets. Sustain. Energy Grids Netw. 2016, 7, 90–103. [Google Scholar] [CrossRef]
- Cui, S.; Wang, Y.; Xiao, J. Peer-to-Peer energy sharing among smart energy buildings by distributed transaction. IEEE Trans. Smart Grid 2019, 6, 6491–6501. [Google Scholar] [CrossRef]
- Cui, S.; Wang, Y.; Shi, Y.; Xiao, J. A new and fair Peer-to-Peer energy sharing framework for energy buildings. IEEE Trans. Smart Grid 2020, 11, 3817–3826. [Google Scholar] [CrossRef]
- Ghorbanian, M.; Dolatabadi, S.H.; Siano, P.; Kouveliotis-Lysikatos, I.; Hatziargyriou, N.D. Methods for flexible management of blockchain-based cryptocurrencies in electricity markets and smart grids. IEEE Trans. Smart Grid 2020, 11, 4227–4235. [Google Scholar] [CrossRef]
- Praça, I.; Ramos, S.; Andrade, R.; da Silva, A.S.; Sica, E.T. Analysis and simulation of local energy markets. In Proceedings of the 2019 16th International Conference on the European Energy Market (EEM), Ljubljana, Slovenia, 18–20 September 2019; pp. 1–5. [Google Scholar]
- Neves, D.; Scott, I.; Silva, C.A. Peer-to-peer energy trading potential: An assessment for the residential sector under different technology and tariff availabilities. Energy 2020, 205, 118023. [Google Scholar] [CrossRef]
- Almenning, O.M.; Bjarghov, S.; Farahmand, H. Reducing Neighborhood Peak Loads with implicit Peer-to-Peer energy trading under Subscribed Capacity tariffs. In Proceedings of the 2019 International Conference on Smart Energy Systems and Technologies (SEST), Porto, Portugal, 9–11 September 2019; pp. 1–6. [Google Scholar]
- Liang, B.; Liu, W.; Sun, L.; He, Z.; Hou, B. An aggregated model for energy management considering crowdsourcing behaviors of distributed energy resources. IEEE Access 2020, 7, 145757–145766. [Google Scholar] [CrossRef]
- Zepter, J.M.; Lüth, A.; Del Granado, P.C.; Egging, R. Prosumer integration in wholesale electricity markets: Synergies of peer-to-peer trade and residential storage. Energy Build. 2019, 184, 163–176. [Google Scholar] [CrossRef]
- Neagu, B.C.; Gavrilaş, M.; Pentiuc, R.D.; Hopulele, E. Optimal Placement of Energy Storage Systems in Microgrids Using a PSO based Approach. In Proceedings of the 2019 IEEE PES Innovative Smart Grid Technologies Europe (ISGT-Europe), Bucharest, Romania, 29 September–2 October 2019; pp. 1–5. [Google Scholar] [CrossRef]
- Faraji, J.; Ketabi, A.; Hashemi-Dezaki, H. Optimization of the scheduling and operation of prosumers considering the loss of life costs of battery storage systems. J. Energy Storage 2020, 31, 101655. [Google Scholar] [CrossRef]
- All You Need to Know to Become A Prosumer. Available online: https://energyindustryreview.com/renewables/all-you-need-to-know-to-become-a-prosumer/ (accessed on 4 August 2020).
- Neagu, B.C.; Grigoras, G. A Fair Load Sharing Approach Based on Microgrid Clusters and Transactive Energy Concept. In Proceedings of the 12th International Conference on Electronics, Computers and Artificial Intelligence (ECAI 2020), Bucharest, Romania, 25–27 June 2020; pp. 1–5. [Google Scholar]
- Electricity Market Monitoring Report—April 2020. Available online: https://www.anre.ro/en/electric-energy/legislation/electictricity-market-monitoring/2020 (accessed on 4 August 2020).
Figure 1.
The basic diagram of the proposed market algorithm.

Figure 2.
The basic diagram of the primary market ‘first-come-first-served’ trading mechanism.
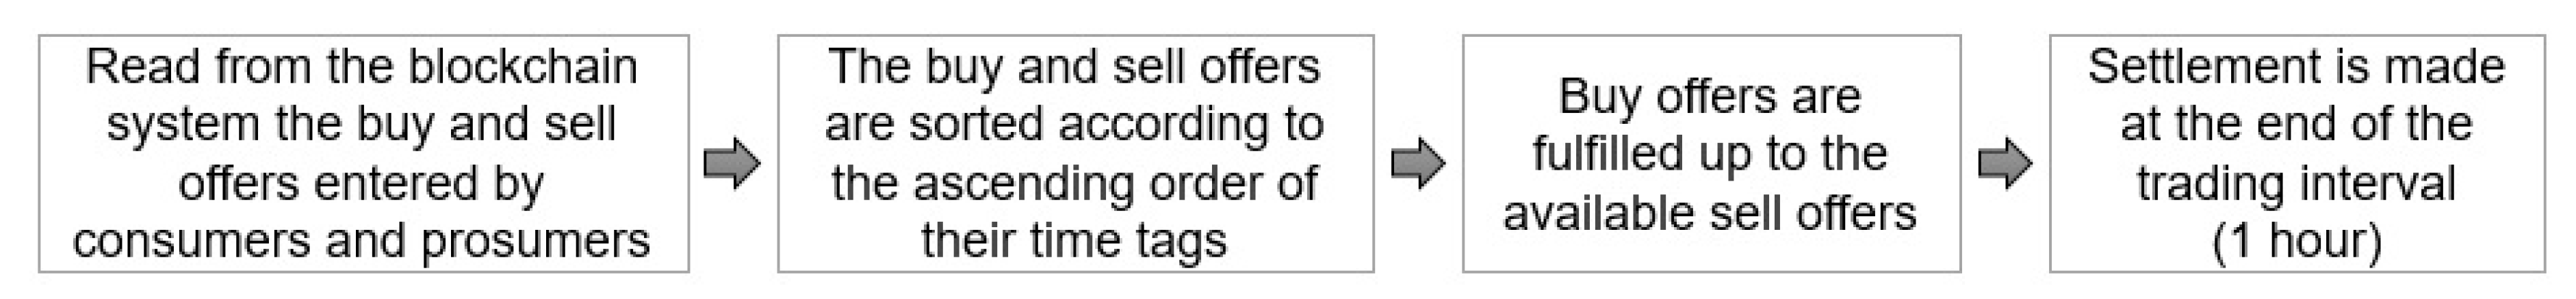
Figure 3.
The basic diagram of the primary market merit-order trading mechanism.

Figure 4.
The merit-order trading mechanism.
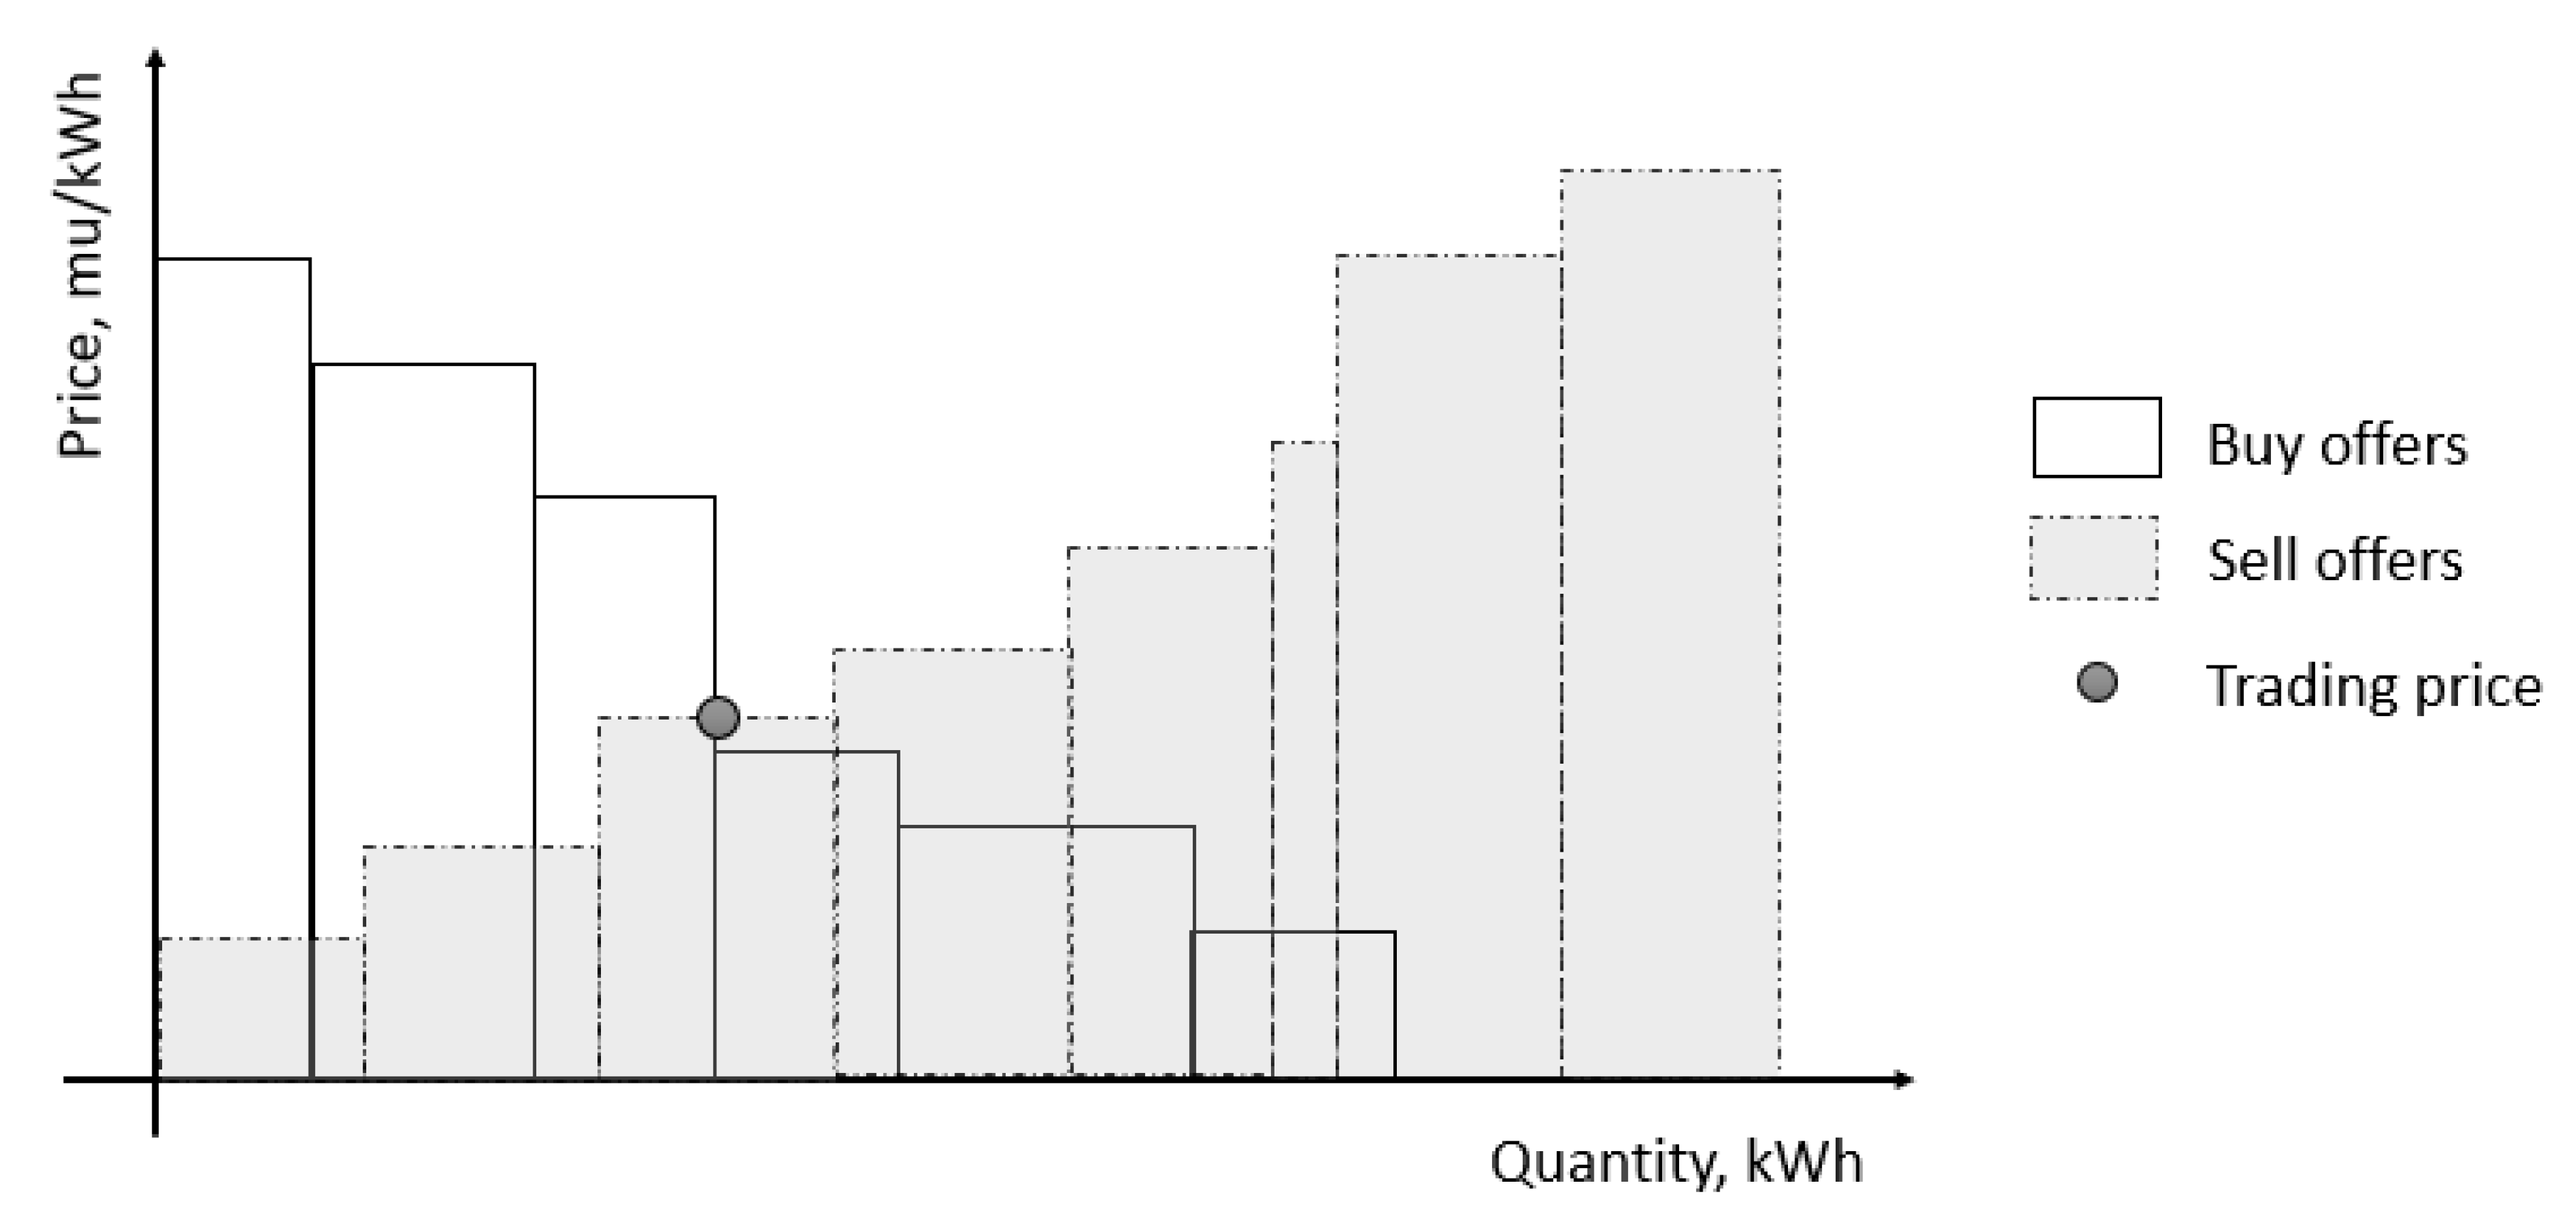
Figure 5.
The flowchart of the primary market trading algorithm.
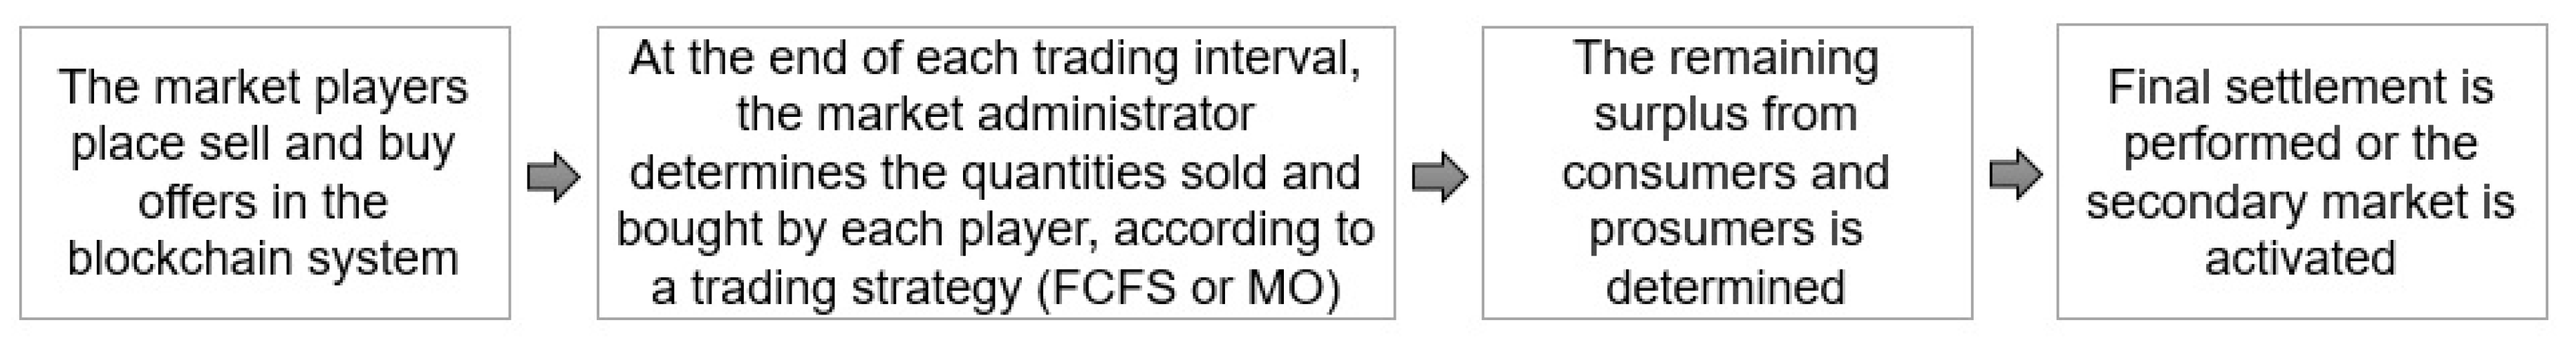
Figure 6.
The flowchart of the social inclusion tier of the secondary market.
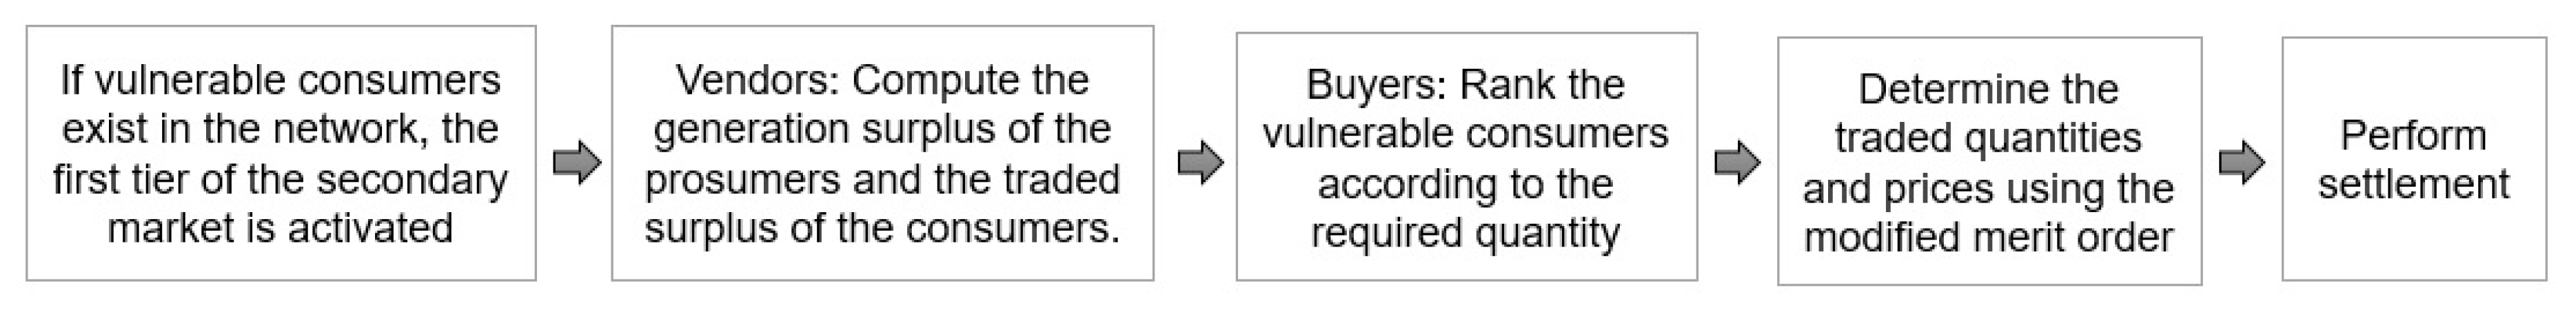
Figure 7.
The flowchart of the secondary market fee-access model.

Figure 8.
The flowchart of the secondary market invite-access model.
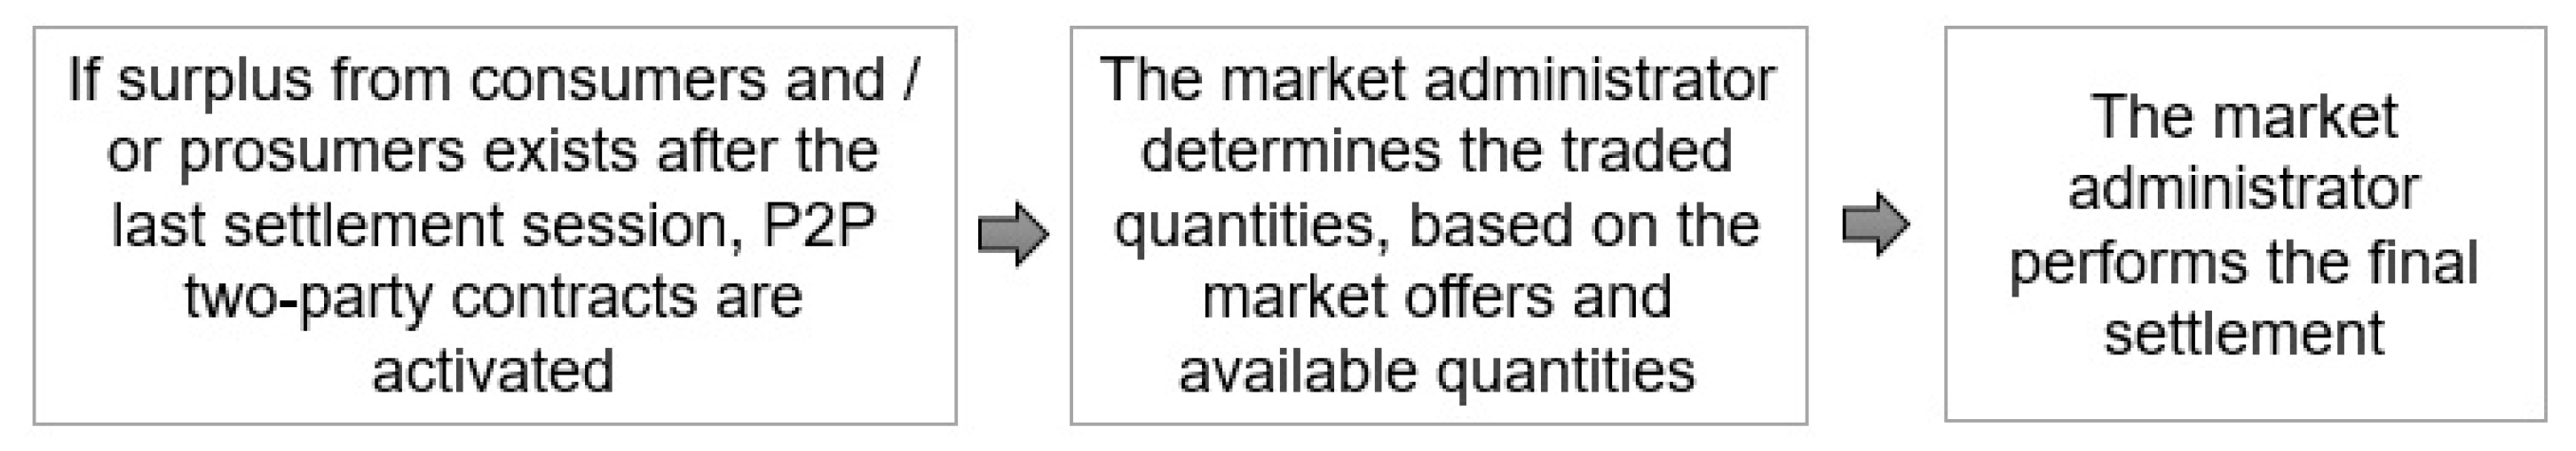
Figure 9.
The low voltage (LV) microgrid used in the case study.
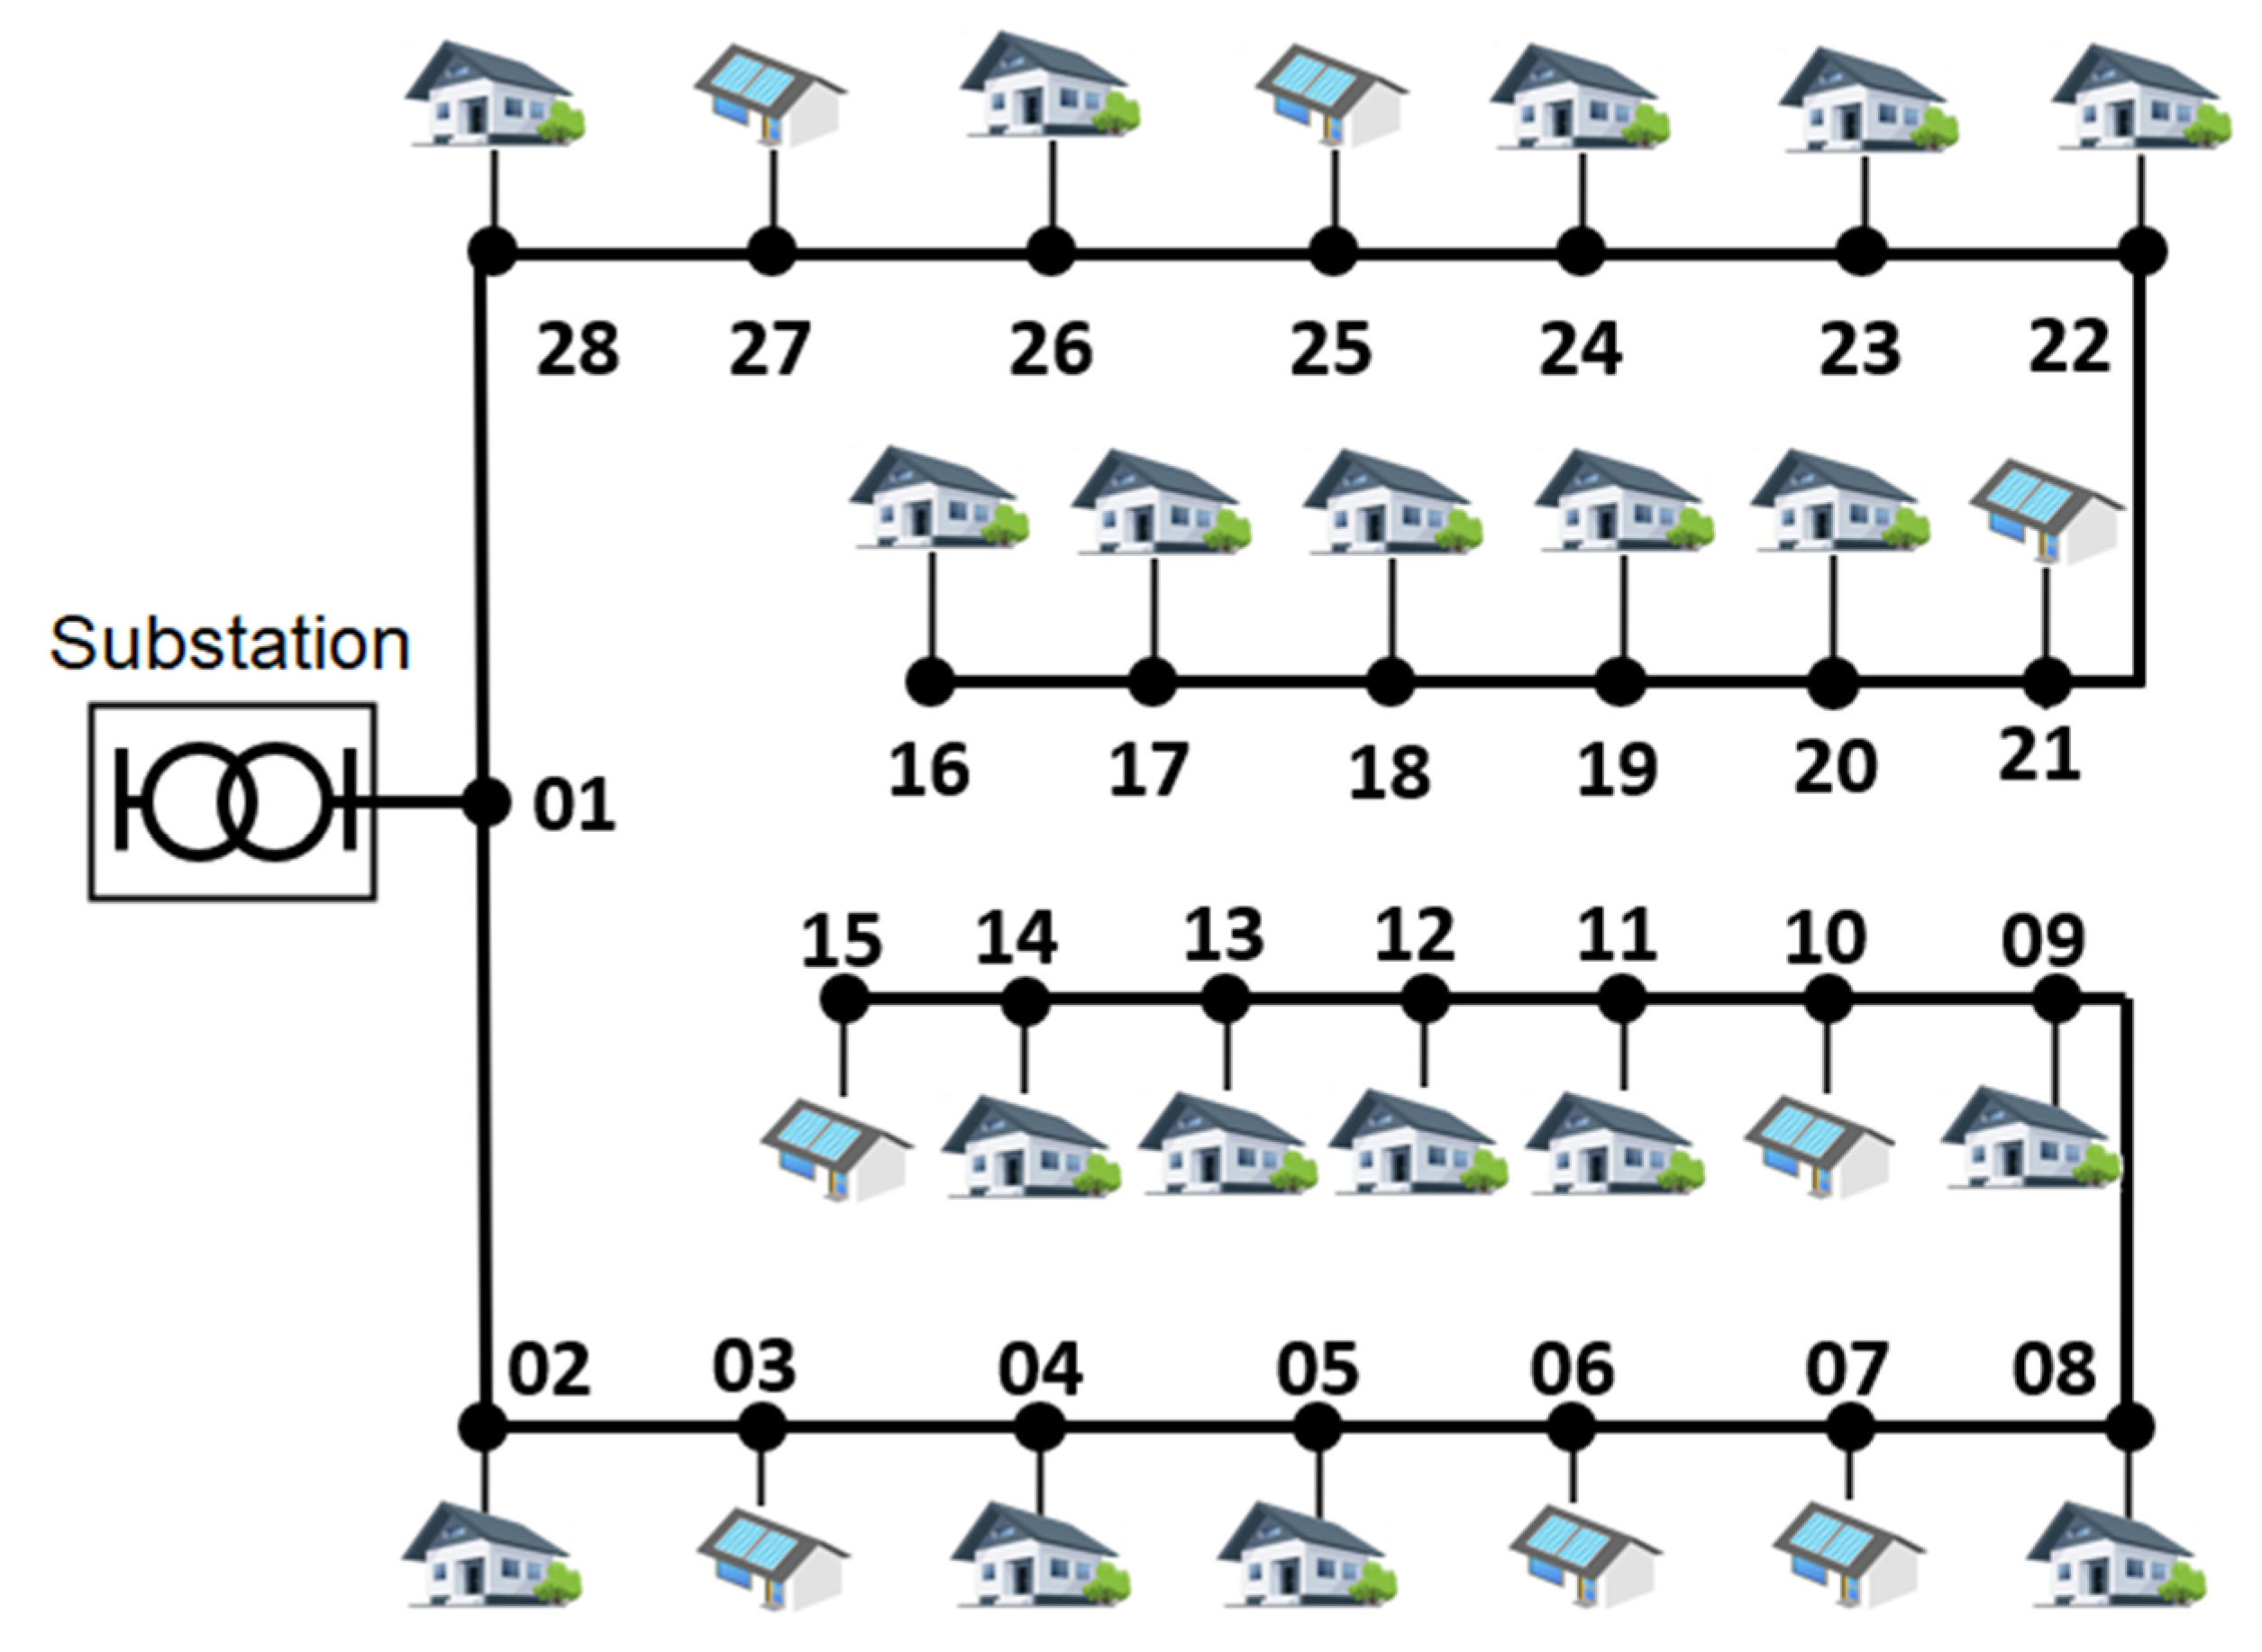
Figure 10.
The total electricity surplus: (a) hourly; (b) for each prosumer.

Figure 11.
The buyer quantity offers in the primary market: (a) hourly; (b) for each consumer.
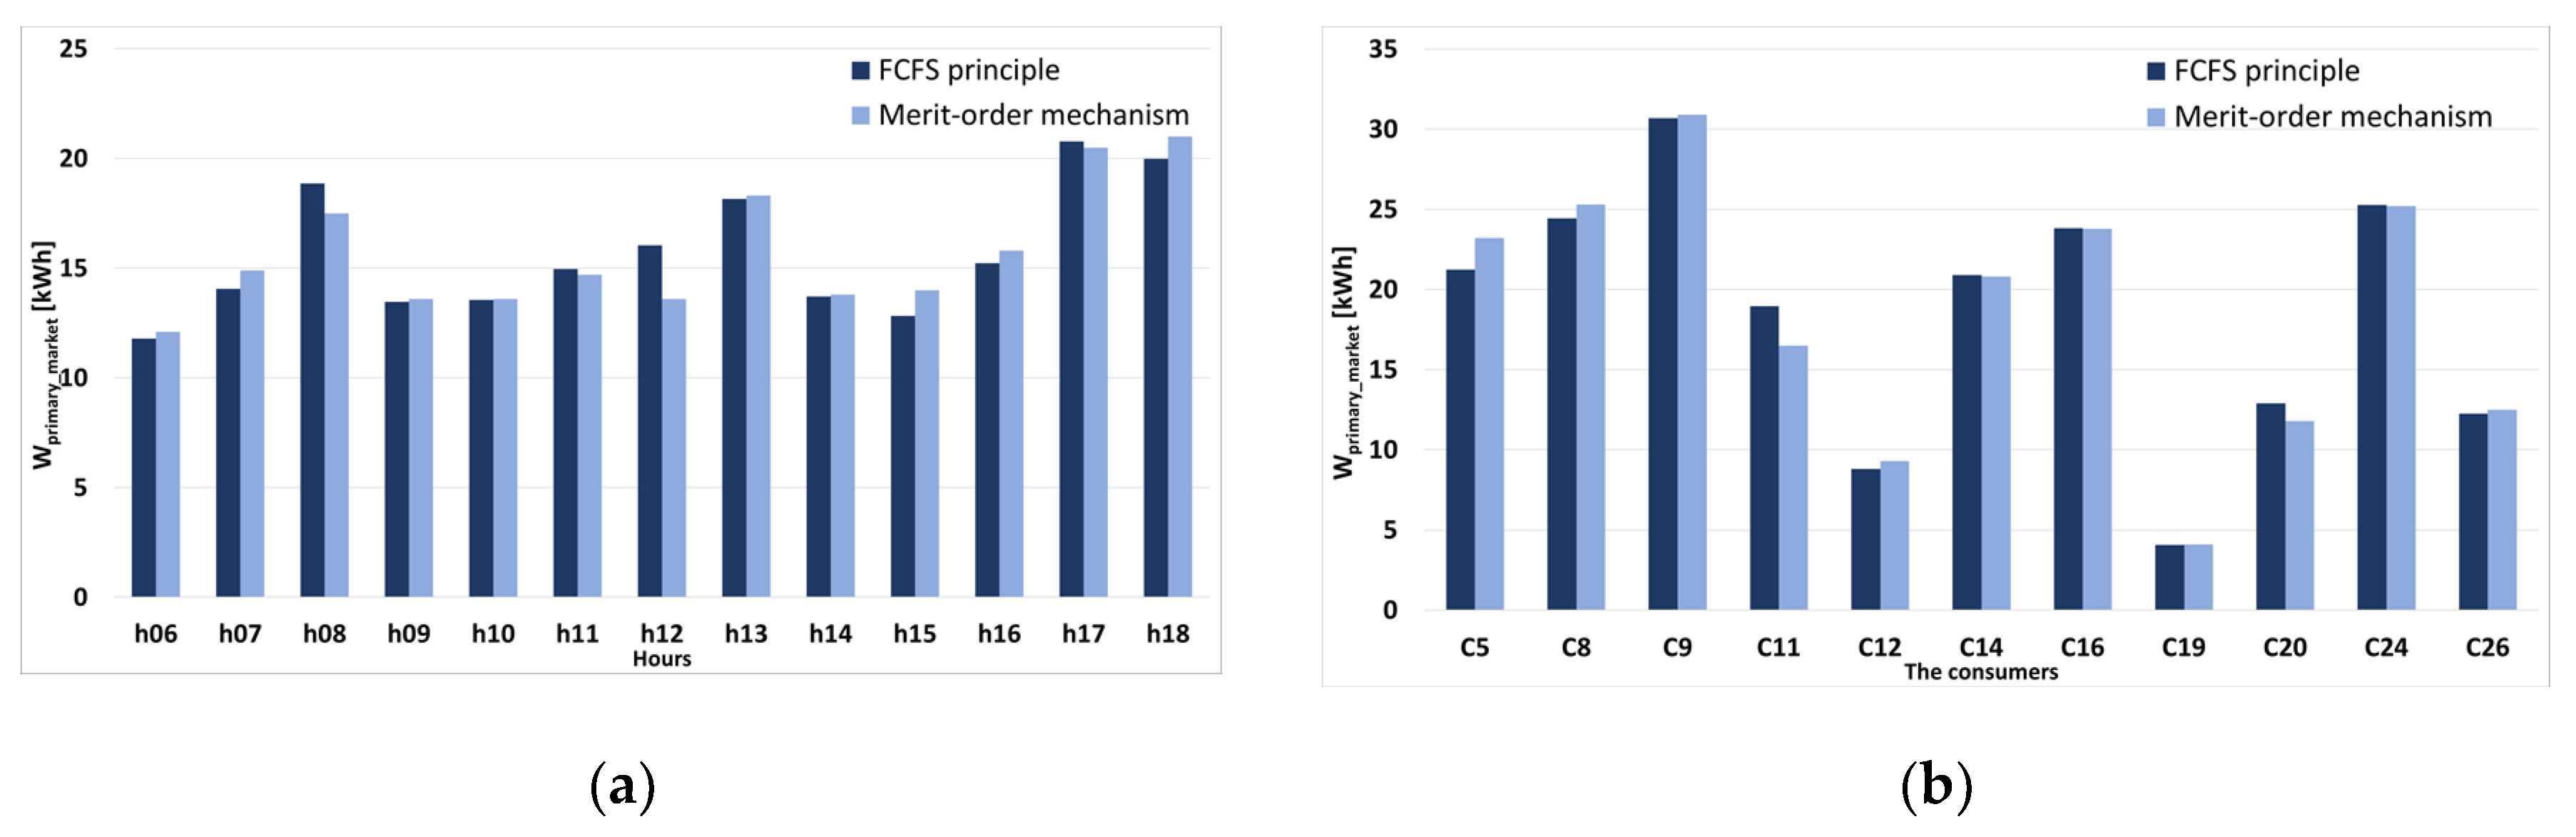
Figure 12.
The traded quantities of the sellers in the primary market: (a) hourly; (b) for each prosumer.
Figure 12.
The traded quantities of the sellers in the primary market: (a) hourly; (b) for each prosumer.

Figure 13.
The traded quantities of the buyers in the primary market: (a) hourly; (b) for each consumer.
Figure 13.
The traded quantities of the buyers in the primary market: (a) hourly; (b) for each consumer.
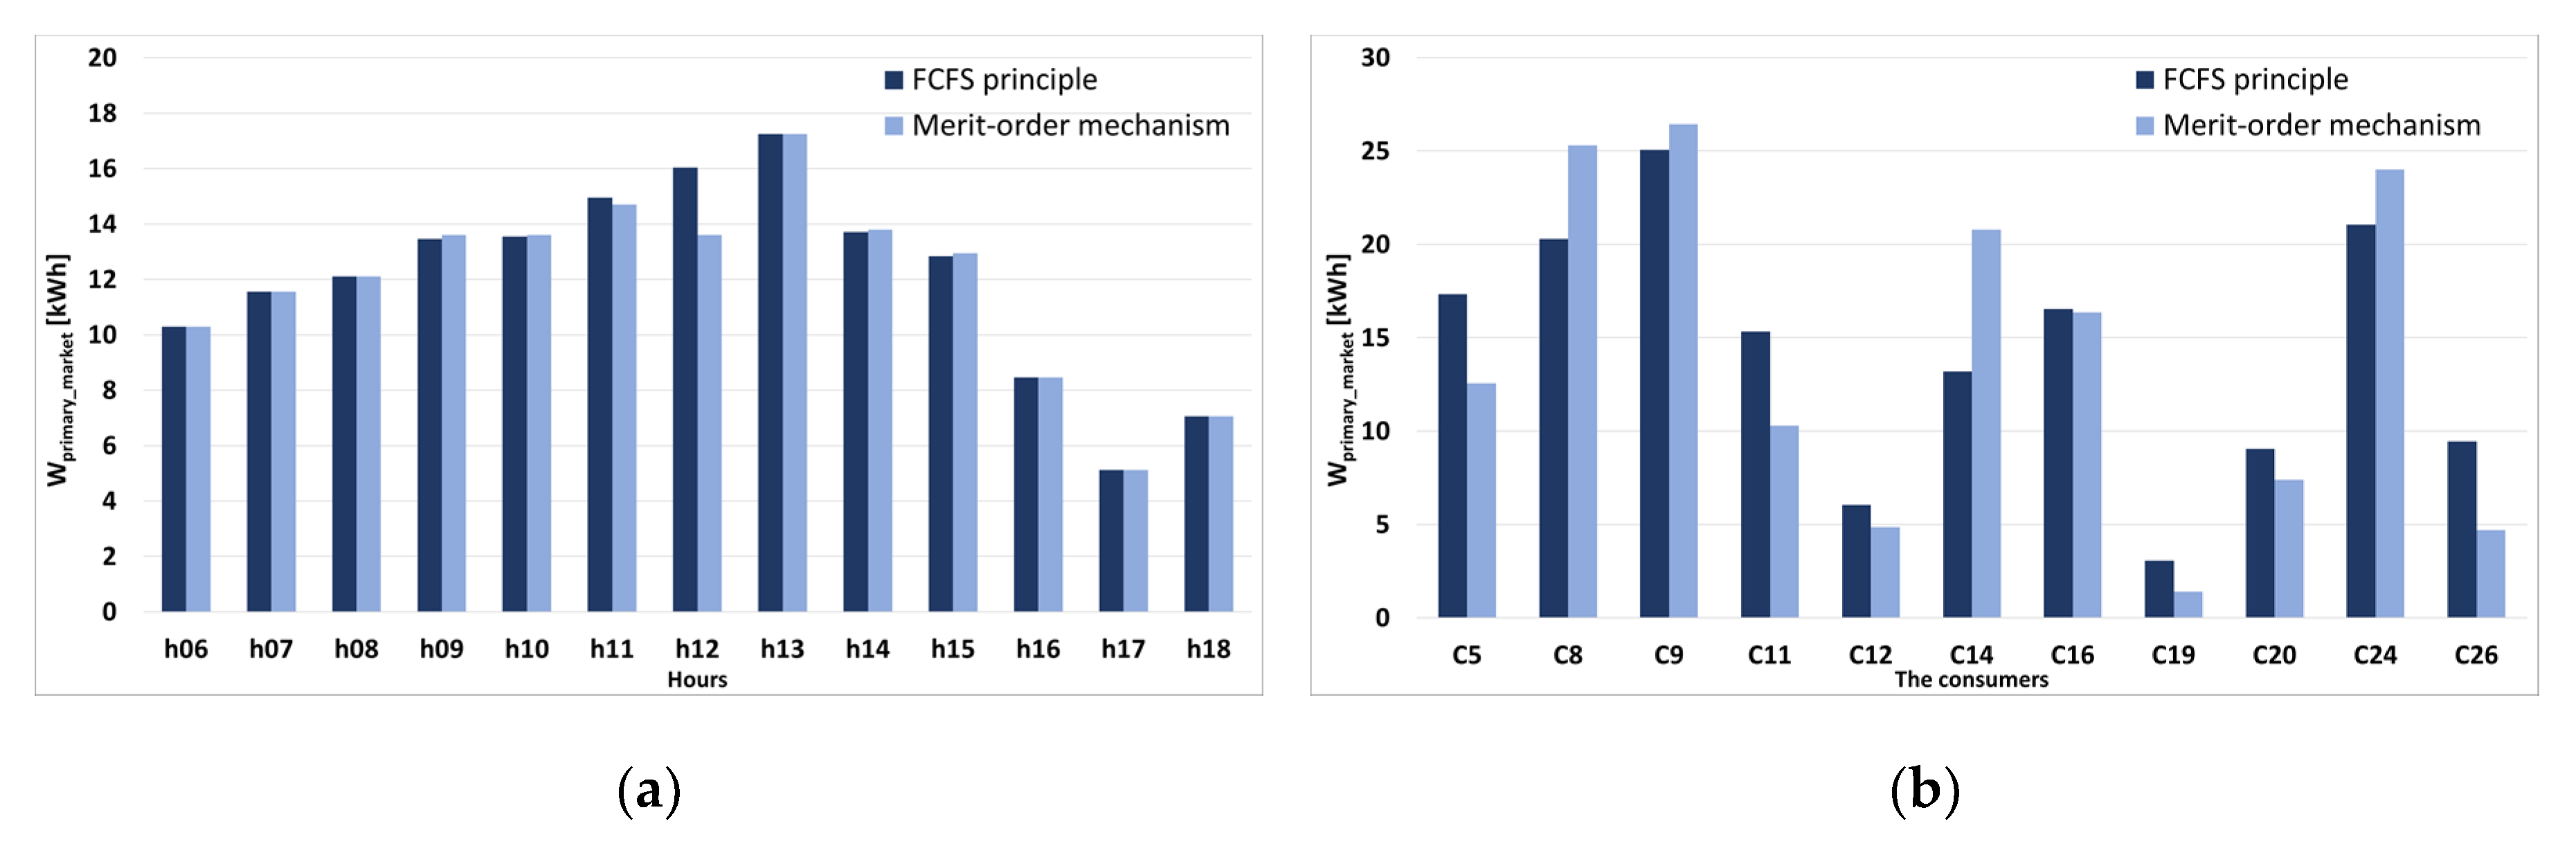
Figure 14.
The primary market cost for buyers: (a) The hourly values, first-come-first-serve (FCFS); (b) The values for each consumer, FCFS; (c) The hourly values, MO; (d) The values for each consumer, MO.
Figure 14.
The primary market cost for buyers: (a) The hourly values, first-come-first-serve (FCFS); (b) The values for each consumer, FCFS; (c) The hourly values, MO; (d) The values for each consumer, MO.
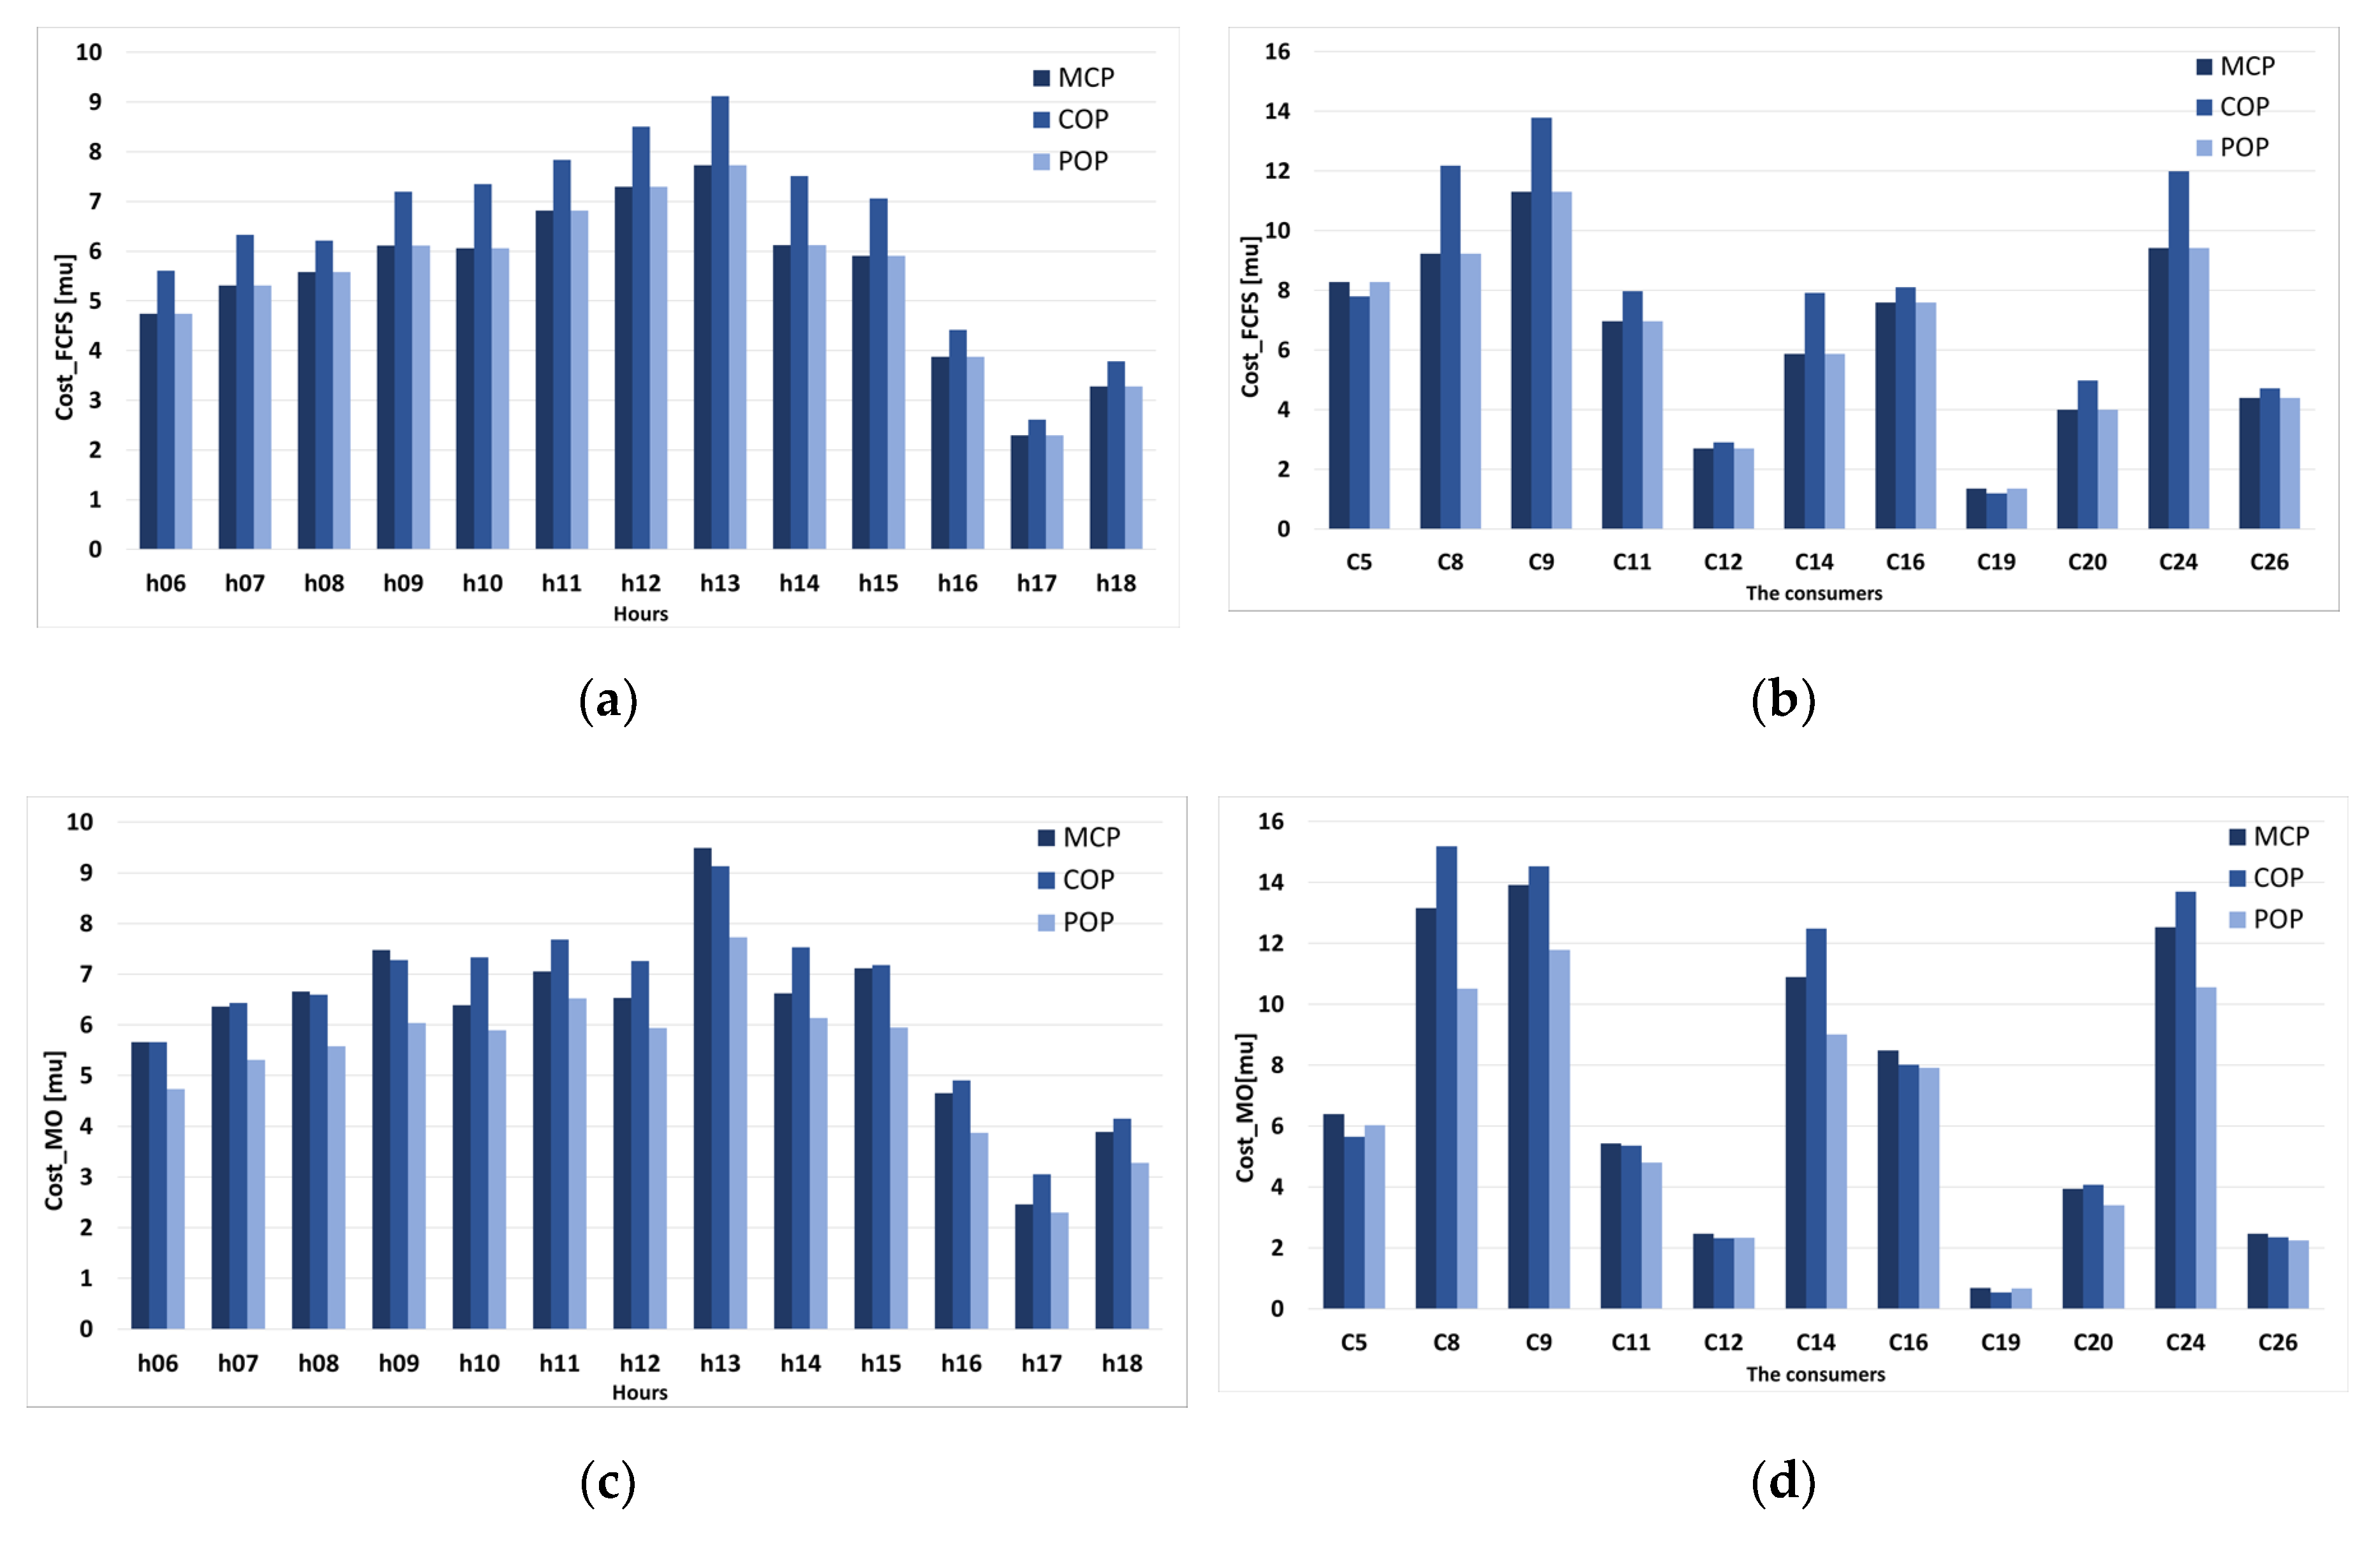
Figure 15.
The primary market revenue for sellers: (a) The hourly values, FCFS; (b) The values for each prosumer, FCFS; (c) The hourly values, MO; (d) The values for each prosumer, MO.
Figure 15.
The primary market revenue for sellers: (a) The hourly values, FCFS; (b) The values for each prosumer, FCFS; (c) The hourly values, MO; (d) The values for each prosumer, MO.
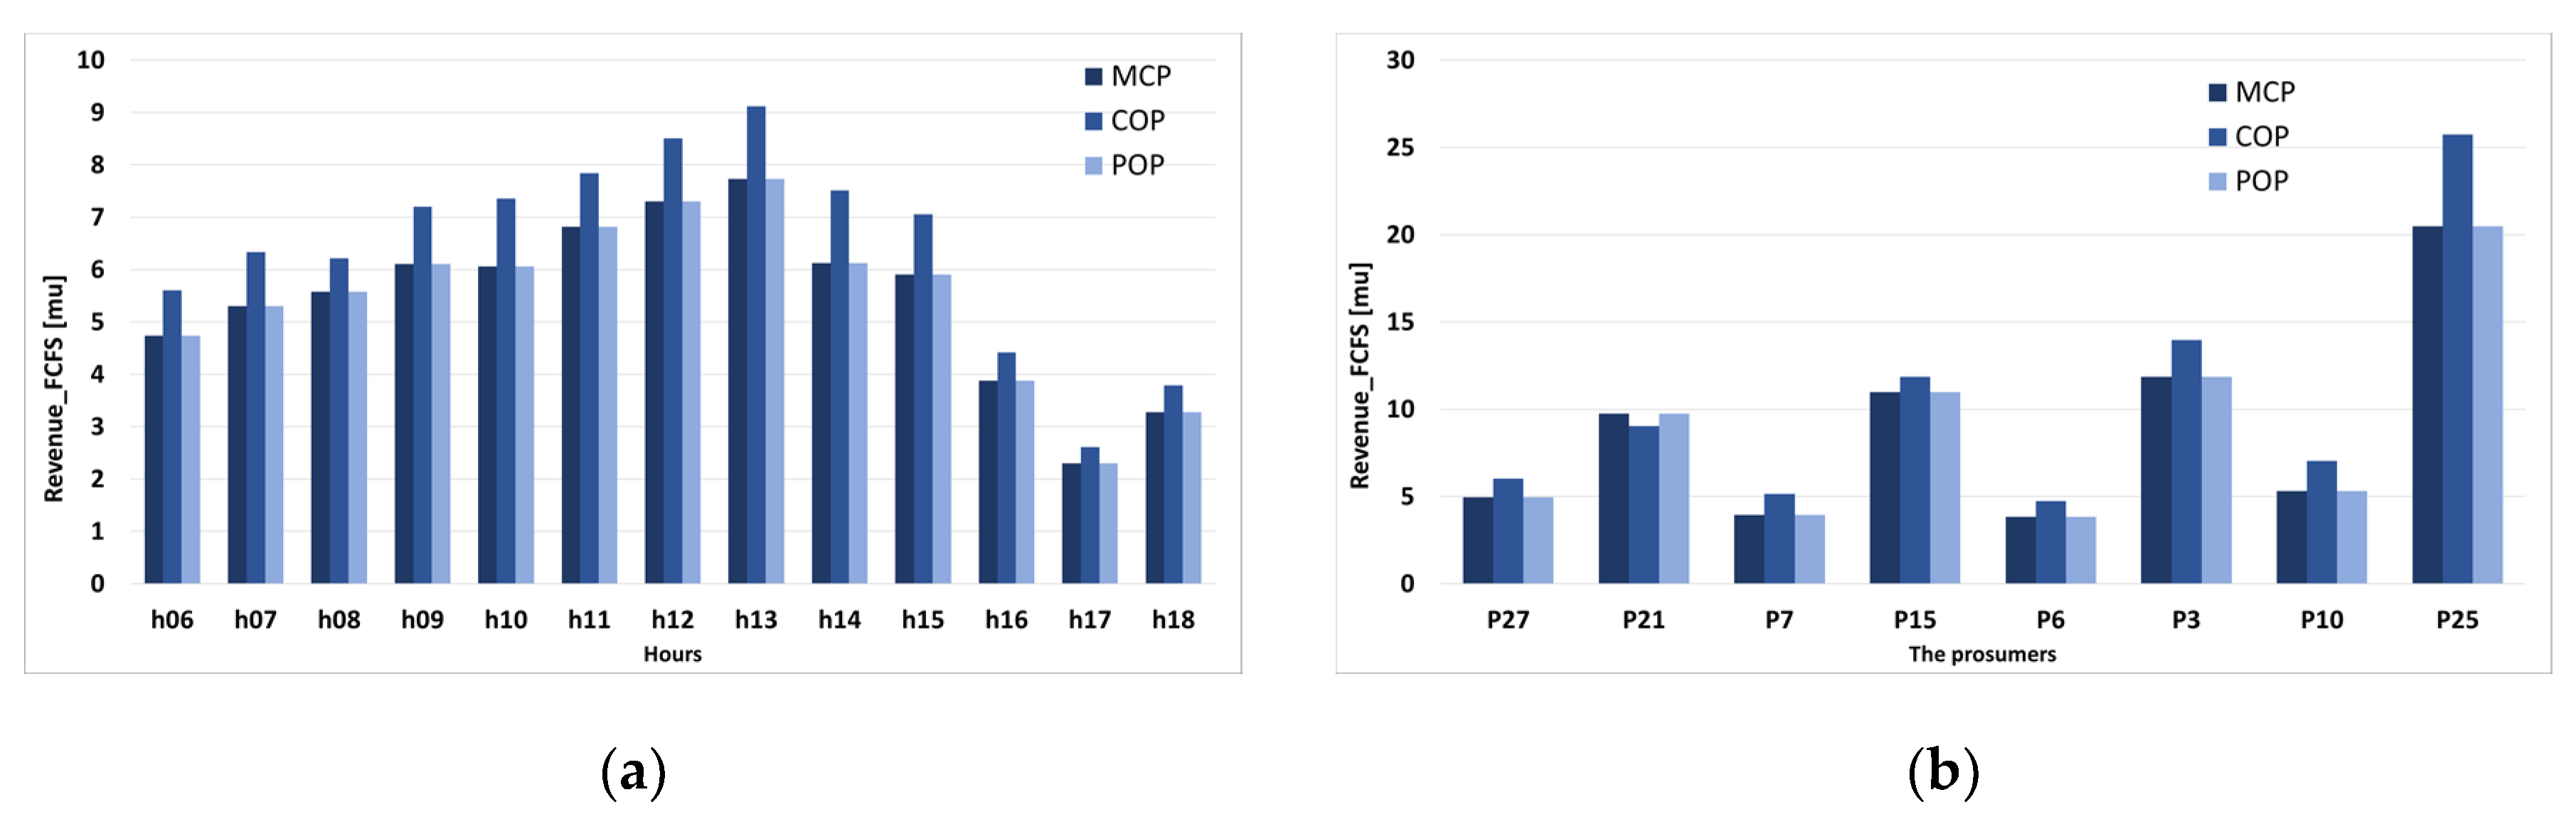
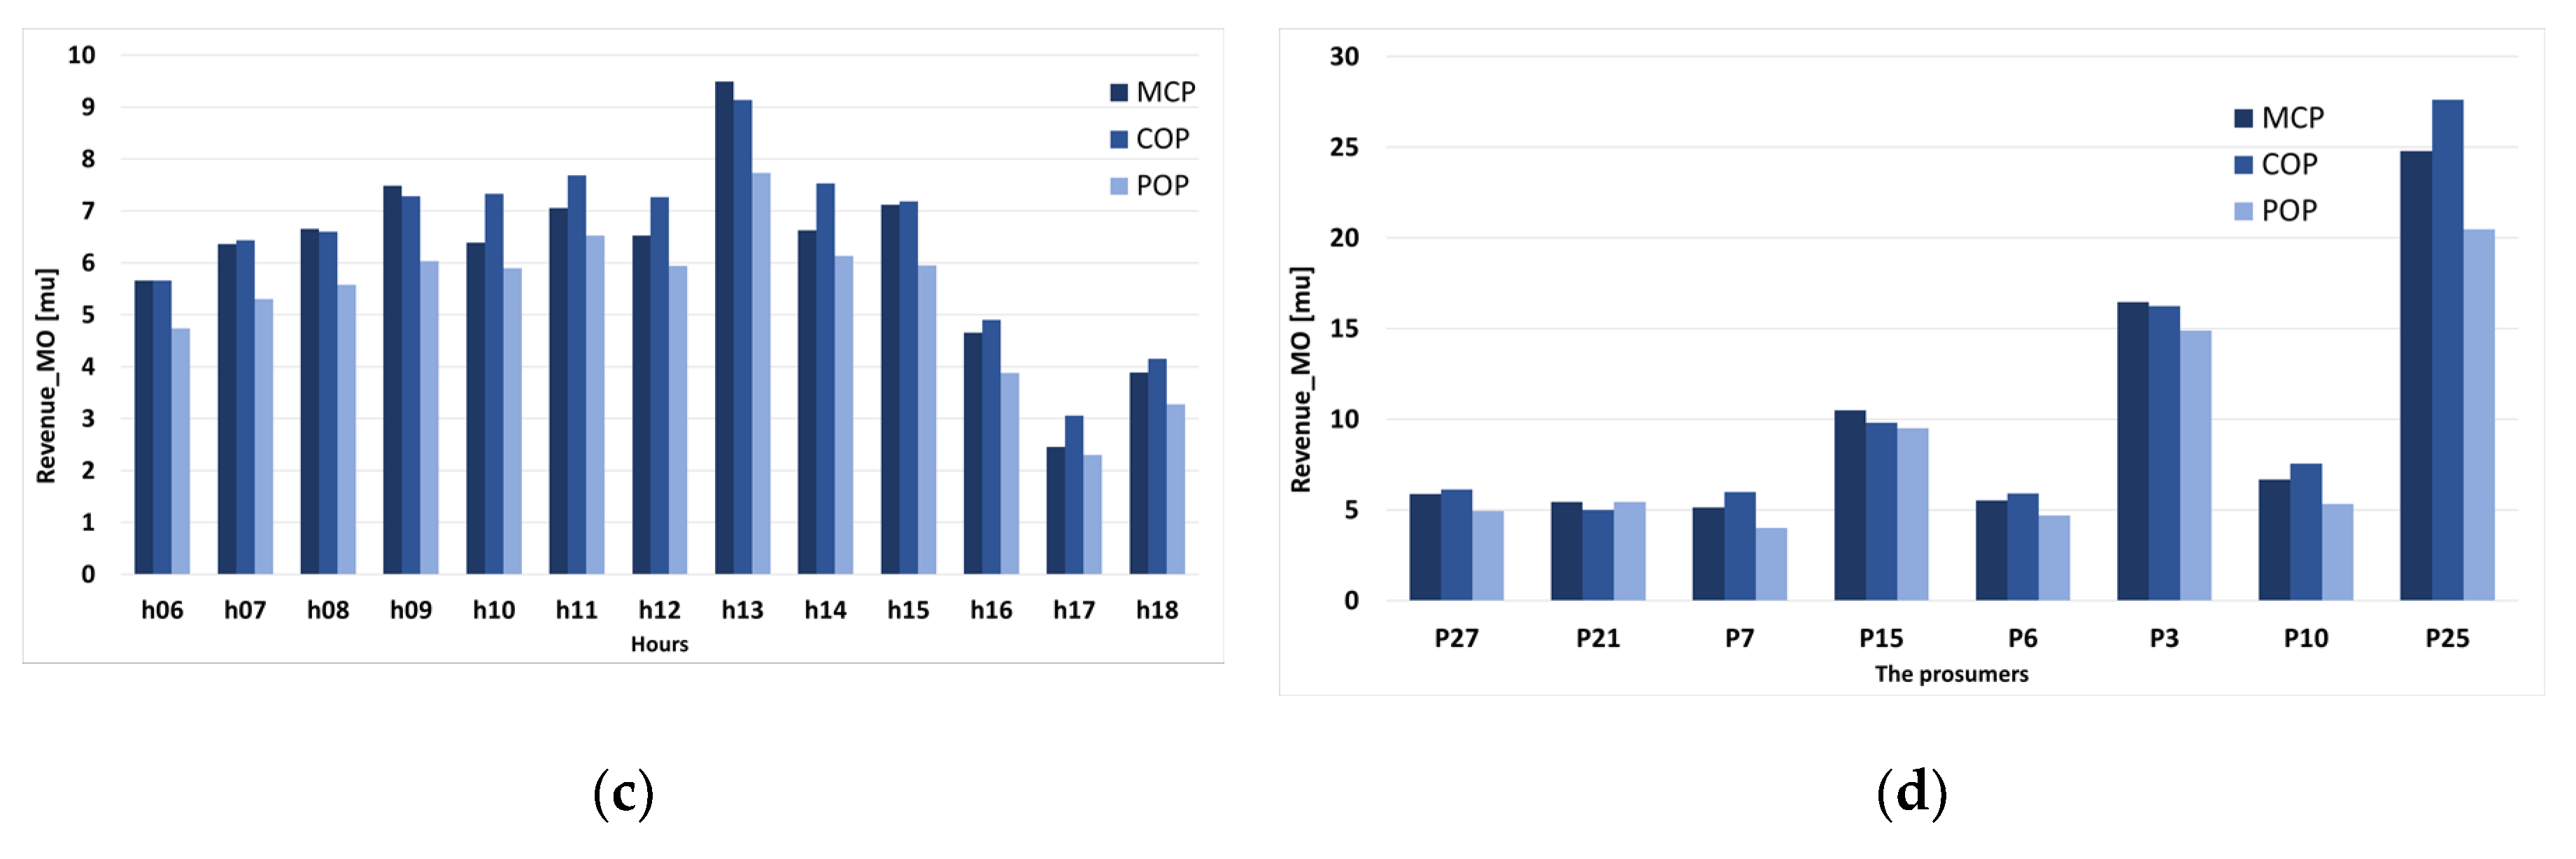
Figure 16.
The sell offers of the vendors in the energy poverty mitigation market: (a) hourly; (b) for each prosumer/consumer.
Figure 16.
The sell offers of the vendors in the energy poverty mitigation market: (a) hourly; (b) for each prosumer/consumer.
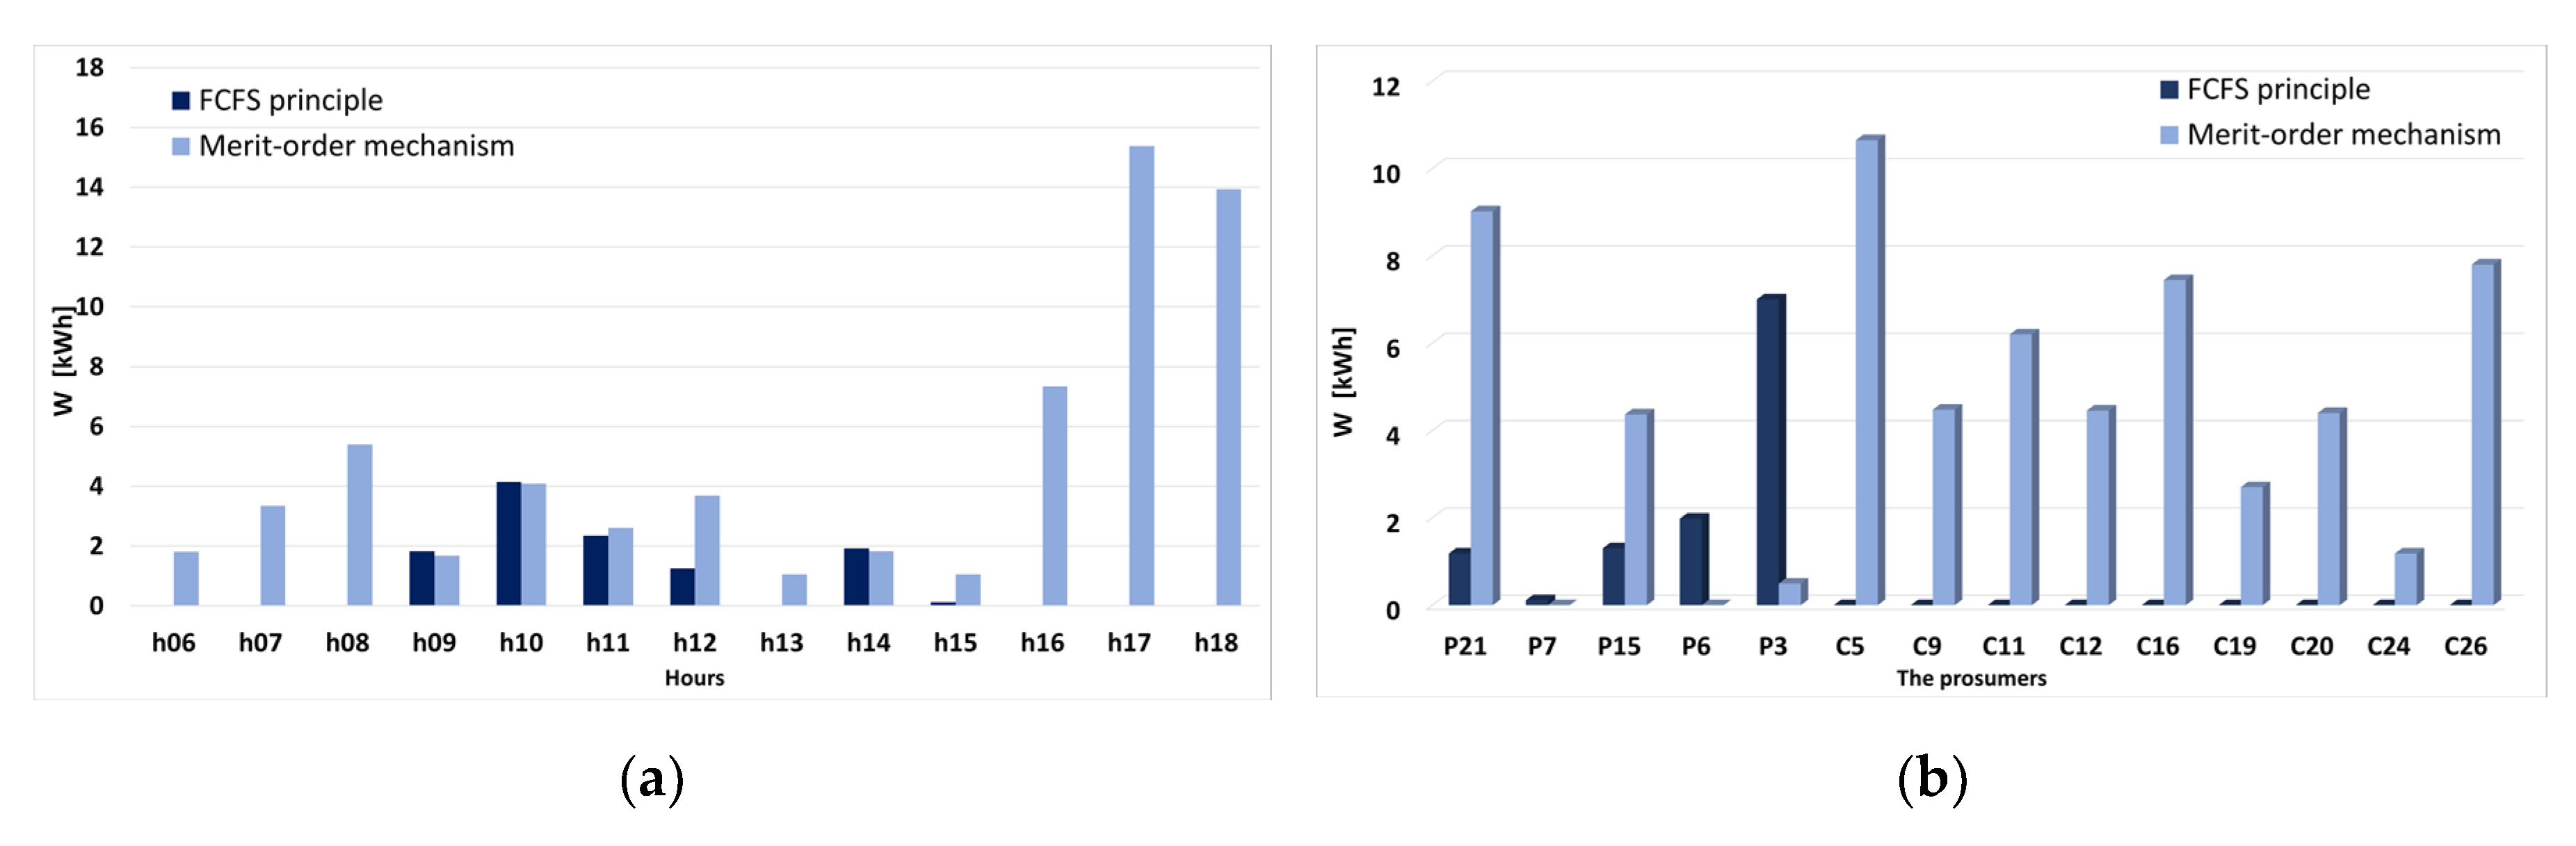
Figure 17.
The traded quantities of the vendors in the energy poverty mitigation market: (a) hourly; (b) for each prosumer.
Figure 17.
The traded quantities of the vendors in the energy poverty mitigation market: (a) hourly; (b) for each prosumer.

Figure 18.
The energy poverty mitigation market cost for buyers: (a) hourly values, FCFS; (b) daily values for each consumer, FCFS; (c) hourly values, MO; (d) daily values for each consumer, MO.
Figure 18.
The energy poverty mitigation market cost for buyers: (a) hourly values, FCFS; (b) daily values for each consumer, FCFS; (c) hourly values, MO; (d) daily values for each consumer, MO.

Figure 19.
The energy poverty mitigation market revenue for vendors: (a) hourly values, FCFS; (b) daily values for each consumer, FCFS; (c) hourly values, MO; (d) daily values for each consumer, MO.
Figure 19.
The energy poverty mitigation market revenue for vendors: (a) hourly values, FCFS; (b) daily values for each consumer, FCFS; (c) hourly values, MO; (d) daily values for each consumer, MO.
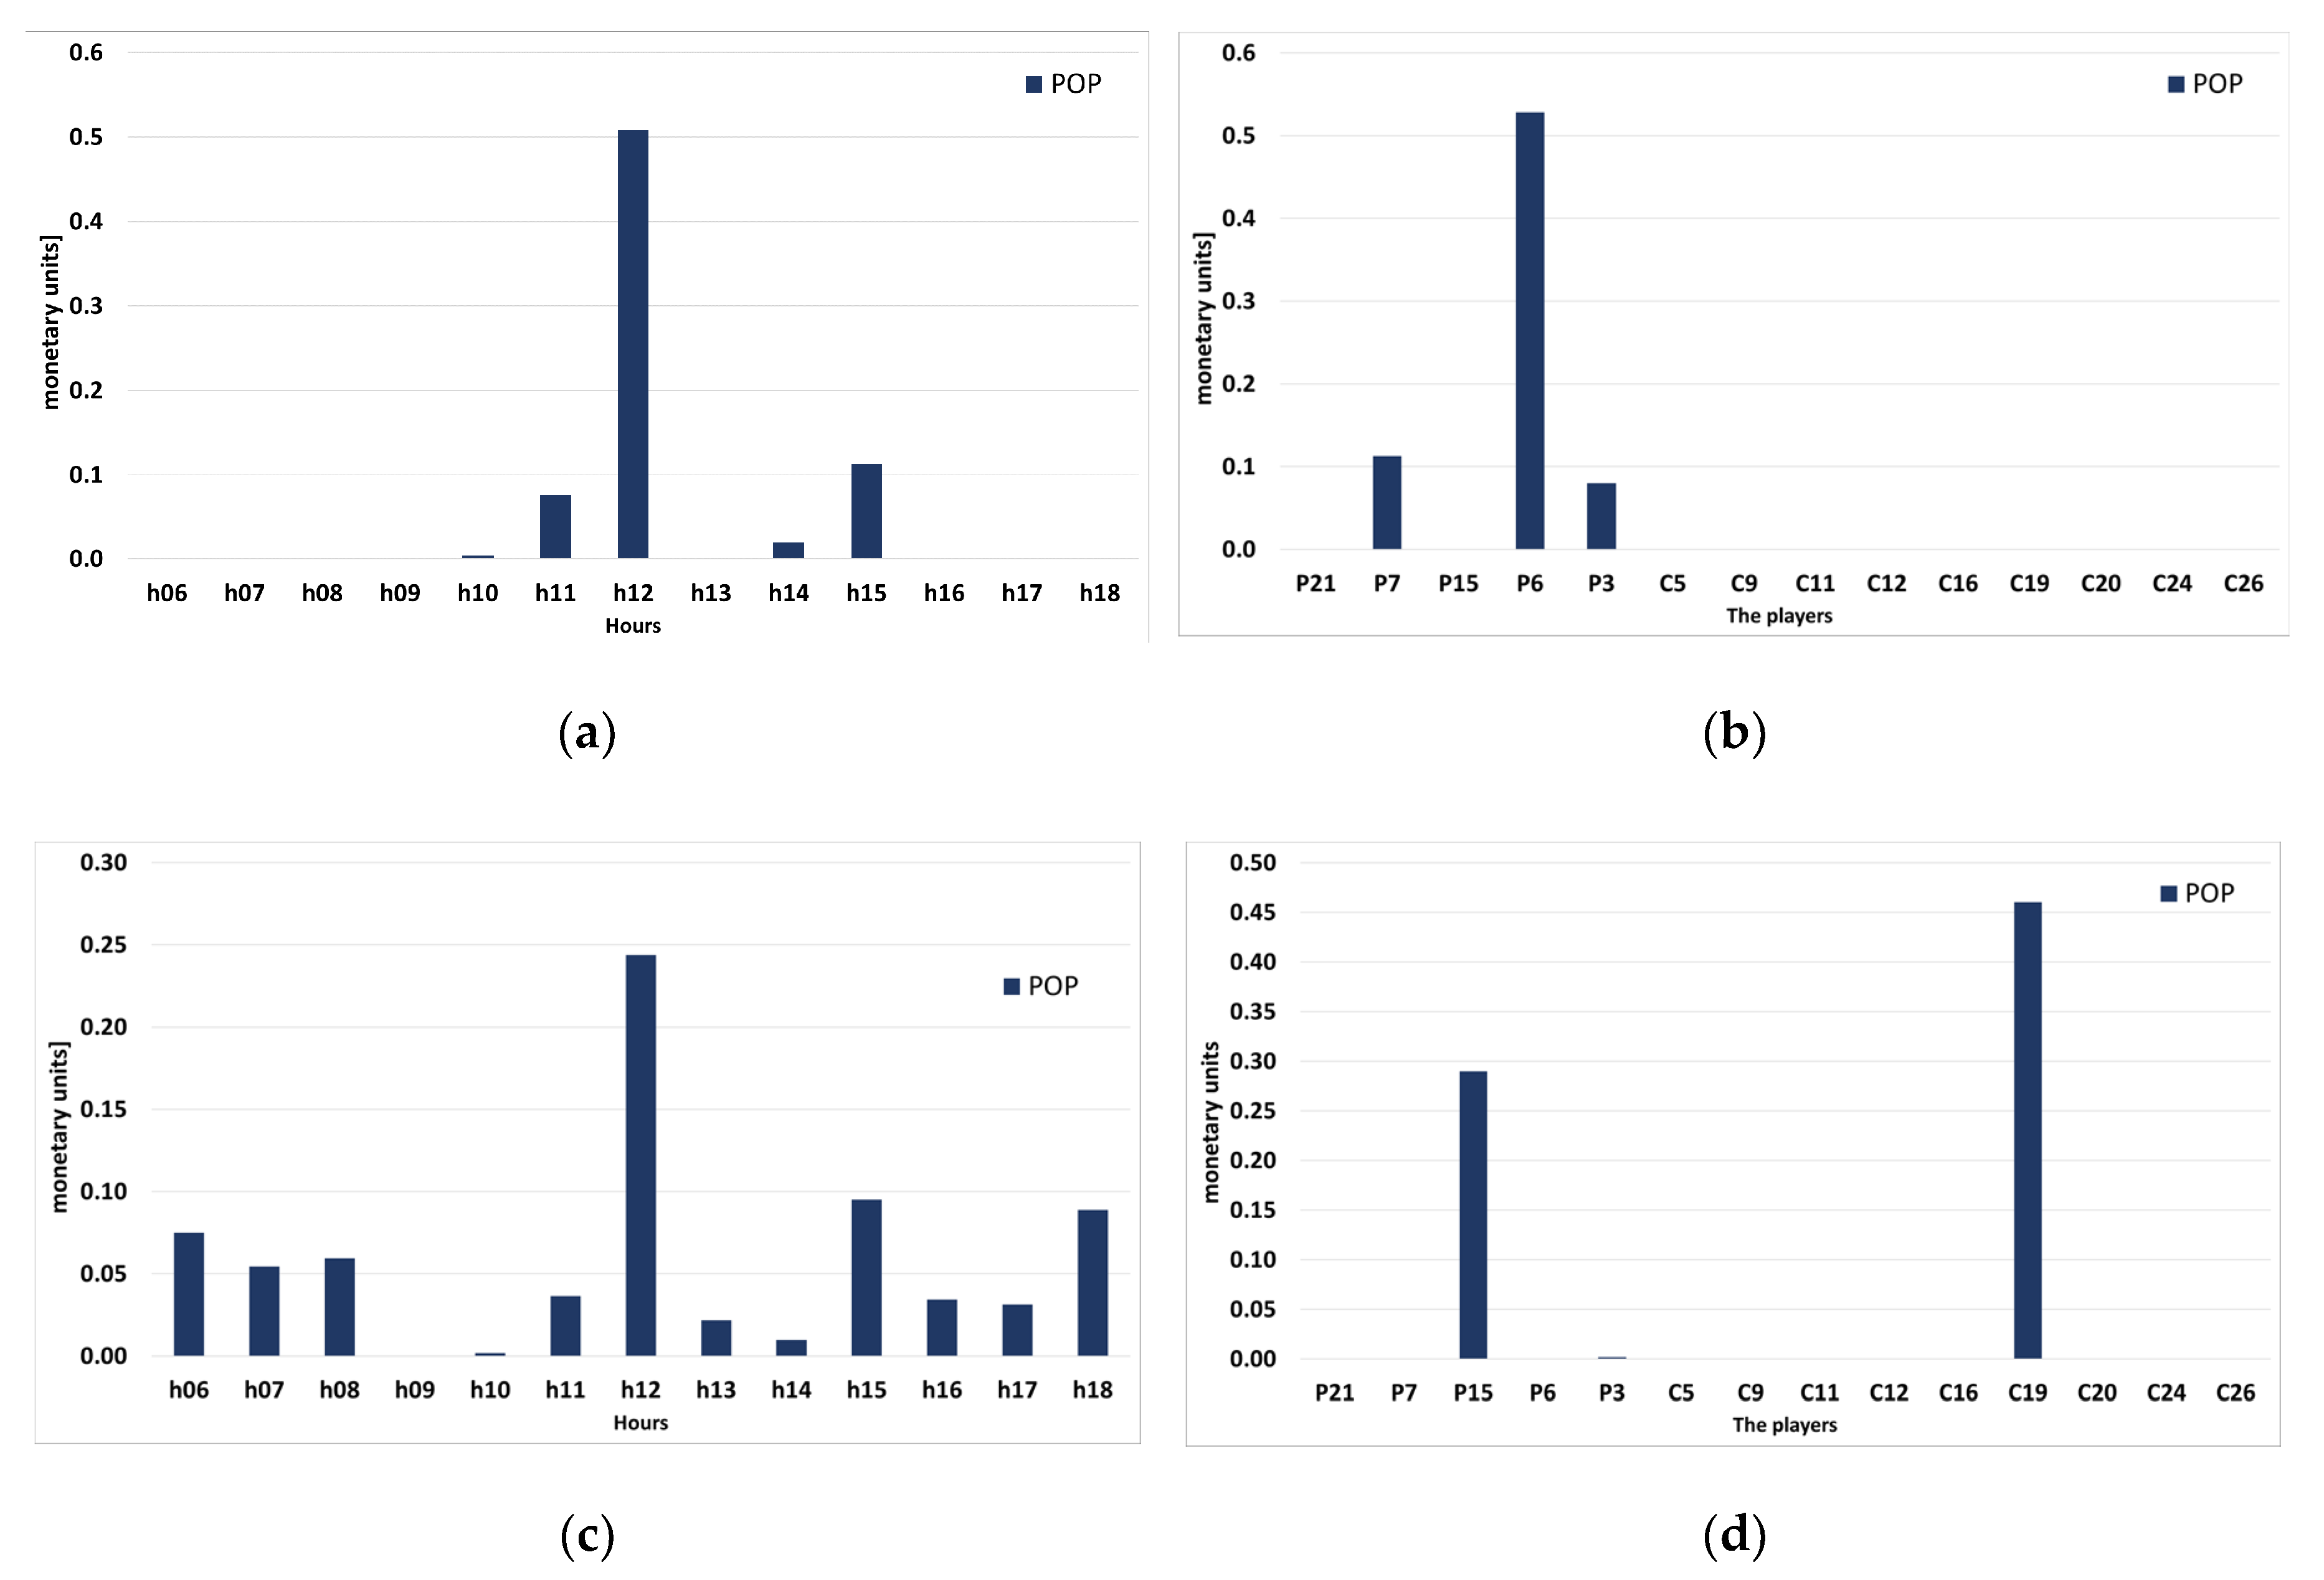
Figure 20.
The buyer quantity offers in the secondary tariff-access market: (a) hourly; (b) per consumer.
Figure 20.
The buyer quantity offers in the secondary tariff-access market: (a) hourly; (b) per consumer.
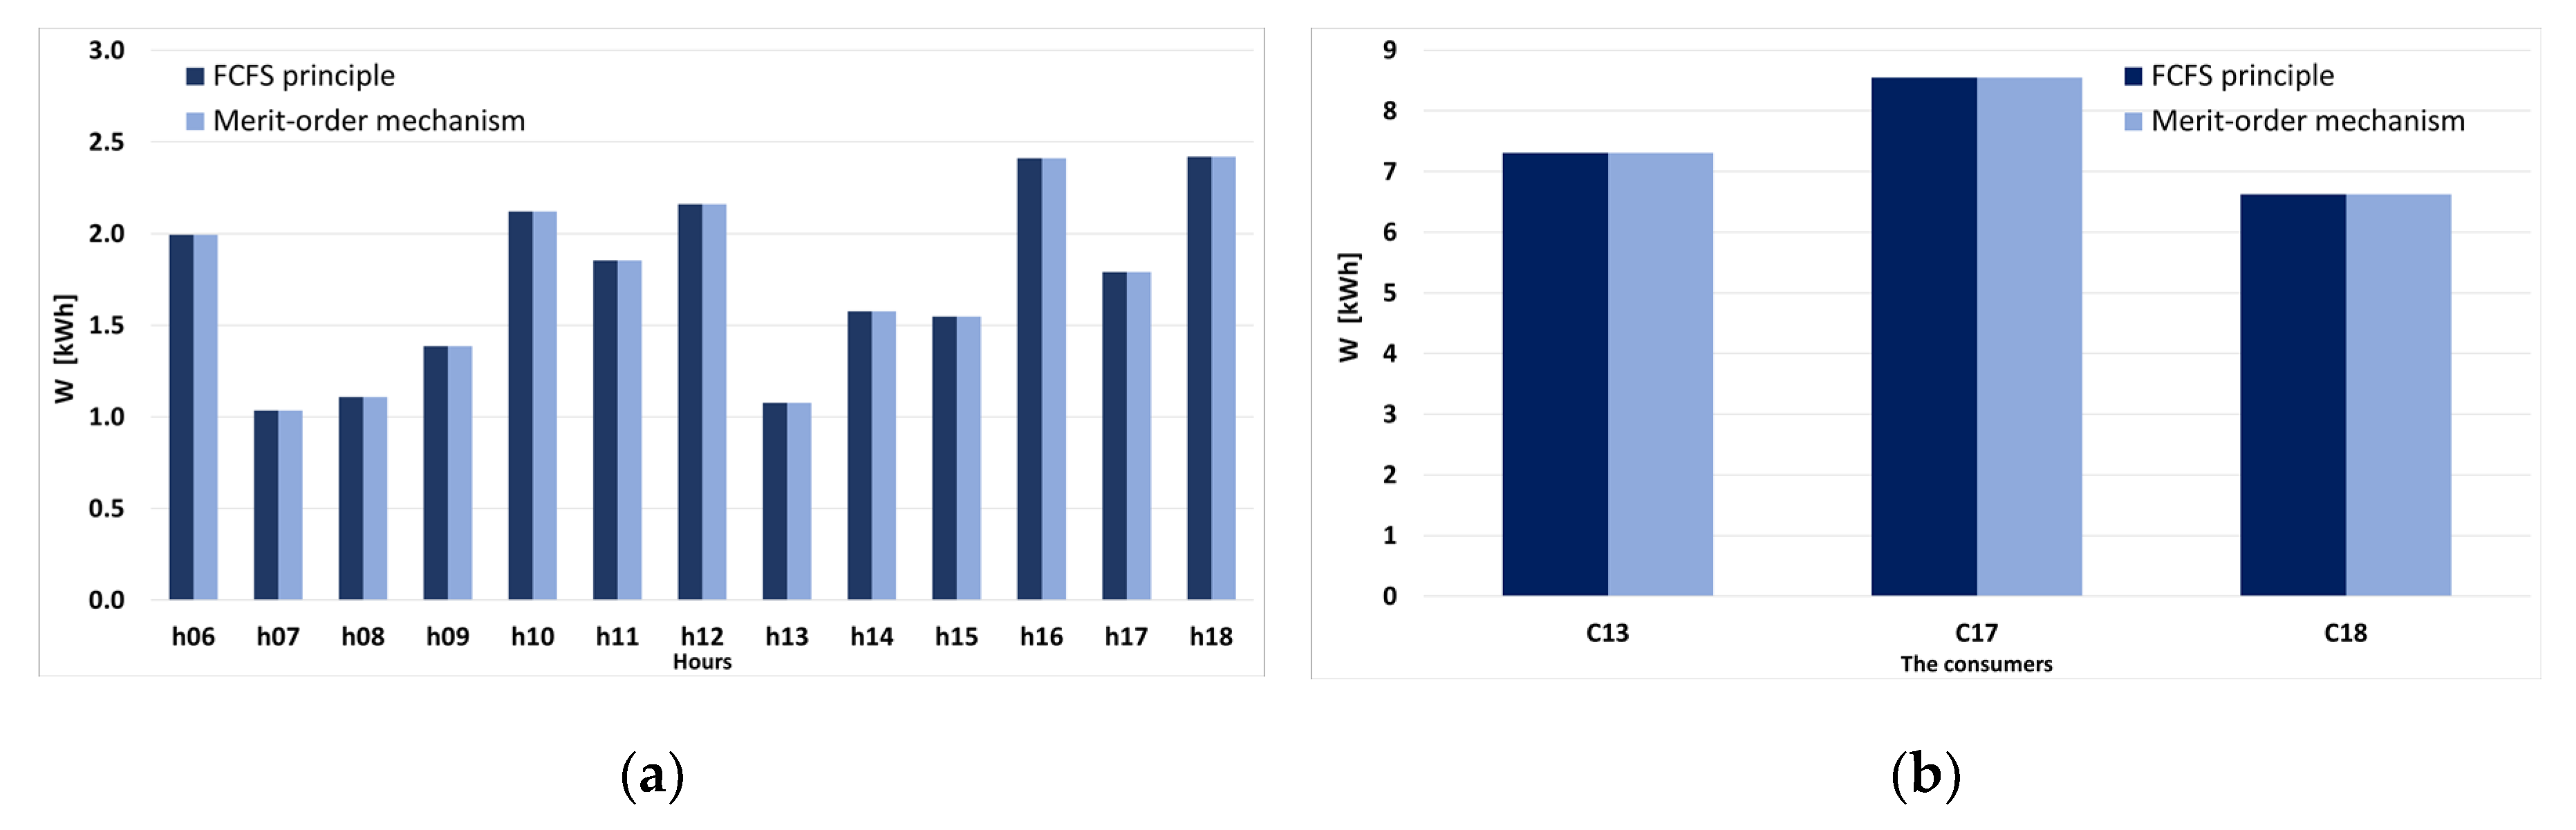
Figure 21.
The buyer quantities traded in the secondary tariff-access market: (a) hourly; (b) for each consumer.
Figure 21.
The buyer quantities traded in the secondary tariff-access market: (a) hourly; (b) for each consumer.

Figure 22.
The seller quantity offers in the secondary tariff-access market: (a) hourly; (b) for each seller.
Figure 22.
The seller quantity offers in the secondary tariff-access market: (a) hourly; (b) for each seller.
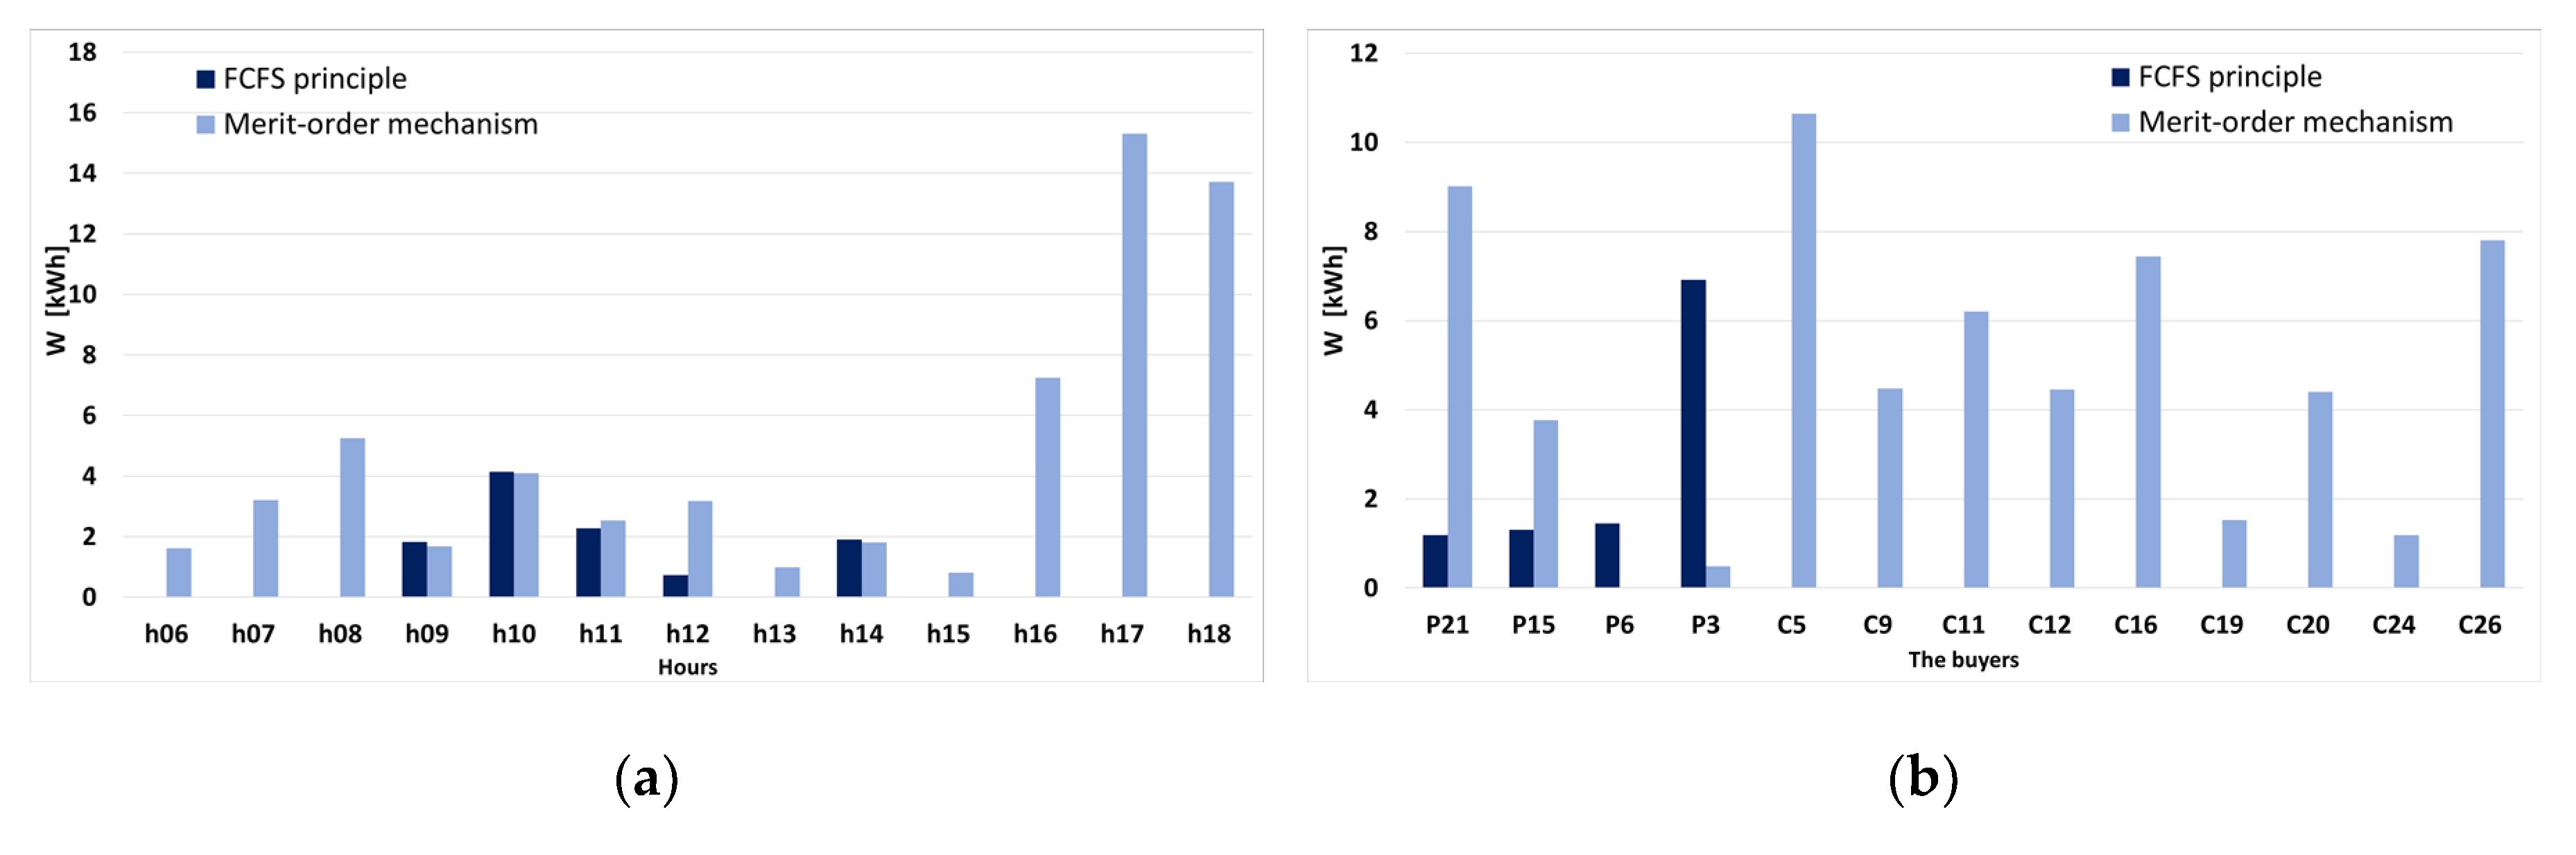
Figure 23.
The buyer quantities traded in the secondary tariff-access market: (a) hourly; (b) for each seller.
Figure 23.
The buyer quantities traded in the secondary tariff-access market: (a) hourly; (b) for each seller.
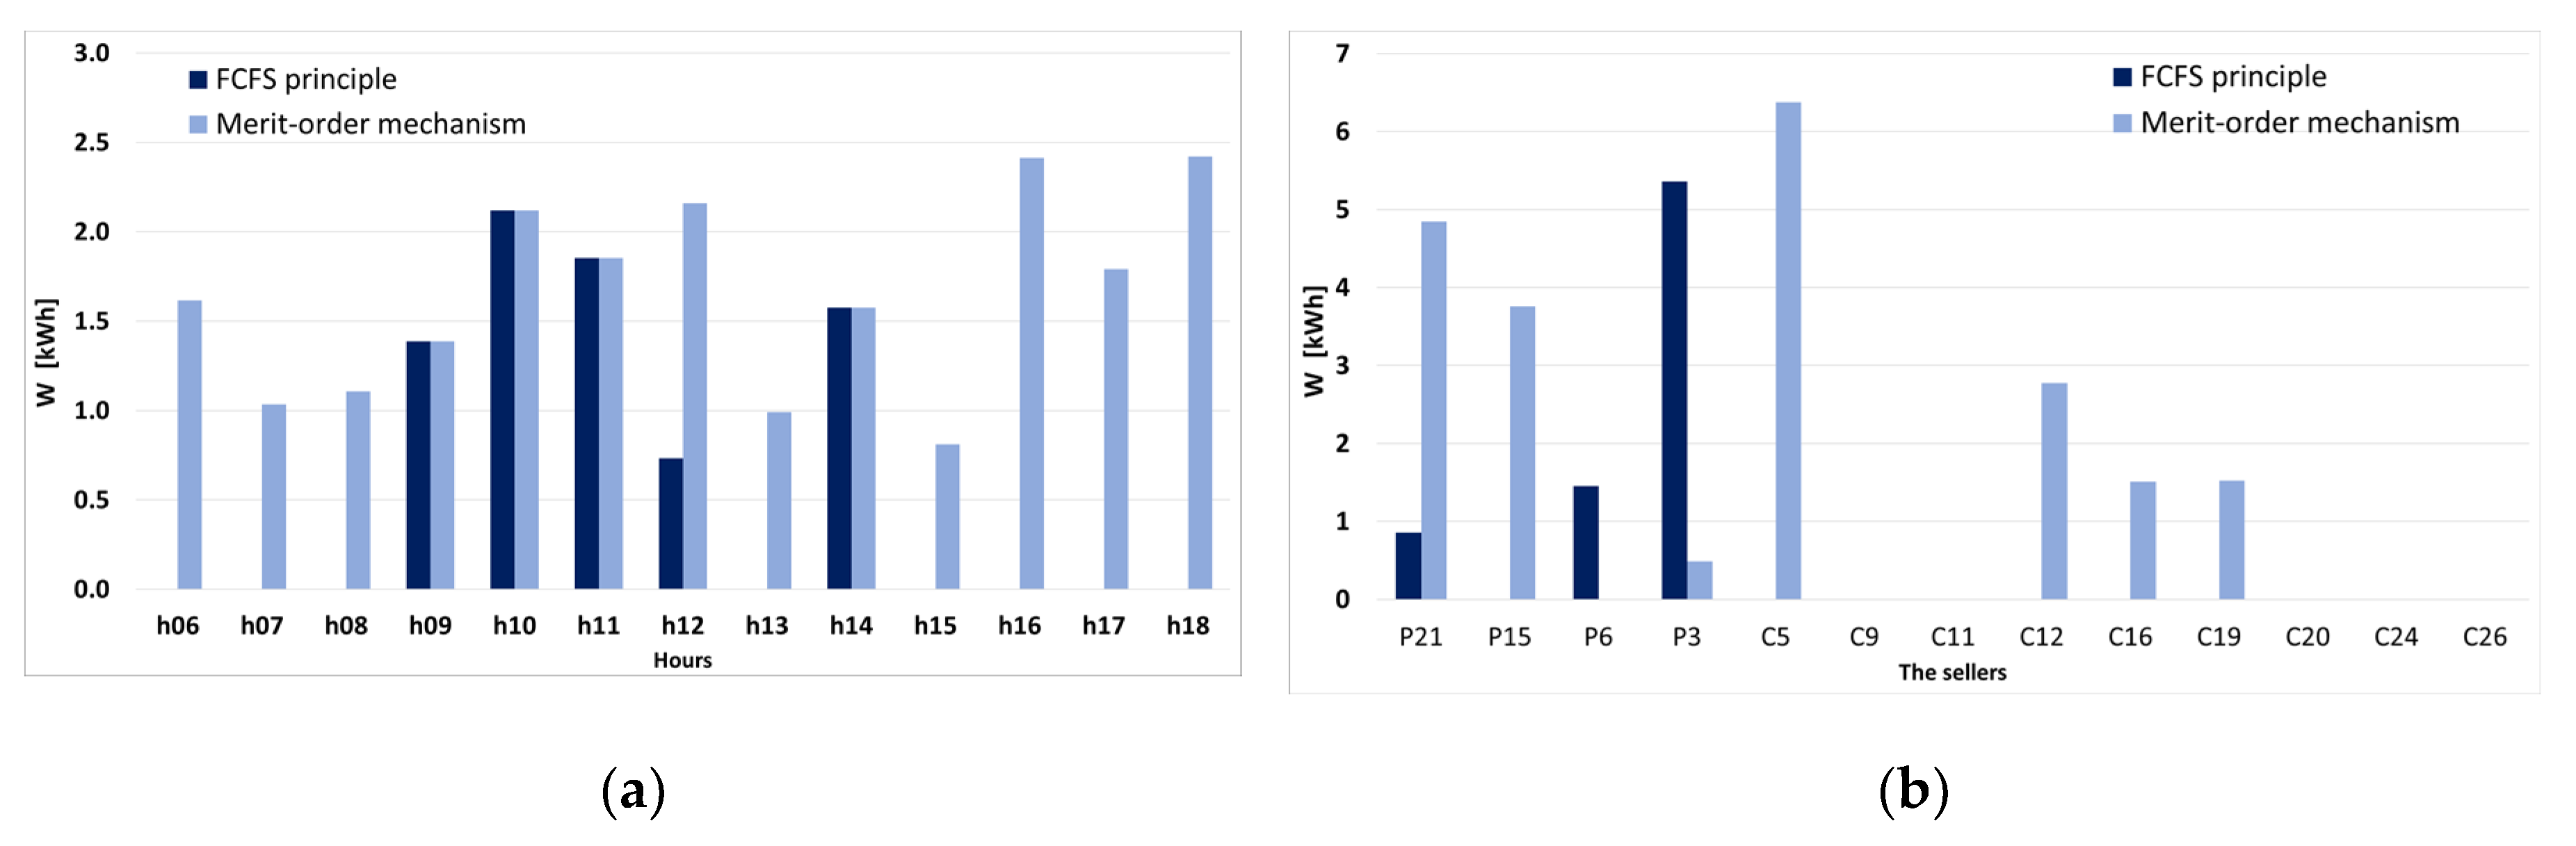
Figure 24.
The tariff-access market cost for buyers: (a) hourly values, FCFS; (b) daily values for each consumer, FCFS; (c) hourly values, merit-order (MO); (d) daily values for each consumer, MO.
Figure 24.
The tariff-access market cost for buyers: (a) hourly values, FCFS; (b) daily values for each consumer, FCFS; (c) hourly values, merit-order (MO); (d) daily values for each consumer, MO.
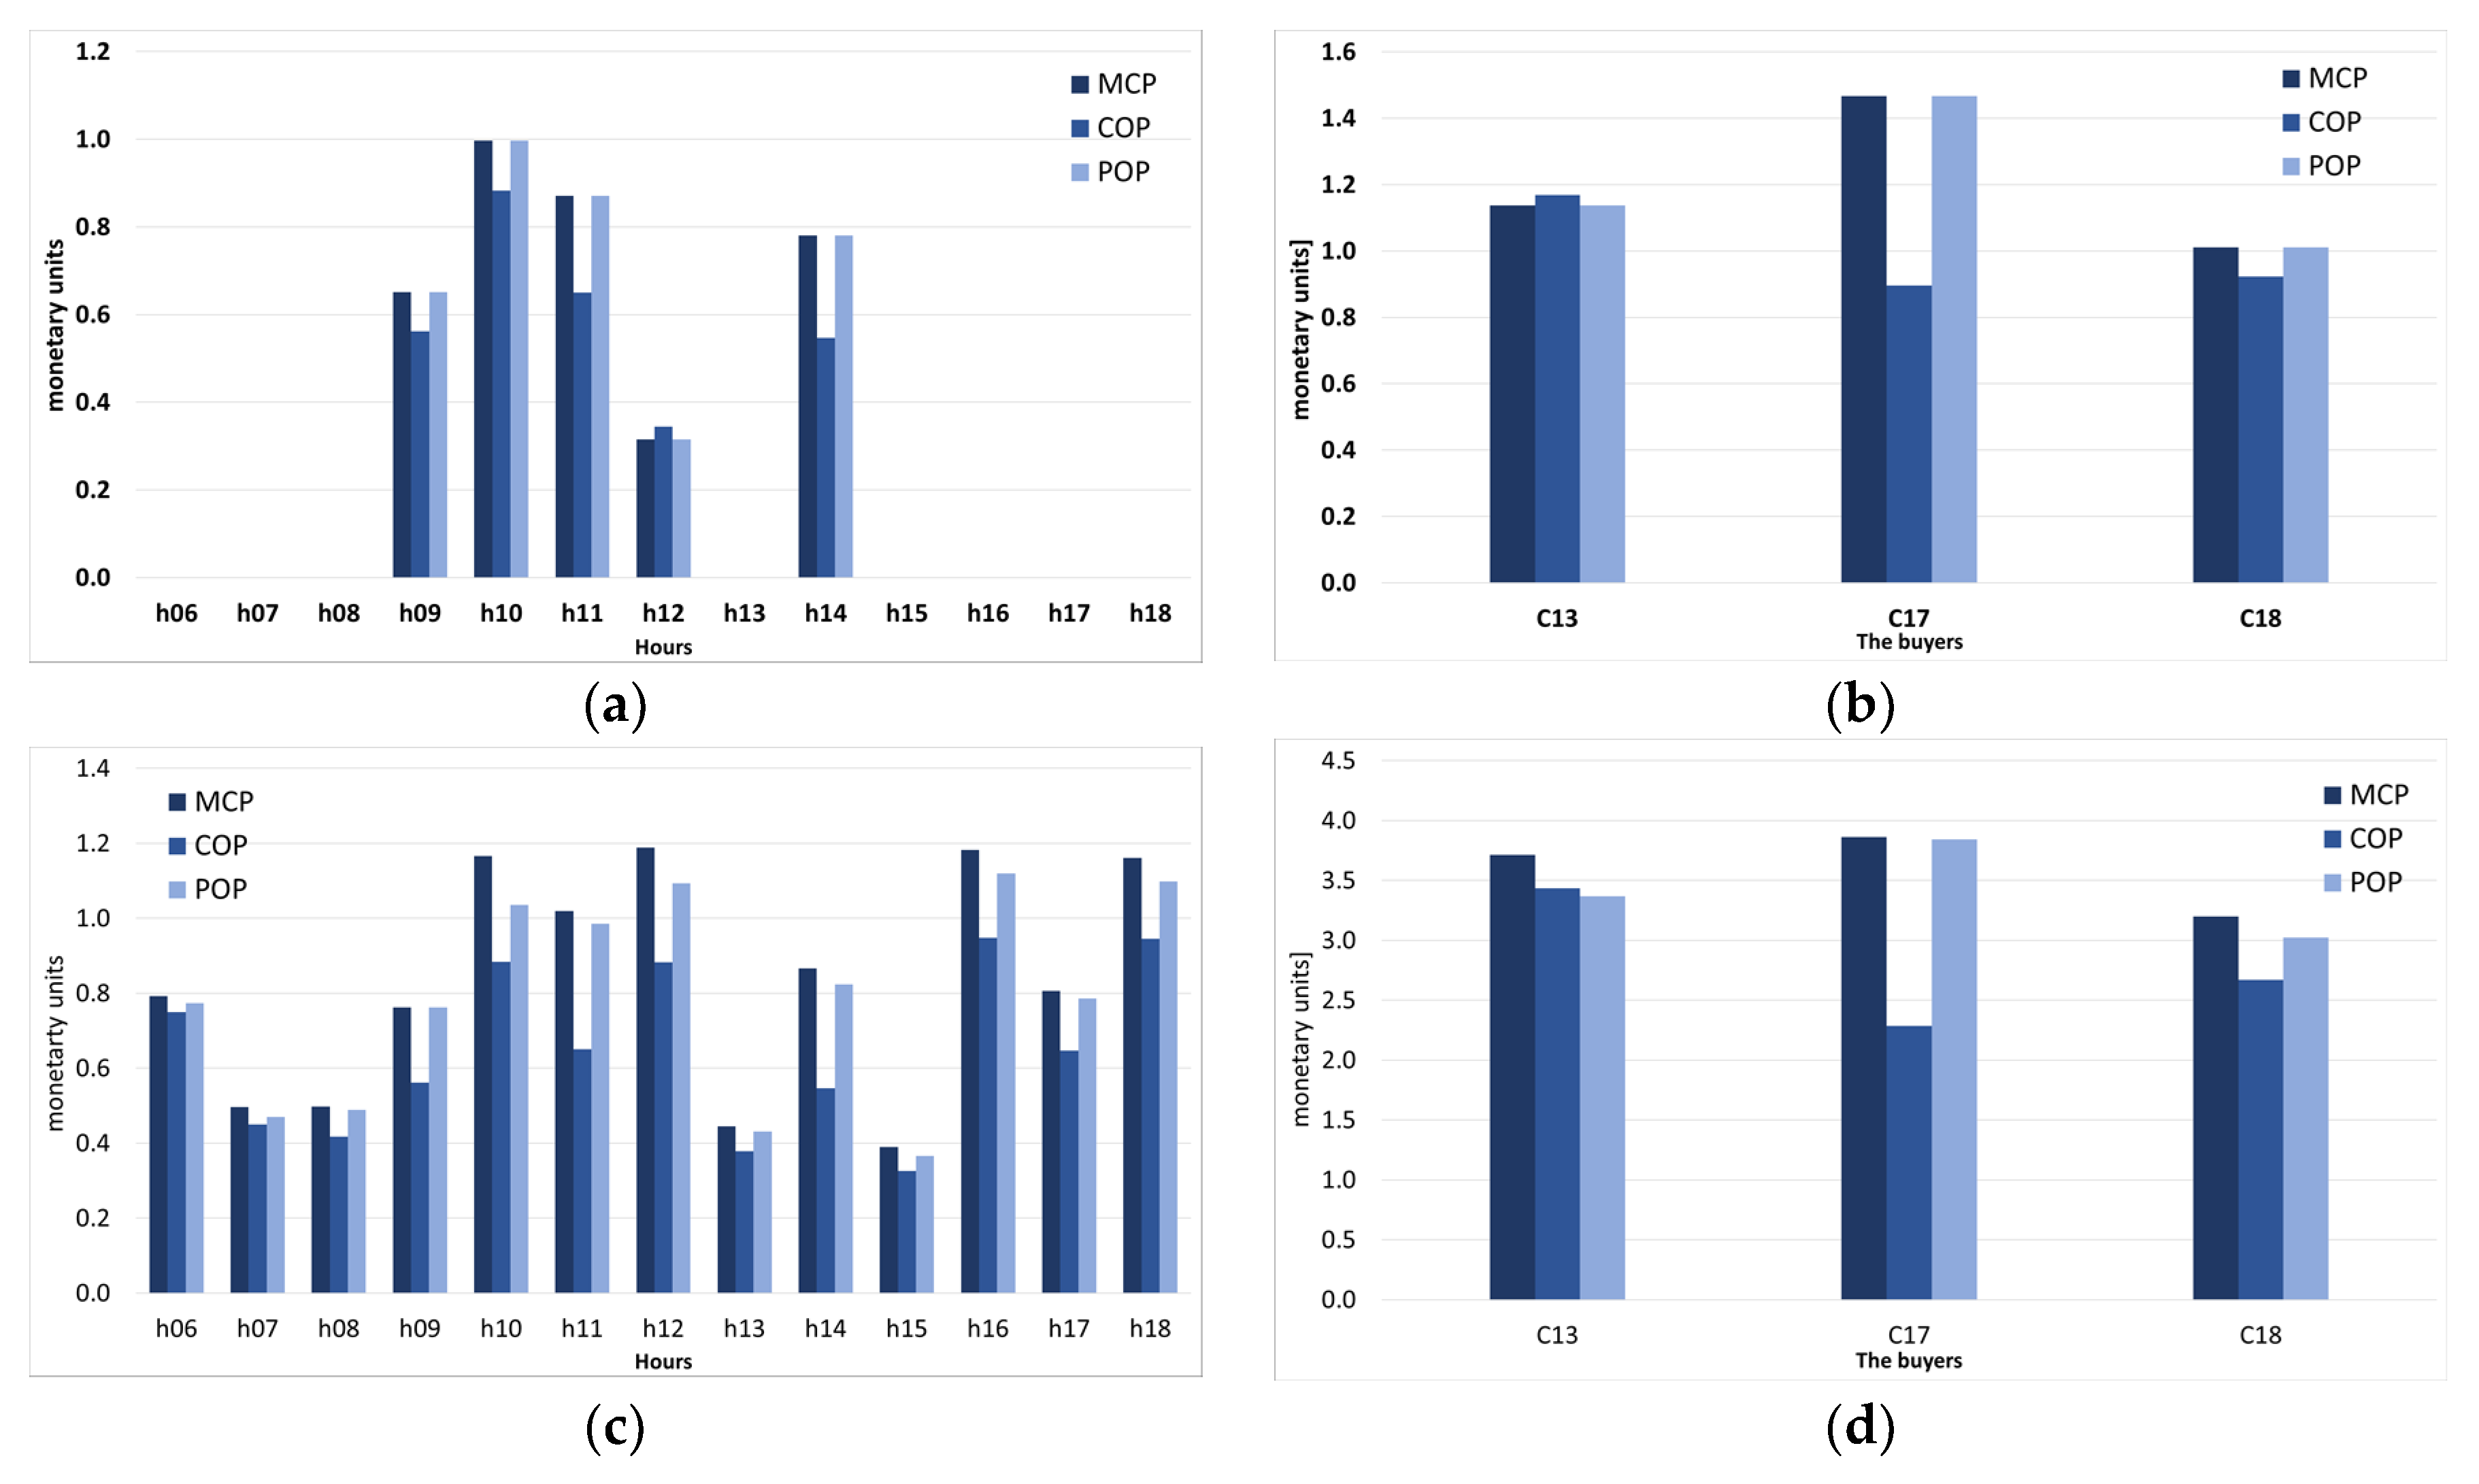
Figure 25.
The tariff-access market revenue for vendors: (a) hourly values, FCFS; (b) daily values for each consumer, FCFS; (c) hourly values, MO; (d) daily values for each consumer, MO.
Figure 25.
The tariff-access market revenue for vendors: (a) hourly values, FCFS; (b) daily values for each consumer, FCFS; (c) hourly values, MO; (d) daily values for each consumer, MO.

Table 1.
A comparison between the proposed model and the literature state-of-the-art survey.
| Reference No. | Blockchain | P2P Contracts | Energy Crowdsourcing | REScoop | Energy Poverty | Settlement Procedure |
|---|---|---|---|---|---|---|
| [16,29] | Yes | Yes | Yes | No | No | Negotiated |
| [28] | Yes | Yes | No | Yes | No | Negotiated |
| [24,25,44,49,57] | No | No | No | Yes | No | Negotiated |
| [26,27] | Yes | No | No | Yes | No | Negotiated |
| [30,31,32,35,38,42,56,60,65] | No | Yes | No | No | No | Negotiated or MCP |
| [33,34,36,37,43,45] | No | No | No | No | No | Negotiated |
| [39,46,50,51,69,71] | No | Yes | No | Yes | No | Negotiated or MCP |
| [40,41,54,58,59] | Yes | Yes | No | No | No | Negotiated |
| [53] | Yes | Yes | No | No | Yes | Negotiated |
| [48,55,64] | Yes | No | No | No | No | Negotiated |
| [61,66] | No | No | No | No | Yes | Negotiated or MCP |
| [62,63] | No | Yes | No | No | Yes | Negotiated |
| [68] | No | Yes | Yes | No | No | Negotiated |
| Proposed model | Yes | Yes | Yes | Yes | Yes | Negotiated and MCP |
Table 2.
The prosumers’ electricity surplus, in kWh.
| Hour | P27 | P21 | P7 | P15 | P6 | P3 | P10 | P25 | Total |
|---|---|---|---|---|---|---|---|---|---|
| h6 | 0.000 | 1.588 | 0.000 | 1.948 | 0.000 | 1.208 | 2.496 | 3.052 | 10.292 |
| h7 | 0.000 | 1.805 | 0.263 | 1.585 | 0.000 | 1.806 | 2.616 | 3.487 | 11.562 |
| h8 | 0.668 | 1.726 | 0.704 | 1.586 | 0.000 | 2.879 | 0.714 | 3.826 | 12.103 |
| h9 | 1.437 | 1.749 | 1.056 | 2.228 | 0.741 | 2.836 | 1.279 | 3.956 | 15.282 |
| h10 | 1.607 | 2.292 | 1.093 | 1.302 | 1.116 | 3.251 | 2.794 | 4.232 | 17.687 |
| h11 | 1.655 | 2.038 | 1.400 | 2.775 | 1.886 | 3.372 | 0.000 | 4.175 | 17.301 |
| h12 | 1.595 | 1.822 | 1.225 | 1.880 | 2.328 | 3.392 | 0.980 | 4.060 | 17.282 |
| h13 | 1.508 | 0.685 | 1.413 | 2.826 | 2.294 | 3.462 | 0.826 | 4.240 | 17.254 |
| h14 | 1.372 | 1.182 | 1.385 | 2.945 | 1.347 | 3.178 | 0.000 | 4.214 | 15.623 |
| h15 | 1.106 | 2.028 | 1.048 | 1.546 | 1.184 | 2.331 | 0.000 | 3.702 | 12.945 |
| h16 | 0.563 | 0.819 | 0.410 | 1.325 | 0.000 | 2.133 | 0.000 | 3.209 | 8.459 |
| h17 | 0.000 | 0.000 | 0.000 | 1.062 | 0.000 | 1.134 | 0.046 | 2.877 | 5.119 |
| h18 | 0.000 | 1.170 | 0.000 | 1.161 | 0.000 | 1.221 | 0.914 | 2.599 | 7.065 |
| Total | 11.511 | 18.904 | 9.997 | 24.169 | 10.896 | 32.203 | 12.665 | 47.629 | 167.974 |
Table 3.
The daily offer, traded and remaining quantities for each buyer in the primary market, kWh.
Table 3.
The daily offer, traded and remaining quantities for each buyer in the primary market, kWh.
| Consumer | C5 | C8 | C9 | C11 | C12 | C14 | C16 | C19 | C20 | C24 | C26 | Total |
|---|---|---|---|---|---|---|---|---|---|---|---|---|
| Consumption (offers FCFS) | 21.25 | 24.44 | 30.70 | 18.96 | 8.79 | 20.92 | 23.84 | 4.08 | 12.90 | 25.27 | 12.26 | 203.41 |
| offers MO | 23.2 | 25.30 | 30.9 | 16.50 | 9.30 | 20.80 | 23.8 | 4.10 | 11.80 | 25.20 | 12.50 | 203.40 |
| traded FCFS | 17.32 | 20.29 | 25.07 | 15.33 | 6.04 | 13.20 | 16.54 | 3.08 | 9.05 | 21.04 | 9.44 | 156.40 |
| traded MO | 12.55 | 25.30 | 26.42 | 10.30 | 4.85 | 20.80 | 16.36 | 1.40 | 7.40 | 24.02 | 4.70 | 154.10 |
| rem. FCFS | 3.93 | 4.15 | 5.62 | 3.64 | 2.75 | 7.72 | 7.30 | 1.01 | 3.85 | 4.23 | 2.82 | 47.01 |
| rem. MO | 10.65 | 0 | 4.48 | 6.20 | 4.45 | 0 | 7.44 | 2.70 | 4.40 | 1.18 | 7.80 | 49.30 |
Table 4.
The hourly offer, traded and remaining quantities in the primary market for all buyers, kWh.
Table 4.
The hourly offer, traded and remaining quantities in the primary market for all buyers, kWh.
| Hour | h06 | h07 | h08 | h09 | h10 | h11 | h12 | h13 | h14 | h15 | h16 | h17 | h18 | Total |
|---|---|---|---|---|---|---|---|---|---|---|---|---|---|---|
| Consumption (offer FCFS) | 11.8 | 14.06 | 18.87 | 13.47 | 13.55 | 14.96 | 16.04 | 18.16 | 13.7 | 12.83 | 15.23 | 20.77 | 19.99 | 203.43 |
| offer MO | 12.1 | 14.9 | 17.5 | 13.6 | 13.6 | 14.7 | 13.6 | 18.3 | 13.8 | 14 | 15.8 | 20.5 | 21 | 203.40 |
| traded FCFS | 10.29 | 11.56 | 12.1 | 13.47 | 13.55 | 14.96 | 16.04 | 17.25 | 13.7 | 12.83 | 8.46 | 5.12 | 7.07 | 156.40 |
| traded MO | 10.29 | 11.56 | 12.1 | 13.6 | 13.6 | 14.7 | 13.6 | 17.25 | 13.8 | 12.95 | 8.46 | 5.12 | 7.07 | 154.10 |
| rem. FCFS | 1.51 | 2.5 | 6.77 | 0 | 0 | 0 | 0 | 0.91 | 0 | 0 | 6.77 | 15.65 | 12.92 | 47.03 |
| rem. MO | 1.81 | 3.34 | 5.40 | 0 | 0 | 0 | 0 | 1.05 | 0 | 1.05 | 7.34 | 15.38 | 13.93 | 49.30 |
Table 5.
The daily offer, traded and remaining quantities for each seller in the primary market, kWh.
Table 5.
The daily offer, traded and remaining quantities for each seller in the primary market, kWh.
| Prosumer | P27 | P21 | P7 | P15 | P6 | P3 | P10 | P25 | Total |
|---|---|---|---|---|---|---|---|---|---|
| surplus | 11.51 | 18.90 | 10.00 | 24.17 | 10.90 | 32.20 | 12.67 | 47.63 | 167.97 |
| traded FCFS | 11.51 | 17.72 | 9.88 | 22.87 | 8.92 | 25.20 | 12.67 | 47.63 | 156.40 |
| traded MO | 11.51 | 9.89 | 10.00 | 19.80 | 10.90 | 31.71 | 12.67 | 47.63 | 154.10 |
| rem. FCFS | 0 | 1.18 | 0.11 | 1.30 | 1.98 | 7.00 | 0 | 0 | 11.58 |
| rem. MO | 0 | 9.02 | 0 | 4.37 | 0 | 0.49 | 0 | 0 | 13.88 |
Table 6.
The hourly offer, traded and remaining quantities in the primary market, for all sellers, kWh.
Table 6.
The hourly offer, traded and remaining quantities in the primary market, for all sellers, kWh.
| Hour | h06 | h07 | h08 | h09 | h10 | h11 | h12 | h13 | h14 | h15 | h16 | h17 | h18 | Total |
|---|---|---|---|---|---|---|---|---|---|---|---|---|---|---|
| Surplus | 10.29 | 11.56 | 12.10 | 15.28 | 17.69 | 17.30 | 17.28 | 17.25 | 15.62 | 12.95 | 8.46 | 5.12 | 7.07 | 167.97 |
| traded FCFS | 10.29 | 11.56 | 12.10 | 13.47 | 13.55 | 14.96 | 16.04 | 17.25 | 13.70 | 12.83 | 8.46 | 5.12 | 7.07 | 156.40 |
| traded MO | 10.29 | 11.56 | 12.10 | 13.60 | 13.60 | 14.70 | 13.60 | 17.25 | 13.80 | 12.95 | 8.46 | 5.12 | 7.07 | 154.10 |
| rem. FCFS | 0 | 0 | 0 | 1.82 | 4.14 | 2.35 | 1.24 | 0 | 1.92 | 0.11 | 0 | 0 | 0 | 11.58 |
| rem. MO | 0 | 0 | 0 | 1.68 | 4.09 | 2.60 | 3.68 | 0 | 1.82 | 0 | 0 | 0 | 0 | 13.88 |
Table 7.
The daily cost for each buyer in the primary market, mu.
| Consumers | C5 | C8 | C9 | C11 | C12 | C14 | C16 | C19 | C20 | C24 | C26 | Total | |
|---|---|---|---|---|---|---|---|---|---|---|---|---|---|
| FCFS | MCP | 8.28 | 9.23 | 11.30 | 6.96 | 2.70 | 5.87 | 7.59 | 1.36 | 4.00 | 9.42 | 4.39 | 71.11 |
| COP | 7.80 | 12.17 | 13.79 | 7.97 | 2.90 | 7.92 | 8.10 | 1.20 | 4.98 | 11.99 | 4.72 | 83.54 | |
| POP | 8.28 | 9.23 | 11.30 | 6.96 | 2.70 | 5.87 | 7.59 | 1.36 | 4.00 | 9.42 | 4.39 | 71.11 | |
| MO | MCP | 6.40 | 13.15 | 13.91 | 5.44 | 2.47 | 10.89 | 8.49 | 0.68 | 3.94 | 12.53 | 2.46 | 80.36 |
| COP | 5.65 | 15.18 | 14.53 | 5.36 | 2.33 | 12.48 | 8.01 | 0.55 | 4.07 | 13.69 | 2.35 | 84.20 | |
| POP | 6.03 | 10.52 | 11.79 | 4.80 | 2.34 | 9.00 | 7.91 | 0.67 | 3.41 | 10.56 | 2.25 | 69.28 | |
Table 8.
The hourly cost in the primary market for all buyers, mu.
| Consumers | h06 | h07 | h08 | h09 | h10 | h11 | h12 | h13 | h14 | h15 | h16 | h17 | h18 | Total | |
|---|---|---|---|---|---|---|---|---|---|---|---|---|---|---|---|
| FCFS | MCP | 4.74 | 5.31 | 5.58 | 6.11 | 6.06 | 6.81 | 7.30 | 7.73 | 6.12 | 5.90 | 3.87 | 2.30 | 3.28 | 71.11 |
| COP | 5.60 | 6.33 | 6.21 | 7.20 | 7.35 | 7.84 | 8.51 | 9.12 | 7.51 | 7.06 | 4.42 | 2.61 | 3.79 | 83.54 | |
| POP | 4.74 | 5.31 | 5.58 | 6.11 | 6.06 | 6.81 | 7.30 | 7.73 | 6.12 | 5.90 | 3.87 | 2.30 | 3.28 | 71.11 | |
| MO | MCP | 5.66 | 6.36 | 6.66 | 7.48 | 6.39 | 7.06 | 6.53 | 9.49 | 6.62 | 7.12 | 4.65 | 2.46 | 3.89 | 80.36 |
| COP | 5.66 | 6.43 | 6.60 | 7.28 | 7.33 | 7.68 | 7.26 | 9.13 | 7.53 | 7.18 | 4.90 | 3.05 | 4.15 | 84.20 | |
| POP | 4.74 | 5.31 | 5.58 | 6.04 | 5.90 | 6.52 | 5.94 | 7.73 | 6.13 | 5.95 | 3.87 | 2.30 | 3.28 | 69.28 | |
Table 9.
The daily revenue for each seller in the primary market, mu.
| Prosumers | P27 | P21 | P7 | P15 | P6 | P3 | P10 | P25 | Total | |
|---|---|---|---|---|---|---|---|---|---|---|
| FCFS | MCP | 4.95 | 9.75 | 3.95 | 10.98 | 3.83 | 11.85 | 5.32 | 20.48 | 71.11 |
| COP | 6.02 | 9.04 | 5.15 | 11.86 | 4.74 | 13.95 | 7.04 | 25.74 | 83.54 | |
| POP | 4.95 | 9.75 | 3.95 | 10.98 | 3.83 | 11.85 | 5.32 | 20.48 | 71.11 | |
| MO | MCP | 5.88 | 5.44 | 5.13 | 10.50 | 5.51 | 16.44 | 6.67 | 24.78 | 80.36 |
| COP | 6.11 | 4.98 | 6.00 | 9.80 | 5.90 | 16.25 | 7.54 | 27.61 | 84.20 | |
| POP | 4.95 | 5.44 | 4.00 | 9.51 | 4.69 | 14.90 | 5.32 | 20.48 | 69.28 | |
Table 10.
The hourly revenue in the primary market for all sellers, mu.
| Prosumers | h06 | h07 | h08 | h09 | h10 | h11 | h12 | h13 | h14 | h15 | h16 | h17 | h18 | Total | |
|---|---|---|---|---|---|---|---|---|---|---|---|---|---|---|---|
| FCFS | MCP | 4.74 | 5.31 | 5.58 | 6.11 | 6.06 | 6.81 | 7.30 | 7.73 | 6.12 | 5.90 | 3.87 | 2.30 | 3.28 | 71.11 |
| COP | 5.60 | 6.33 | 6.21 | 7.20 | 7.35 | 7.84 | 8.51 | 9.12 | 7.51 | 7.06 | 4.42 | 2.61 | 3.79 | 83.54 | |
| POP | 4.74 | 5.31 | 5.58 | 6.11 | 6.06 | 6.81 | 7.30 | 7.73 | 6.12 | 5.90 | 3.87 | 2.30 | 3.28 | 71.11 | |
| MO | MCP | 5.66 | 6.36 | 6.66 | 7.48 | 6.39 | 7.06 | 6.53 | 9.49 | 6.62 | 7.12 | 4.65 | 2.46 | 3.89 | 80.36 |
| COP | 5.66 | 6.43 | 6.60 | 7.28 | 7.33 | 7.68 | 7.26 | 9.13 | 7.53 | 7.18 | 4.90 | 3.05 | 4.15 | 84.20 | |
| POP | 4.74 | 5.31 | 5.58 | 6.04 | 5.90 | 6.52 | 5.94 | 7.73 | 6.13 | 5.95 | 3.87 | 2.30 | 3.28 | 69.28 | |
Table 11.
The daily traded quantities for consumer C28 in the energy poverty mitigation market, kWh.
Table 11.
The daily traded quantities for consumer C28 in the energy poverty mitigation market, kWh.
| Consumer | C28 |
|---|---|
| Consumption (offers FCFS) | 1.79 |
| offers MO | 1.79 |
| traded FCFS | 0.72 |
| traded MO | 1.79 |
| rem. FCFS | 1.07 |
| rem. MO | 0 |
Table 12.
The hourly traded quantities in the poverty mitigation market for consumer C28, kWh.
| Hour | h06 | h07 | h08 | h09 | h10 | h11 | h12 | h13 | h14 | h15 | h16 | h17 | h18 | Total |
|---|---|---|---|---|---|---|---|---|---|---|---|---|---|---|
| Consumption (offer FCFS) | 0.19 | 0.14 | 0.15 | 0 | 0 | 0.08 | 0.51 | 0.06 | 0.02 | 0.24 | 0.09 | 0.08 | 0.23 | 1.79 |
| offer MO | 0.19 | 0.14 | 0.15 | 0 | 0 | 0.08 | 0.51 | 0.06 | 0.02 | 0.24 | 0.09 | 0.08 | 0.23 | 1.79 |
| traded FCFS | 0 | 0 | 0 | 0 | 0 | 0.08 | 0.51 | 0 | 0.02 | 0.11 | 0 | 0 | 0 | 0.72 |
| traded MO | 0.19 | 0.14 | 0.15 | 0 | 0 | 0.08 | 0.51 | 0.06 | 0.02 | 0.24 | 0.09 | 0.08 | 0.23 | 1.79 |
| rem. FCFS | 0.19 | 0.14 | 0.15 | 0 | 0 | 0 | 0 | 0.06 | 0 | 0.13 | 0.09 | 0.08 | 0.23 | 1.07 |
| rem. MO | 0 | 0 | 0 | 0 | 0 | 0 | 0 | 0 | 0 | 0 | 0 | 0 | 0 | 0 |
Table 13.
The daily traded quantities for each vendor in the energy poverty mitigation market, kWh.
| Vendor | P21 | P7 | P15 | P6 | P3 | C5 | C9 | C11 | C12 | C16 | C19 | C20 | C24 | C26 | Total |
|---|---|---|---|---|---|---|---|---|---|---|---|---|---|---|---|
| surplus FCFS | 1.18 | 0.11 | 1.30 | 1.98 | 7.00 | 0 | 0 | 0 | 0 | 0 | 0 | 0 | 0 | 0 | 11.58 |
| surplus MO | 9.02 | 0 | 4.37 | 0 | 0.49 | 10.65 | 4.48 | 6.20 | 4.46 | 7.44 | 2.70 | 4.40 | 1.18 | 7.80 | 63.18 |
| traded FCFS | 0 | 0.11 | 0 | 0.53 | 0.08 | 0 | 0 | 0 | 0 | 0 | 0 | 0 | 0 | 0 | 0.72 |
| traded MO | 0 | 0 | 0.60 | 0 | 0.00 | 0 | 0 | 0 | 0 | 0 | 1.18 | 0 | 0 | 0 | 1.79 |
| rem. FCFS | 1.18 | 0.00 | 1.30 | 1.45 | 6.92 | 0 | 0 | 0 | 0 | 0 | 0 | 0 | 0 | 0 | 10.86 |
| rem. MO | 9.02 | 0.00 | 3.76 | 0 | 0.49 | 10.65 | 4.48 | 6.20 | 4.46 | 7.44 | 1.52 | 4.40 | 1.18 | 7.80 | 61.39 |
Table 14.
The hourly traded quantities in the energy poverty mitigation market for all vendors, kWh.
Table 14.
The hourly traded quantities in the energy poverty mitigation market for all vendors, kWh.
| Hour | h06 | h07 | h08 | h09 | h10 | h11 | h12 | h13 | h14 | h15 | h16 | h17 | h18 | Total |
|---|---|---|---|---|---|---|---|---|---|---|---|---|---|---|
| surplus FCFS | 0 | 0 | 0 | 1.82 | 4.14 | 2.35 | 1.24 | 0 | 1.92 | 0.11 | 0 | 0 | 0 | 11.58 |
| surplus MO | 1.81 | 3.34 | 5.40 | 1.68 | 4.09 | 2.60 | 3.68 | 1.05 | 1.82 | 1.06 | 7.34 | 15.38 | 13.94 | 63.18 |
| traded-FCFS | 0 | 0 | 0 | 0 | 0.00 | 0.08 | 0.51 | 0 | 0.02 | 0.11 | 0 | 0 | 0 | 0.72 |
| traded-MO | 0.19 | 0.14 | 0.15 | 0.00 | 0.00 | 0.08 | 0.51 | 0.06 | 0.02 | 0.24 | 0.09 | 0.08 | 0.23 | 1.79 |
| rem. FCFS | 0 | 0 | 0 | 1.82 | 4.14 | 2.27 | 0.73 | 0 | 1.90 | 0 | 0 | 0 | 0 | 10.86 |
| rem. MO | 1.62 | 3.20 | 5.25 | 1.68 | 4.08 | 2.53 | 3.17 | 0.99 | 1.80 | 0.81 | 7.25 | 15.30 | 13.71 | 61.39 |
Table 15.
The daily cost for each consumer in the energy poverty mitigation market, mu.
| Consumers | C28 | |
|---|---|---|
| FCFS | POP | 0.72 |
| MO | POP | 0.75 |
Table 16.
The hourly cost for all buyers in the energy poverty mitigation market, mu.
| Consumers | h06 | h07 | h08 | h09 | h10 | h11 | h12 | h13 | h14 | h15 | h16 | h17 | h18 | Total | |
|---|---|---|---|---|---|---|---|---|---|---|---|---|---|---|---|
| FCFS | POP | 0 | 0 | 0 | 0 | 0.00 | 0.08 | 0.51 | 0 | 0.02 | 0.11 | 0 | 0 | 0 | 0.72 |
| MO | POP | 0.07 | 0.05 | 0.06 | 0 | 0.00 | 0.04 | 0.24 | 0.02 | 0.01 | 0.10 | 0.03 | 0.03 | 0.09 | 0.75 |
Table 17.
The daily revenue for each vendor in the energy poverty mitigation market, mu.
| Vendors | P21 | P7 | P15 | P6 | P3 | C5 | C9 | C11 | C12 | C16 | C19 | C20 | C24 | C26 | Total | |
|---|---|---|---|---|---|---|---|---|---|---|---|---|---|---|---|---|
| FCFS | POP | 0 | 0.11 | 0 | 0.53 | 0.08 | 0 | 0 | 0 | 0 | 0 | 0 | 0 | 0 | 0 | 0.72 |
| MO | POP | 0 | 0 | 0.29 | 0 | 0.00 | 0 | 0 | 0 | 0 | 0 | 0.46 | 0 | 0 | 0 | 0.75 |
Table 18.
The hourly revenue in the energy poverty mitigation market for all vendors, mu.
| Prosumers | h06 | h07 | h08 | h09 | h10 | h11 | h12 | h13 | h14 | h15 | h16 | h17 | h18 | Total | |
|---|---|---|---|---|---|---|---|---|---|---|---|---|---|---|---|
| FCFS | POP | 0 | 0 | 0 | 0 | 0.00 | 0.08 | 0.51 | 0 | 0.02 | 0.11 | 0 | 0 | 0 | 0.72 |
| MO | POP | 0.07 | 0.05 | 0.06 | 0 | 0.00 | 0.04 | 0.24 | 0.02 | 0.01 | 0.10 | 0.03 | 0.03 | 0.09 | 0.75 |
Table 19.
The daily traded quantities for each buyer in the secondary tariff market, kWh.
| Consumer | C13 | C17 | C18 | Total |
|---|---|---|---|---|
| offer FCFS | 7.30 | 8.55 | 6.62 | 22.48 |
| offer MO | 7.30 | 8.55 | 6.62 | 22.48 |
| traded FCFS | 2.49 | 2.99 | 2.20 | 7.67 |
| traded MO | 7.30 | 7.61 | 6.36 | 21.28 |
| rem. FCFS | 4.82 | 5.57 | 4.43 | 14.81 |
| rem. MO | 0.00 | 0.94 | 0.26 | 1.20 |
Table 20.
The hourly traded quantities in the secondary tariff market for all buyers, kWh.
| Hour | h06 | h07 | h08 | h09 | h10 | h11 | h12 | h13 | h14 | h15 | h16 | h17 | h18 | Total |
|---|---|---|---|---|---|---|---|---|---|---|---|---|---|---|
| offer FCFS | 1.99 | 1.03 | 1.11 | 1.39 | 2.12 | 1.85 | 2.16 | 1.08 | 1.58 | 1.55 | 2.41 | 1.79 | 2.42 | 22.48 |
| offer MO | 1.99 | 1.03 | 1.11 | 1.39 | 2.12 | 1.85 | 2.16 | 1.08 | 1.58 | 1.55 | 2.41 | 1.79 | 2.42 | 22.48 |
| traded FCFS | 0 | 0 | 0 | 1.39 | 2.12 | 1.85 | 0.73 | 0 | 1.58 | 0 | 0 | 0 | 0 | 7.67 |
| traded MO | 1.62 | 1.03 | 1.11 | 1.39 | 2.12 | 1.85 | 2.16 | 0.99 | 1.58 | 0.81 | 2.41 | 1.79 | 2.42 | 21.28 |
| rem. FCFS | 1.99 | 1.03 | 1.11 | 0.00 | 0.00 | 0.00 | 1.43 | 1.08 | 0.00 | 1.55 | 2.41 | 1.79 | 2.42 | 14.81 |
| rem. MO | 0.38 | 0.00 | 0.00 | 0.00 | 0.00 | 0.00 | 0.00 | 0.09 | 0.00 | 0.74 | 0.00 | 0.00 | 0.00 | 1.20 |
Table 21.
The daily traded quantities for each vendor in the secondary tariff market, kWh.
| Vendor | P21 | P15 | P6 | P3 | C5 | C9 | C11 | C12 | C16 | C19 | C20 | C24 | C26 | Total |
|---|---|---|---|---|---|---|---|---|---|---|---|---|---|---|
| surplus FCFS | 1.18 | 1.30 | 1.45 | 6.92 | 0 | 0 | 0 | 0 | 0 | 0 | 0 | 0 | 0 | 10.86 |
| surplus MO | 9.02 | 3.76 | 0.00 | 0.49 | 10.65 | 4.48 | 6.20 | 4.46 | 7.44 | 1.52 | 4.40 | 1.18 | 7.80 | 61.39 |
| traded FCFS | 0.86 | 0 | 1.45 | 5.36 | 0 | 0 | 0 | 0 | 0 | 0 | 0 | 0 | 0 | 7.67 |
| traded MO | 4.84 | 3.76 | 0 | 0.49 | 6.38 | 0 | 0.00 | 2.78 | 1.51 | 1.52 | 0 | 0 | 0 | 21.28 |
| rem. FCFS | 0.32 | 1.30 | 0 | 1.56 | 0 | 0 | 0 | 0 | 0 | 0 | 0 | 0 | 0 | 3.19 |
| rem. MO | 4.17 | 0 | 0 | 0 | 4.27 | 4.48 | 6.20 | 1.68 | 5.94 | 0 | 4.40 | 1.18 | 7.80 | 40.11 |
Table 22.
The hourly traded quantities in the secondary tariff market for all vendors, kWh.
| Hour | h06 | h07 | h08 | h09 | h10 | h11 | h12 | h13 | h14 | h15 | h16 | h17 | h18 | Total |
|---|---|---|---|---|---|---|---|---|---|---|---|---|---|---|
| surplus FCFS | 0 | 0 | 0 | 1.82 | 4.14 | 2.27 | 0.73 | 0 | 1.90 | 0 | 0 | 0 | 0 | 10.86 |
| surplus MO | 1.62 | 3.20 | 5.25 | 1.68 | 4.08 | 2.53 | 3.17 | 0.99 | 1.80 | 0.81 | 7.25 | 15.30 | 13.71 | 61.39 |
| traded FCFS | 0 | 0 | 0 | 1.39 | 2.12 | 1.85 | 0.73 | 0 | 1.58 | 0 | 0 | 0 | 0 | 7.67 |
| traded MO | 1.62 | 1.03 | 1.11 | 1.39 | 2.12 | 1.85 | 2.16 | 0.99 | 1.58 | 0.81 | 2.41 | 1.79 | 2.42 | 21.28 |
| diff FCFS | 0 | 0 | 0 | 0.43 | 2.02 | 0.42 | 0.00 | 0 | 0.32 | 0 | 0 | 0 | 0 | 3.19 |
| diff MO | 0 | 2.16 | 4.14 | 0.30 | 1.96 | 0.67 | 1.01 | 0 | 0.23 | 0 | 4.84 | 13.51 | 11.29 | 40.11 |
Table 23.
The daily cost for each consumer in the tariff-access market, mu.
| Consumers | C13 | C17 | C18 | Total | Total + 10% Fee | |
|---|---|---|---|---|---|---|
| FCFS | MCP | 1.14 | 1.47 | 1.01 | 3.61 | 3.98 |
| COP | 1.17 | 0.90 | 0.92 | 2.99 | 3.29 | |
| POP | 1.14 | 1.47 | 1.01 | 3.61 | 3.98 | |
| MO | MCP | 3.71 | 3.86 | 3.20 | 10.77 | 11.85 |
| COP | 3.43 | 2.28 | 2.67 | 8.39 | 9.23 | |
| POP | 3.37 | 3.84 | 3.02 | 10.23 | 11.26 | |
Table 24.
The hourly cost for all buyers in the tariff-access market, mu.
| Consumers | h06 | h07 | h08 | h09 | h10 | h11 | h12 | h13 | h14 | h15 | h16 | h17 | h18 | Total | Total + 10% Fee | |
|---|---|---|---|---|---|---|---|---|---|---|---|---|---|---|---|---|
| FCFS | MCP | 0 | 0 | 0 | 0.65 | 1.00 | 0.87 | 0.32 | 0 | 0.78 | 0 | 0 | 0 | 0 | 3.61 | 3.98 |
| COP | 0 | 0 | 0 | 0.56 | 0.88 | 0.65 | 0.34 | 0 | 0.55 | 0 | 0 | 0 | 0 | 2.99 | 3.29 | |
| POP | 0 | 0 | 0 | 0.65 | 1.00 | 0.87 | 0.32 | 0 | 0.78 | 0 | 0 | 0 | 0 | 3.61 | 3.98 | |
| MO | MCP | 0.79 | 0.50 | 0.50 | 0.76 | 1.17 | 1.02 | 1.19 | 0.45 | 0.87 | 0.39 | 1.18 | 0.81 | 1.16 | 10.77 | 11.85 |
| COP | 0.75 | 0.45 | 0.42 | 0.56 | 0.88 | 0.65 | 0.88 | 0.38 | 0.55 | 0.33 | 0.95 | 0.65 | 0.95 | 8.39 | 9.23 | |
| POP | 0.77 | 0.47 | 0.49 | 0.76 | 1.04 | 0.99 | 1.09 | 0.43 | 0.82 | 0.37 | 1.12 | 0.79 | 1.10 | 10.23 | 11.26 | |
Table 25.
The daily revenue for each vendor in the tariff-access market, mu.
| Vendors | P21 | P15 | P6 | P3 | C5 | C9 | C11 | C12 | C16 | C19 | C20 | C24 | C26 | Total | |
|---|---|---|---|---|---|---|---|---|---|---|---|---|---|---|---|
| FCFS | MCP | 0.47 | 0 | 0.62 | 2.52 | 0 | 0 | 0 | 0 | 0 | 0 | 0 | 0 | 0 | 3.61 |
| COP | 0.26 | 0 | 0.63 | 2.10 | 0 | 0 | 0 | 0 | 0 | 0 | 0 | 0 | 0 | 2.99 | |
| POP | 0.47 | 0 | 0.62 | 2.52 | 0 | 0 | 0 | 0 | 0 | 0 | 0 | 0 | 0 | 3.61 | |
| MO | MCP | 2.66 | 2.07 | 0 | 0.27 | 2.97 | 0 | 0 | 1.35 | 0.74 | 0.71 | 0 | 0 | 0 | 10.77 |
| COP | 1.65 | 1.65 | 0 | 0.23 | 2.55 | 0 | 0 | 1.05 | 0.56 | 0.70 | 0 | 0 | 0 | 8.39 | |
| POP | 2.66 | 1.81 | 0 | 0.23 | 2.87 | 0 | 0 | 1.33 | 0.74 | 0.59 | 0 | 0 | 0 | 10.23 | |
Table 26.
The hourly revenue in the tariff-access market for all vendors, mu.
| Prosumers | h06 | h07 | h08 | h09 | h10 | h11 | h12 | h13 | h14 | h15 | h16 | h17 | h18 | Total | |
|---|---|---|---|---|---|---|---|---|---|---|---|---|---|---|---|
| FCFS | MCP | 0 | 0 | 0 | 0.65 | 1.00 | 0.87 | 0.32 | 0 | 0.78 | 0 | 0 | 0 | 0 | 3.61 |
| COP | 0 | 0 | 0 | 0.56 | 0.88 | 0.65 | 0.34 | 0 | 0.55 | 0 | 0 | 0 | 0 | 2.99 | |
| POP | 0 | 0 | 0 | 0.65 | 1.00 | 0.87 | 0.32 | 0 | 0.78 | 0 | 0 | 0 | 0 | 3.61 | |
| MO | MCP | 0.79 | 0.50 | 0.50 | 0.76 | 1.17 | 1.02 | 1.19 | 0.45 | 0.87 | 0.39 | 1.18 | 0.81 | 1.16 | 10.77 |
| COP | 0.75 | 0.45 | 0.42 | 0.56 | 0.88 | 0.65 | 0.88 | 0.38 | 0.55 | 0.33 | 0.95 | 0.65 | 0.95 | 8.39 | |
| POP | 0.77 | 0.47 | 0.49 | 0.76 | 1.04 | 0.99 | 1.09 | 0.43 | 0.82 | 0.37 | 1.12 | 0.79 | 1.10 | 10.23 | |
Table 27.
The surplus of prosumer P21 in the primary and secondary markets (energy poverty mitigation and tariff-access), kWh.
Table 27.
The surplus of prosumer P21 in the primary and secondary markets (energy poverty mitigation and tariff-access), kWh.
| Hour | Initial Generation | Surplus | |||
|---|---|---|---|---|---|
| Initial | After the Primary Market | After the Secondary Market, 1st Tier | After the Secondary Market, 2nd Tier (Tariff-Access) | ||
| h01 | 2.361 | 1.588 | 0 | 0 | 0 |
| h02 | 2.785 | 1.805 | 0 | 0 | 0 |
| h03 | 3.286 | 1.726 | 0 | 0 | 0 |
| h04 | 3.329 | 1.749 | 1.682 | 1.682 | 0.296 |
| h05 | 3.639 | 2.292 | 2.292 | 2.292 | 1.963 |
| h06 | 3.751 | 2.038 | 2.038 | 2.038 | 0.672 |
| h07 | 3.735 | 1.822 | 1.822 | 1.822 | 1.014 |
| h08 | 3.812 | 0.685 | 0 | 0 | 0 |
| h09 | 3.742 | 1.182 | 1.182 | 1.182 | 0.227 |
| h10 | 3.461 | 2.028 | 0 | 0 | 0 |
| h11 | 2.832 | 0.819 | 0 | 0 | 0 |
| h12 | 2.403 | 0 | 0 | 0 | 0 |
| h13 | 2.237 | 1.17 | 0 | 0 | 0 |
| Total | 41.373 | 18.904 | 9.016 | 9.016 | 4.172 |
Table 28.
Comparison between the quantities sold by prosumer P21 in the tariff- and invite-access markets, kWh.
Table 28.
Comparison between the quantities sold by prosumer P21 in the tariff- and invite-access markets, kWh.
| Hour | Surplus, P21 | Consumption, C22 | Electricity Sold in the Tariff-Access Market | Electricity Sold to C22 in the Invite-Access Market |
|---|---|---|---|---|
| h06 | 0 | 1.340 | 0 | 0 |
| h07 | 0 | 0.960 | 0 | 0 |
| h08 | 0 | 0.270 | 0 | 0 |
| h09 | 1.682 | 0.420 | 1.386 | 0.420 |
| h10 | 2.292 | 1.000 | 0.329 | 1.000 |
| h11 | 2.038 | 0.930 | 1.366 | 0.930 |
| h12 | 1.822 | 1.050 | 0.808 | 1.050 |
| h13 | 0 | 1.020 | 0 | 0 |
| h14 | 1.182 | 0.970 | 0.955 | 0.970 |
| h15 | 0 | 1.010 | 0 | 0 |
| h16 | 0 | 1.110 | 0 | 0 |
| h17 | 0 | 1.540 | 0 | 0 |
| h18 | 0 | 1.630 | 0 | 0 |
| Total | 9.016 | 13.250 | 4.844 | 4.370 |
Table 29.
The evolution of the electricity quantities bought from the grid in the time interval 06:00–18:00, before and after trading on each market segment, kWh.
Table 29.
The evolution of the electricity quantities bought from the grid in the time interval 06:00–18:00, before and after trading on each market segment, kWh.
| Trading Priority in PM | Initial Consumption (No Market) | Traded in PM | Consumer Surplus for SM | Consumption Bought from the Grid after PM | Traded in SM1 | Traded in SM2 | Consumption Bought from the Grid after SM |
|---|---|---|---|---|---|---|---|
| FCFS | 203.41 | 156.4 | 0 | 47.01 | 0.72 | 7.67 | 38.62 |
| MO | 203.41 | 154.1 | 49.31 | 98.62 | 1.79 | 21.28 | 75.55 |
Table 30.
The evolution of the surplus quantities sold to the grid in the hourly interval 06:00–18:00, after trading on each market segment, kWh.
Table 30.
The evolution of the surplus quantities sold to the grid in the hourly interval 06:00–18:00, after trading on each market segment, kWh.
| Market Player Type | PM Trading Priority | Initial Surplus | Traded in PM | Surplus after PM | Traded in SM1 | Traded in SM2 | Surplus after SM |
|---|---|---|---|---|---|---|---|
| prosumers | FCFS | 167.97 | 156.4 | 11.58 | 0.72 | 7.67 | 3.18 |
| MO | 167.97 | 154.1 | 13.88 | 0.6 | 9.1 | 4.17 | |
| consumers | FCFS | 0 | 0 | 0 | 0 | 0 | 0 |
| MO | 0 | 0 | 49.31 | 1.18 | 12.68 | 35.45 |
Table 31.
Comparison between the costs of the consumers in each market segment and for each settlement price, mu.
Table 31.
Comparison between the costs of the consumers in each market segment and for each settlement price, mu.
| Trading Priority in PM | Settlement Price | PM | SM1 | SM2 | SM | Total PM + SM |
|---|---|---|---|---|---|---|
| FCFS | MCP | 71.11 | 0 | 3.98 | 3.98 | 75.09 |
| COP | 83.54 | 0 | 3.29 | 3.29 | 86.83 | |
| POP | 71.11 | 0.72 | 3.98 | 4.7 | 75.81 | |
| MO | MCP | 80.36 | 0 | 11.85 | 11.85 | 92.21 |
| COP | 84.2 | 0 | 9.23 | 9.23 | 93.43 | |
| POP | 69.28 | 0.75 | 11.26 | 12.01 | 81.29 |
Table 32.
Comparison between the vendor revenues on all market segments, mu.
| Sellers | Revenue without Local Market | PM Trading Priority | Settlement Price | PM | SM1 | SM2 | SM | Total PM + SM | Total PM + SM + Grid |
|---|---|---|---|---|---|---|---|---|---|
| prosumers | 42.16 | FCFS | MCP | 71.11 | 0 | 3.61 | 3.61 | 74.72 | 75.52 |
| COP | 83.54 | 0 | 2.99 | 2.99 | 86.53 | 87.33 | |||
| POP | 71.11 | 0.72 | 3.61 | 4.33 | 75.44 | 76.24 | |||
| MO | MCP | 80.36 | 0 | 5 | 5 | 85.36 | 86.41 | ||
| COP | 84.2 | 0 | 3.53 | 3.53 | 87.73 | 88.78 | |||
| POP | 69.28 | 0.29 | 4.7 | 4.99 | 74.27 | 75.32 | |||
| consumers | 12.38 | FCFS | MCP | 0 | 0 | 0 | 0 | 0 | 12.38 |
| COP | 0 | 0 | 0 | 0 | 0 | ||||
| POP | 0 | 0 | 0 | 0 | 0 | ||||
| MO | MCP | 0 | 0 | 5.77 | 5.77 | 5.77 | 14.67 | ||
| COP | 0 | 0 | 4.86 | 4.86 | 4.86 | 13.76 | |||
| POP | 0 | 0.46 | 5.53 | 5.99 | 5.99 | 14.89 |
Table 33.
Comparison between the influence of the primary secondary market on the electricity costs for the microgrid, time interval 06:00–18:00, mu.
Table 33.
Comparison between the influence of the primary secondary market on the electricity costs for the microgrid, time interval 06:00–18:00, mu.
| PM Trading Priority | Settlement Price | Cost with Regulated Tariff | Cost with PM | Cost with PM and SM | % Reduction PM | % Reduction PM + SM |
|---|---|---|---|---|---|---|
| FCFS | MCP | 136.89 | 102.75 | 101.08 | 24.94 | 26.16 |
| COP | 136.89 | 115.18 | 112.82 | 15.86 | 17.59 | |
| POP | 136.89 | 102.75 | 101.80 | 24.94 | 25.64 | |
| MO | MCP | 136.89 | 146.73 | 137.29 | −7.19 | −0.29 |
| COP | 136.89 | 150.57 | 139.42 | −9.99 | −1.84 | |
| POP | 136.89 | 135.65 | 126.15 | 0.91 | 7.85 |
© 2020 by the authors. Licensee MDPI, Basel, Switzerland. This article is an open access article distributed under the terms and conditions of the Creative Commons Attribution (CC BY) license (http://creativecommons.org/licenses/by/4.0/).
Share and Cite
MDPI and ACS Style
Neagu, B.-C.; Ivanov, O.; Grigoras, G.; Gavrilas, M.; Istrate, D.-M. New Market Model with Social and Commercial Tiers for Improved Prosumer Trading in Microgrids. Sustainability 2020, 12, 7265. https://doi.org/10.3390/su12187265
AMA Style
Neagu B-C, Ivanov O, Grigoras G, Gavrilas M, Istrate D-M. New Market Model with Social and Commercial Tiers for Improved Prosumer Trading in Microgrids. Sustainability. 2020; 12(18):7265. https://doi.org/10.3390/su12187265
Chicago/Turabian StyleNeagu, Bogdan-Constantin, Ovidiu Ivanov, Gheorghe Grigoras, Mihai Gavrilas, and Dumitru-Marcel Istrate. 2020. "New Market Model with Social and Commercial Tiers for Improved Prosumer Trading in Microgrids" Sustainability 12, no. 18: 7265. https://doi.org/10.3390/su12187265
Note that from the first issue of 2016, this journal uses article numbers instead of page numbers. See further details here.