1. Introduction
A hybrid power system (HPS) includes renewable energy sources, power generators, DC and AC loads, and energy and power storage devices that ensure the balance of power flows in conditions of stability and safe operation of the entire system [
1]. One or more HPSs are usually integrated into a nano-grid or a mini-grid [
2]. Depending on the size (kW), capability, and complexity of a grid, they are classified into mini-grids, micro-grids, nano-grids, and pico-grids [
3]. For example, a nano-grid can produce or consume energy in interaction with other mini-, micro- or nano-grids [
4]. Thus, the HPS based on fuel cell (FC) systems as backup energy source proposed in this study can emulate the operation of a nano-grid by including the power demand on the AC bus (from AC load and power exchanged with the grid in grid-connected mode) in the power profile of the DC load.
Due to the growing global energy demand in recent years [
5], the reduction of fossil fuel resources [
6] and the increase in greenhouse gas emissions have been contributing to climate change and global warming [
7]. Hence, sustainable energy development policies have been imposed [
8]. The increasing use of renewable energy sources (RES) in the last decade has clearly shown that they are a sustainable option for providing the energy needed for decades to come [
9].
However, it is worth mentioning that each RES has a variable profile (even intermittent), so regardless of how the combination of RESs available in a certain location (where in addition to solar energy, there can be energy generated by wind, rivers, tides, biomass and so on) the balance of power flows must be compensated to ensure the stability of HPS [
10]. Given that FC technology has matured and costs have been declining year by year, the FC system is frequently used as an auxiliary power source (instead of a diesel generator) to reduce the battery capacity. However, since fuel cells feature slow dynamics, they cannot be employed to respond to dynamic solicitations from the loads connected to the DC bus. Therefore, the use of a hybrid energy storage system (ESS) such as the combination batteries/ultracapacitors is required to compensate the dynamic operations [
11].
If FC HPS is not connected to the grid (being included in a nano-grid), it is recommended that the excess renewable energy be stored in hydrogen tanks using an electrolyzer [
12]. If FC HPS is connected to the grid, this surplus energy can be sold on the energy market when the price is the best.
This results in a hybridization of the grids by including complementary technologies for energy generation and storage [
13], with the aim of attenuating the variability of RES power by integrating complementary technologies and efficient control of power converters [
14]. Thus, the objectives of this paper are as follows:
To analyze four fuel economy strategies using power tracking control (PTC) of the FC boost converter and optimization through global extremum seeking (GES)-based control of the fueling regulators, as (1) performance compared with a benchmark strategy, and (2) safe operation in conditions of load disturbances and variations of renewable energy;
To design and test a new fuel economy strategy using PTC and optimization through GES-based control that is switched to the fuel and air by using a tuned power threshold to maximize the fuel economy;
To highlight the operation of the HPS in conditions of load disturbances and variations of renewable energy under PTC and related advantages in sizing the battery capacity and its lifetime.
Secondary objectives are focused on:
Identifying performance indicators to recognize the strategies of a subclass among other subclasses belonging to the same class of optimization strategies;
Proposing indicators that will allow estimation of fuel consumption over a predicted load cycle up to the first refueling station if the consumption during a standard load cycle is known.
The novelty of this study compared to other similar studies (including those published by the authors) is given by the following elements presented and validated in this study:
A new fuel economy strategy based on switching the optimization reference to air and fuel regulator considering a threshold of the required power from the fuel cell system is proposed and analyzed as performance compared to the original reference strategies and a commercial benchmark strategy.
Considering a variable power profile for the load demand and the renewable power, the advantages in design and operation of the battery stack due to the charge-sustained mode for battery using the new power tracking control proposed for the FC system are highlighted as follows: a reduced capacity and size is needed for the battery; an increased battery lifespan could be obtained avoiding the frequent charge-discharge cycles that appear in other strategies proposed in the literature; maintenance costs can be reduced (due to the fact that it is not necessary to monitor the state of charge (SOC) of the battery, because the final SOC will be almost equal to the initial SOC).
The advantages of using a new optimization fuel strategy based on two variables instead of one are highlighted by fuel economy obtained under variable power profile for the load demand and the renewable power.
New performance indicators to recognize the strategies of a subclass among other subclasses are proposed and validated using the four strategies analyzed here.
So, besides the introduction, the paper is structured into a further four sections as follows.
Section 2 presents the HPS model, detailing in subsections the PTC, GES control, and fueling strategies analyzed in this paper.
Section 3 presents the results obtained in stationary and dynamic regimes of HPS. Finally,
Section 4 comparatively analyzes the results and
Section 5 concludes the paper.
2. Modeling of the Hybrid Power System
The structure of the hybrid power system (HPS) is shown at the top of
Figure 1, which presents the HPS diagram and details the following subsystem: the energy management unit that contains the PTC, the optimal fueling strategy, the real-time optimization algorithm, and the semi-active ESS topology. The renewable power level on the DC bus is controlled by the
kRES parameter (see the HPS diagram at the top of
Figure 1). The FC power will be generated based on the PTC to compensate the power flow balance on the DC bus and operate the battery in charge-sustained mode.
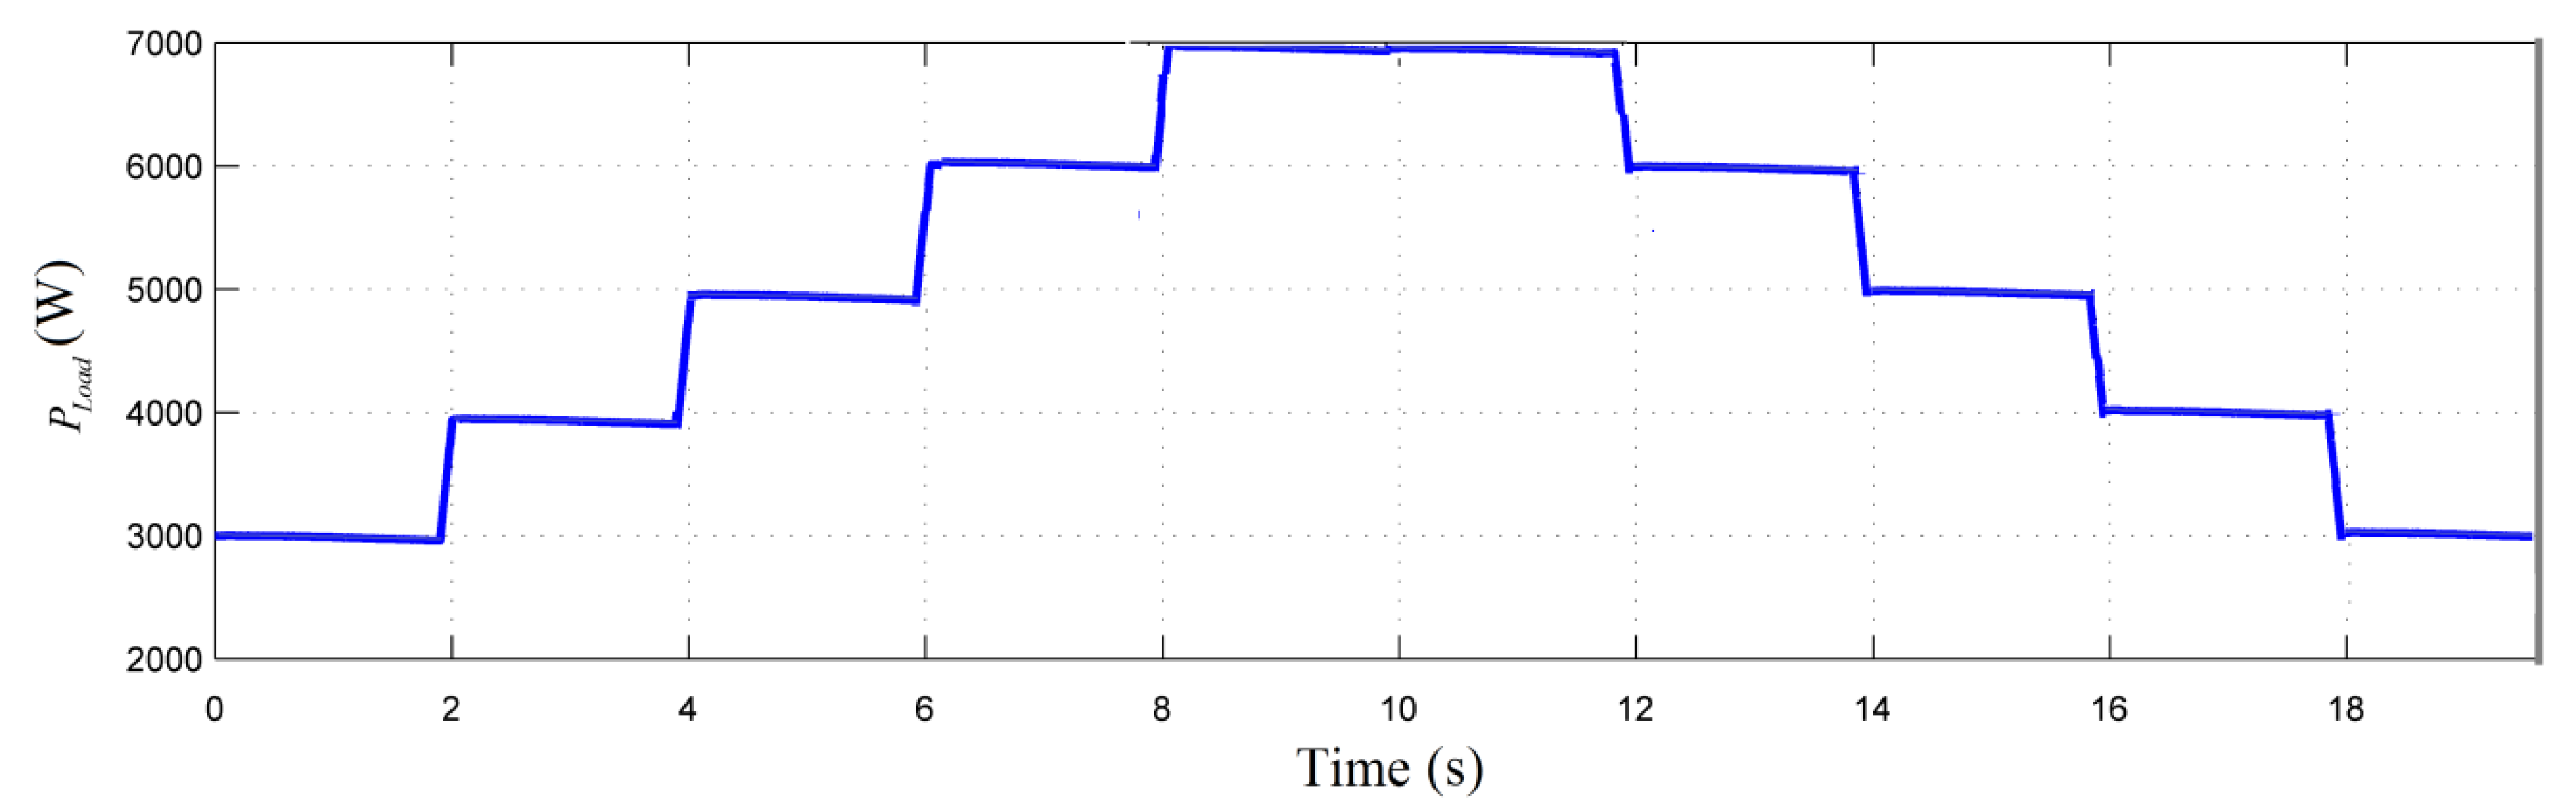
The inverter system and AC load have been equated at the DC bus level with a DC load. DC load is modeled by a controlled current source, resulting in a dynamic power (
Pload) required from the power sources connected to the DC bus (see for example,
Figure 2). Non-polluting energy sources such as photovoltaic panel arrays [
15] and wind turbine farms [
16] may provide renewable energy, but the available renewable power profile is variable (depending on weather, season, etc.) [
17], and the DC bus power balance must be dynamically compensated by the ESS [
18]. Consequently, it will result in a variable profile for ESS power due to the changed power with DC bus, with frequent charge-discharge cycles, which reduce the battery life [
19]. Furthermore, battery pack capacity must be oversized to provide the DC power needed under a variable power profile from RES, such as that shown in
Figure 3a or
Figure 4a (
PRES1 and
PRES2 for
kRES = 1 and
kRES = 2). RES is also modeled by a controlled current source to easily change the RES power profile.
The battery/ultracapacitors hybrid ESS (see bottom of the
Figure 1) uses a semi-active topology (with the battery connected directly to the DC bus and the ultracapacitors stack connected to the DC bus via a bidirectional DC-DC power converter), which is the most widely used in the literature because it ensures a trade-off between cost, performance, and flexibility in control.
The ESS power is shown in
Figure 3b and
Figure 4b for
kRES = 1 and
kRES = 2, respectively. In the first case, the battery is discharged and the state-of-charge (SOC) will decrease. In the second case, the battery operates in charge-discharge cycles, but in average value (AV) it seems to operate in charge-sustained mode (so, the final SOC will be approximately equal with the initial SOC of 80%). However, it is observed that there are charge and discharge cycles that must be taken into account in the design of the battery capacity. Note that
Pload(AV) = 5 kW,
PRES1(AV) ≅ 2.5 kW, and
PRES2(AV) ≅ 5 kW, so
PESS1(AV) ≅ 2.5 kW, and
PESS2(AV) ≅ 0.
Battery pack operation in charge-sustained mode with SOC variations within the admissible limits due to a reduced level of the ESS power exchanged with DC bus has the following advantages: no battery capacity oversizing and SOC monitoring is required.
Therefore, it is necessary to use a backup energy source to operate the battery pack in charge-sustained mode (
PESS(AV) ≅ 0) with a reduced level of the ESS power exchanged with DC bus [
20]. If a clean solution is desired, then the fuel cell (FC) system can be used [
21].
In this study, a proton-exchange membrane fuel cell (PEMFC) and an electrolyzer was used. The electrolyzer must be supplied with excess power (
PRES −
Pload) > 0, when the FC system does not have to generate power (being switched off or operating in standby mode) [
22]. If
PRES < Pload and
PESS(AV) ≅ 0, then the FC system must generate the power requested to compensate for the DC power flow balance (
PDCreq =
Pload −
PRES > 0). Power
PDCreq is generated via a DC-DC boost converter (with efficiency
ηBoost). Thus, FC net power must be
PFCnet =
PDCreq/
ηBoost under the PTC that generates the switching (SW) command.
The oxygen and hydrogen flow rates (
AirFr and
FuelFr) of the PEMFC system is controlled with air and fuel regulators having as references
and
[
23]:
where
are default parameters explained in [
24].
For a given FC net power under PTC reference (
), the fuel consumption can be minimized by using an optimal fueling strategy to set in real-time the references
and
[
25].
The aforementioned references (, and ) are outputs of the energy management unit that contains the PTC, the optimal fueling strategy, and the real-time optimization algorithm. The design of the energy management unit will be detailed in the next sections.
2.1. Control of the Fuel Cell Power Based on the Required Power Tracking Algorithm
The PTC has been designed based on the DC power flow balance as follows:
where
is the power generated by the FC system via DC-DC boost converter,
is FC net power,
is RES power,
is ESS power and
is load power.
DC voltage
is regulated to
VDCref = 200 V by controlling the power exchanged by a 50 F ultracapacitors (UC) stack with DC bus via a bidirectional DC-DC converter and filtered by a 0.01 F capacitor (
). Therefore, a semi-active ESS topology was designed [
20,
21] and implemented here using a 100 Ah lithium-ion battery pack and a 50 F UC stack (see bottom of
Figure 1).
So, on average value (AV):
However, due to implementation of the optimal fueling strategy, the FC net power may differ a bit to the value resulting from (4), being approximate to that value:
So, the FC current reference (
) obtained from the PTC will be given by (8):
The optimal fueling strategy is selected using the strategy-setting block (see the energy management unit presented in the middle of
Figure 1). Note that for all strategies, the boost controller has FC current (
IFC) as one input and the second input (
Iref(Boost)) is set to PTC reference (
). Thus, using, for example, a boost controller with 0.1 A hysteresis, the FC current will track the PTC reference.
The battery pack and ultracapacitors stack will compensate for the energy and power imbalances in DC power flow balance (3) due to the implementation of the optimization strategy and slow power response of the FC system (using 100 ms time constant and 100 A/s slope limiters in the fueling regulators).
The references
and
were specifically established for each fueling strategy analyzed in this study (see the strategy-setting block presented in the middle of
Figure 1), as will be presented in the next section.
2.2. Fueling Strategies
In order to compare the performance of the fueling strategies analyzed in this study, a well-known control strategy, applied in many commercial applications and known in the literature as the static feed-forward (sFF) control [
26], will be used as a reference.
In sFF strategy, the fueling regulators are both controlled by FC current, so the references
and
are set as follows:
Optimizing the operation of the FC system referred in this study to the minimization of total fuel consumption (
) using an optimization function given by (10):
where
x is the vector of FC state variables [
26],
Fueleff ≅
PFCnet/
FuelFr is the fuel consumption efficiency and
kfuel = 25 (Lpm/W) to minimize the fuel consumption. This value of the
kfuel parameter has been obtained by sensitivity analysis performed in the range 0–50 (Lpm/W) for the optimization function given by (10) [
23,
25].
The global extremum seeking (GES) [
27] was selected as the search algorithm of the maximum for function
f in conditions of load disturbances and variations of renewable energy. The search variables were
v1 =
AirFr and
v2 =
FuelFr and the GES model (which is shown in the bottom of
Figure 1) will be detailed in the next section.
For the fueling strategies analyzed in this study, the references and generated by GES controllers were specifically established to the references and as follows.
For the strategy using optimization through GES-based control of the fuel regulator (labelled below as Fuel-1GES strategy), the settings were:
For the strategy using optimization through GES-based control of the air regulator (labelled below as Air-1GES strategy), the settings were:
For the strategy using optimization through GES-based control of both air and fuel regulators (labelled below as Air/Fuel-2GES strategy), the settings were:
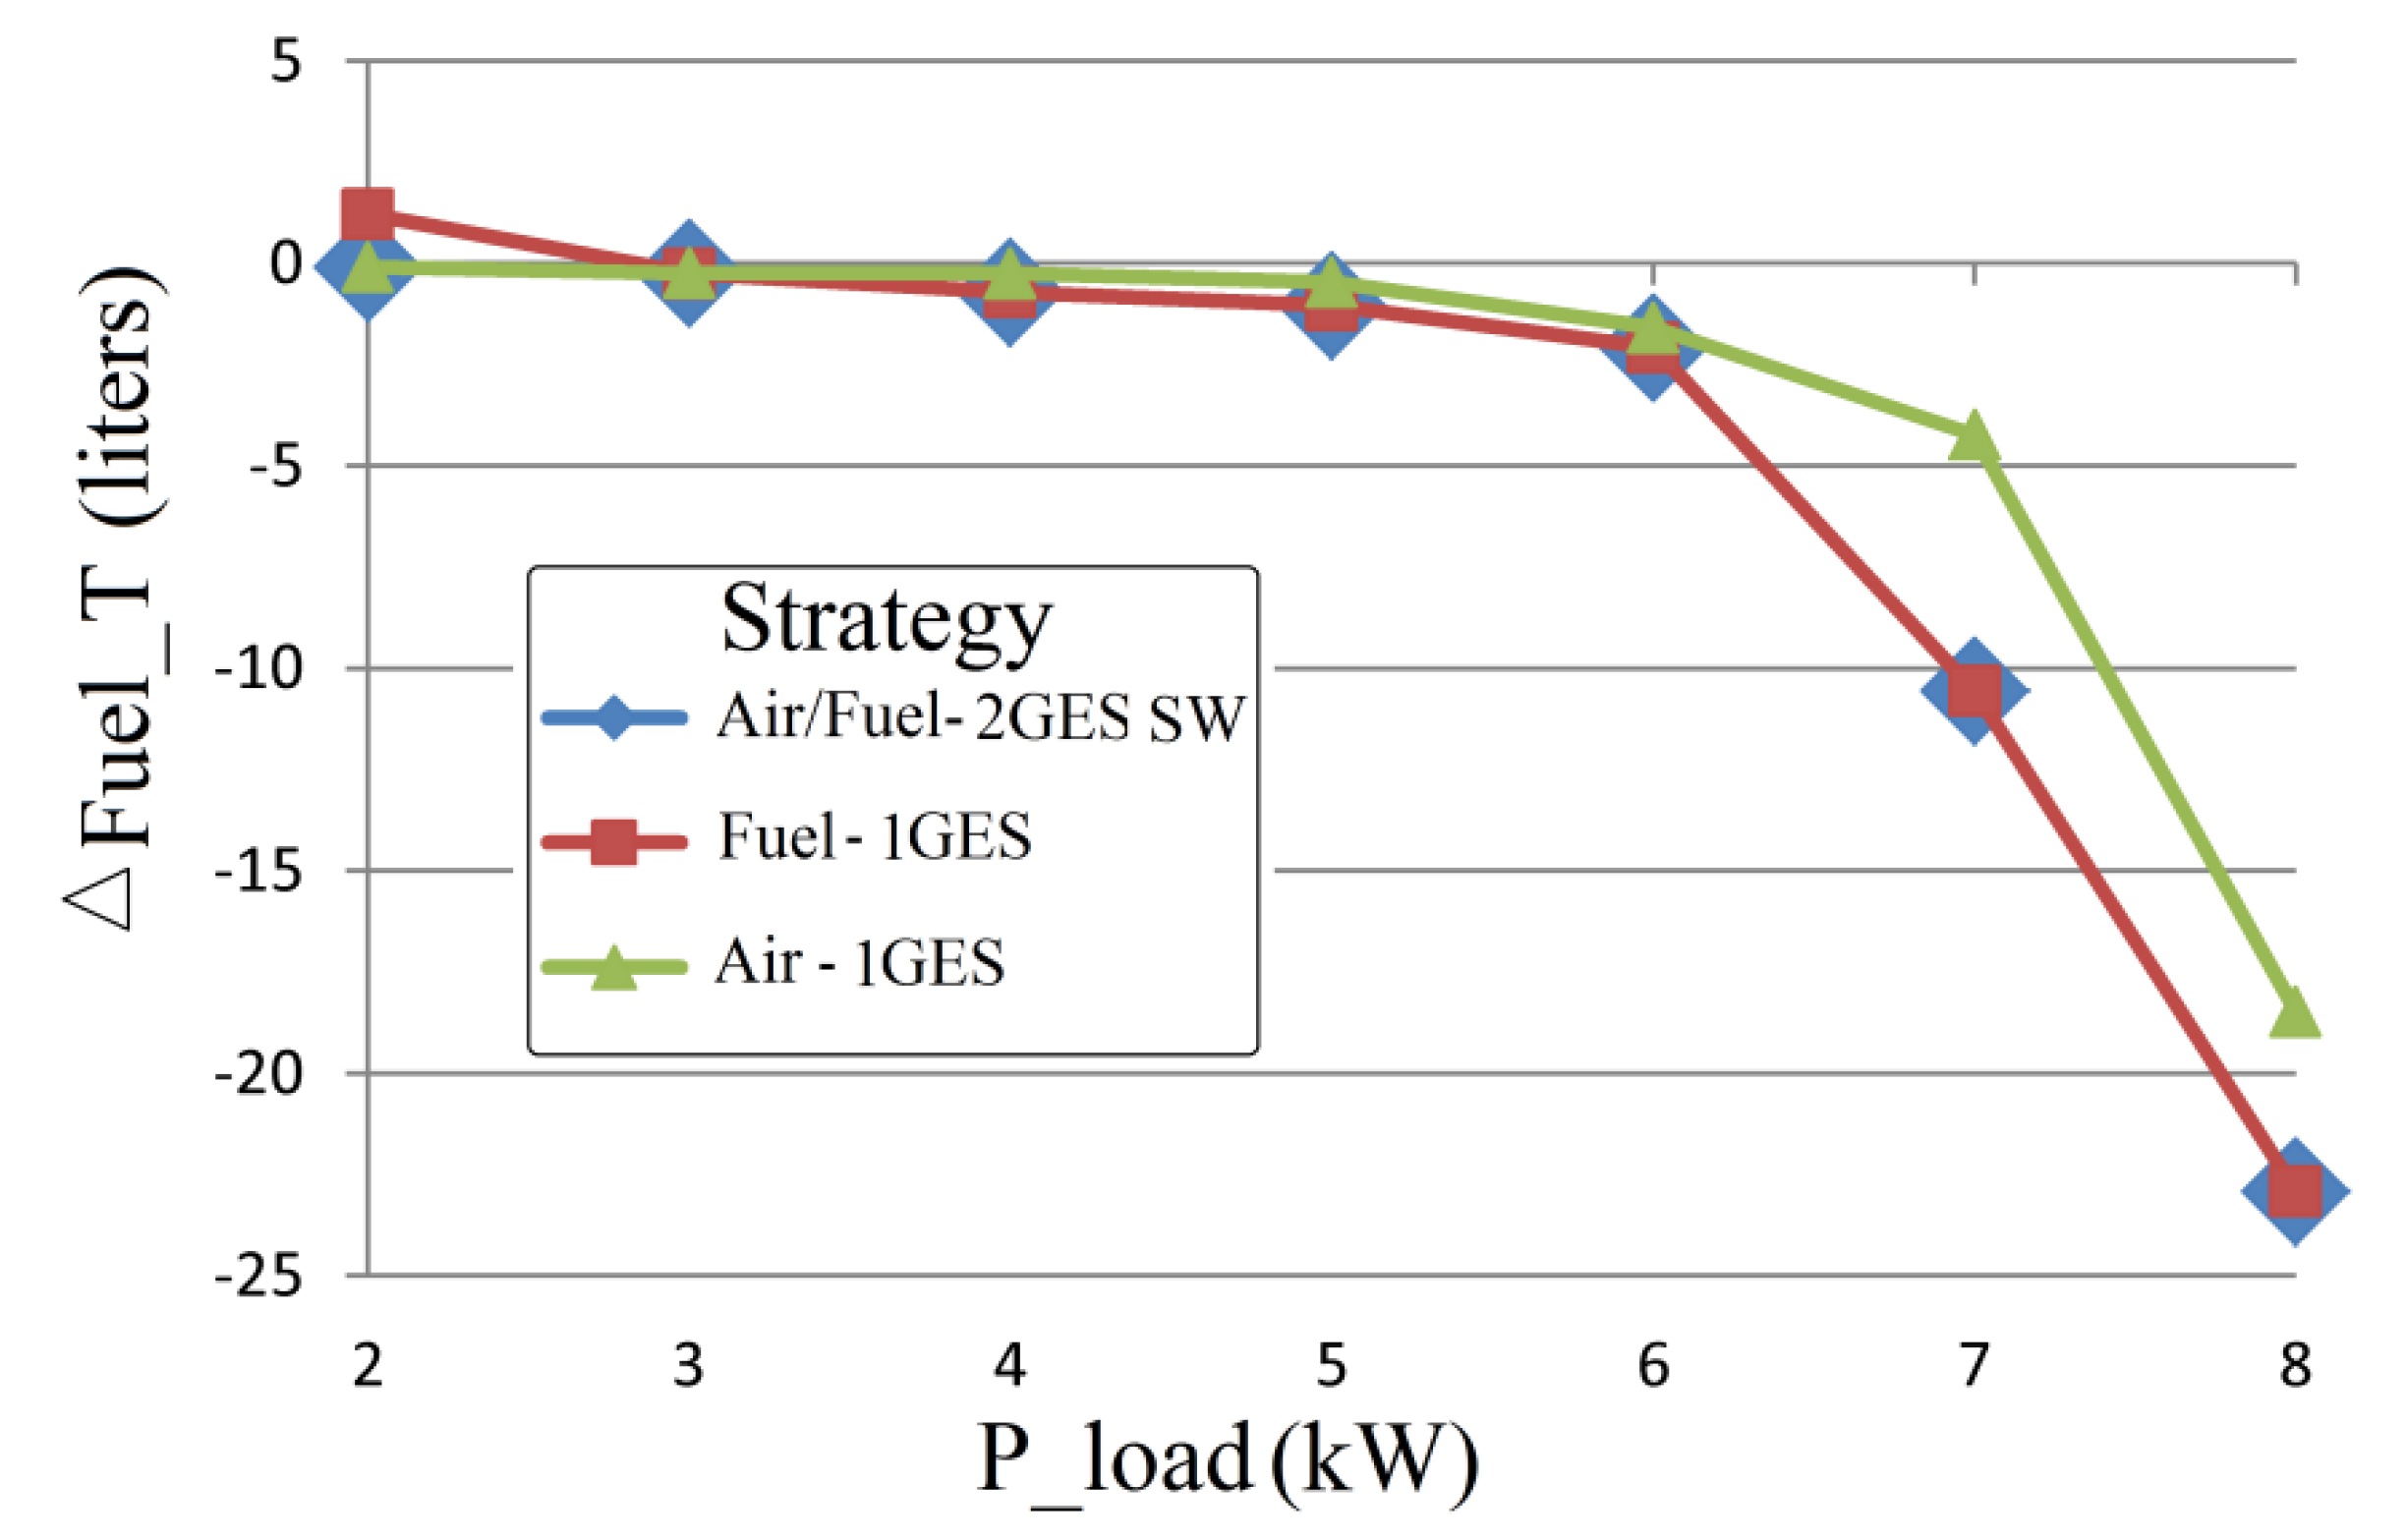
A new strategy was proposed using optimization through GES-based control switched to the fuel and air (labelled below as Air/Fuel-2GES SW strategy). A power threshold to maximize the fuel economy was used, so the settings are given by (14):
Air/Fuel-2GES SW strategy uses the best fuel saving strategy between Fuel-1GES and Air-1GES strategies on power ranges defined by the threshold
Pref (see
Figure 5). Therefore, an increase in fuel economy is expected (see the results section), but two GES controllers are used instead of one as used in Fuel-1GES strategy or Air-1GES SW strategy.
The additional use of an optimization controller will increase the complexity of the strategy somewhat, even if the optimization controller based on the GES scheme is not difficult to implement [
28,
29] (see next section).
2.3. GES-Based Optimization Controller
The GES-based optimization controller is presented at the bottom of
Figure 1. Signals are processed based on the operational relationships (15) [
30]:
The step in signals processing and used parameter are follows [
30]:
- -
Normalization of FC power (y = ) is performed using kNy = 1/1000;
- -
Approximation the first harmonic () is performed with a band-pass filter having the cut-off frequencies and , where and .
- -
Two sinusoidal dithers, and are used (with fd1 = 50 Hz and fd2 = 100 Hz, where ) to perform demodulation ();
- -
Signal is integrated to obtain the search gradient ();
- -
The tracking signal () and the location signal () are tuned using k1 = 1 and k2 = 2;
- -
Normalization of the search signal () is performed using kNp = 20.
The values of the normalization gains
kNy and
kNp were chosen in correlation with the range of the FC power, respectively the search range for the references
and
generated by GES controllers [
30], which established the references
and
as mentioned above. It is worth mentioning the 99.9% tracking accuracy and very low power ripple obtained in stationary regimes [
31]. The efficient and safe operation of the FC system using the strategies mentioned above were evaluated in stationary and dynamic regimes, considering the fuel economy and the oxygen excess ratio as an indicator of performance and health respectively [
32].
The initial simulation conditions are as follows: the initial battery SOC of 80%, the initial voltage on the ultracapacitors stack and DC capacitor of 100 V (VUC (0) = 100 V) and 200 V (VC_DC (0) = 200 V), and initial FC current of 0 A (IFC (0) = 0 A) in order to highlight the initial transitory regime. Different values were considered for the initial values mentioned above. A value of the FC current close to the FC current reference () given by (8) reduced the initial transitory regime.
2.4. Oxygen Excess Ratio
The oxygen excess ratio (
OER) was evaluated using (16) [
33]:
where:
,
,
,
,
, and
.
The obtained results in stationary and dynamic regimes will be presented in the next sections.
3. Results
3.1. Performance of Strategies Fuel-1GES, Air-1GES and Air/Fuel-2GES SW
The performance of strategies Fuel-1GES, Air-1GES, and Air/Fuel-2GES SW were analyzed for different levels of load by total fuel consumption during 20 s (see
Table 1). The
Pref threshold for best fuel economy should be chosen around 3 kW (see
Figure 6). The values in the last column are summarized for
Pref = 3.2 kW.
Thus, an increase in fuel economy is expected during dynamic load cycles with levels in the range of zero power to maximum power.
The performance of the strategies mentioned above were evaluated using the load cycle shown in
Figure 2. The expected increase in fuel economy will be highlighted in the next section.
3.2. Fuel Consumption for FC HPS (with kRES = 0)
Fuel consumption during the load cycle of 20 s shown in
Figure 2 is reported in the first row of
Table 2 for strategies sFF, Fuel-1GES, Air-1GES, Air/Fuel-2GES SW, and Air/Fuel-2GES. The fuel economy compared to sFF strategy is presented in the second row of
Table 2 using (17).
The last row of
Table 2 presents the percentages of fuel economy compared to
, evaluated by using (18):
As was expected, the fuel economy increased for all strategies compared to sFF strategy and for Air/Fuel-2GES SW strategy compared to the strategies Fuel-1GES and Air-1GES.
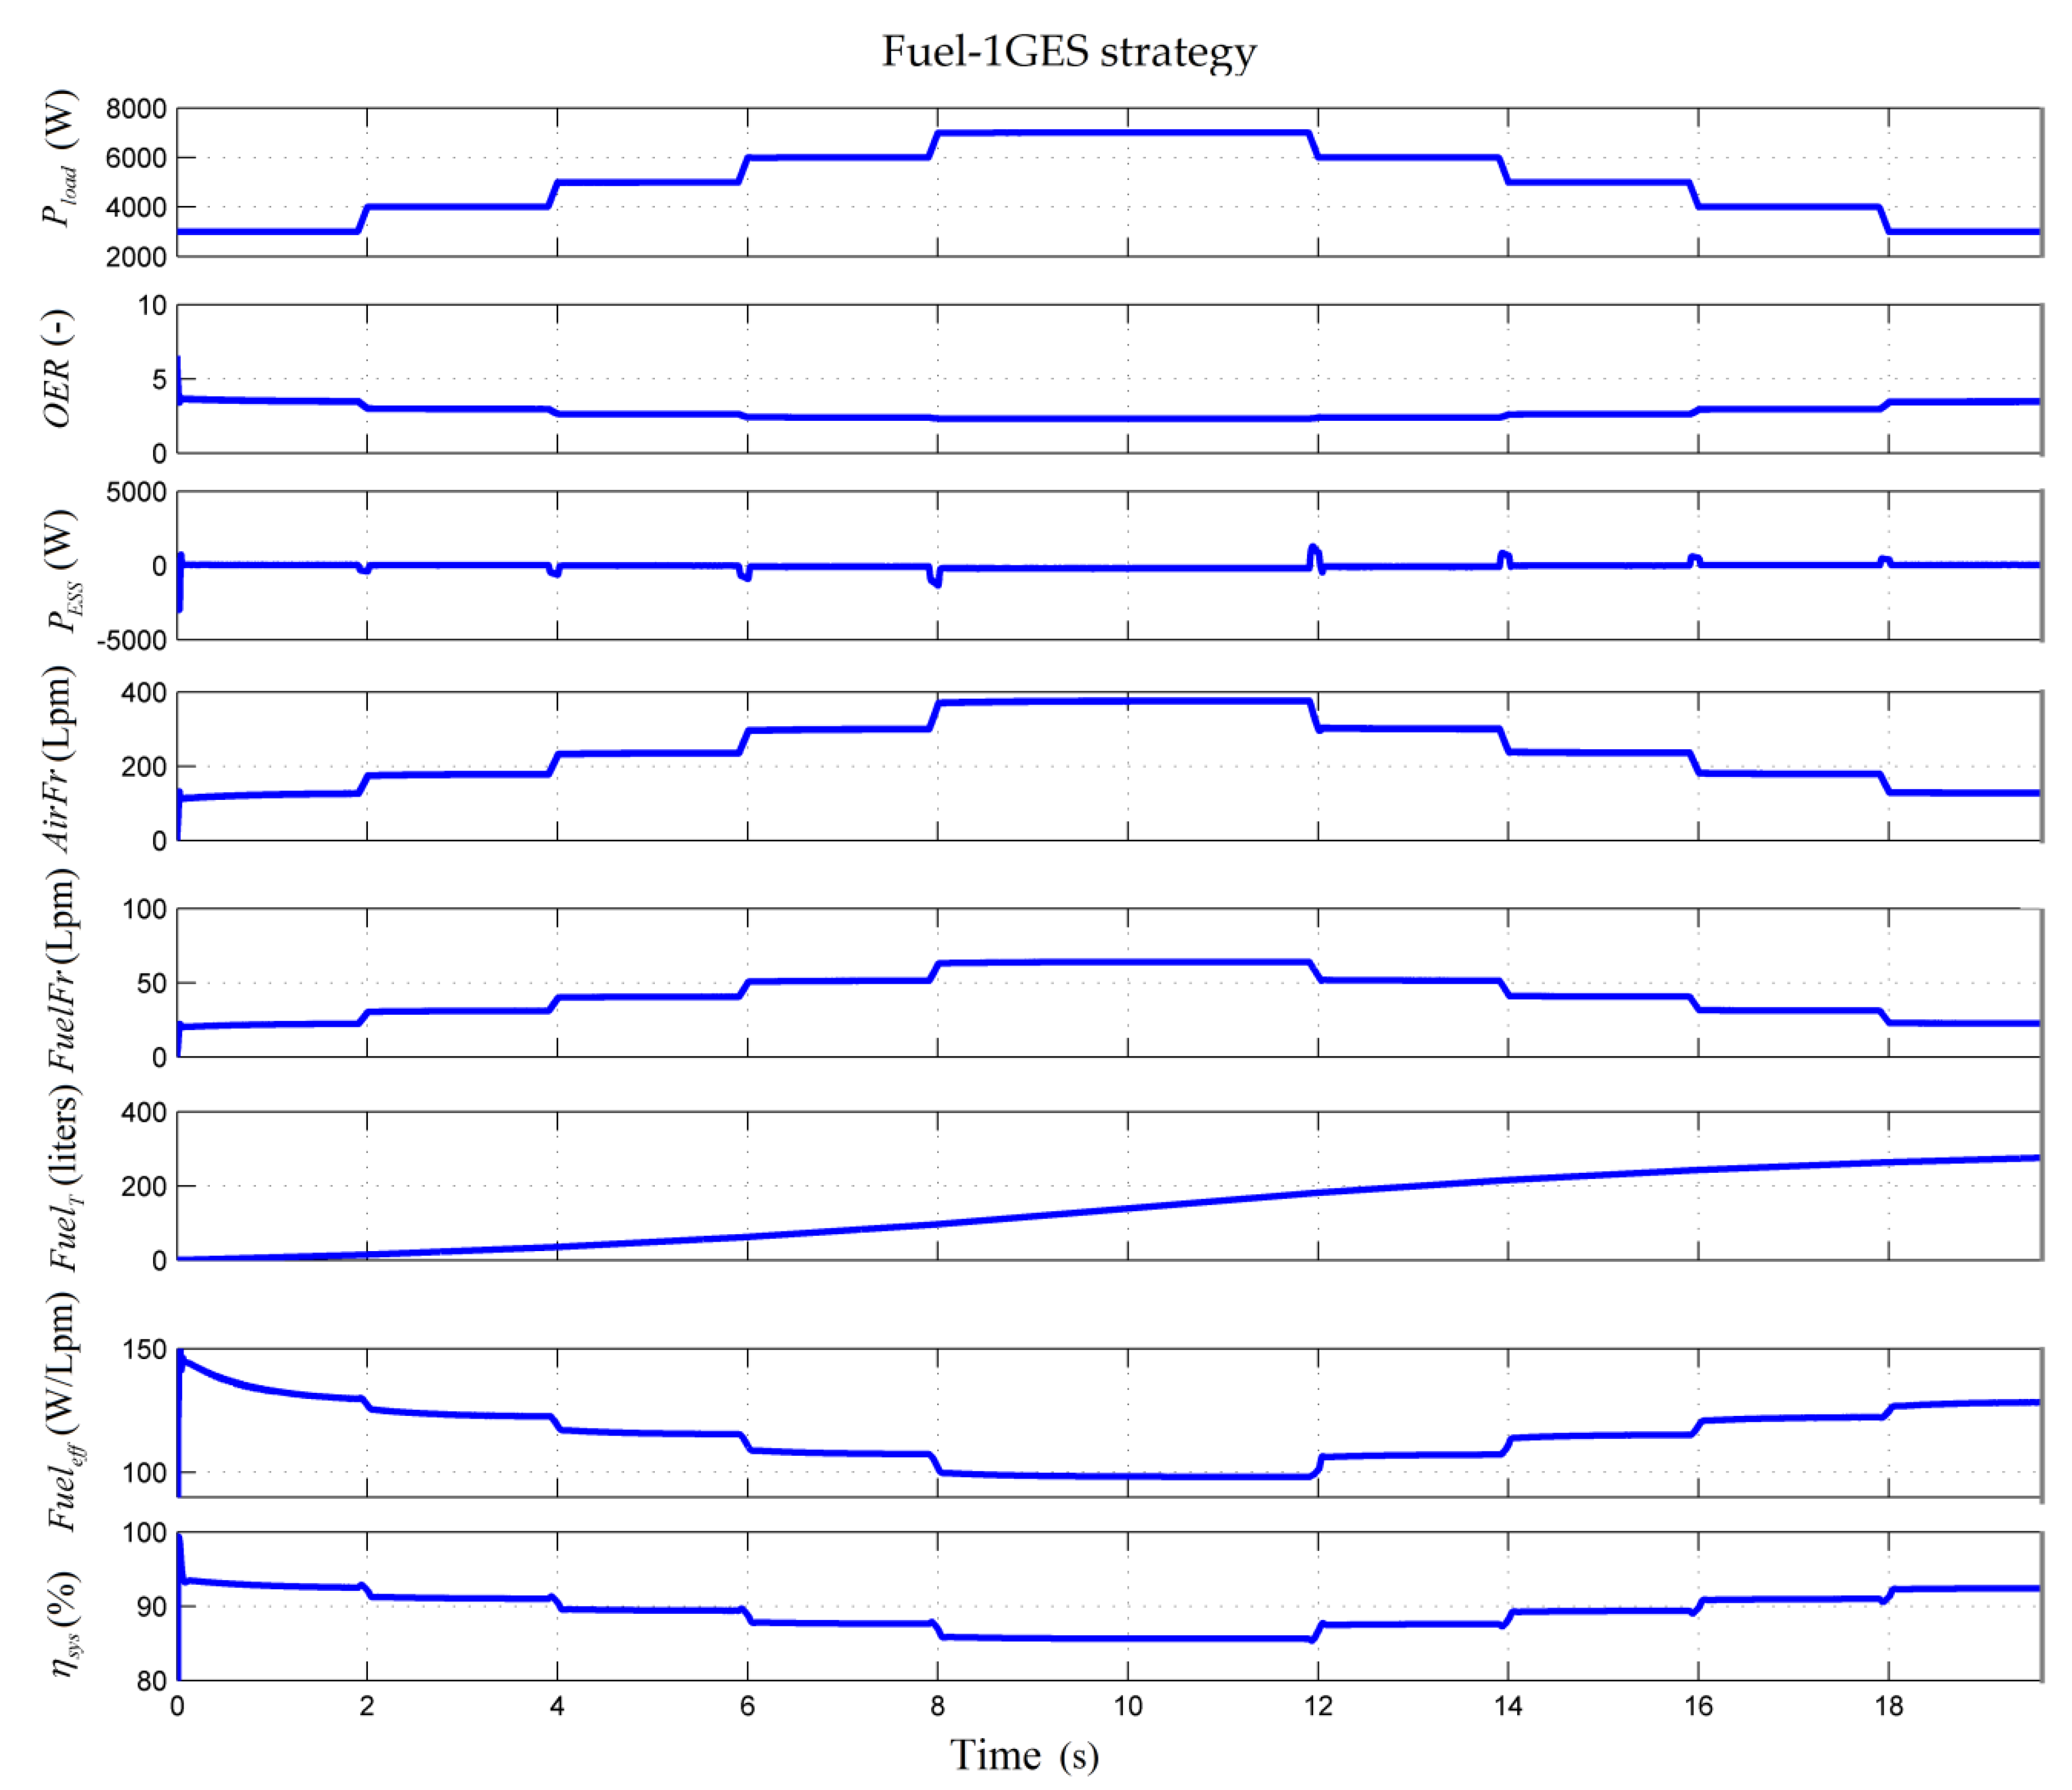
To highlight other aspects of the analyzed strategies (such as battery operation in charge-sustained mode or values of other performance indicators) and then discuss them comparatively in the discussion section, the behavior of the FC RES HPS using
kRES = 0 and strategies sFF, Fuel-1GES, Air-1GES, and Air/Fuel-2GES is presented in
Figure 7,
Figure 8,
Figure 9 and
Figure 10 respectively. The graphs show the load power profile (
Pload), oxygen excess ratio (OER), ESS power (
PESS), airflow rate (
AirFr), fuel flow rate (
FuelFr), total fuel consumption (
FuelT), fuel efficiency (
Fueleff), and electrical energy efficiency of FC system (
ηsys ≅
PFCnet/PFC).
The behavior of Air/Fuel-2GES SW strategy is not presented because its operation is based on the switching of strategies Fuel-1GES and Air-1GES depending on the chosen threshold Pref, so the waveforms would evolve in the same logic.
OER varied within the admissible limits for all the analyzed strategies, highlighting a safe operation for the FC system. OER variation will be detailed in
Section 3.4 for FC RES HPS with
kRES = 0 and
kRES = 1.
ESS power was almost zero during constant load levels (stationary regimes), except for transient regimes when the power balance was dynamically compensated by ESS, highlighting a battery operation in the charge-sustained mode for all the analyzed strategies.
Fueling flow rates (AirFr and FuelFr) were set by FC current in sFF strategy, so both followed the PTC reference (). AirFr and FuelFr were set by FC current in the strategies Fuel-1GES and Air-1GES respectively. So, compared to sFF strategy, minor changes were seen in FuelFr and AirFr which were used in optimization by the strategies Fuel-1GES and Air-1GES respectively. Air/Fuel-2GES strategy used both fueling flow rates in optimization, so minor changes were seen in both fueling flow rates compared to sFF strategy.
The values of total fuel consumption have been provided in the first row of
Table 2 and
Table 3 for each analyzed strategy and the load cycle of 20 s shown in
Figure 2.
Two important indicators for evaluating the performance of a strategy are fuel efficiency (
Fueleff) and electrical energy efficiency of the FC system (
ηsys ≅
PFCnet/PFC). An exhaustive analysis (for
kfuel = 0, 25, and 50 (Lpm/W) of these performance indicators for seven strategies proposed in the literature (including strategies Fuel-1GES, Air-1GES, and Air/Fuel-2GES) is presented in [
34] compared to the sFF strategy. Here
ηsys variation is presented to highlight the similar values obtained for FC net power.
FC power variation will be detailed in
Section 3.4 for FC RES HPS with
kRES = 0 and
kRES = 1. The next section will present the results for FC RES HPS with power support in maintaining to DC power balance from RES, i.e., for
kRES = 1.
3.3. Fuel Consumption for FC RES HPS with kRES = 1
Fuel consumption, the fuel economy, and the percentages of fuel economy compared to the sFF strategy during the 20 s load cycle and RES power profile shown in
Figure 2 and
Figure 3a are given in
Table 3 for strategies sFF, Fuel-1GES, Air-1GES, Air/Fuel-2GES SW, and Air/Fuel-2GES. The fuel economy and the percentages of fuel economy were evaluated using (19) and (20).
As was expected, fuel consumption decreased due to the contribution of the RES power on DC bus (see the first row of
Table 2 and
Table 3). Note also that the fuel economy increased for the Air/Fuel-2GES SW strategy compared to the strategies Fuel-1GES and Air-1GES (see the second row of
Table 2 and
Table 3). It is also worth mentioning that here the fuel economy was better for the Air-1GES strategy compared to the Fuel-1GES strategy (because the FC power requested was lower due to the contribution of the RES power on DC bus). This also explains better fuel economy for the Air/Fuel-2GES SW strategy compared to the Air/Fuel-2GES strategy (see the second row of
Table 2 and
Table 3).
To compare HPS operation with and without RES power support to DC power balance, the same strategies were used. So, the behavior of the FC RES HPS using
kRES = 1 and strategies sFF, Fuel-1GES, Air-1GES, and Air/Fuel-2GES is presented in
Figure 11,
Figure 12,
Figure 13 and
Figure 14 respectively. The structure of the graphs is identical to the one mentioned above for
Figure 7,
Figure 8,
Figure 9 and
Figure 10, except for the inclusion of RES power as in the second graph in
Figure 11,
Figure 12,
Figure 13 and
Figure 14.
The values of total fuel consumption presented in the seventh graph have been registered in see the first row of
Table 3 for each analyzed strategy.
The following observations can be made for the FC RES HPS using kRES = 1:
- •
ESS power was also almost zero for all strategies, except that it was noisy due to the noise added on RES power, highlighting the battery operation in the charge-sustained mode for FC RES HPS with kRES = 1 as well.
- •
Fueling flow rates (AirFr and FuelFr) would have evolution as was explained for FC RES HPS with kRES = 0, except that for FC RES HPS with kRES = 1 the PTC reference and FC currentfollowed the shape of power requested on DC bus,
- •
It is worth mentioning the low values of the performance indicators (
Fueleff and
ηsys ≅
PFCnet/PFC) during the operation of the FC system at low power. This mode of operation should be avoided by shutting down the FC system, but shutting down and starting of the FC system are complex processes [
35]. An appropriate strategy must therefore be implemented in case the FC system operates for a long time at low power. However, these aspects are not in the objectives of this paper.
- •
OER varied within the admissible limits for all the analyzed strategies, highlighting a safe operation for FC RES HPS using kRES = 1.
So, as it was mentioned, OER variation will be presented and commented on in the next section for FC RES HPS with kRES = 0 and kRES = 1.
3.4. Oxygen Excess Ratio for FC RES HPS with kRES = 0 and kRES = 1
The oxygen excess ratio of FC RES HPS with
kRES = 0 is presented in
Figure 15 for all strategies. OER varied within the limits of 2.2 and 3.6, which demonstrates the safe operation of HPS without RESs (
kRES = 0).
Oxygen excess ratio of FC RES HPS with RESs (
kRES = 1) is presented in
Figure 16,
Figure 17,
Figure 18 and
Figure 19 using the strategies sFF, Fuel-1GES, Air-1GES, and Air/Fuel-2GES respectively. OER variations were represented in different Figures to highlight small variations from one strategy to another (as is the case with ESS power for example). OER varied approximately in the range from 2.3 to 7, so within the allowed limits of safe operation of the FC system.
The same situation (with some minor differences between the representations obtained using the strategies analyzed in this study) applied in the case of FC net power (see next section).
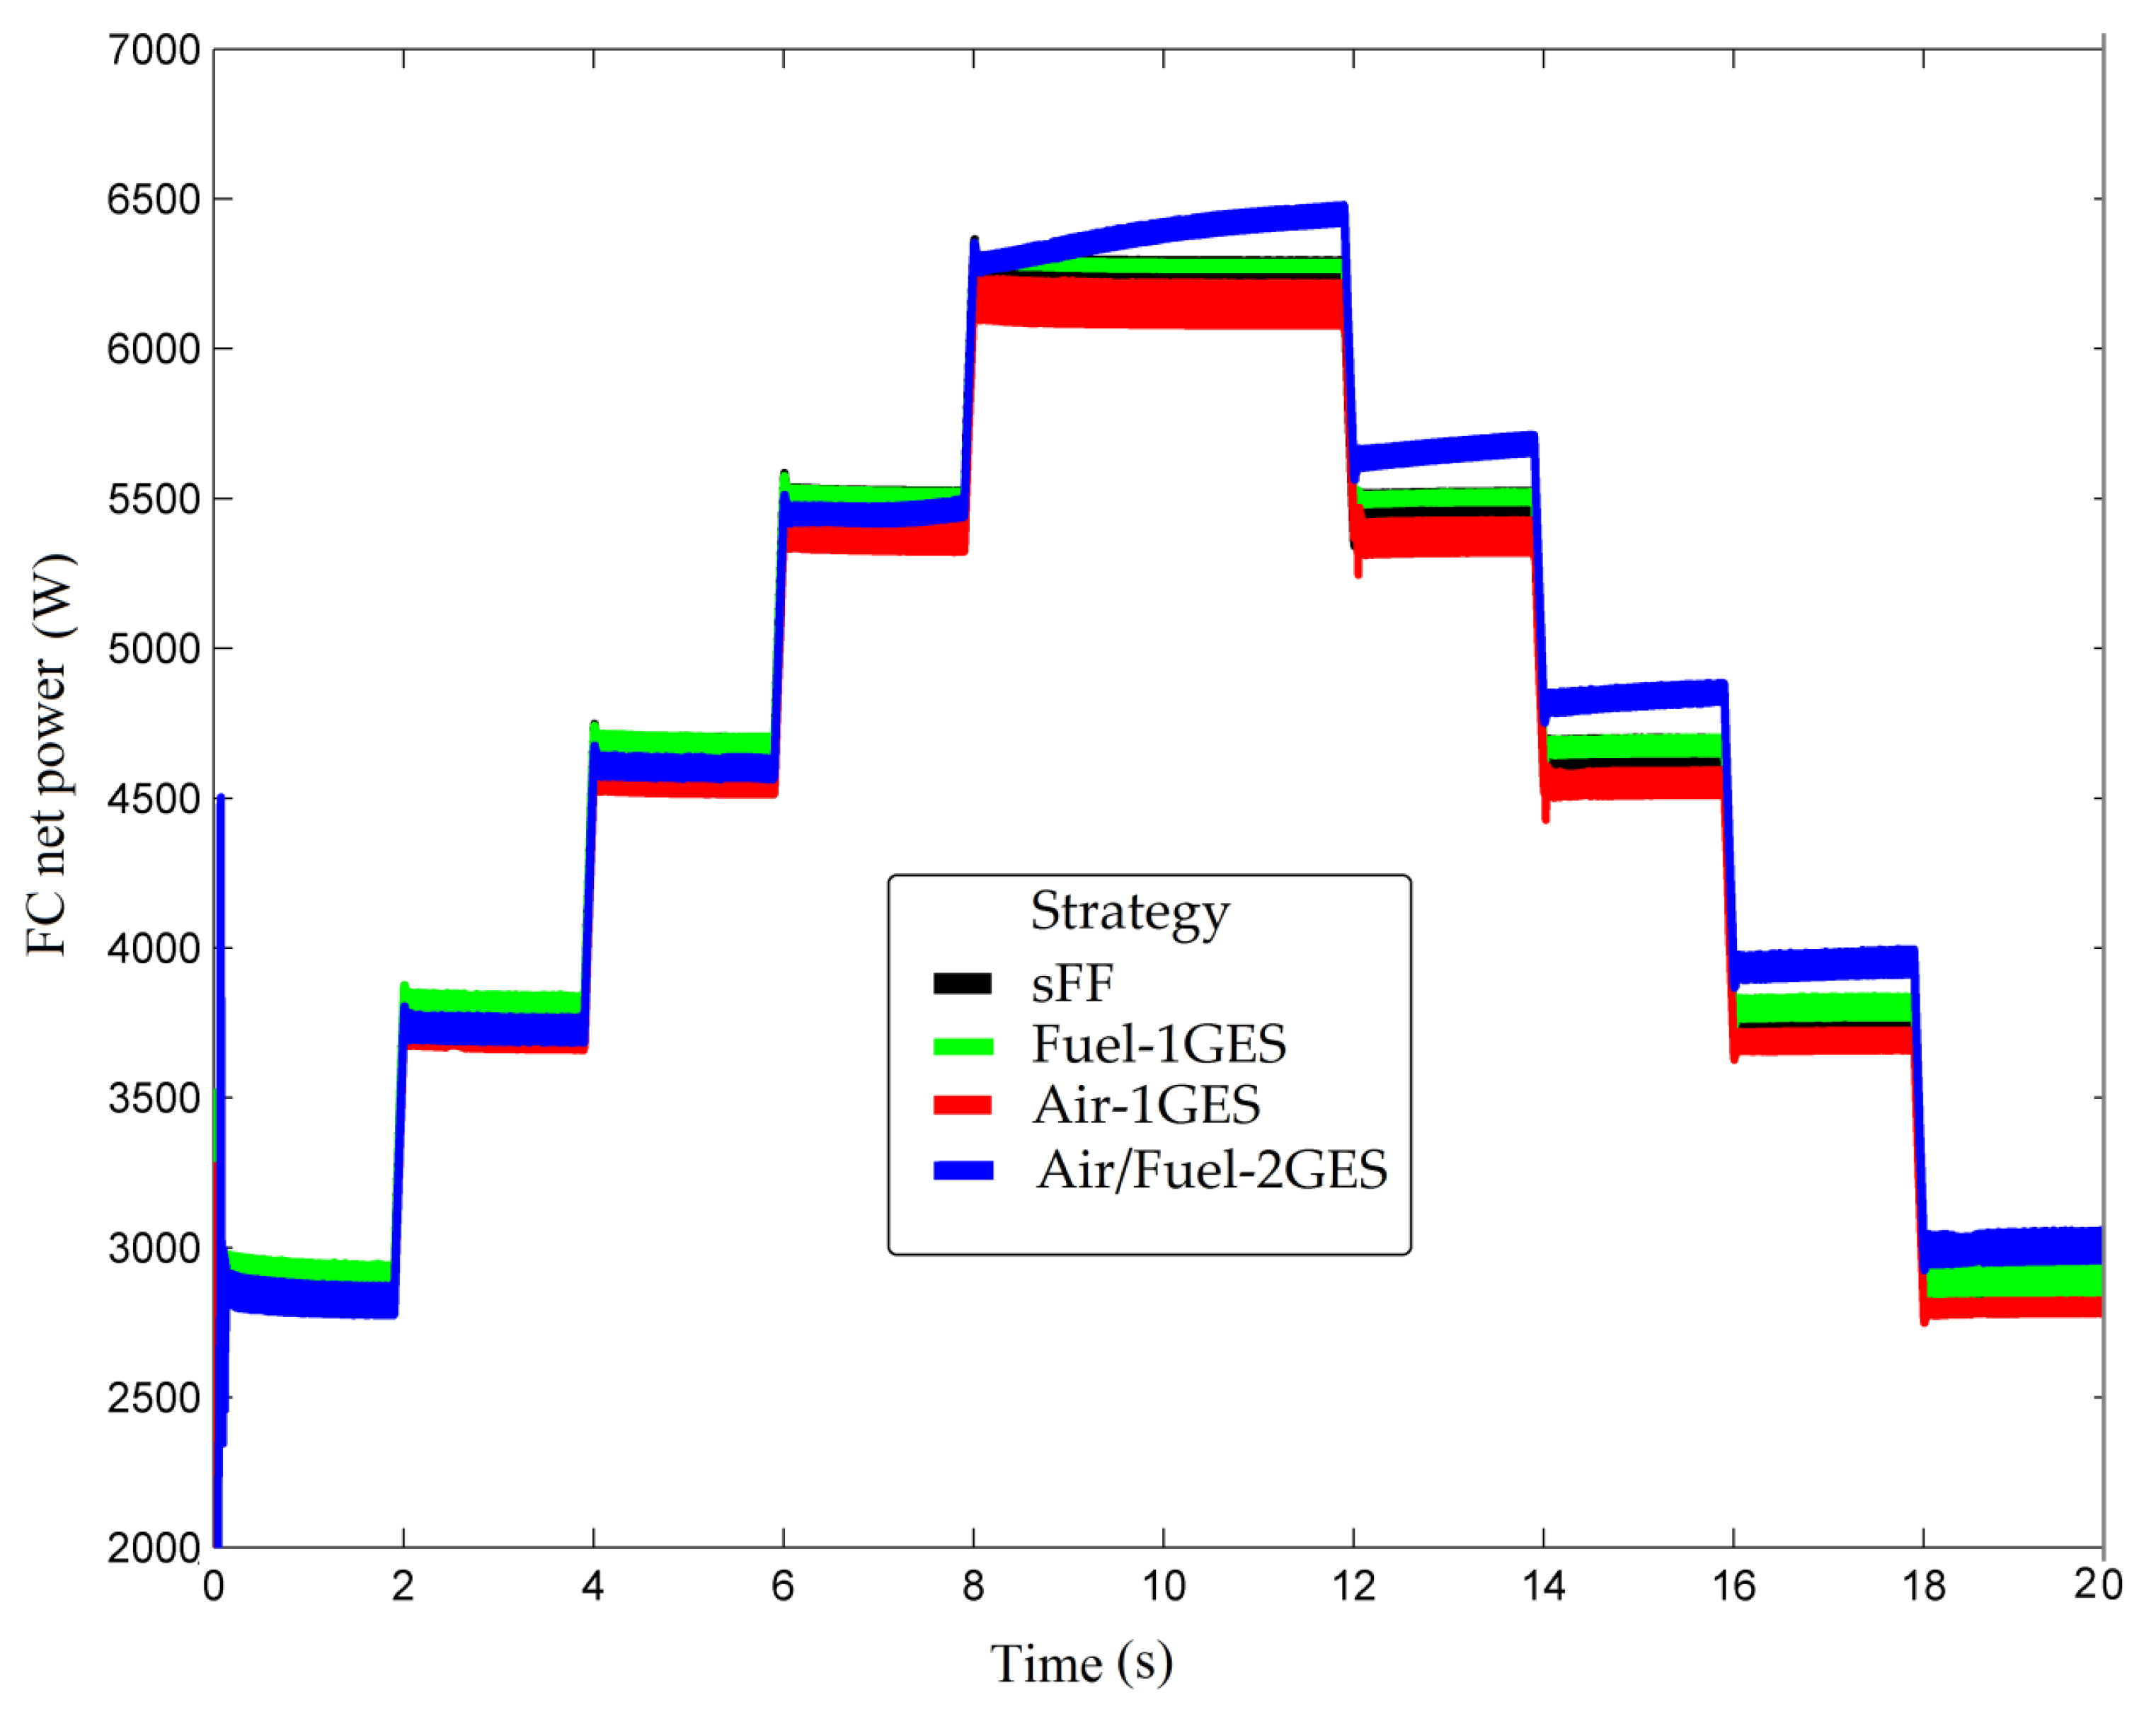
3.5. FC Net Power Requested from FC RES HPS with kRES = 0 and kRES = 1
FC net power requested to sustain the DC power flow balance of FC RES HPS with
kRES = 0 and
kRES = 1 are presented in
Figure 20 and
Figure 21 for all strategies analyzed in this study.
One issue that may be of interest in using these strategies, which are part of the class of strategies that use the same setting, is whether it can be identified based on the measurements made.
In addition to other discussions of the results obtained, the next section will show how to identify whether the strategy uses one or two GES controllers by simply processing the fuel consumption measurements for HPS with kRES = 0 and kRES = 1.
4. Discussion
The results obtained for HPS with
kRES = 0 and
kRES = 1 in
Section 3.1 and
Section 3.2 are summarized in
Table 4 and
Table 5, where other indicators have been calculated and discussed below.
Ratio was in range of 39.1 to 40.91 for the strategies analyzed in this study (Fuel-1GES, Air-1GES, Air/Fuel-2GES SW and Air/Fuel-2GES), highlighting the contribution of RESs to DC power flow balance compared to load demand (measured by the ratio between the average values of these powers).
If the dependency relationship is chosen linearly, then
. This is verified in two points, as follows:
Minor differences between the ratio’s values obtained with each strategy do not help to define some subclasses. However, the values obtained (close to 40), which was much higher than the value of 43.14 obtained in the case of sFF strategy, shows that all strategies use a similar technique to reduce fuel consumption.
Fuel economy for FC RES HPS with
kRES = 0 and
kRES = 1 is computed in
Table 5 as percent from fuel consumption using sFF strategy.
Ratio was in range of 2.78 to 3.28 for strategies analyzed in this study, highlighting the same thing as the ratio (the contribution of RESs to DC power flow balance compared to load demand). In this case, the linear dependence is given by .
Considering
, this relation is verified in two points, as follows:
However, the difference clearly shows that two subclasses can be defined: (1) the class of the strategies Fuel-1GES, Air-1GES (which use one GES controller) and (2) the class of the strategies Air/Fuel-2GES SW and Air/Fuel-2GES (which use two GES controllers). It is worth mentioning that the fuel economy was biggest when using Air/Fuel-2GES SW or Air/Fuel-2GES strategies because these use two GES controllers instead of one. This means a search with two variables in a larger search space.
Other findings of the study performed for HPS with
kRES = 0 and
kRES = 1 in
Section 3.1 and
Section 3.2 were the following:
- •
If the power to be generated by the FC system is small (mainly between 0 and Pref) and a single GES controller strategy is used, then the Air-1GES strategy is recommended. Otherwise, Fuel-1GES strategy is recommended;
- •
If the power to be generated by the FC system is higher (mainly between Pref and PFC(max)) and two GES controllers are used, then the Air/Fuel-2GES strategy is recommended. Otherwise, Air/Fuel-2GES SW strategy is recommended;
- •
The battery pack operates in charge-sustaining mode if PTC is used for a strategy applied to HPS under dynamic load cycle, without or without RES power; and
- •
Even if the differences in fuel economy are not major, the definition of specific indicators mentioned above can classify strategies into subclasses or estimate fuel consumption.
The main findings of the study performed for HPS with
kRES = 0 and
kRES = 1 in
Section 3.3 and
Section 3.4 were the following:
- •
The safe operation of HPS is ensured by each analyzed strategy, even in conditions of high load dynamic and large variations of renewable energy power;
- •
FC net power requested to sustain the DC power flow balance of FC RES HPS under dynamic load cycle and variation of RES power is almost the same due to the optimal value found by each strategy in the search region, which is limited around the current value of the current FC; so these optimal values are close to each other.
This problem of recognizing subclasses of performance from the same class of optimization strategies can also arise for FC HPS (i.e., FC vehicles) by considering two different load cycles and evaluating the performance indicator .
Furthermore, taking into account different load cycles, the validity of linear relationships such as those introduced below will be verified for other strategies proposed in the literature:
where
is the fuel consumed during the load cycle,
is computed using a reference strategy, and parameters
ai, i = 1–4, are specifically determined for each strategy.
Evaluating these ratios would allow a rough estimate of fuel consumption over a predicted load cycle up to the first refueling station based on the fuel consumption on a standard load cycle or during the previous load cycle. Thus, the warning system would signal when it is necessary to refuel from nearby stations.
5. Conclusions
In this study, four fuel economy strategies that use fuel cell optimization through the control of the fueling regulators in the conditions and one reference strategy were analyzed in the conditions in which all strategies used power tracking control of the fuel cell boost converter.
The performance of a strategy (measured for example by the fuel consumption of the FC system) depended on the level of power required from the FC system during a load cycle. Thus, the energy management unit must have a subsystem for selecting the best strategy based on the current value of the load demand and RES power.
If the optimization strategy uses two GES controllers (extending the search for the optimal in two coordinates), then it is recommended to use the Air/Fuel-2GES SW strategy for 0 < PFC < Pref, and the Air/Fuel-2GES strategy for Pref < PFC < PFC(max). The percentages of fuel economy for strategies Air/Fuel-2GES SW and Air/Fuel-2GES compared to the reference strategy were of 3.94% and 4.36%, and of 12.94% and 12.46%, in the case of a dynamic load cycle with an average of 5 kW and 2.5 kW.
The next research work will focus on testing if the identified indicator () can recognize subclasses of performance from the same class of optimization strategies. For this, experimental validation to evaluate model accuracy will be performed using the general indicator (). The results presented in this paper highlight the fact that this approach has great chances of being confirmed.
The use of only ultracapacitors stacks instead of hybrid battery/ultracapacitors ESS will also be analyzed in terms of compensation and size performance for use in FC vehicles.


