A Review of Clean Electricity Policies—From Countries to Utilities
by
 , ,
, ,
Kaiqi Sun
1, 
Huangqing Xiao
1,*,
Shengyuan Liu
1,
Shutang You
1,
Fan Yang
2,
Yuqing Dong
1,
Weikang Wang
1 and
Yilu Liu
1,3 1
Department of Electrical Engineering and Computer Science, University of Tennessee, Knoxville, TN 37996, USA
2
Department of Digital Humanities,Faculty of Arts & Humanities, King’s College London, Strand, London WC2R 2LS, UK
3
Oak Ridge National Lab, Oak Ridge, TN 37830, USA
*
Author to whom correspondence should be addressed.
Sustainability 2020, 12(19), 7946; https://doi.org/10.3390/su12197946
Submission received: 9 September 2020
/
Revised: 18 September 2020
/
Accepted: 24 September 2020
/
Published: 25 September 2020
(This article belongs to the Collection Power System and Sustainability)
Abstract
:Due to the heavy stress on environmental deterioration and the excessive consumption of fossil resources, the transition of global energy from fossil fuel energy to clean energy has significantly accelerated in recent years. The power industry and policymakers in almost all countries are focusing on clean energy development. Thanks to progressive clean energy policies, significant progress in clean energy integration and greenhouse gas reduction has been achieved around the world. However, due to the differences in economic structures, clean energy distributions, and development models, clean energy policy scope, focus, and coverage vary between different countries, states, and utilities. This paper aims at providing a policy review for readers to easily obtain clean energy policy information on various clean energies in the U.S. and some other countries. Firstly, this paper reviews and compares some countries’ clean energy policies on electricity. Then, taking the U.S. as an example, this paper introduces the clean energy policies of some representative states and utilities in the U.S in perspectives of renewable energies, electric vehicles, and energy storage.
1. Introduction
In the recent decade, various types of clean energy witness continuously growing shares in the electricity generation mix [1,2]. With the increase in clean energy penetration and the retirement of conventional fossil fuel plants, clean energies are expected to provide almost 50% of total electricity globally by 2050 [3].
To realize the ambitious objective of the energy shifting from fossil fuels towards clean energy technologies, nearly all utilities and countries worldwide have formulated renewable energy development goals and supporting policies [4,5,6,7]. Due to the trend of using electricity as the major form of energy delivery, the electric grid has been the focus of clean energy policies in recent years. With the decrease in power equipment investment costs, these renewable energy policies are helping to increase clean energy penetration in electric grids. In the Nationally Determined Contributions (NDCs), which was submitted by 181 countries under the United Nations Framework Convention on Climate Change, approximately 3/4 of NDCs particularly pointed out that renewables can be used for mitigating climate change, and more than 50% of them have set up clean energy goals. Some countries and many more utilities have also set aggressive targets at 100% electricity from clean energy [8].
Due to the differences in economic structures, clean energy distributions, and development models, clean energy policy scope, focus, and coverage vary between different countries, states, and utilities. Some papers have reviewed the clean energy policies in some countries or compared specific types of clean energy [9,10,11,12,13]. The authors of [9] made a summary of the various solar power policies implemented in different countries around the world. The obstacles to clean energy development and the Indian government’s relevant policies to promote clean energy throughout India are introduced in [10]. The authors of [11] summarized clean energy development in Iran. Moreover, the deployment plan of clean energy generation and related technologies has been investigated. A summary of the solar power policies, which have been planned or taken effect in some developed countries and Malaysia, was introduced in [12]. The authors of [13] examined policy options for promoting a shift to clean electricity in Africa. However, most papers just focus on one country or one type of clean energy. A comprehensive review and comparison for different governments and on various clean energy-supporting measures are needed to understand global clean electricity policies.
This paper firstly introduces the clean energy policies on electricity of some countries who are positive on clean energy promotion. Due to the advanced market-driven mechanism of the U.S. power grid under operation, in the rest of the paper, taking the U.S. as an example, this paper presents the recent clean energy policies in representative states and utilities of the U.S. The objective of this paper is to provide a policy review for readers to easily obtain clean energy policy information on various clean energies in the U.S. and some other countries.
The rest of the paper is organized as follows. Section 2 introduces the clean energy policies of some representative countries worldwide. Then, taking the U.S. as an example, Section 3 introduces the clean energy targets and policies of progressive states in the U.S. The clean energy policies of some major utilities in the U.S are described in Section 4. The conclusion of this paper is given in Section 5.
2. The Clean Energy Policy of Countries
This section firstly introduces the clean energy policies of six countries around the world which have ambitious clean energy targets. Then, a comparison and an analysis of their clean energy policies in wind, solar, energy storage, and EV are provided at the end of the section.
2.1. United Kingdom (UK)
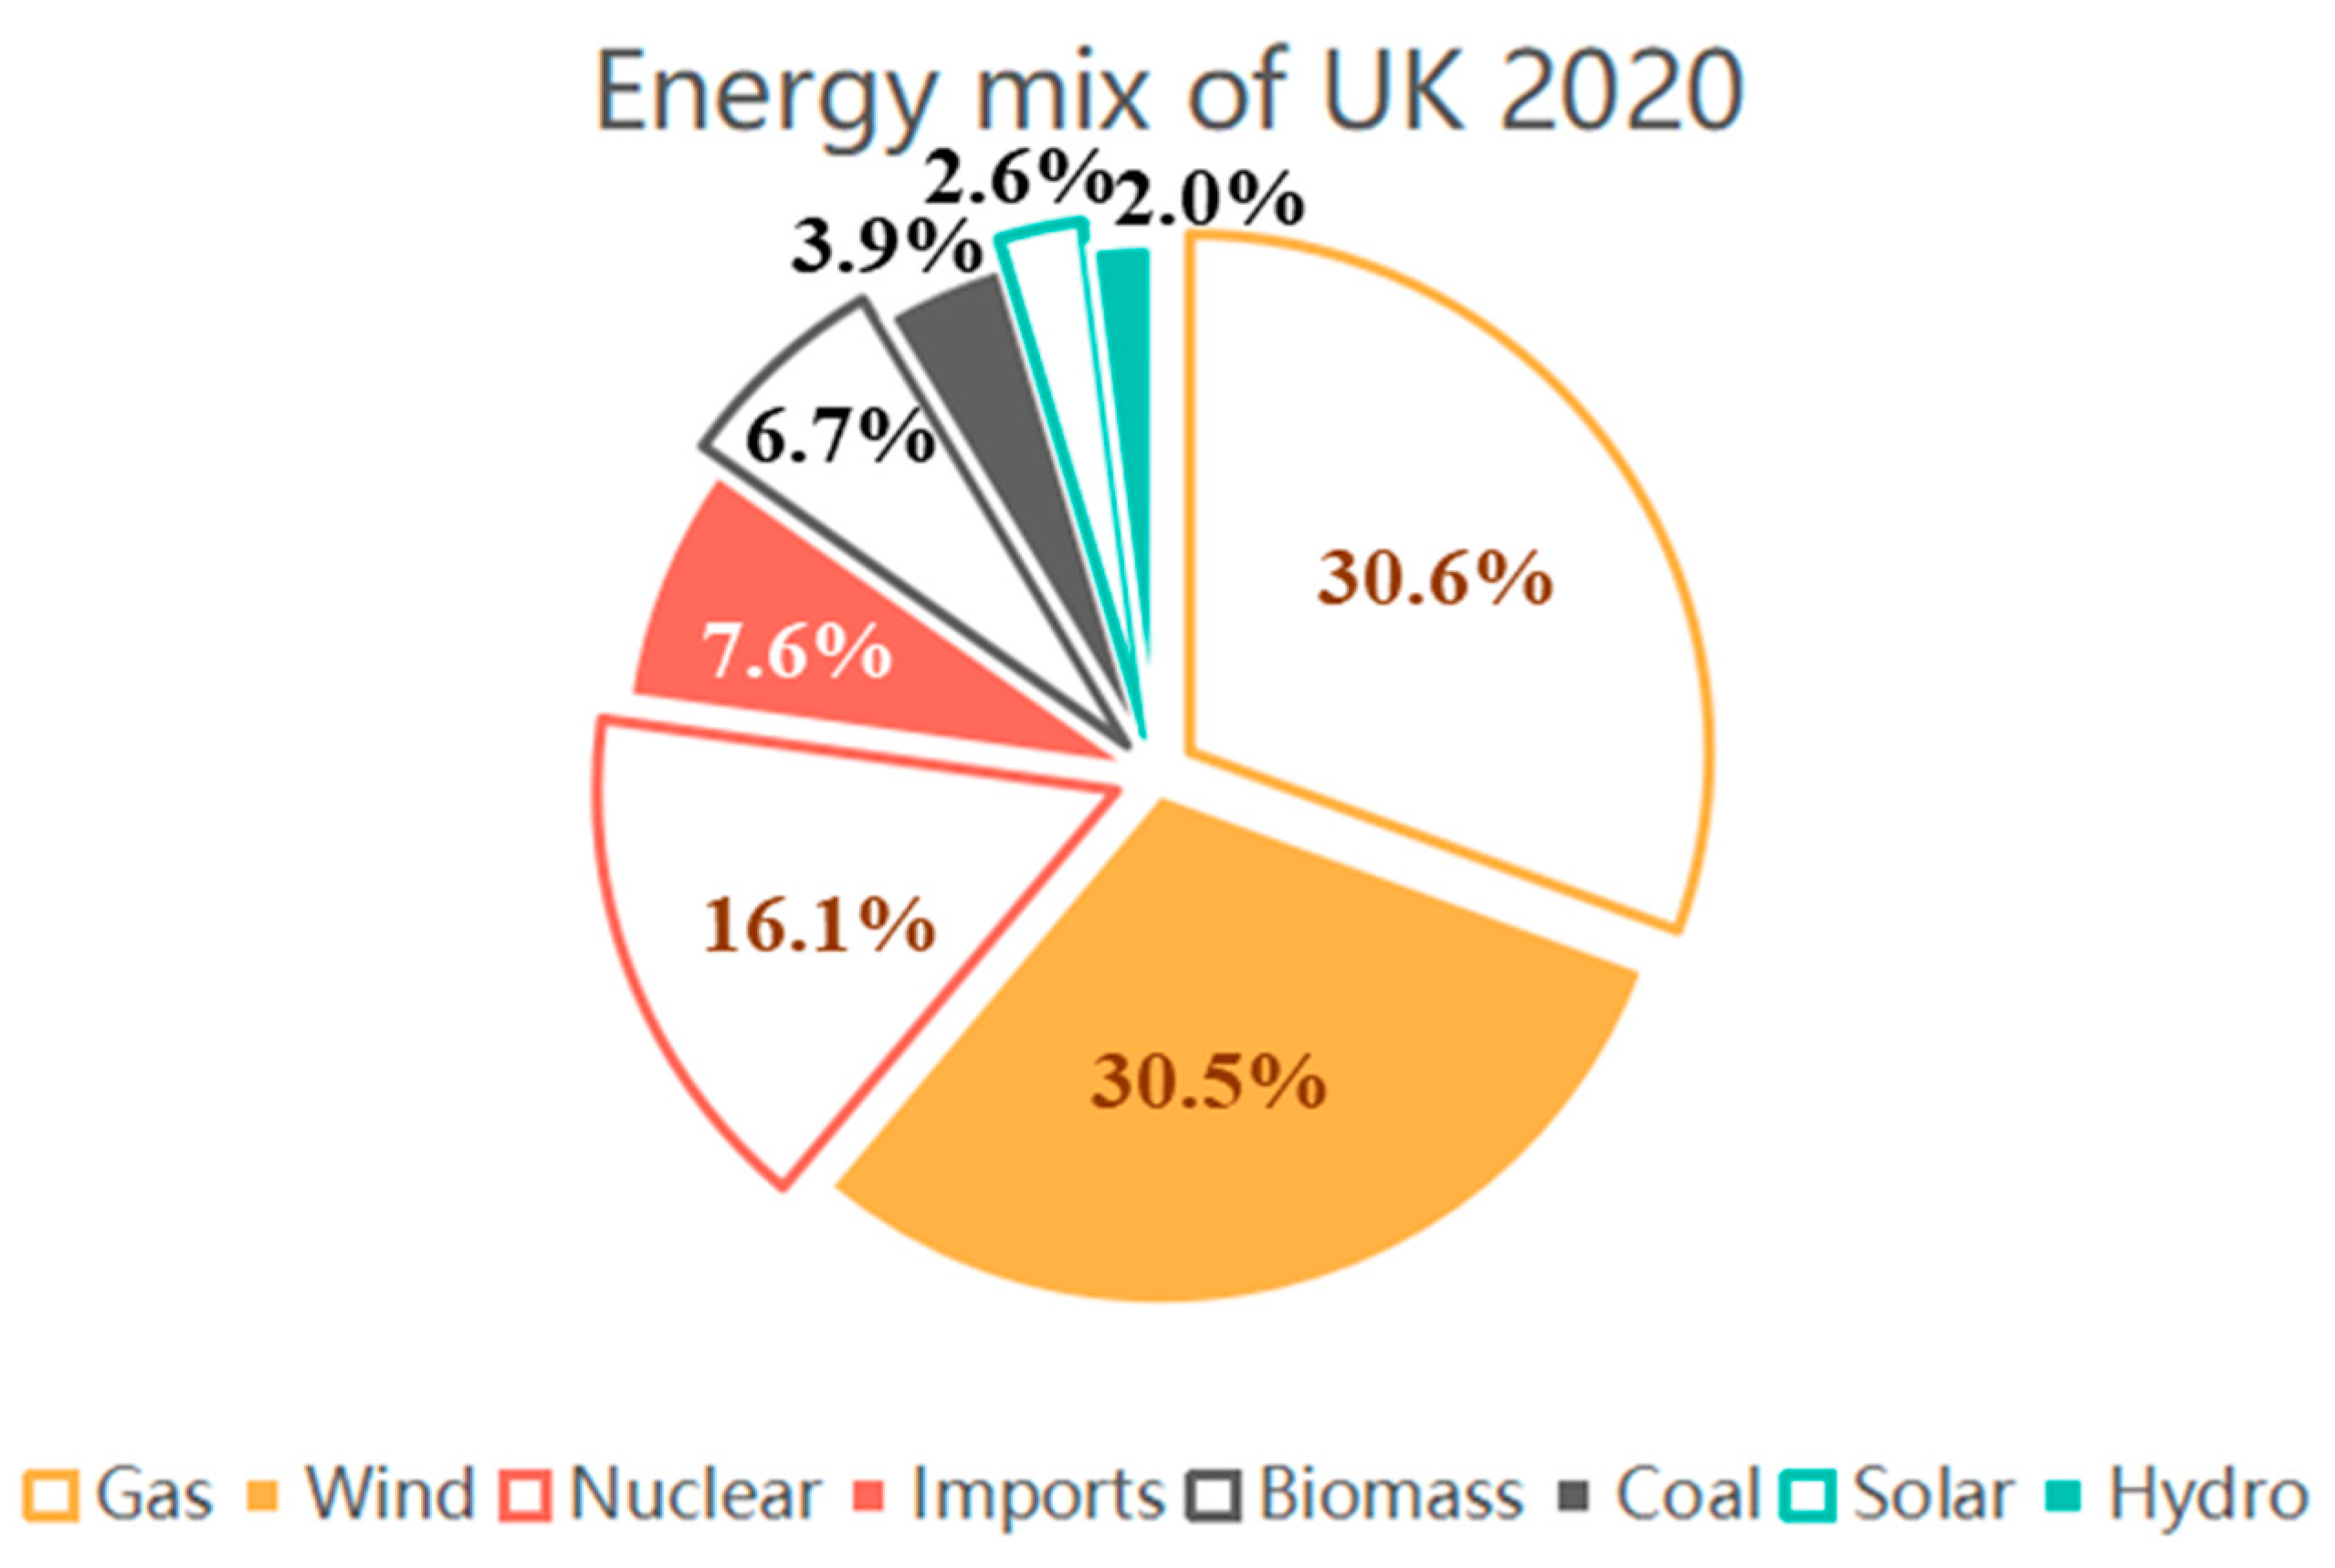
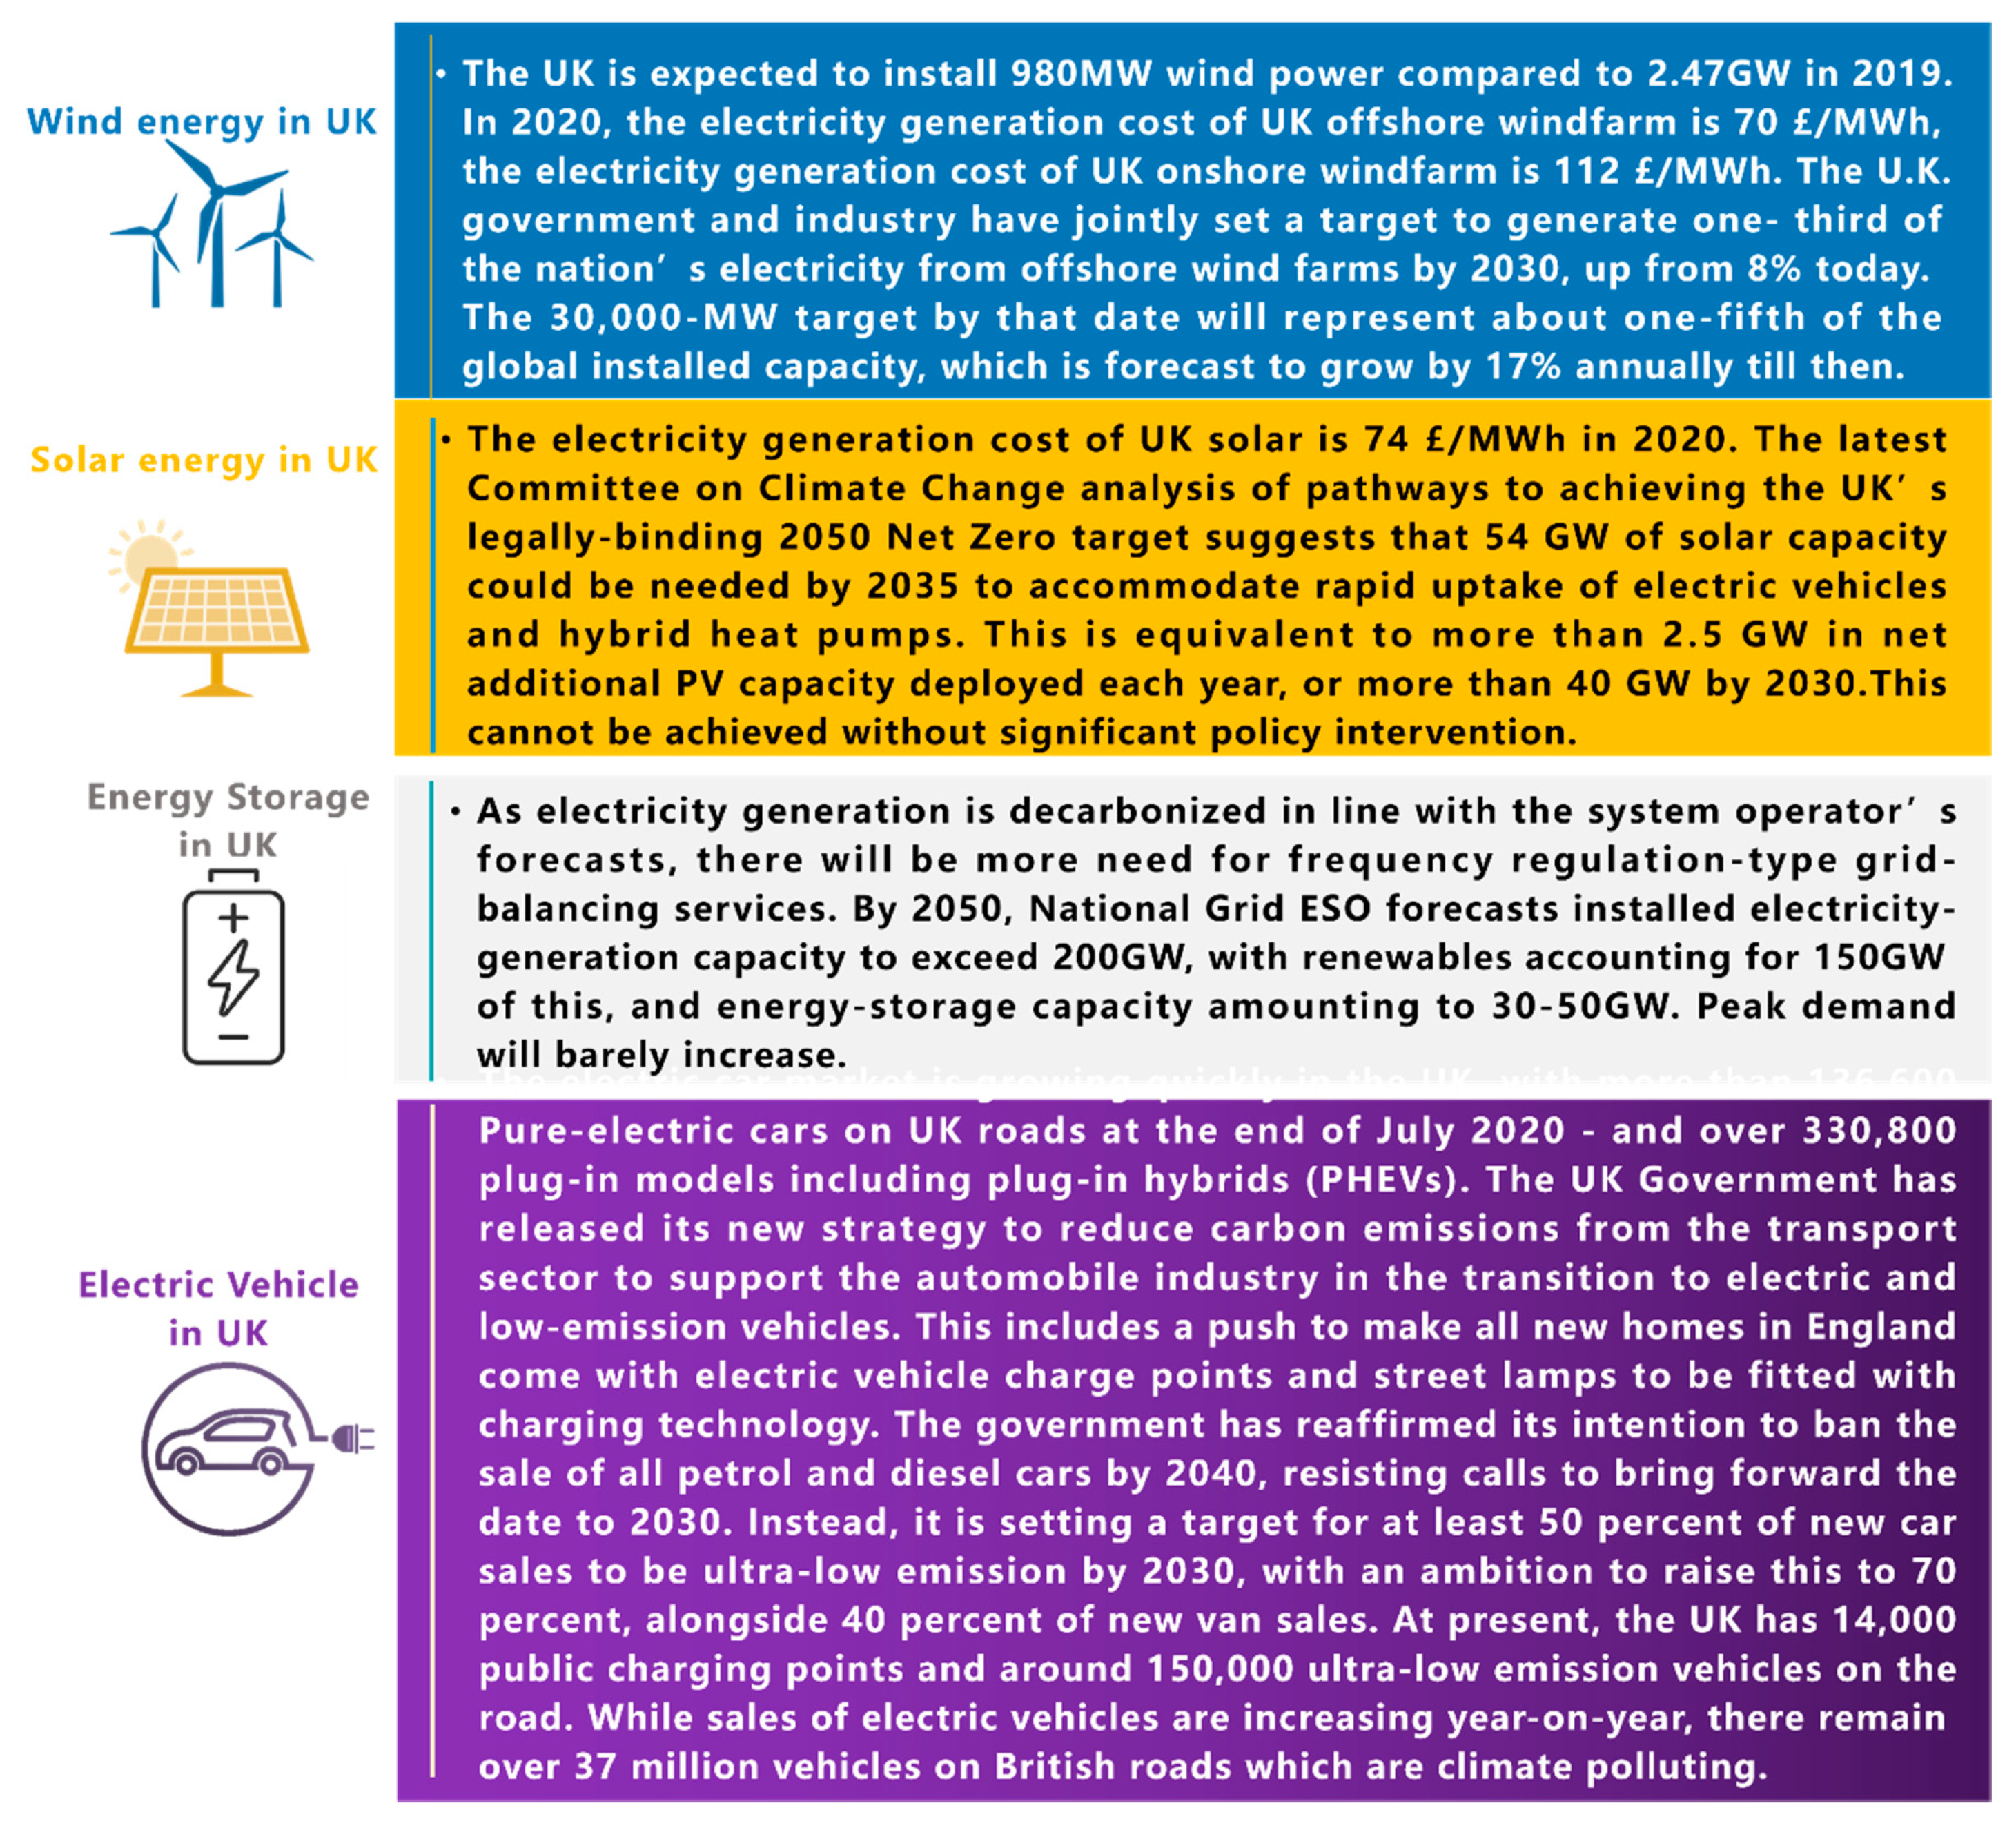
Up to the end of the first quarter of 2020, the energy mix of the UK is shown in Figure 1 [14]. According to the report from the National Infrastructure Commission (NIC), the United Kingdom plans to run 50% of clean energy by 2030 to realize the target of zero-emission at the end of 2050 through a cost-effective path (the cost-effective path is comprising measures that cost less than the projected carbon price across their lifetimes, together with measures that may cost more than the projected carbon price, but are necessary in order to manage costs and risks of meeting the 2050 target.) [15]. To achieve the zero-emission target, four sub-targets have been set, as shown in Figure 2 [16,17,18,19,20,21].
2.2. Germany
Up to the end of the first half of 2020, the energy mix of Germany is shown in Figure 3 [22]. In 2016, the Climate Action Plan (CAP) 2050 was announced by the Germany government, in order to set a long-term pathway for reducing the greenhouse gas emission of utilities and emissions industries [23].
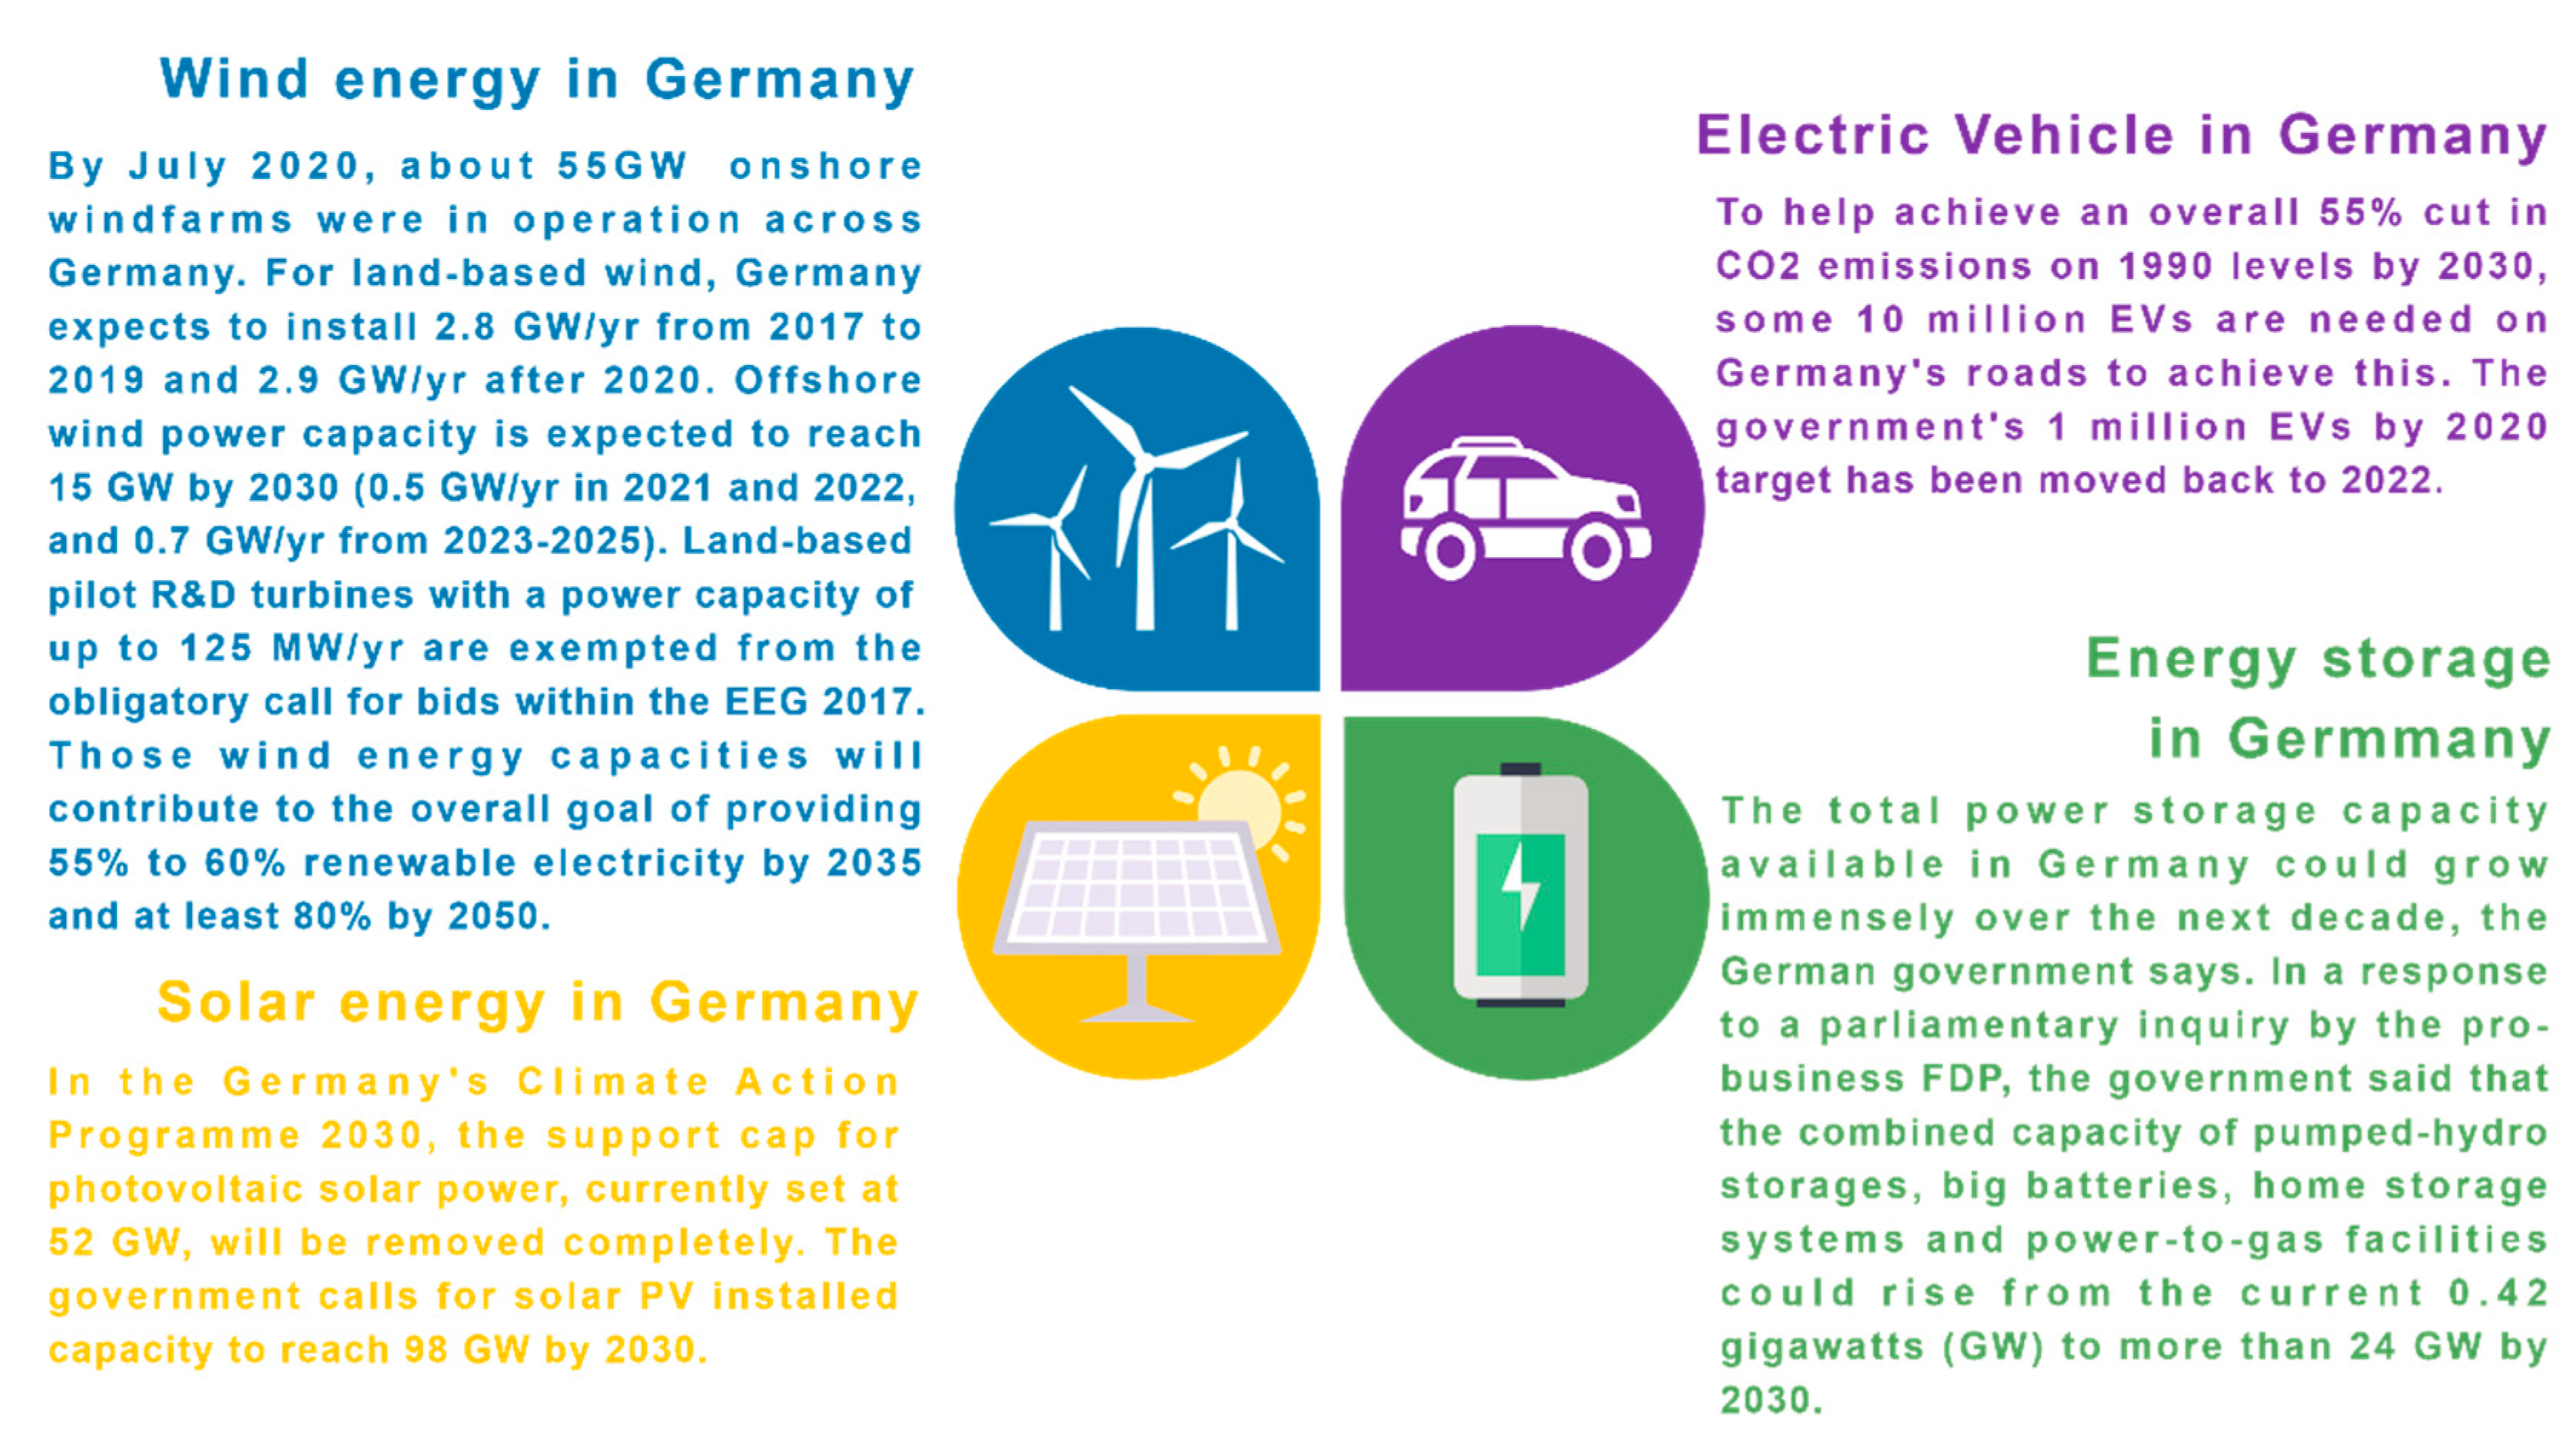
In the CAP 2050, the targets of greenhouse gas emission reduction are to achieve a 40% cut by 2020, 55% cut by 2030, 70% cut by 2040, and 80–95% cut by 2050. To reach the target for 2020, the federal government of Germany proposed a plan to realize 65% generation from clean energy sources by 2030 and requires an increase in the wind and solar capacity from 120 to 215–237GW. To achieve the CAP 2050, four sub-targets have been set as shown in Figure 4 [24,25,26,27,28].
2.3. Denmark
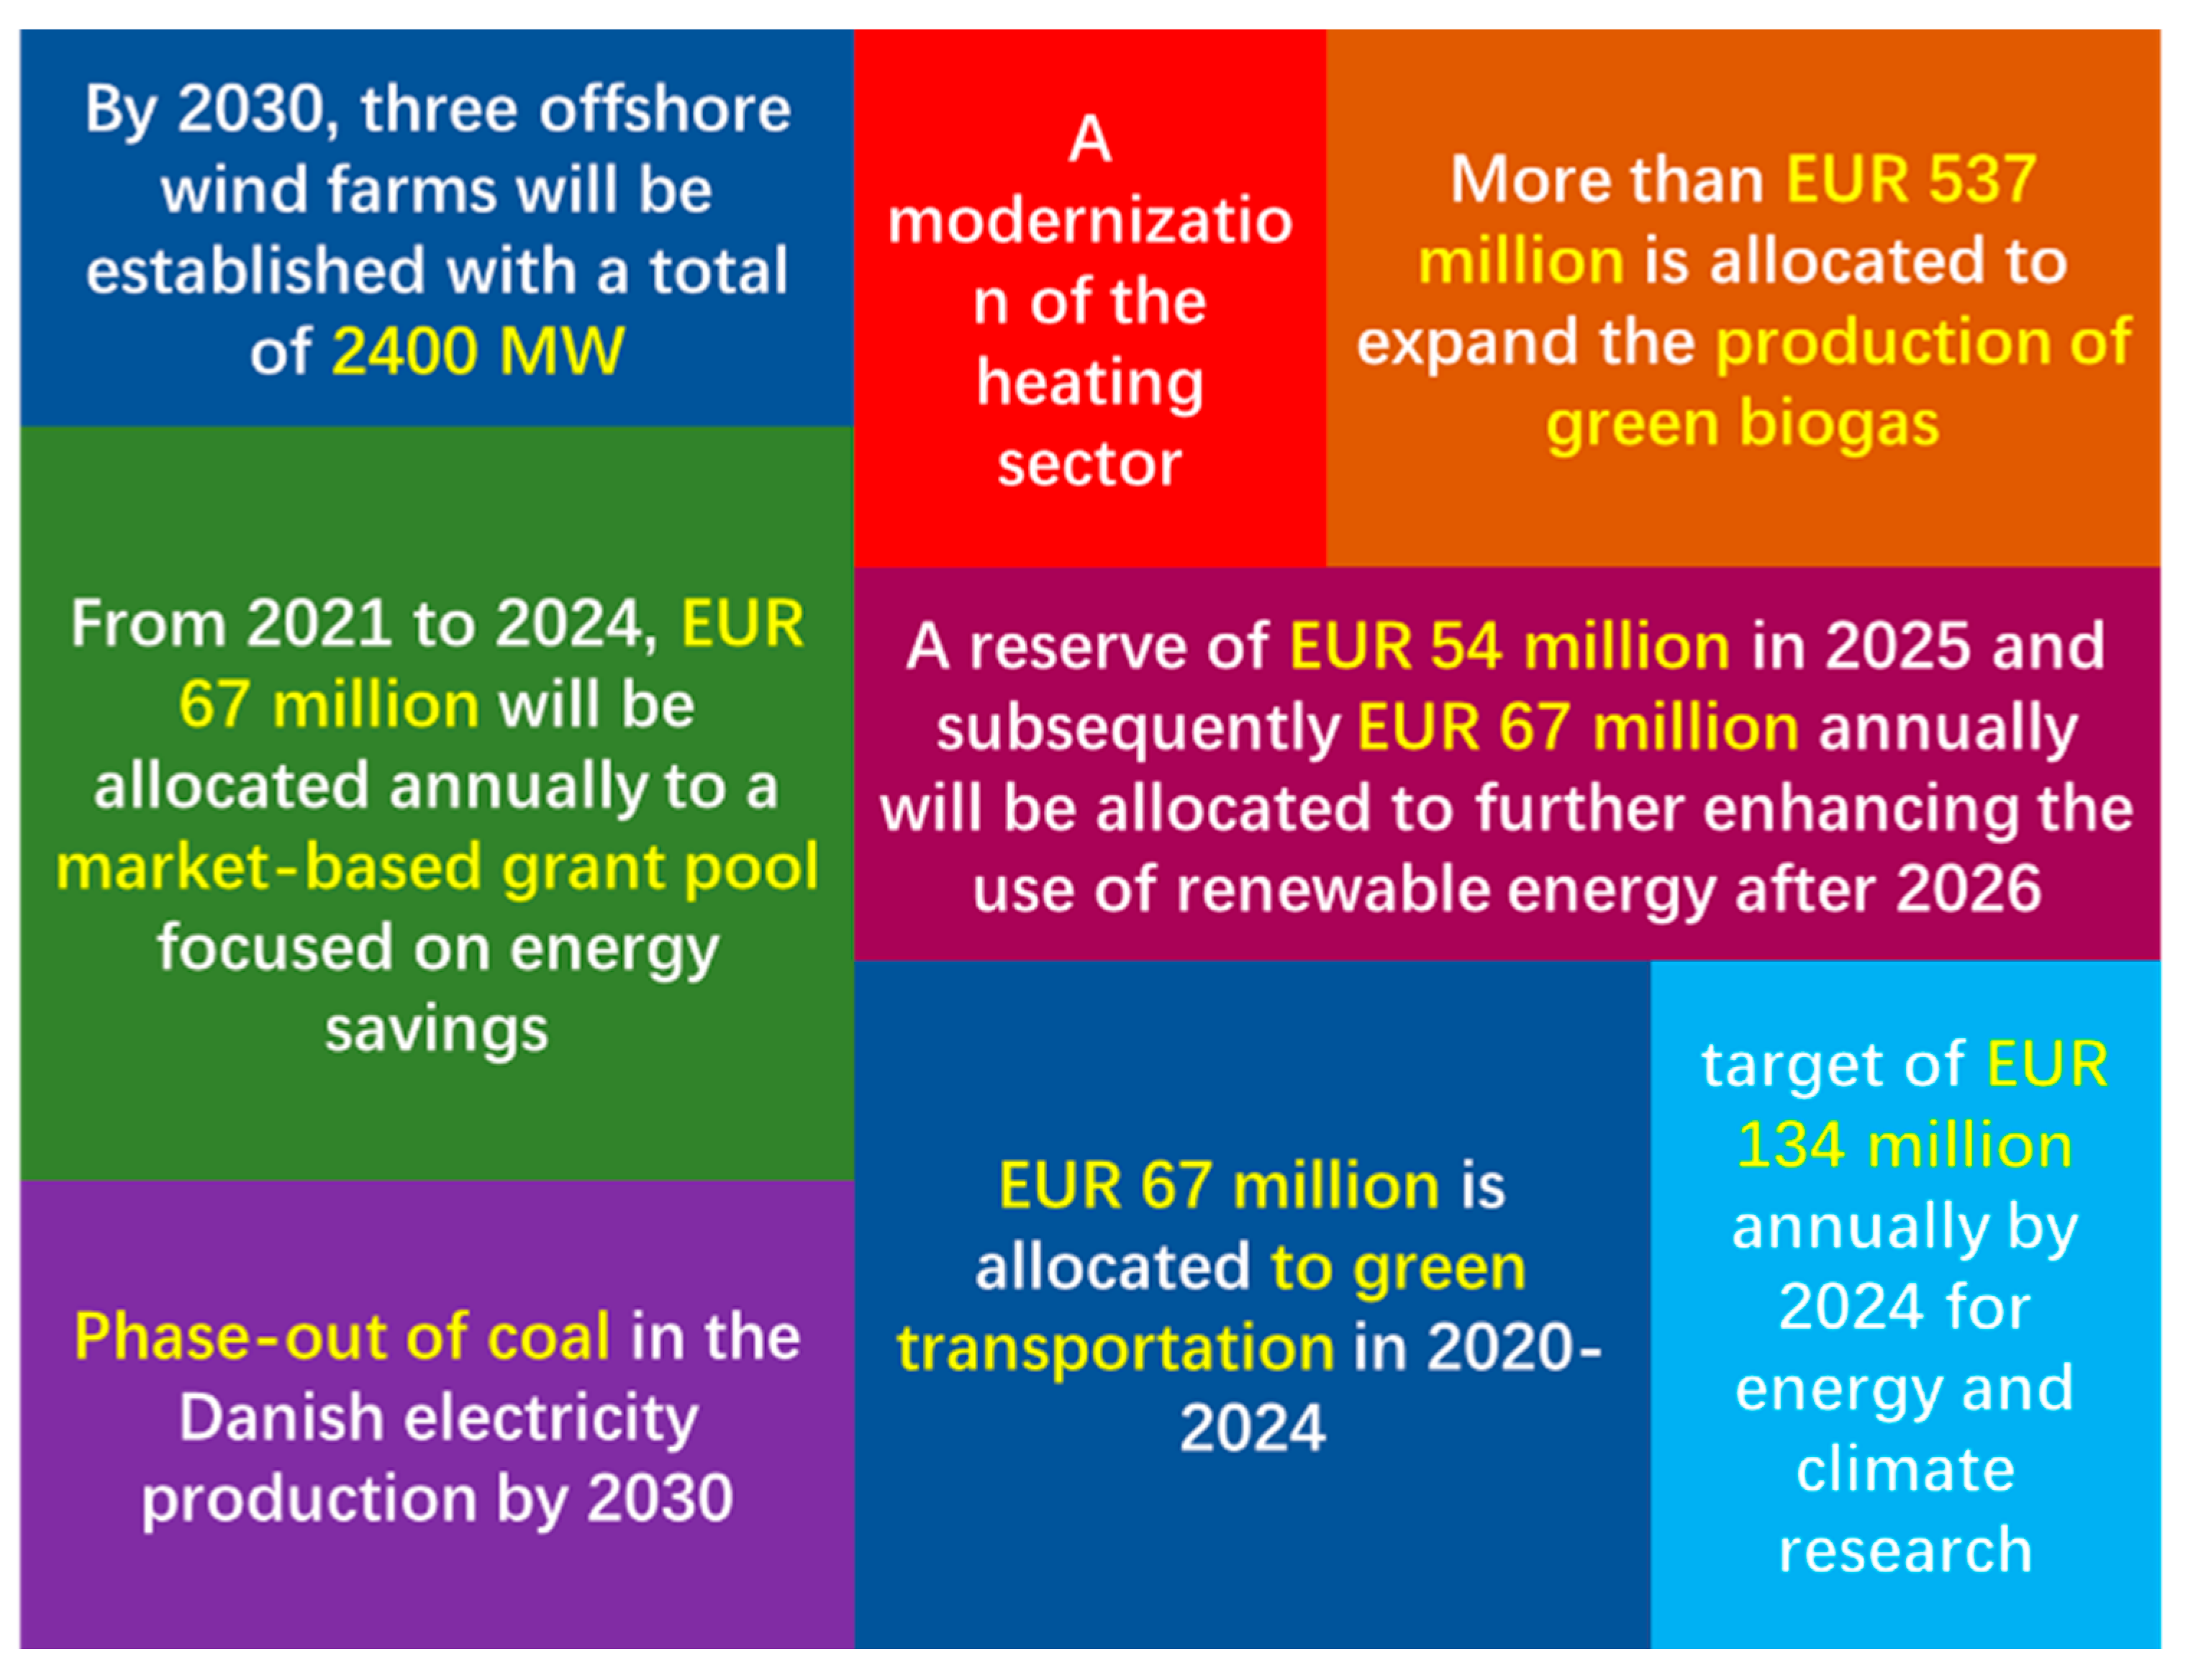
In 2018, the government of Denmark announced an energy agreement to fulfill the target set by the government that makes Denmark independent of coal fuels by 2050 and transformed into a low-carbon society. The funding has been allocated to achieve 55% of the total energy needs of Denmark from clean energy. Some highlights of the Denmark energy agreement are shown in Figure 5 [29].
2.4. Australia
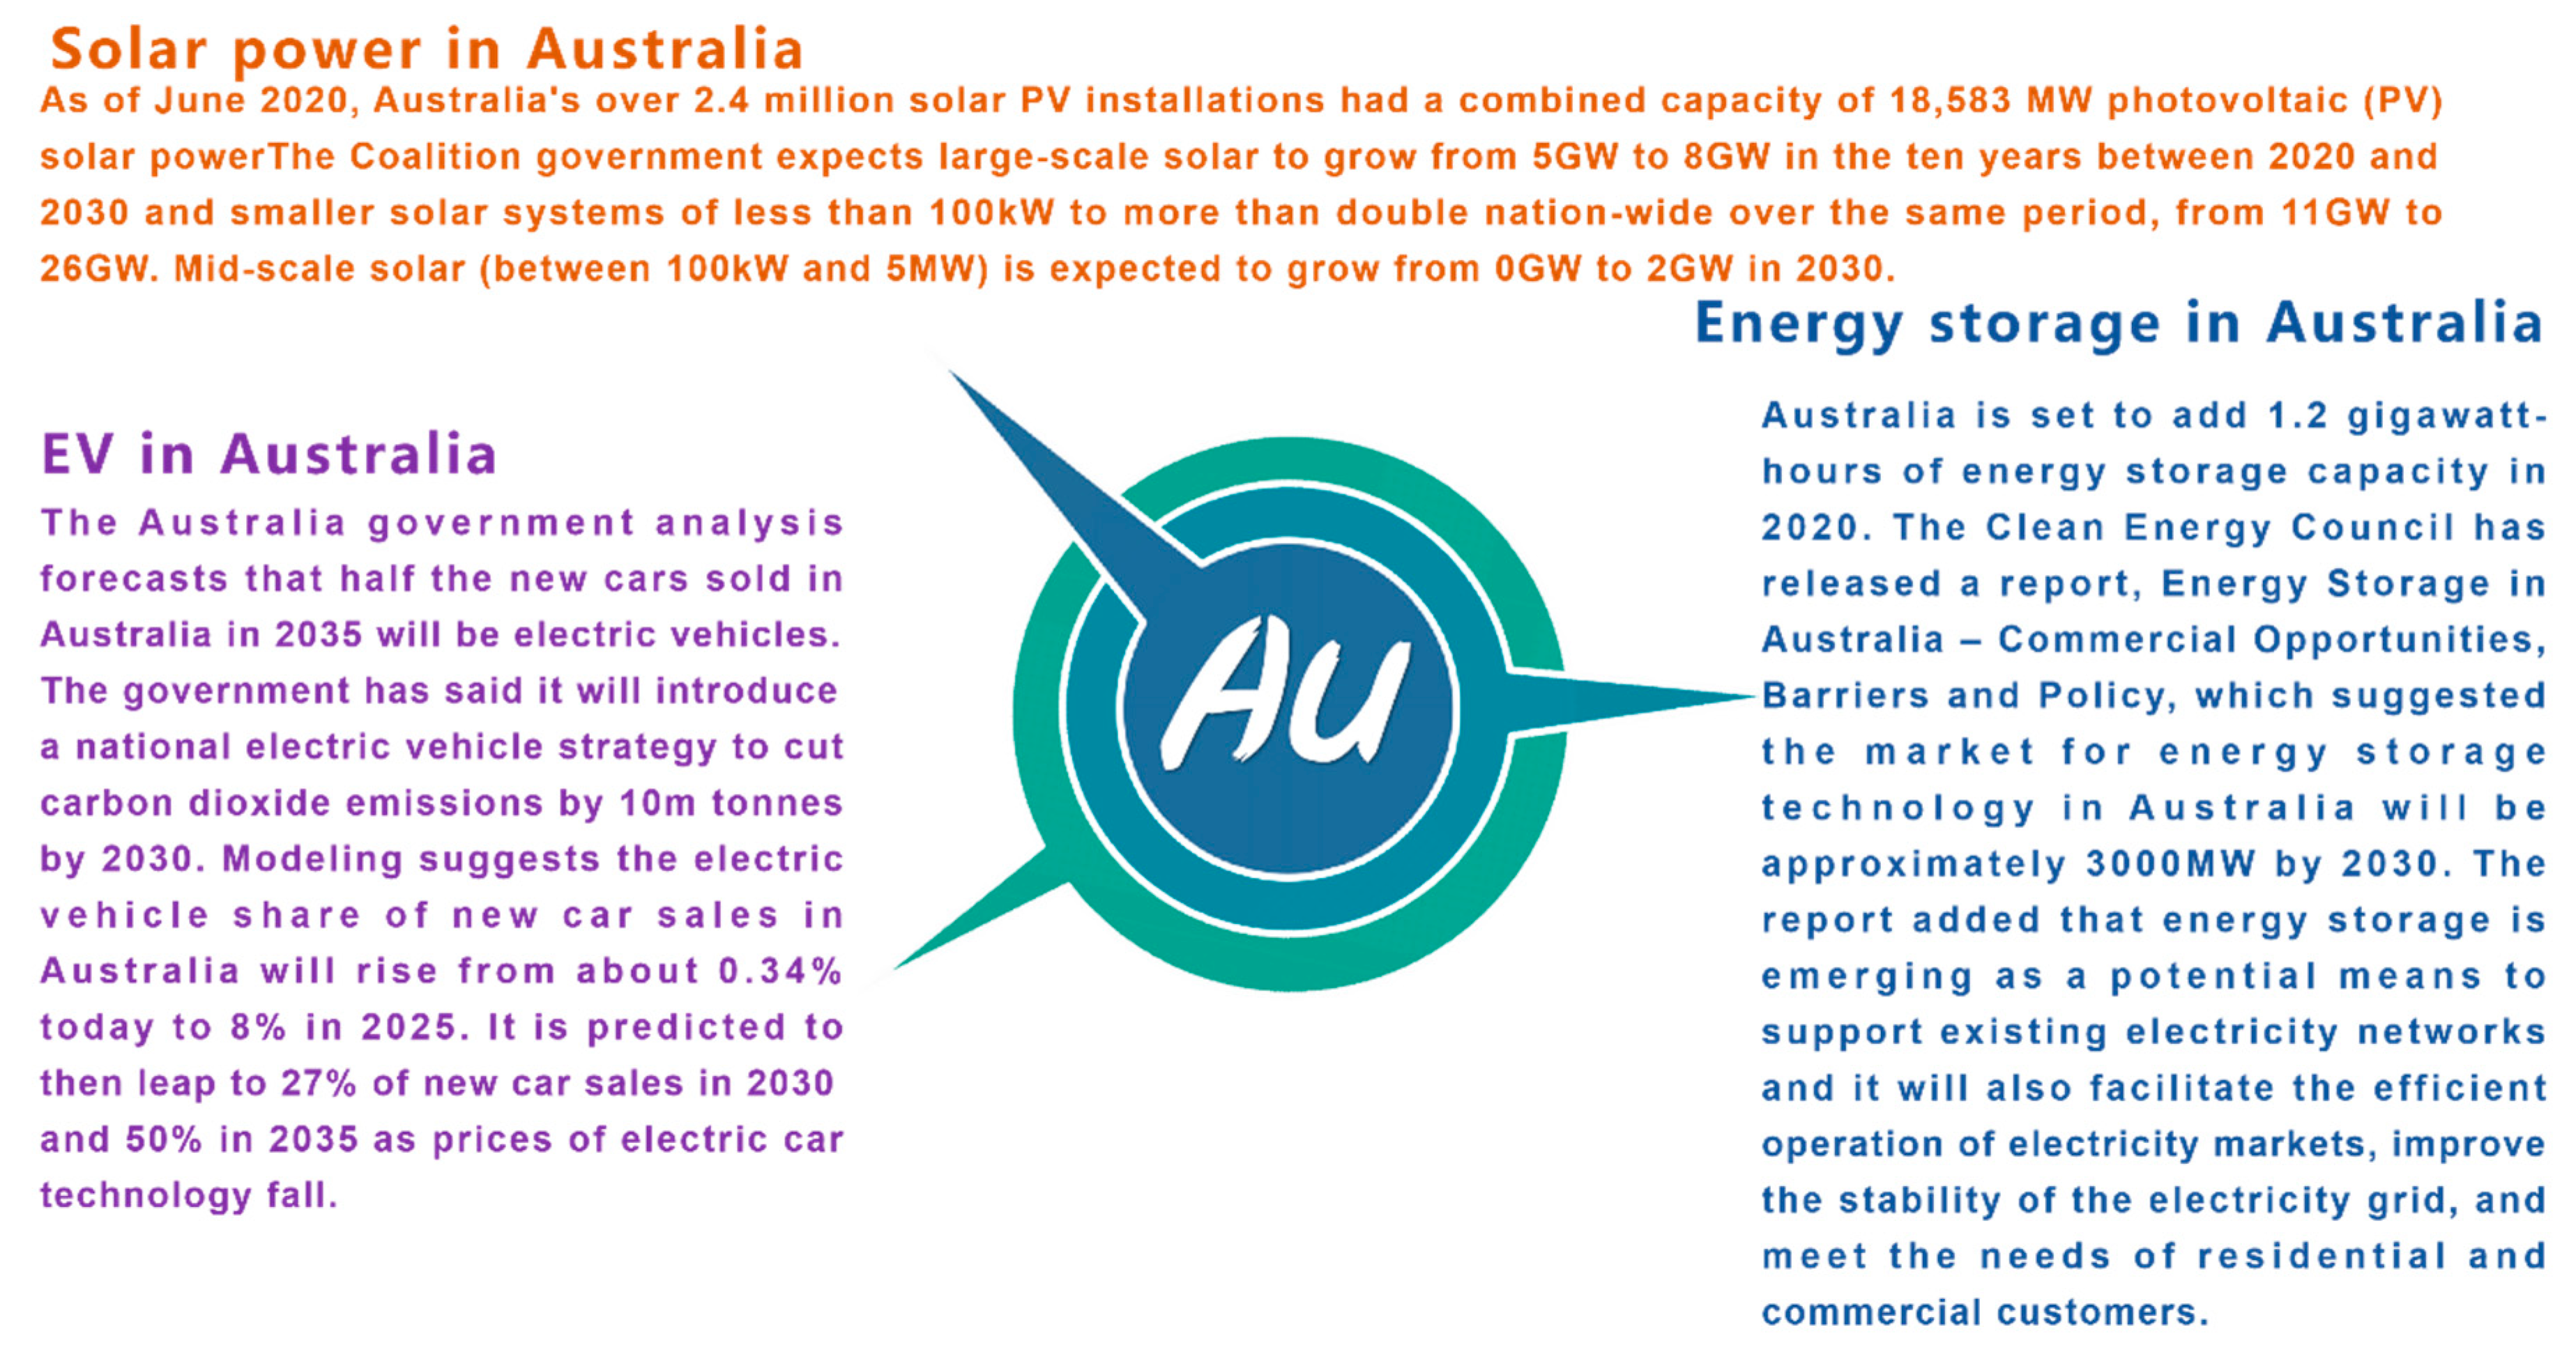
The energy mix of Australia in 2020 is shown in Figure 7 [33]. The federal government of Australia announced a Mandatory Renewable Energy Target (MRET) in 2001, in order to increase the new 9500 GWh clean energy generation until 2020 [34]. In recent years, the federal government of Australia updated its MRET to make sure at least 33,000 GWh of electricity is from clean energy generation at the end of 2020. In the updated MRET, about 50 percent clean energy by 2030 and 75 percent clean energy by 2040 must be ensured by utilities and electric providers [35,36]. To realize the MRET, some clean energy policies have been put forward as shown in Figure 8 [37,38,39,40].
2.5. China
The energy mix of China by the end of 2019 is shown in Figure 9 [41]. The China State Economic and Trade Commission (SETC) in 2001 published the 10th Five-Year Plan for Sustainable Development. The 10th Five-Year Plan for Sustainable Development clearly stated the detailed clean energy development and commercialization plan. In addition, the Center of Renewable Energy Development (CRED) has given a draft law named “Renewable Energy Development and Utilization Promotion Law”. The aim of the “Renewable Energy Development and Utilization Promotion Law” is to reduce pollution emission and protect the environment. With the 10th Five-Year Plan for Sustainable Development and the “Renewable Energy Development and Utilization Promotion Law”, some incentive policies, such as the subsidy to feed-in tariffs of renewable energies, the tax deduction for both renewable energies generators and consumers, and the priority natural resource supply for renewable energies infrastructure installation, have been structured to encourage clean energy development and stimulate the market for providing more opportunities to clean energy providers [42,43]. Under the booming of clean energy in China, in 2014, the International Renewable Energy Agency (IRENA) published a report called “Roadmap 2030—A Renewable Energy Roadmap for China” [44,45]. The report indicates that the proportion of clean energy could be up to 35 percent by 2030, which will make China become the largest clean energy user, about 20 percent of global clean energy. The planned development pathways of wind, solar, electric vehicles, and energy storage in China are summarized in Figure 10 [46,47,48,49].
2.6. India
The energy mix of India by the end of 2019 is shown in Figure 11 [50]. As one of the biggest countries in the world, India has more than 1.3 billion people, and it also has a vast economy and a huge military. For maintaining the normal operation of this huge country, India’s energy requirement is large and increasing rapidly. In 2018, the primary energy consumption of India reached 809.2 million tons of oil equivalent in 2018, which made it become the third-largest energy consumer country that is only behind China and the U.S. For keeping energy and sustainable development, India has set aggressive targets to realize an energy transition. The Indian government has set a target to realize 175GW of clean energy capacity by the end of 2022 [51,52,53]. The planned development pathways of wind, solar, and energy storage in India are summarized in Figure 12 [54,55,56].
Figure 13 summarizes the clean energy policies in these countries.
As given in Figure 13, the difference between the countries on their enacting clean energy policies is enormous due to the different existing constraints, the variety of clean energy types, and the diversity of economic and social development degrees, which further leads to a strategy difference for implementing planned scenarios, such as Denmark focusing on the development of the wind power to realize its clean energy target. The reason that Denmark adopts wind power as its mainstay of renewable energies is determined by its natural energy resource distribution as Denmark has abundant offshore wind energy. Similarly, the social recognition degree is also an important factor for specific clean energy development in one country. As shown in Figure 13, solar power developing in Germany is much more prompt than in other countries (98 GW by 2030, which is almost 30 times of Denmark), because the German public prefers distributed PV panels installed on their roof. The recognition of solar power by the public greatly facilitates the installation solar power in Germany and the maturity of solar energy-related industries also prompts the clean energy policies in Germany partially to solar power. In addition, from Figure 13, it could be seen that the policies for EV promotion in all countries mentioned in this paper are aggressive and ambitious, because of the stern requirement of carbon dioxide emissions reductions. In the meantime, these policies also indicate that the EV-related industries will meet great opportunities in the future.
In general, the clean energy policies of countries are more macroscopic and comprehensive, which involves the development of various clean energy technologies and future energy transition pathways. According to the recent reports or news, China and Denmark have already met their 2020 targets, but Australia may miss their 2020 emissions reduction target [57,58,59]. The main reason that Australia may miss its clean energy target is due to the lack of a coherent national energy policy. These results indicate that these clean energy policies are not guaranteed to be accomplished by the countries like most people thought, further suggesting that the practice and implementation of these clean energy policies need coordination from various levels of governments and electric power companies. In the next section, taking the U.S. as an example, the recent clean energy policies in representative states and utilities of the U.S are presented to show how to concretely implement nationwide clean energy policies to power providers and consumers.
3. The Clean Energy Policy of Progressive States in the U.S.
3.1. Overview of the State Renewable Portfolio Standards and Goals
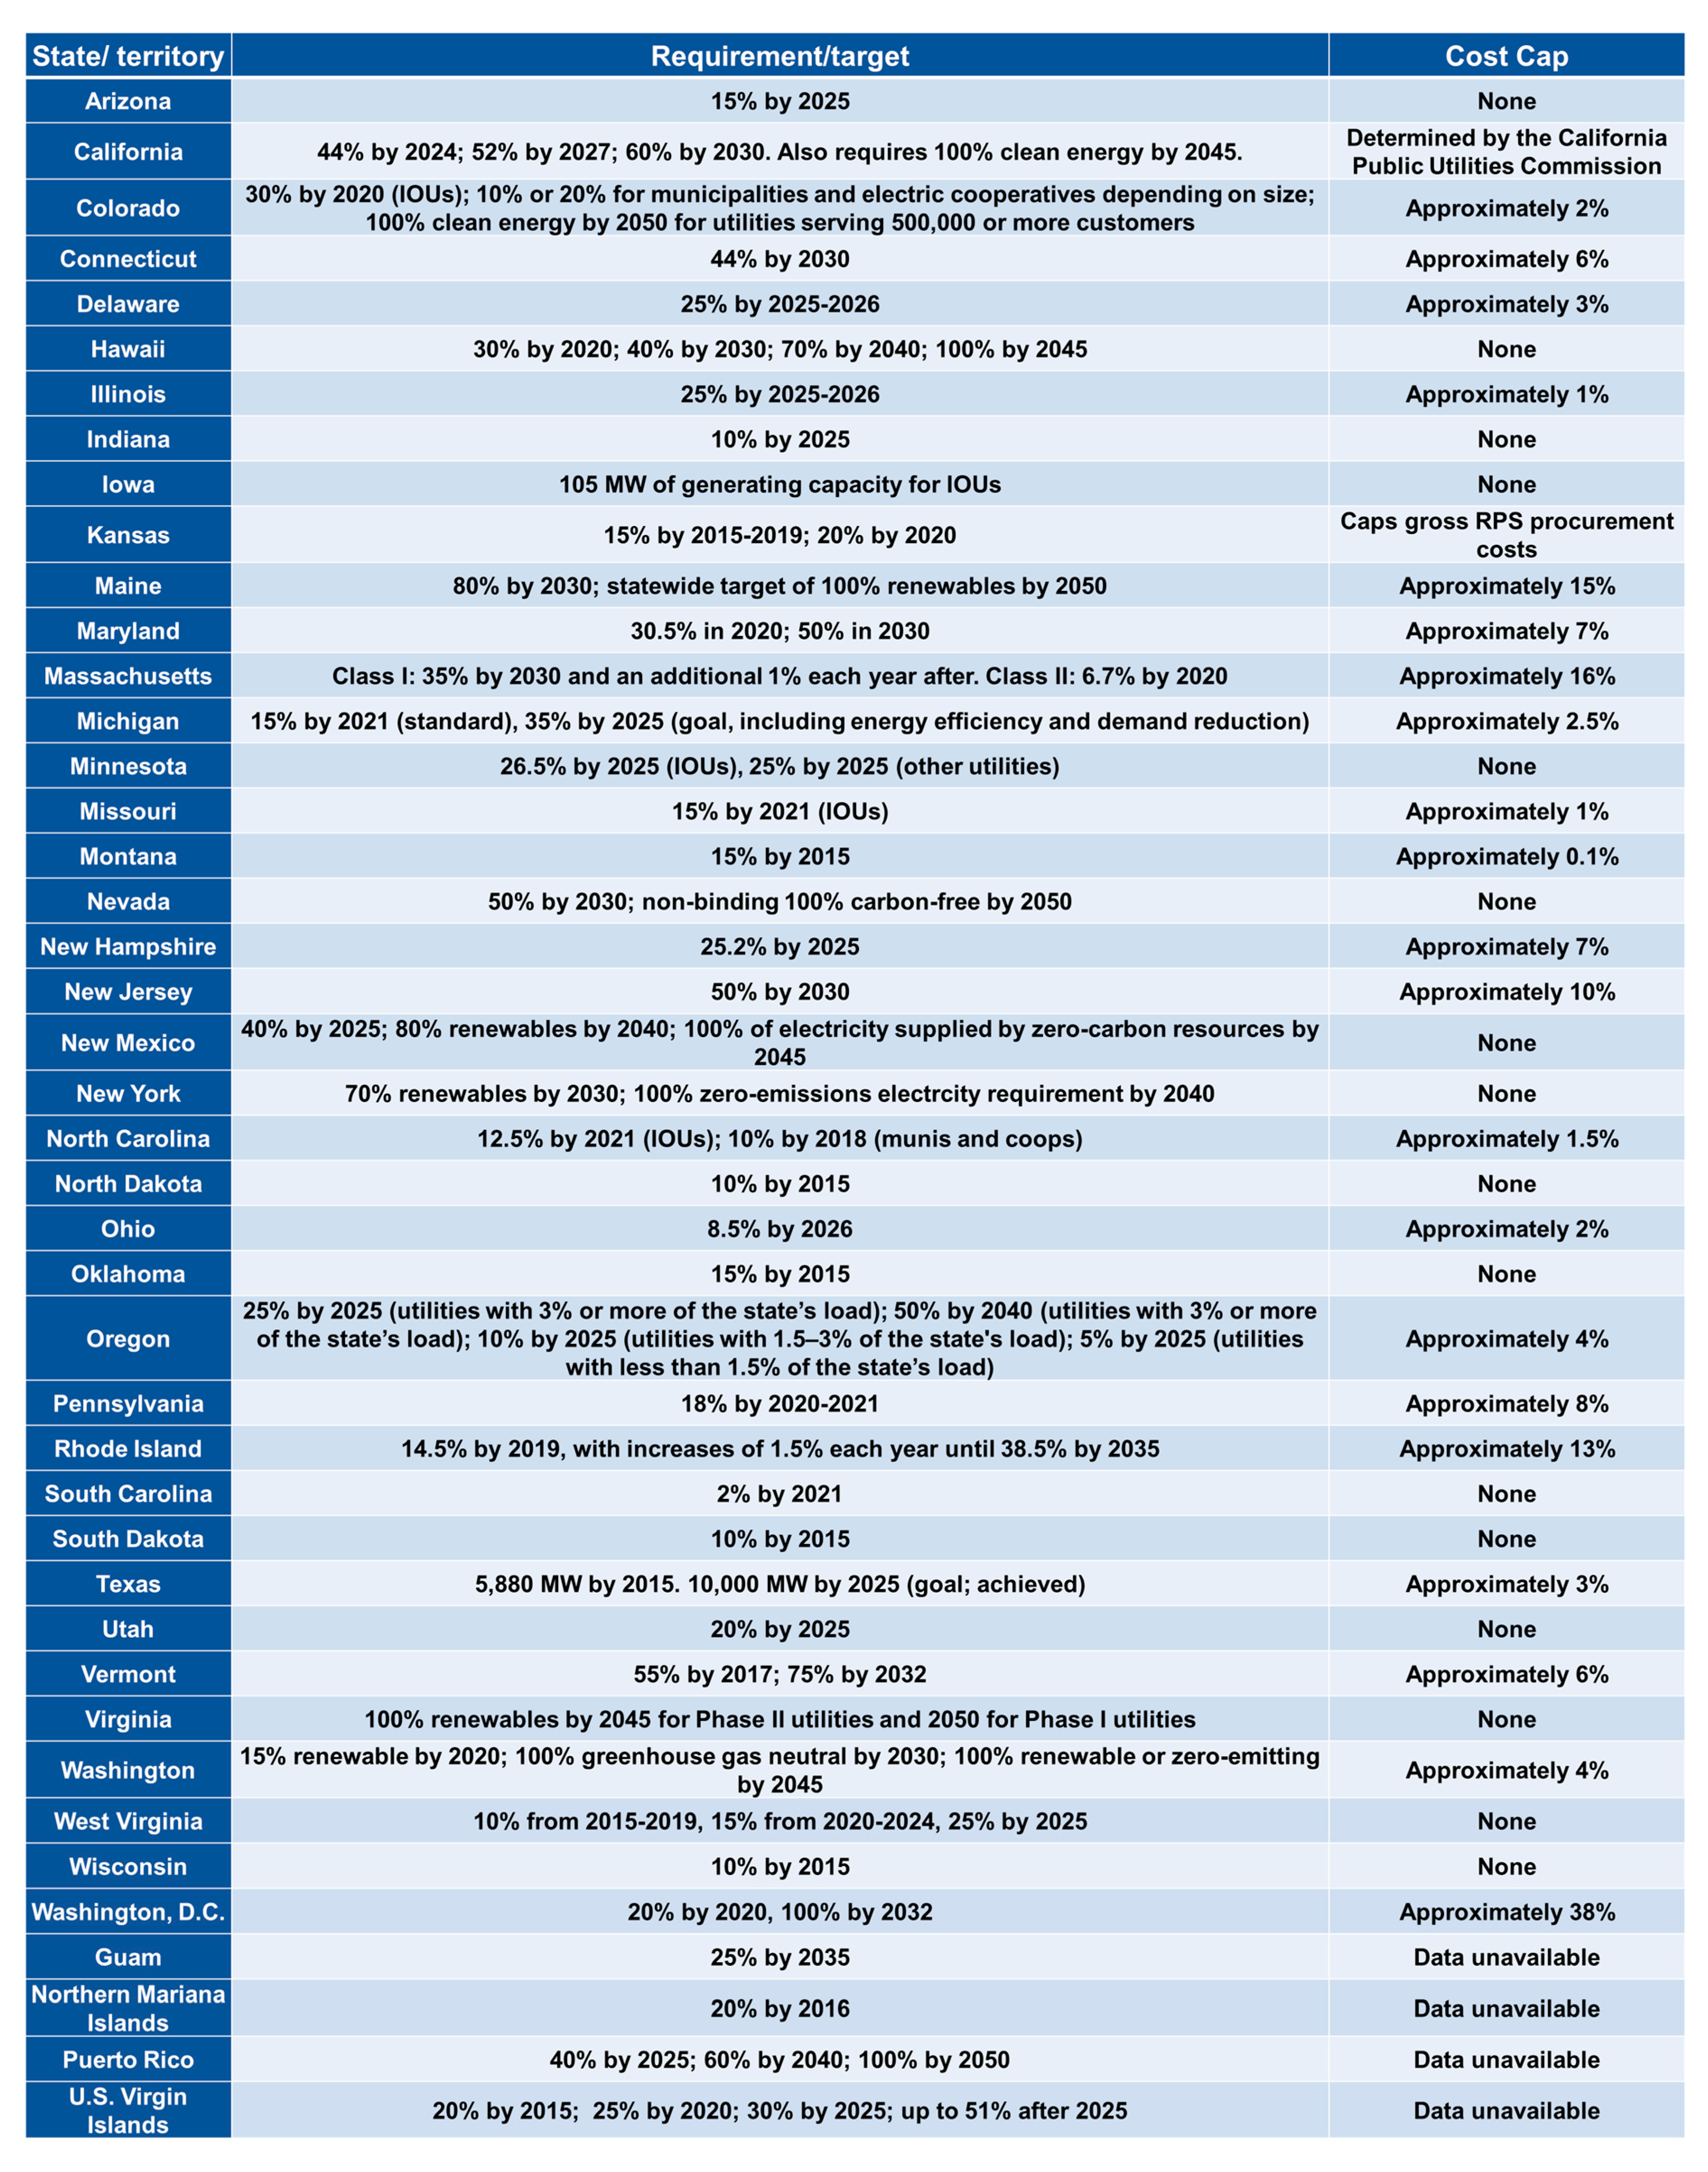
As one of the world’s richest owners of wind, solar, hydro, and other renewable energy resources, the U.S. state governments have actively revised their renewable portfolio standards (RPSs), which require their regional utilities to sell a specified percentage of clean energy electricity. Moreover, state governments have also announced these standards to make their energy resources more diverse. Furthermore, RPSs could also promote domestic energy production and boost economic development. However, state RPSs have significant diversities on RPS goals, evolved entities, eligible resources to meet requirements and cost caps, etc. Figure 14 lists the RPS/voluntary goals of different states/territories [60,61,62]. From Figure 14, it could be seen that the aggressiveness degree of a state government’s clean energy policy depends on the economic level of the state. Most of the states in the west and on the East Coast have ambitious clean energy targets.
3.2. Details for Some Progressive States
In this section, the clean energy policies of five progressive states in the U.S. are introduced.
3.2.1. California
As one of the most progressive states in the U.S., the Californian government signed the Senate Bill 100 (SB 100) in September 2018. The objective of SB 100 is to increase the overall requirement of clean energy from 50% to 60% by 2030 [63]. In addition, the legislation of California has also changed some rules of using large hydropower generation by publicly owned municipal utilities (POUs) and set a more aggressive target that realizes 100% electric retail sales from clean energy by 2045. The detailed procurement requirements based on the interim target from the governing board are listed in Figure 15 [64].
In addition, 1325MW of energy storage is required for utility collective procurement by 2020 and needs to be installed and delivered to the grid no later than 1 January 2025. The phase of procurement for each utility starts in 2014, and the share of each utility has to include a certain amount of energy storage at both the transmission and the distribution levels. Meanwhile, a certain amount of energy storage has to be deployed at the customer side.
3.2.2. New York State
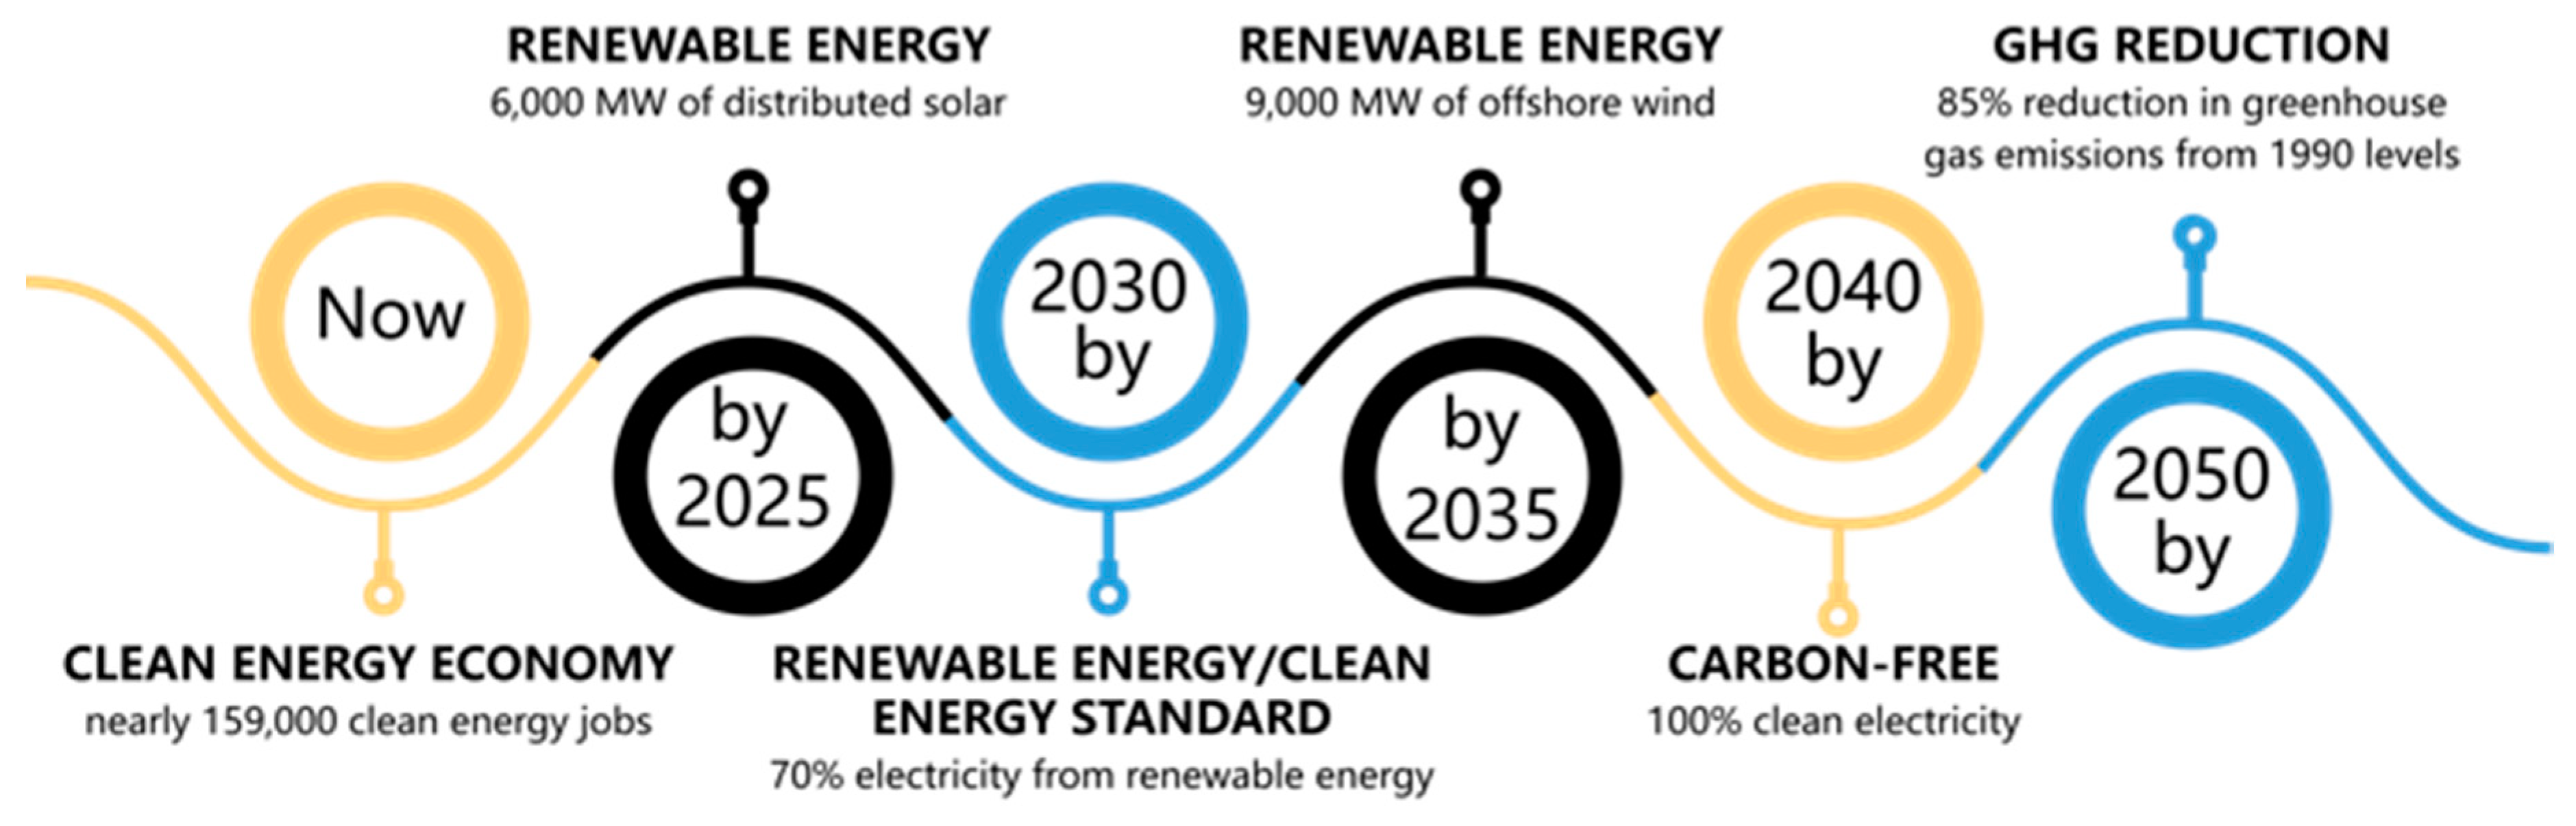
As a pioneer in clean energy popularization, New York has been building momentum for many years through a strong and consistent climate and clean energy actions. The government of New York State aims at realizing a carbon-free electricity system and a carbon-neutral economy by 2040 [65]. The clean energy roadmap of New York State is shown in Figure 16. This plan includes all areas including electricity delivery, transportation, building, and industrial production. The New York Climate Leadership and Community Protection Act (CLCPA) has also set a new standard, which codifies the clean energy goal of New York to 70% by 2030 while cutting down the greenhouse gas emissions to 15% by 2050. The standard aims to scale up grid modernization, energy storage, and solar power to improve system flexibility, reliability, and resilience. The necessary foundation mentioned in this work is to support the expansion of 3000 MW of energy storage and 6000 MW of distributed solar power [66].
3.2.3. Washington State
Washington State has also proposed an aggressive target on the clean energy transition. The Clean Energy Transformation Act (S.B. 5116 of 2019) proposes to realize 100% clean electricity by 2045. This Act requires that all utilities must eliminate coal from their state portfolios by 2025. Besides, the utilities should be greenhouse gas-neutral from 2030. By 2045, all electricity in Washington State must come from clean energy without emission [67,68]. The target of Washington State on clean energy is shown in Figure 17.
3.2.4. Virginia
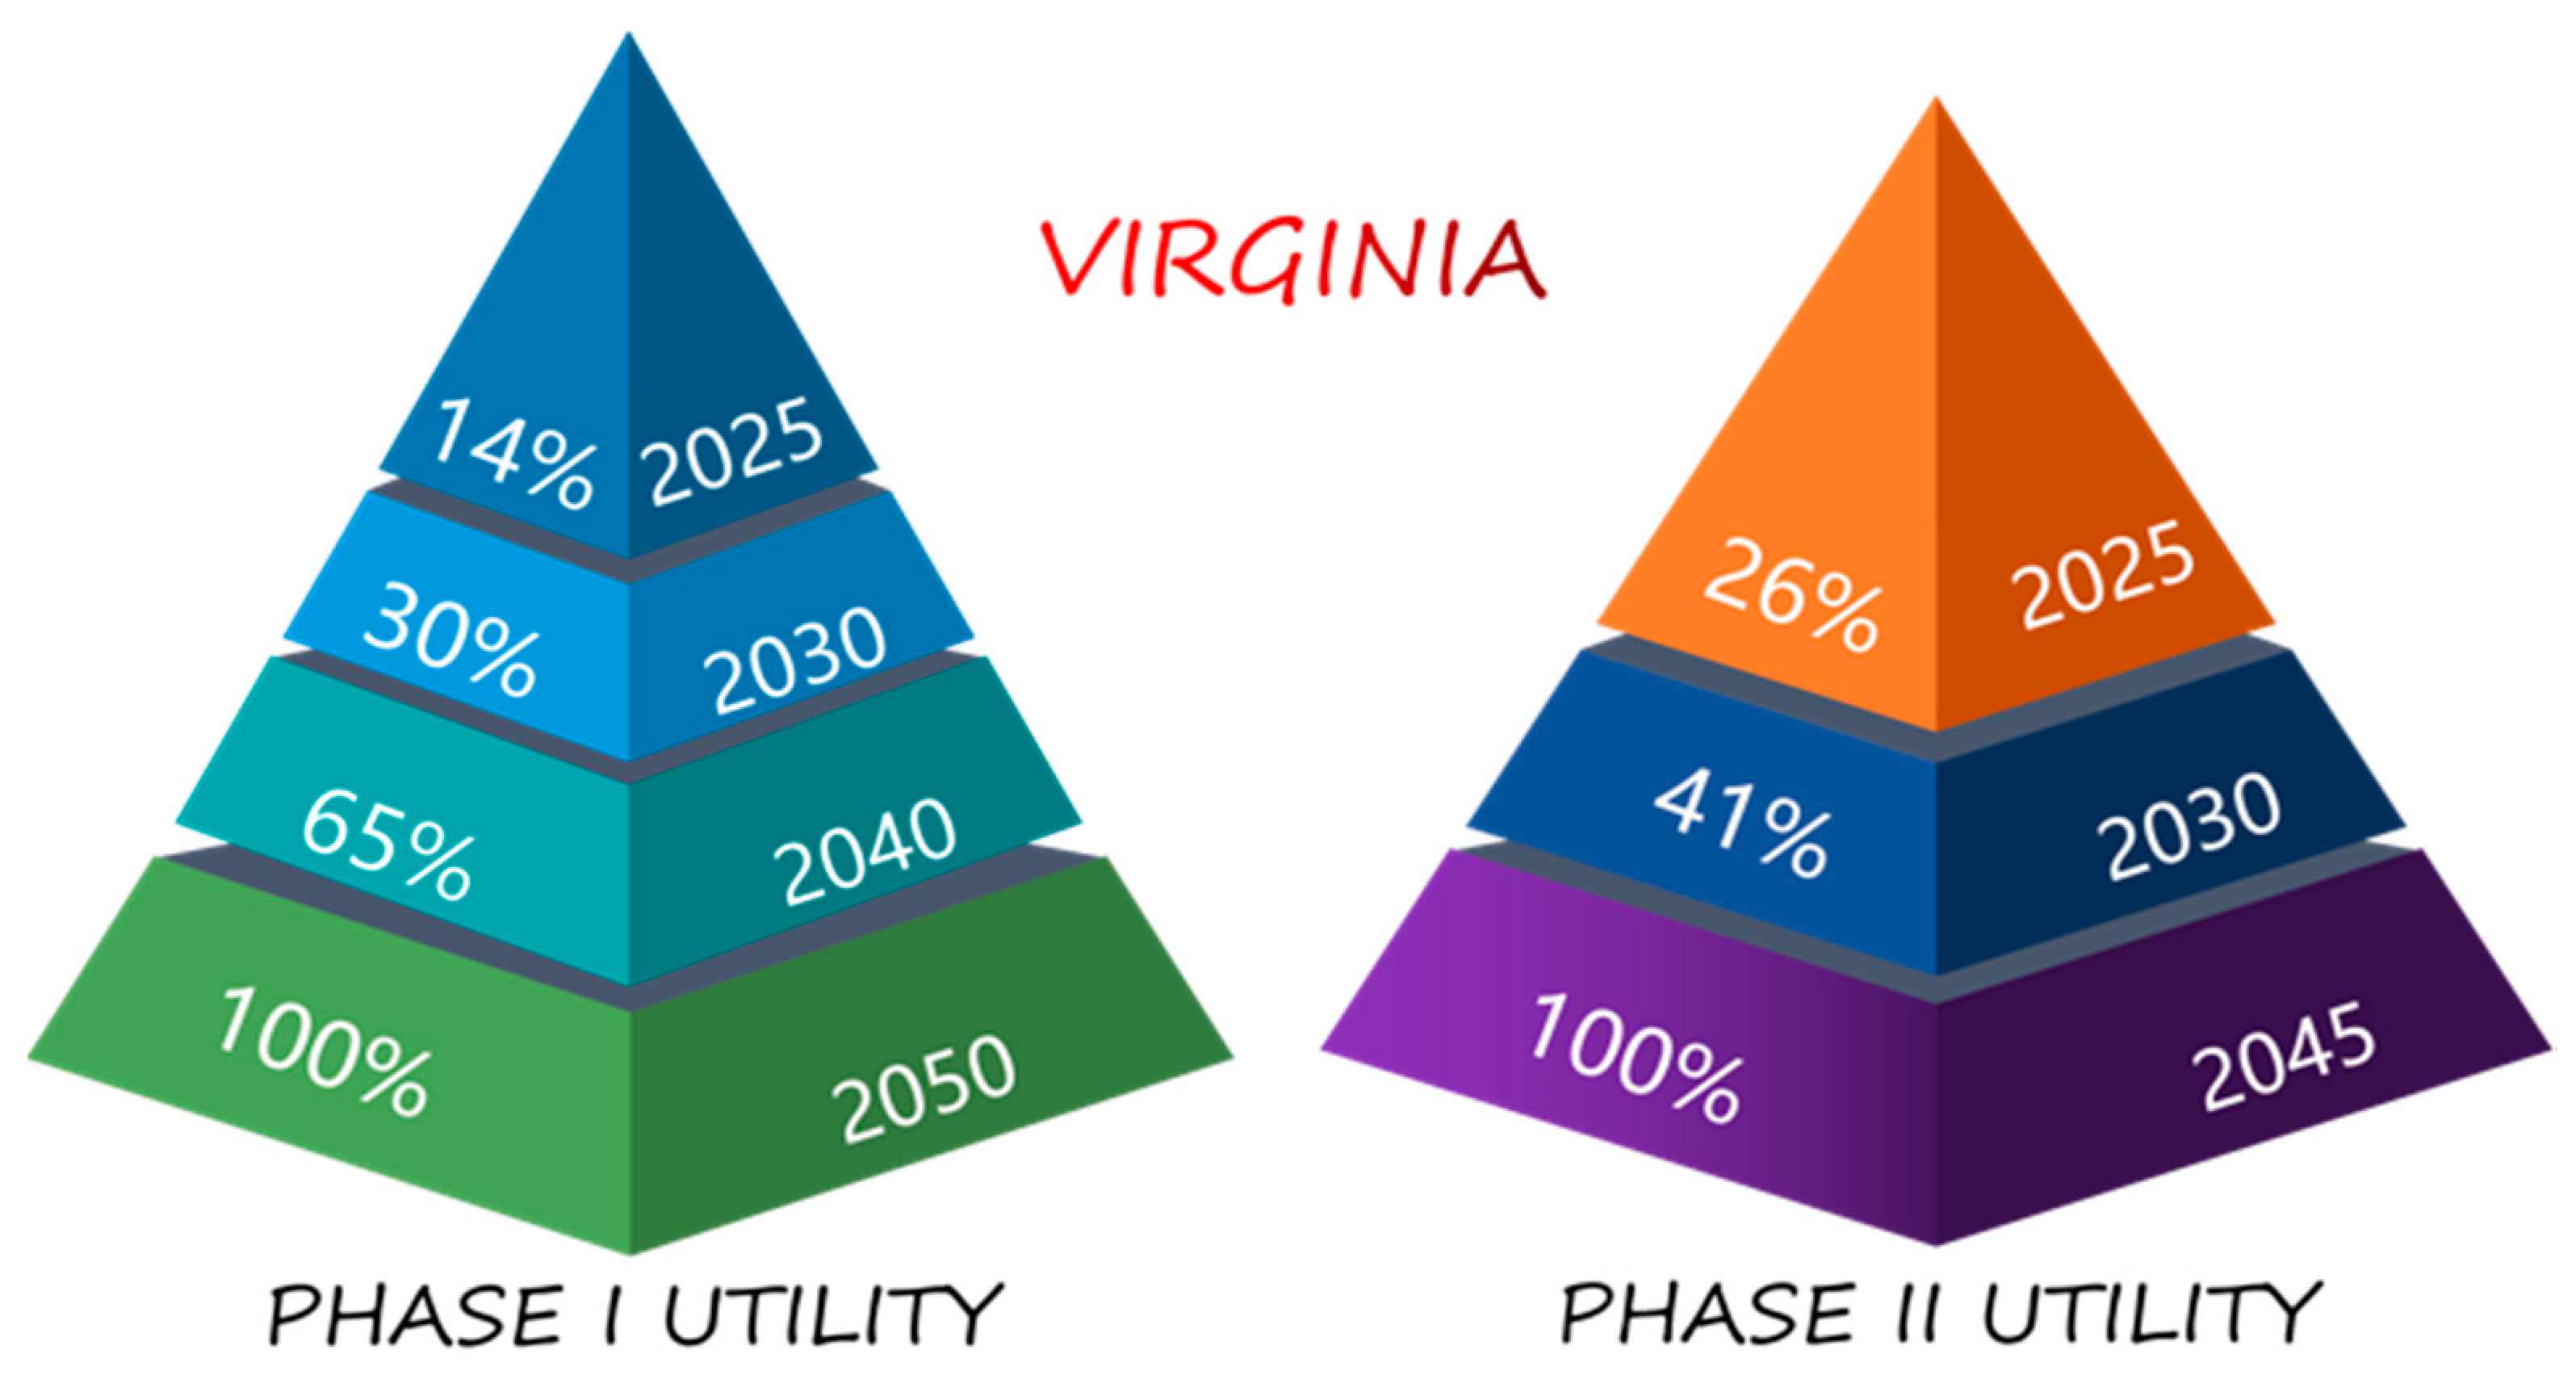
In 2020, Virginia State set a clean energy target for realizing mandatory 100 percent clean energy for Phase I utilities (Appalachian Power Company, etc.) and Phase II utilities (Dominion Energy Virginia, etc.). In the previous plan, Virginia State enacted a voluntary target for utilities in order to achieve 15% clean energy by 2025 [69]. After the revision, according to the new requirement, the targets of Phase I utilities and Phase II utilities are shown in Figure 18 [69,70,71].
In order to realize this mandatory 100% clean energy target, some targets and policies on solar and onshore wind farms, offshore wind farms, and energy storage have been announced by Virginia. Some highlights of the clean energy plan are shown in Figure 19.
3.2.5. Hawaii
Hawaii set a renewable portfolio standard in 2015. In this standard, each utility that sells electricity in Hawaii must set the mandatory target to realize the following percentages of “renewable electrical energy” sales [72]. The clean energy roadmap of Hawaii is shown in Figure 20.
As shown from the five representative states in the U.S., the focused types of clean energy policies follow the national clean energy policies. However, compared to the national clean energy policies, the targets determined by states are more specific and accurate (such as the energy storage requirement of California by 2020), which demonstrates that the enforceability of clean energy policies in states may be better than the federal government. In addition, the difference between the states on their enacting clean energy policies still exists due to the variety of clean energy types and the diversity of economic development degrees. For example, the clean energy policies that New York State focuses on increase the clean energies share in its generation mix. However, the clean energy policies of Washington State aim at forcing the utilities to eliminate coal from their state portfolios. The different focus of the clean energy policies will lead to the utilities or power providers adopting different schemes that affect the power consumption habit of the public and the related industries’ development. In the next section, the clean energy policies of representative utilities of the U.S are introduced to show their policy changes.
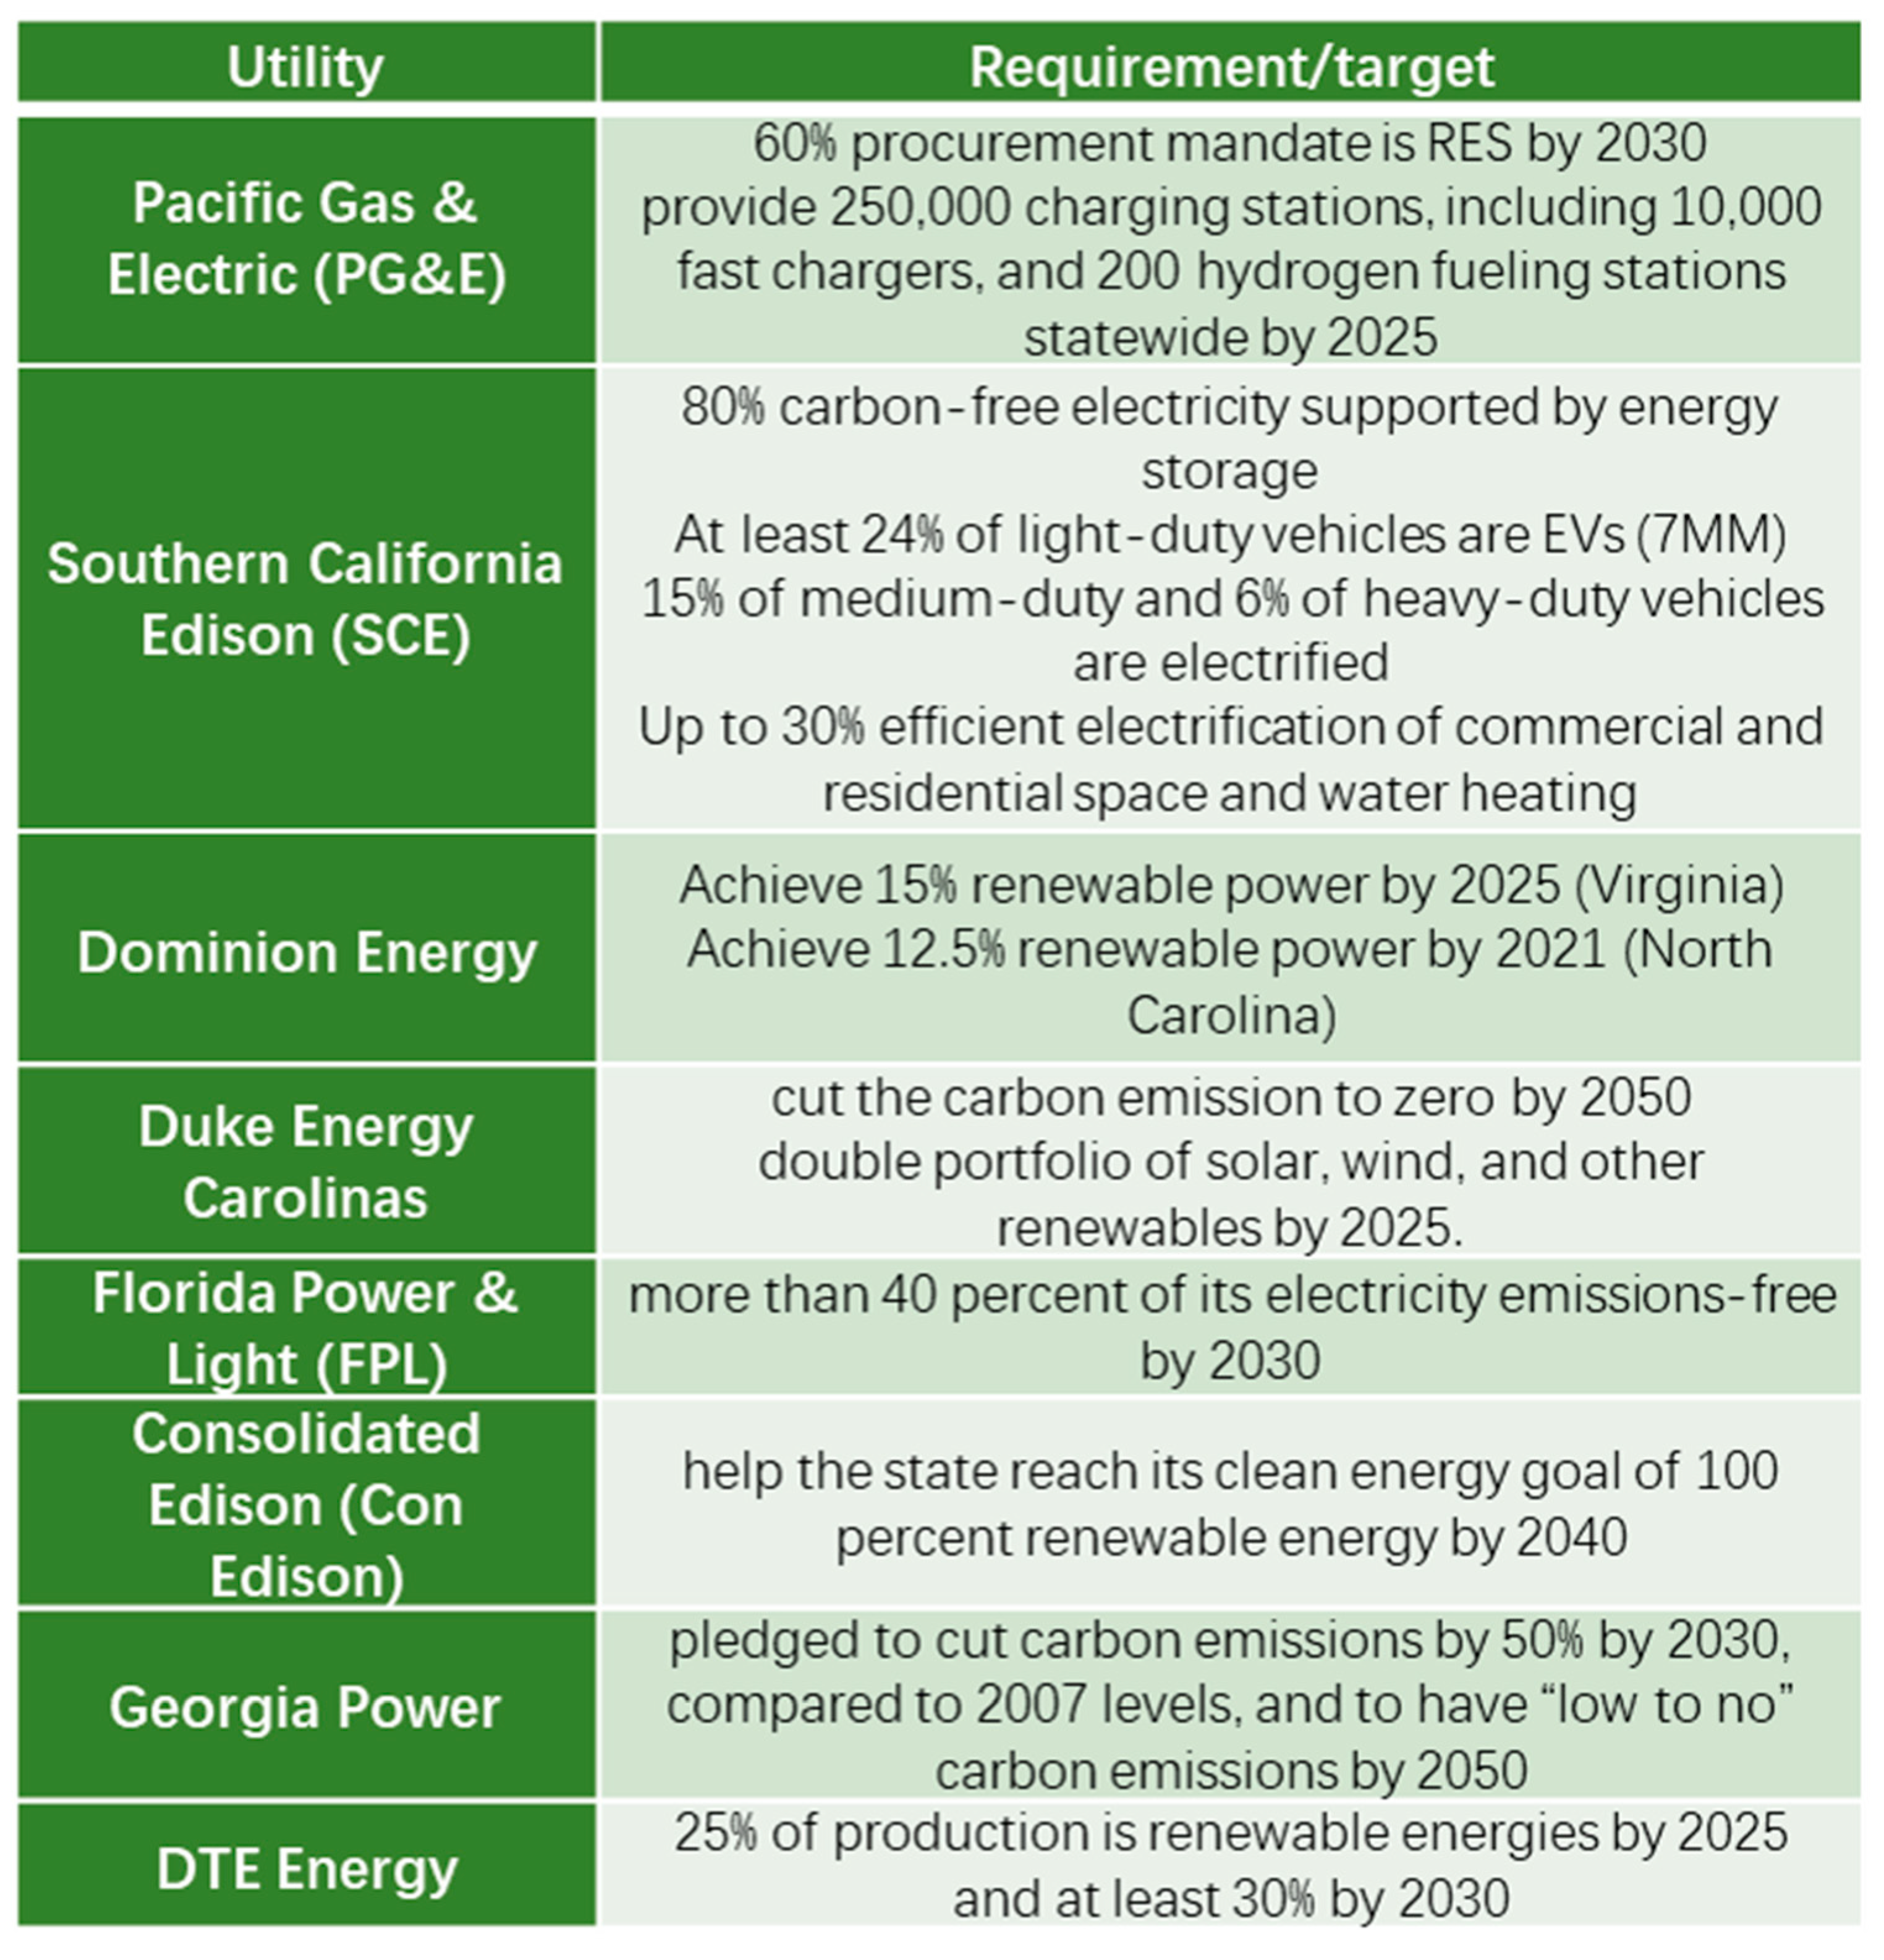
4. The Clean Energy Policy of U.S. Utilities
The implementation of state clean energy policies needs the cooperation of the utilities. This section discusses the clean energy policies of five representative utility companies that are leaders in clean energy development in the U.S.
4.1. Pacific Gas and Electric (PG&E)
As the largest electric power provider in California (and one of the largest combined natural gas and electric companies in the U.S.), the Pacific Gas and Electric Company (PG&E) has issued a comprehensive reorganization plan in order to strengthen the commitment of clean energy and the climate. Although PG&E is under bankruptcy protection and meets serious financial challenges, it is still ready to take leadership in guaranteeing a clean future for California and the U.S. [73].
In the reorganization plan, PG&E intends to support the state’s goals of 5,000,000 zero-emission vehicles (ZEV) on the road by 2030. It will need PG&E to provide about 250,000 charging stations, which will include more than ten thousand fast chargers, and two hundred hydrogen fueling stations by 2025. In addition, the utility plans to realize 60% clean energy of the total energy procurement by 2030. It is envisioned that the clean energy-related reorganization plan and investments of PG&E will play an important role in California’s clean energy future.
4.2. Southern California Edison (SCE)
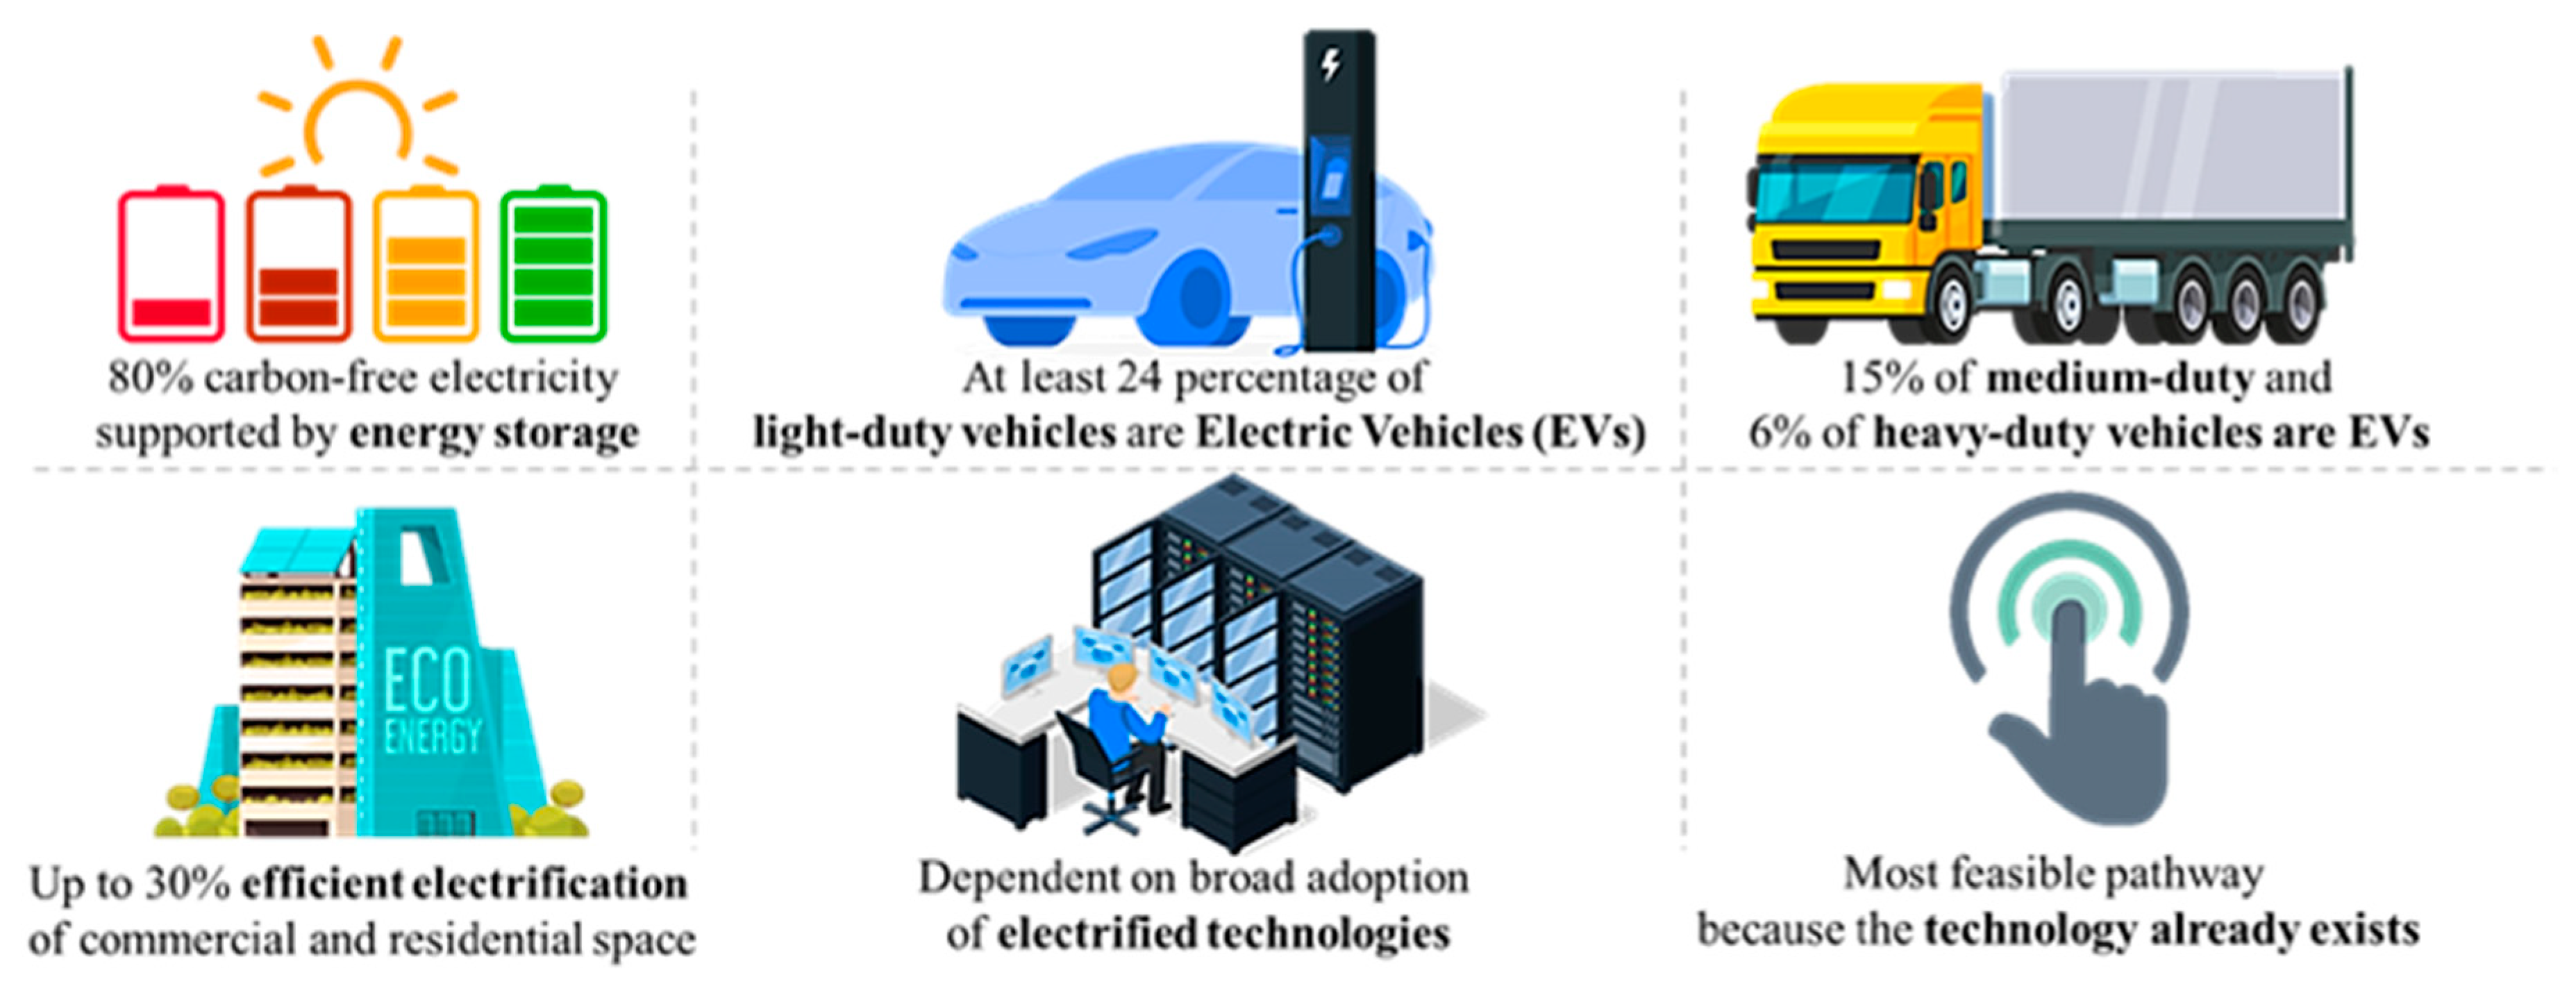
Southern California Edison (SCE) is the primary electric utility for most of Southern California, which provides more than 14 million people with electricity across approximately 50,000 square miles. SCE also presented a clean energy policy named the Clean Power and Electrification Pathway in order to reduce carbon dioxide emissions and air pollutants in California [74]. The objective of this plan is to reduce pollution and improve air quality for the future. The highlights of the Clean Power and Electrification Pathway until 2030 are summarized in Figure 21 [74].
4.3. Dominion Energy
As one of the largest utilities in Virginia and North Carolina, Dominion Energy has committed to meeting clean energy targets and standards set by the government of Virginia and North Carolina. The Dominion Energy clean energy plan proposed two realizable and measurable targets [69]:
- Achieving 15% renewable power by 2025 (Virginia);
- Achieving 12.5% renewable power by 2021 (North Carolina).
For supporting these standards through existing clean energy resources, Dominion Energy plans to develop new clean energy besides purchasing clean energy certificates.
4.4. Duke Energy Carolinas
Duke Energy Carolinas has announced a new clean energy policy, whose goal is to realize zero-carbon emissions from electricity generation by 2050. Duke Energy Carolinas plans to accelerate the recent goal by cutting greenhouse gas emissions by 50% or more from 2005 to 2030.
4.5. DTE Energy
DTE Energy has announced a clean energy plan to realize a 32 percent cut in carbon emissions by 2023. The first phase is to shut off three of five remaining fuel generation plants. The carbon emission cut plan aims at reducing carbon emission by 50 percent by the end of 2030 and 80 percent or more by the end of 2040. They also pledge to adopt 25 percent clean energy for production by 2025 and at least 30 percent by 2030.
The highlights of DTE’s proposed clean energy plan include traditional coal-fired plants shut-downs, carbon emission reduction, and clean energy development, which are summarized in Figure 23.
From the mentioned five representative utilities and Figure 24, it could be found that the clean energy policy focus of utilities is highly related to the available clean energy resources in each state. The clean energy policy formulation for most utilities is based on the Bills enacted by the state government, such as Dominion Energy. They set two different clean energy consumption goals for Virginia and North Carolina in order to meet different requirements determined by their own clean energy policies. These clean energy policies will be a guideline for their inner energy companies for determining future, mainly energy, technology. In addition, the developing focus of renewable energies of different utilities is related to the natural clean energy source in the states, thus from Figure 24, it could be seen that some states aim at using clean energy generation to replace conventional fossil fuel generation, while some states focus on energy saving and emission reduction. However, the clean policy pathways of most utilities are the same, which are planned to support clean energy capacities and generation increases in the state, boost the domestic job creation, and reduce the carbon emission. The achievement of these clean policy pathways will mainly be through market rules adjustment and tax deductions.
5. Gaps and Future Directions on Clean Energy Policies Review
In the process of reviewing the clean electricity policies from countries to utilities, this paper shows the values of the clean policy review. Firstly, it provides a reference for readers to easily obtain clean energy information. Secondly, the intuitive comparison in this paper indicates the difference of the clean energy policies between various countries, states in the U.S., and utilities. However, a number of gaps in this clean energy policies review were identified with many unanswered questions that need to be further addressed. Firstly, this paper indicates that the clean energy policies of the utilities are followed by the clean energy targets of states or countries. In fact, the electric market also plays an important role in policies promotion. However, the operation of the electric market is complex due to various types of generators, loads, and response resources participation. Thus, it is hard to clearly describe the stake between the clean energy policies implementation and electric market, which is valuable to be investigated in the future. In addition, public recognition has become a very critical factor to clean energy policies implementation. From reviewing, it could be seen that the optimum clean energy for a specific area may not be the final decision by the government. The acceptable level of the public becomes more and more important in clean energy policies determination. However, the quantitative analysis for the public recognition of clean energy policies has not received too much attention. This topic may be very interesting and significative for future research.
6. Conclusions
Clean energy policy influences the development of clean energy technologies and markets. The diversity of the scope, intensity, and comprehensiveness of clean energy policies in different utilities, states, and countries leads to the different development degrees of clean energy. This paper firstly introduced the clean energy policies on electricity of some countries who are positive on clean energy promotion. Then, taking the U.S. as an example, this paper presented the recent clean energy policies in representative states and utilities of the U.S. It can be seen from the results of the review and comparison that, firstly, due to the variety of clean energy types and the diversity of economic and social development degrees, the clean energy policies enacted by different countries have many differences. In addition, the clean energy policies of countries are more macroscopic and comprehensive, which involve the development of various clean energy technologies and future energy transition pathways. However, the practice and implementation of these clean energy policies need coordination from the various levels of governments and electric power companies. From comparing the results, it could be seen that, in the U.S., the clean energy policies determined by states are more specific and accurate compared to the national policies, which demonstrates that the enforceability of these clean energy policies may be better than the federal government. Besides, the aggressiveness degree of a state government’s clean energy policy depends on the economic level of the state. The clean energy policy focus is related to the available clean energy resources in each state. The implementation of states’ clean energy policies relies on utilities and power companies. The clean energy policy formulation for most utilities is based on the Bills enacted by the state government. Thus, the clean policy pathways of most utilities aim at supporting clean energy capacities and generation increases in the state, boosting domestic job creation, and reducing carbon emissions. These observations indicate that a comprehensive review and comparison are necessary and may help clean energy researchers and practitioners to understand clean energy policy determination, promotion, and implementation.
Author Contributions
conceptualization, K.S., H.X. and Y.L.; writing—original draft preparation, K.S., H.X., S.L. and F.Y.; writing—review and editing, S.Y. and Y.D.; visualization, F.Y. and W.W.; supervision, Y.L.; funding acquisition, Y.L. All authors have read and agreed to the published version of the manuscript.
Funding
This research was funded by the Engineering Research Center Program of the National Science Foundation and DOE under NSF award Number EEC-1041877 and the CURENT Industry Partnership Program.
Conflicts of Interest
The authors declare that we have no financial and personal relationships with other people or organizations that can inappropriately influence our work, there is no professional or other personal interest of any nature or kind in any product, service and/or company that could be construed as influencing the position presented in, or the review of, the manuscript entitled.
References
- Arthouros, Z. Global Status of Renewable Energy: REN21′s Renewables 2017 Global Status Report; REN21: Paris, France, 2017. [Google Scholar]
- Sun, K.; Li, K.J.; Pan, J.; Liu, Y.; Liu, Y. An optimal combined operation scheme for pumped storage and hybrid wind-photovoltaic complementary power generation system. Appl. Energy 2019, 242, 1155–1163. [Google Scholar] [CrossRef]
- Sun, K.; Li, K.; Lee, W.J.; Wang, Z.; Bao, W.; Liu, Z.; Wang, M. VSC-MTDC system integrating offshore wind farms based optimal distribution method for financial improvement on wind producers. IEEE Trans. Ind. Appl. 2019, 55, 2232–2240. [Google Scholar]
- IRENA. Untapped Potential for Climate Action: Renewable Energy in Nationally Determined Contributions. Available online: https://www.irena.org/publications/2017/Nov/Untapped-potential-for-climate-action-NDC (accessed on 30 November 2017).
- Liu, S.; Lin, Z.; Zhao, Y.; Liu, Y.; Ding, Y.; Zhang, B.; Yang, L.; Wang, Q.; White, S.E. Robust system separation strategy considering online wide-area coherency identification and uncertainties of renewable energy sources. IEEE Trans. Power Syst. 2020. [Google Scholar] [CrossRef]
- Liu, S.; Zhao, Y.; Lin, Z.; Liu, Y.; Ding, Y.; Yang, L.; Yi, S. Data-driven event detection of power systems based on unequal-interval reduction of PMU data and local outlier factor. IEEE Trans. Smart Grid 2020, 10, 1630–1643. [Google Scholar] [CrossRef]
- Sun, K.; Xiao, H.; Pan, J.; Liu, Y. A Station-hybrid HVDC System Structure and Control Strategies for Cross-seam Power Transmission. IEEE Trans. Power Syst. 2020. [Google Scholar] [CrossRef]
- UN Climate Change. NDC Registry. Available online: https://www4.unfccc.int/sites/ndcstaging/Pages/Home.aspx (accessed on 28 December 2018).
- Solangi, K.H.; Islamb, M.R.; Saidurab, R.; Rahimb, N.A.; Fayaz, H. A review on global solar energy policy. Renew. Sustain. Energy Rev. 2011, 15, 2149–2163. [Google Scholar] [CrossRef]
- Elavarasan, R.M.; Shafiullah, G.; Padmanaban, S.; Kumar, N.M.; Annam, A.; Vetrichelvan, A.M.; Miher-Popa, L.; Holm-Nielsen, J.B. A comprehensive review on renewable energy development, challenges, and policies of leading indian states with an international perspective. IEEE Access 2020, 8, 74432–74457. [Google Scholar] [CrossRef]
- Alookandeh, A.E.; Vaez-Zadeh, S. A comparative review of renewable energy potential, policy targets, and implementation in Iran. In Proceedings of the IEEE International Conference on Environment and Electrical Engineering and 2019 IEEE Industrial and Commercial Power Systems Europe (EEEIC/ICPS Europe), Genova, Italy, 10–14 June 2019; pp. 1–6. [Google Scholar]
- Fayaz, H.; Rahim, N.A.; Saidur, R.; Solangi, K.H.; Niaz, H.; Hossain, M.S. Solar energy policy: Malaysia vs developed countries. In Proceedings of the IEEE Conference on Clean Energy and Technology (CET), Kuala Lumpur, Malaysia, 27–29 June 2011; pp. 374–378. [Google Scholar]
- Steenkamp, L. A review of policy options for clean electricity supply in South Africa. In Proceedings of the 6th International Conference on Clean Electrical Power (ICCEP), Santa Margherita Ligure, Italy, 27–29 June 2017; pp. 94–102. [Google Scholar]
- Renewables Generated More than 40% of Britain’s Power in the First Three Months of the Year-Overtaking Fossil Fuels for the First Time. Available online: https://www.dailymail.co.uk/sciencetech/article-8340955/Renewables-generated-40-Britains-power-Q1-2020.html (accessed on 29 May 2020).
- UK Should Have 50% Renewables by 2030. Available online: https://renews.biz/59015/uk-should-have-50-renewables-by-2030/ (accessed on 28 March 2020).
- Reina, P. UK Sets 33% Offshore Wind Energy Goal by 2030. Available online: https://www.enr.com/articles/46486-uk-sets-33-offshore-wind-energy-goal-by-2030 (accessed on 28 March 2019).
- Gall, N.; Stanley, G. 40 GW by 2030? The UK Solar PV Market Outlook. Available online: https://www.solar-trade.org.uk/wp-content/uploads/2019/11/STA-2030-Deployment-forecast-final.pdf (accessed on 30 November 2019).
- Wentworth, A. UK Government Targets 70% Low-Emission Car Sales by 2030. Available online: http://www.climateaction.org/news/uk-government-targets-70-low-emission-car-sales-by-2030 (accessed on 29 July 2018).
- Verbruggen, S. Trying to Follow the Money to Grow Energy Storage. Available online: https://www.windpowermonthly.com/article/1669185/trying-follow-money-grow-energy-storage (accessed on 15 January 2020).
- Evans, S. Analysis: Record-Low Price for UK Offshore Wind Cheaper than Existing Gas Plants by 2023. Available online: https://www.carbonbrief.org/analysis-record-low-uk-offshore-wind-cheaper-than-existing-gas-plants-by-2023 (accessed on 10 September 2019).
- Lilly, C. Electric Car Market Statistics. Available online: https://www.nextgreencar.com/electric-cars/statistics/ (accessed on 20 September 2020).
- Germany’s Energy Consumption and Power Mix in Charts. Available online: https://www.cleanenergywire.org/factsheets/germanys-energy-consumption-and-power-mix-charts (accessed on 20 August 2020).
- IEA. Germany 2020 Energy Policy Review. Available online: https://www.iea.org/reports/germany-2020 (accessed on 20 February 2020).
- IEA Wind TCP/PWT Communications. Wind Energy in Germany. Available online: https://community.ieawind.org/about/member-activities/germany (accessed on 10 September 2020).
- Franke, A. A Million German EV Charge Points Needed by 2030: Merkel. Available online: https://www.spglobal.com/platts/en/market-insights/latest-news/electric-power/110419-a-million-german-ev-charge-points-needed-by-2030-merkel (accessed on 20 November 2019).
- Wehrmann, B. German Government Says Power Storage Capacity Could Grow More Than 50-fold by 2030. Available online: https://www.cleanenergywire.org/news/german-government-says-power-storage-capacity-could-grow-more-50-times-2030 (accessed on 20 August 2019).
- Liu, S.; You, S.; Yin, H.; Lin, Z.; Liu, Y.; Yao, W.; Sundaresh, L. Model-Free Data Authentication for Cyber Security in Power Systems. IEEE Trans. Smart Grid 2020, 11, 4565–4568. [Google Scholar] [CrossRef]
- Clean Energy Wire. German Onshore Wind Power–Output, Business and Perspectives. Available online: https://www.cleanenergywire.org/factsheets/german-onshore-wind-power-output-business-and-perspectives (accessed on 23 July 2020).
- Ministry of Foreign Affairs of Denmark. New Ambitious Danish Energy Agreement Secured. Available online: https://investindk.com/insights/new-ambitious-danish-energy-agreement (accessed on 20 May 2018).
- IRENA. 30 Years of Policies for Wind Energy: Lessons from Denmark. Available online: https://www.irena.org/documentdownloads/publications/gwec_denmark.pdf (accessed on 20 February 2013).
- Wikipedia. Solar Power in Denmark. Available online: https://en.wikipedia.org/wiki/Solar_power_in_Denmark (accessed on 20 September 2020).
- Levring, P. Denmark to Ban the Sale of Fossil Fuel Cars in 2030, Boost EV Sales. Available online: https://www.bloomberg.com/news/articles/2018-10-02/denmark-plans-2030-ban-on-fossil-fuel-car-sales-premier-says (accessed on 20 September 2020).
- 2020 Australian Energy Statistics. Available online: https://www.minister.industry.gov.au/ministers/taylor/media-releases/2020-australian-energy-statistics (accessed on 20 September 2020).
- Wikipedia. Energy Policy of Australia. Available online: https://en.wikipedia.org/wiki/Energy_policy_of_Australia (accessed on 20 September 2020).
- Clean Energy Council. Renewable Energy Target. Available online: https://www.cleanenergycouncil.org.au/advocacy-initiatives/renewable-energy-target (accessed on 20 September 2020).
- Cox, L. Australia Could Get 90% of Electricity from Renewables by 2040 with No Price Increase. Available online: https://www.theguardian.com/australia-news/2020/apr/29/australia-could-get-90-of-electricity-from-renewables-by-2040-with-no-price-increase (accessed on 15 April 2020).
- Keating, C. Renewables will Account for 48% of Australia’s Energy Mix by 2030–Federal Govt. Available online: https://www.pv-tech.org/news/renewables-will-make-up-48-of-australias-energy-mix-by-2030-governemnt (accessed on 29 December 2019).
- Morton, A. Half of All New Cars Sold in Australia by 2035 Will Be Electric, Forecast Predicts. Available online: https://www.theguardian.com/environment/2019/aug/14/half-of-all-new-cars-sold-in-australia-by-2035-will-be-electric-forecast (accessed on 30 August 2019).
- Australia’s Energy Storage to be 3000 mw by 2030. Available online: https://energystorageforum.com/news/australias-energy-storage-3000mw-2030 (accessed on 20 September 2020).
- Godfrey, B.; Dowling, R.; Forsyth, M.; Grafton, R.Q. The Role of Energy Storage: In Australia’s Future Energy Supply Mix. Available online: https://acola.org/wp-content/uploads/2018/08/role-energy-storage-future-australia.pdf (accessed on 30 August 2018).
- Göß, S. China in 2019: What Was the Energy System Like? Available online: https://blog.energybrainpool.com/en/china-in-2019-what-was-the-energy-system-like/ (accessed on 29 March 2020).
- National Renewable Energy Laboratory. Renewable Energy Policy in China: Overview. Available online: https://www.nrel.gov/docs/fy04osti/35786.pdf (accessed on 30 April 2004).
- Li, J. Renewable Energy Development in China. Available online: https://www.renewable-ei.org/pdfdownload/activities/S1_Li%20Junfeng.pdf (accessed on 29 March 2019).
- IRENA. Renewable Energy Prospects: China. Available online: https://www.irena.org/publications/2014/Nov/Renewable-Energy-Prospects-China (accessed on 30 November 2014).
- Lowder, K. China proposes 75% Increase to 2030 Renewable Energy Target. Available online: https://cleantechnica.com/2018/09/27/china-proposes-75-increase-to-2030-renewable-energy-target/ (accessed on 30 September 2018).
- Prosser, M. China is Taking the Worldwide Lead in Wind Power. Available online: https://singularityhub.com/2019/04/04/china-is-taking-the-worldwide-lead-in-wind-power/ (accessed on 30 April 2019).
- Fairley, P. Wind Could Provide 26% of China’s Electricity by 2030. Available online: https://spectrum.ieee.org/energywise/green-tech/wind/chinese-wind-power-cleared-for-2030-growth (accessed on 29 June 2016).
- GlobalData Energy. China to Lead Global Growth of Solar Photovoltaic Capacity to 2030. Available online: https://www.power-technology.com/comment/china-to-lead-global-growth-of-solar-photovoltaic-capacity-to-2030/ (accessed on 30 October 2019).
- China Explores Ambitious Goal for EV Sales by 2035. Available online: https://www.autonews.com/china/china-explores-ambitious-goal-ev-sales-2035 (accessed on 25 September 2019).
- Prasad, N.T. Solar’s Share in India’s Total Installed Power Capacity Reaches 9.6% at the End of 2019. Available online: https://mercomindia.com/solars-share-india-total-installed-power-capacity/ (accessed on 25 January 2020).
- Frangoul, A. India Has Some Huge Renewable Energy Goals. But Can They Be Achieved? Available online: https://www.cnbc.com/2020/03/03/india-has-some-huge-renewable-energy-goals-but-can-they-be-achieved.html (accessed on 30 March 2020).
- Buckley, T.; Shah, K. India’s Renewable Energy Policy Headwinds. Available online: https://ieefa.org/wp-content/uploads/2020/02/Indias-Renewable-Energy-Policy-Headwinds_February-2020.pdf (accessed on 25 February 2020).
- IEA. India 2020-Energy Policy Review. Available online: https://www.iea.org/reports/india-2020 (accessed on 20 September 2020).
- Wind Energy in India. Available online: https://indien.um.dk/en/innovation/sector-updates/renewable-energy/wind-energy-in-india/ (accessed on 20 September 2020).
- Wikipedia. Solar Power in India. Available online: https://en.wikipedia.org/wiki/Solar_power_in_India (accessed on 20 September 2020).
- ETEnergyWorld. Opinion: Energy Storage in India—A Perspective. Available online: https://energy.economictimes.indiatimes.com/news/power/opinion-energy-storage-in-india-a-perspective/76022409 (accessed on 25 May 2020).
- China Says It’s Already Met 2020 Climate Goals. Available online: https://nypost.com/2019/11/27/china-says-theyve-already-met-their-2020-climate-goals/ (accessed on 29 November 2019).
- Fleming, S. These 11 EU States Already Meet Their 2020 Renewable Energy Targets. Available online: https://www.weforum.org/agenda/2019/02/these-11-eu-states-already-meet-their-2020-renewable-energy-targets/ (accessed on 25 February 2019).
- Howes, S. Australia Will Not Hit Its 2020 Emissions Reduction Target till 2030. Available online: https://reneweconomy.com.au/australia-will-not-hit-its-2020-emissions-reduction-target-till-2030/ (accessed on 20 January 2020).
- National Conference of State. State Renewable Portfolio Standards and Goals, National Conference of State Legislatures, 17 April 2020. Available online: https://www.ncsl.org/research/energy/renewable-portfoliostandards.aspx (accessed on 20 September 2020).
- Database of State Incentives for Renewables and Efficiency. Renewable Portfolio Standards; State University: Raleigh, NC, USA, 2017. [Google Scholar]
- Barbose, G.L. U.S. Renewables Portfolio Standards 2019 Annual Status Update. Available online: https://emp.lbl.gov/publications/us-renewables-portfolio-standards-2 (accessed on 25 July 2019).
- California Senate Bill 100. Available online: https://www.energy.ca.gov/sb100 (accessed on 29 September 2018).
- LAO. Assessing California’s Climate Policies—Electricity Generation. Available online: https://lao.ca.gov/Publications/Report/4131 (accessed on 25 January 2020).
- NYISO. The Vision for a Greener Grid: Power Trends 2020. Available online: https://www.nyiso.com/-/press-release-7c-nyiso-releases-power-trends-2020-the-vision-for-a-greener-grid (accessed on 30 June 2020).
- Rogercaiazza. Toward a Clean Energy Future: A Strategic Outlook 2020–2023. Available online: https://pragmaticenvironmentalistofnewyork.blog/2020/02/20/nyserda-toward-a-clean-energy-future-a-strategic-outlook-2020-2023/ (accessed on 25 February 2020).
- Washington Senate Bill 5116. 2019. Available online: https://app.leg.wa.gov/billsummary?BillNumber=5116&Initiative=false&Year=2019 (accessed on 30 January 2019).
- Liu, S.; Cui, X.; Lin, Z.Z.; Lian, Z.; Lin, Z.; Wen, F.; Ding, Y.; Wang, Q.; Yang, L.; Jin, R.; et al. Practical method for mitigating three-phase unbalance based on data-driven user phase identification. IEEE Trans. Power Syst. 2020, 2, 1653–1657. [Google Scholar] [CrossRef]
- Dominion Energy. Renewable Generation. Available online: https://www.dominionenergy.com/company/making-energy/renewable-generation (accessed on 20 September 2020).
- Virginia Senate Bill 851. 2020. Available online: https://lis.virginia.gov/cgibin/legp604.exe?201+sum+SB851 (accessed on 15 January 2020).
- Virginia Executive Order Forty-Three. 2019. Available online: https://www.governor.virginia.gov/newsroom/allreleases/2019/september/headline-846745-en.html (accessed on 30 September 2019).
- Hawaii House Bill 623. 2015. Available online: https://www.capitol.hawaii.gov/session2015/bills/HB623_CD1_.pdf (accessed on 25 January 2015).
- Cavanagh, R. PG&E Reasserts Its Clean Energy Leadership. Available online: https://www.nrdc.org/experts/ralph-cavanagh/pge-reasserts-its-clean-energy-leadership (accessed on 25 February 2020).
- SCE. Clean Power and Electrification Pathway. Available online: https://www.sce.com/sites/default/files/inline-files/SCE_CleanPowerandElectrificationPathway_WHITEPAPER.pdf (accessed on 30 November 2017).
- Culbert, E. Duke Energy Aims to Achieve Net-Zero Carbon Emissions by 2050. Available online: https://news.duke-energy.com/releases/duke-energy-aims-to-achieve-net-zero-carbon-emissions-by-2050 (accessed on 25 September 2019).
- FPL. FPL Announces Groundbreaking ‘30-By-30’ Plan to Install more than 30 Million Solar Panels by 2030, Make Florida a World Leader in Solar Energy. Available online: http://newsroom.fpl.com/2019-01-16-FPL-announces-groundbreaking-30-by-30-plan-to-install-more-than-30-million-solar-panels-by-2030-make-Florida-a-world-leader-in-solar-energy (accessed on 30 January 2019).
- Kovaleski, D. Con Edison Releases Sustainability Report. Available online: https://dailyenergyinsider.com/news/25941-con-edison-releases-sustainability-report/ (accessed on 30 June 2020).
- Kempner, M. Georgia Power’s Parent Pledges ‘net zero’ Carbon Emissions by 2050. Available online: https://www.ajc.com/news/local/georgia-power-parent-pledges-net-zero-carbon-emissions-2050/LW5528Hib5O5HelrtejYYO/ (accessed on 31 May 2020).
- Thomas, V.M.; Mlade, J.; Borin, S.; Tindall, N.; Okwo1, A.; Dhamodharan, A. Reducing Greenhouse Gas Emissions in Atlanta. Available online: https://www2.isye.gatech.edu/~vthomas/reducing_ghg_emissions_atl.pdf (accessed on 29 May 2016).
- Greene, J. DTE Plans to Ramp up Renewables, Aiming for 50 Percent Cut in Carbon Emissions. Available online: https://www.crainsdetroit.com/energy/dte-plans-ramp-renewables-aiming-50-percent-cut-carbon-emissions (accessed on 30 March 2019).
Figure 1.
The energy mix of the UK by the end of the first quarter of 2020.

Figure 2.
The zero-emission targets from the National Infrastructure Commission (NIC) report.

Figure 3.
The energy mix of Germany by the end of the first half of 2020.

Figure 4.
The clean energy targets from the Climate Action Plan (CAP) 2050.

Figure 5.
The highlights of the Denmark energy agreement.

Figure 6.
The clean energy policies for realizing the Denmark energy agreement.

Figure 7.
The energy mix of Australia in 2020.

Figure 8.
The clean energy policy for realizing the Mandatory Renewable Energy Target (MRET).

Figure 9.
The energy mix of China by the end of 2019.

Figure 10.
The clean energy policies in China.

Figure 11.
The energy mix of India by the end of 2019.

Figure 12.
The clean energy policies of India in wind power, solar power, and energy storage.

Figure 13.
Summary of the clean energy policy of some countries.

Figure 14.
Renewable portfolio standards or voluntary goals of different states or territories.

Figure 15.
The detailed procurement requirements based on the interim target from the government board.
Figure 15.
The detailed procurement requirements based on the interim target from the government board.

Figure 16.
The clean energy roadmap of New York State (now to 2050).

Figure 17.
The target of Washington State on clean energy.

Figure 18.
The target of Virginia State on clean energy.

Figure 19.
The highlights of some of Virginia’s cleaning policies and plans.

Figure 20.
The clean energy roadmap of Hawaii.

Figure 21.
The highlights of the Clean Power and Electrification Pathway of South California Edison (SCE).
Figure 21.
The highlights of the Clean Power and Electrification Pathway of South California Edison (SCE).

Figure 22.
The highlights of Duke Energy’s proposed clean energy plan.

Figure 23.
The highlights of DTE’s proposed clean energy plan.

Figure 24.
Summary of the clean energy policy of utilities in the U.S.

© 2020 by the authors. Licensee MDPI, Basel, Switzerland. This article is an open access article distributed under the terms and conditions of the Creative Commons Attribution (CC BY) license (http://creativecommons.org/licenses/by/4.0/).
Share and Cite
MDPI and ACS Style
Sun, K.; Xiao, H.; Liu, S.; You, S.; Yang, F.; Dong, Y.; Wang, W.; Liu, Y. A Review of Clean Electricity Policies—From Countries to Utilities. Sustainability 2020, 12, 7946. https://doi.org/10.3390/su12197946
AMA Style
Sun K, Xiao H, Liu S, You S, Yang F, Dong Y, Wang W, Liu Y. A Review of Clean Electricity Policies—From Countries to Utilities. Sustainability. 2020; 12(19):7946. https://doi.org/10.3390/su12197946
Chicago/Turabian StyleSun, Kaiqi, Huangqing Xiao, Shengyuan Liu, Shutang You, Fan Yang, Yuqing Dong, Weikang Wang, and Yilu Liu. 2020. "A Review of Clean Electricity Policies—From Countries to Utilities" Sustainability 12, no. 19: 7946. https://doi.org/10.3390/su12197946
Note that from the first issue of 2016, this journal uses article numbers instead of page numbers. See further details here.