An Online Novel Two-Layered Photovoltaic Fault Monitoring Technique Based Upon the Thermal Signatures


1
Emirates Centre for Energy & Environment Research, United Arab Emirates University, 15551 Al Ain, UAE
2
Department of Architecture Engineering, College of Engineering, United Arab Emirates University, 15551 Al Ain, UAE
3
Department of Electrical and Electronic Engineering, Al Mareef University, Beirut 1001, Lebanon
4
Department of Electrical Engineering, National University of Computer and Emerging Sciences, Islamabad 44000, Pakistan
*
Author to whom correspondence should be addressed.
Sustainability 2020, 12(22), 9607; https://doi.org/10.3390/su12229607
Submission received: 7 September 2020
/
Revised: 4 October 2020
/
Accepted: 6 October 2020
/
Published: 18 November 2020
(This article belongs to the Collection Power System and Sustainability)
Abstract
:The share of photovoltaic (PV) power generation in the energy mix is increasing at a rapid pace with dramatically increasing capacity addition through utility-scale PV power plants globally. As PV plants are forecasted to be a major energy generator in the future, their reliable operation remains of primary concern due to a possibility of faults in a tremendously huge number of PV panels involved in power generation in larger plants. The precise detection of nature and the location of the faults along with a prompt remedial mechanism is deemed crucial for smoother power plant operation. The existing fault diagnostic methodologies based on thermal imaging of the panels as well as electrical parameters through inverter possess certain limitations. The current article deals with a novel fault diagnostic technique based on PV panel electrical parameters and junction temperatures that can precisely locate and categorize the faults. The proposed scheme has been tested on a 1.6 kW photovoltaic system for short circuit, open circuit, grounding, and partial shading faults. The proposed method showed improved accuracy compared to thermal imaging on panel scale fault detection, offering a possibility to adapt to the PV plant scale.
1. Introduction
The current trends of market penetration of renewable energy sources are predicted to minimize the reliance on conventional energy generation systems with annual capacity growth of 7.9% in 2018, as shown in Figure 1 [1]. Photovoltaic (PV) is the second leading candidate amongst all renewables and non-renewable resources with the highest new installations and a current installed capacity of 486 GW [1,2].
Although PV systems showed tremendous market compatibility and scalability, yet they face serious challenges in terms of maintaining a smooth power supply when applied to the utility-scale. One of the main challenges facing PV plants is the diversity, location, and clearance time of panel faults occurring frequently in the PV plants [3]. The PV generators are prone to faults on the generation side, so-called direct current (DC), and on-grid integration side, so-called alternating current (AC), connected through an inverter. The nature of faults frequently reported on the DC side include mismatch [4], interconnection and connection [5], earth [6], arc [7], line to line [8], bypass diode [9], short circuit (SC) and open circuit (OC) [10], maximum power point tracking (MPPT) [11], and degradation [12]. The rate of fault occurrences increases as the panels degrade over time, reaching up to 0.8% per year in the worst case [13]. Since the PV produces constantly varying electrical power depending on the weather conditions, the associated electrical and thermal parameters constantly keep varying that renders an enormous complexity to determine the nature of faults [14]. Additionally, with several panels being connected in series as strings while the strings are connected in parallel as arrays that feeds to an inverter, it is impossible to detect faults in individual panels based on string parameters [15]. Although the inverter can predict a fault in the string and get disconnected, it requires a manual inspection to find out the origin of the fault at a panel level, which consumes a tremendous amount of time, delaying the fault clearance [16]. To assure the efficient and reliable power supply, the fault should be diagnosed and cleared with a minimum time delay.
Several fault monitoring methodologies ranging from manual observation to fully automated diagnosis are currently being practiced. Generally, these techniques rely on the difference between simulated and measured PV parameters to predict the fault. However, these monitoring methods are unable to identify fault nature [17,18]. The power factor-based fault detection technique is utilized to minimize the system cost, but unable to localize the faults at the modular level [19]. A sensor network-based (online diagnostic) method is adopted to predict the fault at the module level. Although the modular faults were detected efficiently, however, the system cost is the main constraint due to the inclusion of several sensors [20]. A low coast web-based fault monitoring approach is studied in [21] for a stand-alone PV system using the internet of things (IoT). Though several faults are localized and classified, the technique implementation to the plant-scale solar power plant still needs to be investigated. Artificial neural networks (ANN) based fault diagnostic approach is discussed in [22]. The PV system parameters are estimated to rely on the historical data by considering the irradiance and temperature as input while power as output. Although a set of faults is detected effectively, the established model is limited for a specific type of fault, and fault response time poses a serious challenge to the PV system. In [23], thermal image analysis in conjunction with the convolutional neural network-based structure are described to monitor the hotspots in PV modules. The limitation of the technique is the non-uniform irradiance and environmental factors, e.g., soiling, shading which can affect the efficiency of the method. A thermal parameters-based technique is introduced in [24], which relies on the front and junction box temperature to reflect the fault at the module level. The drawback of this monitoring technique is fault localization and its ability to detect a limited number of faults. Furthermore, the front surface thermal value can be affected by various constraints, e.g., irradiance, dirt/dust, shading, and high ambient temperature as described in [25]. An efficient online hybrid (electrical and thermal) parameter fault monitoring approach is discussed in [26]. Though the technique effectively helped localize and distinguish the faults with reasonable cost employing fewer sensors, its applicability is only for fewer faults.
Recapitulating, an efficient and accurate online fault monitoring technique is necessary that could localize and distinguish the faults on the module level. The cost factor should be minimized and can be integrated without affecting solar module energy generation capacity. In this research work, an online thermal parameters-based monitoring technique is studied. A number of fault conditions, short circuit, open circuit, ground, and partial shading, are investigated. The validation and comparison of the proposed technique is done through the thermography. The employed technique showed promising and improved results in comparison with the currently used methods in terms of localization, classification, reliability, and fault response time.
This paper is categorized as follows. Section 1 discusses the previously employed techniques from manual observation to most advanced fault monitoring methods, their working principles, and limitations. Section 2 describes the experimental setup methodology along with the required sensors and cameras for sensing through imaging purposes. Section 3 discusses the results of various fault conditions and their validation through thermal image analysis. Section 4 involves the discussion of results achieved through the proposed scheme and its comparison with the currently employed fault monitoring methods. Section 5 presents the overall investigation results and future enhancement in the purposed research work.
2. Experimental Methodology
A 1.6 kW PV system is designed and installed at the Renewable Energy laboratory at the United Arab Emirates University as shown in Figure 2 to evaluate the effectiveness of the proposed fault monitoring technique. The system comprises of 10 polycrystalline PV panels from ReGen Power having I-V characteristics summarized in Table 1 with a peak power capacity of 160 watts each. The PV panels are arranged in two parallel arrays with a peak power capacity of 0.83 kilowatts comprised of five PV panels in each array connected in series. The maximum voltage of 213.6 volts is achieved through the module series connection, and output current maximization of 9.18 ampere is attained through the array’s parallel connection.
Where Pmax, Vmax, Imax, Voc, and Isc represent maximum output power, voltage, current at the maximum power point, open-circuit voltage, and short circuit current, respectively. The generated PV system power is dissipated through a 2 kW DC load employing 20 power resistors with a dissipation capacity of 100 W each.
An on-site weather station (Devis Vantage Pro 2) was installed to monitor weather parameters of solar radiation intensity, ambient temperature, and wind speed as shown in Figure 3b. The weather data was measured to compare the experimentally measured parameters with the predicted model parameters to confirm the effect of the fault on the panel parameters.
Initially, each module is individually calibrated at standard test conditions for the power and temperature to confirm their state of health. The fault is induced randomly in the PV modules and the response is recorded in terms of produced PV thermal parameters (temperature). The temperature is measured at the PV front surface, rare surface, and junction box through a k-type thermocouple. The measured data is recorded in the NI based data acquisition system (NI-cDAQ™-9178) employing thermocouple module NI9213 and current/voltage module NI9229 interfaced with LABVIEW (LABVIEW 2014). Simultaneously, the array was tested through thermal imaging employing FLIR-E63900 as shown in Figure 3a to compare the efficacy of the proposed technique with an established technique in practice. The specifications of the measurement tools are detailed in Table 2.
The data acquisition time ranged from 08:00 a.m. to 04:00 p.m. in an attempt to monitor the full day effect.
An algorithm is developed and tested to declare the fault on the host computer to confirm the validity of the proposed method as shown in Figure 4.
Where Th indicates the healthy module temperature and Tj represents faulty module thermal values. The measurement method for the fault monitoring process is shown in Figure 5. As shown in Figure 5, sensors are connected to the PV modules. Module rear and front surfaces temperature are represented by red and green discontinued lines while junction box temperature values are indicated by blue lines, respectively. Sensors are interfaced with the data logger, which is linked to the monitoring computer through the LABVIEW program. A fault is induced in one of the PV modules, and its response is analyzed through the measurement of thermal values of the front surface, back surface, and junction box. These temperature measurements are then compared to the pre-defined healthy solar module thermal measurements under standard test conditions. The resulting deviation in the thermal behavior between the healthy and faulty modules is declared as a fault. The fault classification is indicated according to pre-set thermal ranges as defined in the flow diagram in Figure 4.
Furthermore, the technique is validated through thermal imaging by scanning the solar module front surface thermal behavior through a thermal imaging camera as shown in Figure 3a. Through the thermal imaging camera, the hotspot in the solar module is detected, and these measurements are compared to the developed novel two-layered technique.
3. Results
In this proposed two-layered thermal signature-based method, several fault conditions, SC, OC, grounded, and partial shading, are investigated. All the measurements are carried out through thermocouples and validation of the technique is performed by employing the thermal imaging camera. The developed scheme is implemented in the renewable energy laboratory at United Arab Emirates University, United Arab Emirates.
3.1. Short Circuit Faults
The thermal behavior of the healthy and faulty (SC) PV module is shown in Figure 6. In Figure 6, the red dotted line indicates the junction box temperature values while blue, green, and purple represent the front and back surface temperature measurements, respectively. SC fault is induced in one of the PV modules in the array, and its thermal behavior is studied and the fault is classified, as explained in the flow diagram in Figure 4. Under normal operating conditions, the junction box thermal characteristics of the healthy module (HM) and faulty module (FM) are similar. The variation in thermal behavior arises as the short circuit is induced in one of the modules, as shown in Figure 5. The solar module cells operate near maximum power point tracking (MPPT), where the magnitude of dI/dV is higher. The difference in junction temperature is due to the difference between the cell SC current (Isc,cell) with individual solar cell current, Isc,mod. The cells that have a higher value of Isc,cell are operated at positive voltage indicators to minimize the current, while lower value Isc,cell might operate as a negative voltage indicator to enhance the current. The accumulative sum of all the voltage is zero, in response to which the output power flow from the module is zero. The generated power of each cell is dissipated at the negative ones [14,27]. The reason for this variability is much evident near Isc, the magnitude of dI/dV is small. Consequently, a greater voltage difference is necessary to minimize the smaller difference in Isc,cell. A higher voltage gap produced a greater power difference, and as a result, higher thermal reading is recorded at the junction box of the solar module.
3.2. Short Circuit Faults Validation through Thermography
The technique is validated through the thermography by measuring the thermal behavior of the PV panel front surface [28]. The front surface temperature readings of healthy and faulty modules are recorded through the thermal camera as shown in Figure 7.
Results in Figure 7a,b indicates the temperature reading of the healthy and faulty PV modules, with an average difference in the temperature value of Tj-Th ≥5 °C. The higher temperature value is due to the higher power flow in the external circuitry.
3.3. Ground Faults
A ground fault is induced in one of the PV arrays, and its thermal behavior is monitored through the front, back, and junction box values according to the developed novel technique as shown in Figure 8. Results indicate the difference in the junction box temperature between the healthy and grounded modules is due to the excessive power flow provided by the shorter path. The healthy module exhibits similar thermal characteristics as explained in the case of the short circuit, but the grounded module showed higher thermal behavior. The recorded average temperature difference is in the range of Tj-Th ≤3 °C, while in the case of a short circuit, the average temperature difference was between the Tj-Th ≥5 °C.
3.4. Ground Faults Validation through Thermography
The technique is validated through the thermography of the solar module front surfaces as shown in Figure 9. Figure 9a,b represents the healthy and faulty module’s front surface thermal characteristics, respectively. The grounded panel shows higher thermal values due to the higher current flow through the available shorter path as discussed in the case of short circuit fault.
3.5. Open Circuit Faults
An OC fault is induced in the array and its thermal effects are studied. The healthy and faulty module’s thermal behavior is shown in Figure 10. As indicated in Figure 10, the thermal behavior of the healthy module is identical, but the faulty (OC) module junction temperature shows the lower temperature readings. The reason being the panels are connected in series, so by disconnecting the panel, there is no output power flow. The fault is monitored according to the flow diagram as shown in Figure 4. The average difference in thermal value between the healthy and faulty PV modules is Th-Tj ≥4 °C.
3.6. Open Circuit Circuit Faults Validation through Thermography
The technique is validated through the thermal imaging of the healthy and faulty (OC) module as shown in Figure 11. Figure 11a,b exhibit the thermal measurements of the healthy and faulty module, respectively. Results indicate that the faulty and healthy modules showed similar temperature values due to the disconnection of a module in the array, and the fault is not detected through thermography, which demonstrates that the proposed technique is effective compared to thermography in this particular fault.
3.7. Partial Shading Faults
The partially shaded fault is induced by covering one of the modules, and thermal readings are monitored. Results in Figure 12 indicate that shaded module junction box temperature values are less than healthy module temperature value. By shading the module, the module cell’s output decreases proportionally by the amount of shading. Consequently, the output power flow was restricted to a lower value, which resulted in the lower thermal readings, as explained in Figure 4. The fault is detected through the average difference of temperature measurements between the healthy and faulty panel, and it is in the range of Th-Tj ≤3.
All the faults and their respective temperature measurements through thermography and developed novel thermal signature techniques are summarized in Table 3.
4. Discussion
Several fault conditions including short circuits, open circuit, grounding, and partial shading are investigated through the solar module thermal signatures and validated by thermography. Solar module front and back surfaces, and junction box temperature measurements are recorded through the data logger on the computer. Faults are monitored and localized based upon the pre-defined thermal ranges for individual faults types as described in Table 3. Through this technique, the faults are precisely and efficiently diagnosed on the panel level with much faster fault diagnostic response time as compared to the currently employed monitoring techniques, e.g., analytical and thermography [29,30]. It is evident from Table 3 that the thermal behavior recorded through the developed monitoring method is more precise than the thermography, as discussed in [28]. For instance, short circuit thermal values the temperature difference in more than 5 °C, while in the thermography it was 4.7 °C. Ground fault exhibits a temperature difference of 4–5 °C, but thermal measurements recorded through thermography show a deviation of 2.2 °C from healthy solar modules. In the open-circuit case, the fluctuations in the thermal behavior between the healthy and fault modules are 4 °C and 0.9 °C in the case of novel two-layered thermal signature technique and thermography, respectively. The deviation in recorded temperature values in thermography can be attributed to many real-time constraints, e.g., irradiance, dirt/dust, shading, and high ambient temperature, as discussed in [25]. The fault is not detected in the open circuit scenario through the thermography while it showed promising results in the case of the proposed two-layered thermal signature monitoring technique.
5. Conclusions
An online novel cost-effective thermal signature-based scheme was introduced for fault study in the PV system. The scheme was implemented on a 1.6 kW PV system and based upon the comparison of the thermal signatures between the healthy and faulty modules. National Instrument data collection system interface with the LABVIEW program was employed along with the weather data vintage Pro 2. Various fault conditions were considered, e.g., open and short circuit, ground fault, and partially shaded faults. The proposed scheme showed promising results for fault monitoring and diagnostic. The validation of the thermal-based scheme was done through the thermography. Results indicated that the developed technique is more effective than thermal imaging, which cannot monitor the open circuit fault.
Furthermore, in the future, an automatic fault monitoring system will be introduced based upon the thermal parameters which can diagnose and disconnect the faulty modules automatically if required.
Author Contributions
Q.N. conceive the experiment and prepared the original draft, A.H. supervises and advice the overall research work and review the original draft. A.A.F. conceptualizes the research work and defines the basic research terms, R.R. defines the research methodology and edited the draft. All authors have read and agreed to the published version of the manuscript.
Funding
This research was funded by the ”United Arab Emirates University” under “Emirates Centre for Energy and Research”, grant number 31R106 ”.
Conflicts of Interest
The authors declare no conflict of interest.
Nomenclature
| Abbreviations | |
| AC | Alternating Current |
| DC | Direct Current |
| FM | Faulty Module |
| GF | Ground Fault |
| HM | Healthy Module |
| MPPT | Maximum Power Point Tracking |
| OC | Open Current |
| PV | Photovoltaic |
| SC | Short Circuit |
| Subscripts | |
| Ipm | Current at Maximum Power |
| Isc | Short Circuit Current |
| Isc,cell | Cell Short Circuit Current |
| Pcell | Cell Output Power |
| Pmax | Maximum Output Power |
| Tcell | Cell Temperature |
| Vpm | Voltage at Maximum Power |
| Voc | Open Circuit Voltage |
| Vcell | Cell Voltage |
References
- Available online: https://www.irena.org/newsroom/pressreleases/2019/Apr/Renewable-Energy-Now-Accounts-for-a-Third-of-Global-Power-Capacity (accessed on 9 October 2020).
- Available online: https://www.bp.com/en/global/corporate/energy-economics/statistical-review-of-world-energy/renewable-energy.html (accessed on 9 October 2020).
- Araneo, R.; Lammens, S.; Grossi, M.; Bertone, S. EMC Issues in High-Power Grid-Connected Photovoltaic Plants. IEEE Trans. Electromagn. Compat. 2009, 51, 639–648. [Google Scholar] [CrossRef]
- Rakesh, N.; Banerjee, S.; Subramaniam, S.; Babu, N. A simplified method for fault detection and identification of mismatch modules and strings in a grid-tied solar photovoltaic system. Int. J. Emerg. Electr. Power Syst. 2020. [Google Scholar] [CrossRef]
- Gul, S.; Haq, A.U.; Jalal, M.; Anjum, A.; Khalil, I.U. A Unified Approach for Analysis of Faults in Different Configurations of PV Arrays and Its Impact on Power Grid. Energies 2019, 13, 156. [Google Scholar] [CrossRef] [Green Version]
- Zhang, Y.; Yu, M.; Xia, Y.; Wei, W. DG-side earth fault tolerance enhancement based on topology improvement and common and differential mode control strategy. J. Power Electron. 2020, 20, 1055–1065. [Google Scholar] [CrossRef]
- Fenz, W.; Thumfart, S.; Yatchak, R.; Roitner, H.; Hofer, B. Detection of Arc Faults in PV Systems Using Compressed Sensing. IEEE J. Photovoltaics 2020, 10, 676–684. [Google Scholar] [CrossRef]
- Balamurugan, M.A.; Ranjith, M.S. Faults analysis in pv array based on pre-turn on/off condition of the pv inverter. J. Crit. Rev. 2020, 7, 2063–2071. [Google Scholar]
- Mohammed, H.; Kumar, M.; Gupta, R. Bypass diode effect on temperature distribution in crystalline silicon photovoltaic module under partial shading. Sol. Energy 2020, 208, 182–194. [Google Scholar] [CrossRef]
- Zaki, S.A.; Zhu, H.; Yao, J.; Sayed, A.R.; Abdelbaky, M.A. Detection and Localization the Open and Short Circuit Faults in PV System: A MILP Approach. In Proceedings of the 2020 Asia Energy and Electrical Engineering Symposium (AEEES); Institute of Electrical and Electronics Engineers (IEEE): New Jersey, NJ, USA, 2020; pp. 187–193. [Google Scholar]
- Zou, Y.; Yan, F.; Wang, X.; Zhang, J. An efficient fuzzy logic control algorithm for photovoltaic maximum power point tracking under partial shading condition. J. Frankl. Inst. 2020, 357, 3135–3149. [Google Scholar] [CrossRef]
- Dhimish, M.; AlRashidi, A. Photovoltaic Degradation Rate Affected by Different Weather Conditions: A Case Study Based on PV Systems in the UK and Australia. Electron. 2020, 9, 650. [Google Scholar] [CrossRef] [Green Version]
- Wohlgemuth, J.H.; Kurtz, S. Using accelerated testing to predict module reliability. In Proceedings of the 2011 37th IEEE Photovoltaic Specialists Conference, Washington, WA, USA, 19–24 June 2011; pp. 3601–3605. [Google Scholar]
- Kurukuru, V.S.B.; Blaabjerg, F.; Khan, M.A.; Haque, A. A Novel Fault Classification Approach for Photovoltaic Systems. Energies 2020, 13, 308. [Google Scholar] [CrossRef] [Green Version]
- Karimi, M.; Samet, H.; Ghanbari, T.; Moshksar, E. A current based approach for hotspot detection in photovoltaic strings. Int. Trans. Electr. Energy Syst. 2020. [Google Scholar] [CrossRef]
- Samara, S.; Natsheh, E. Intelligent PV Panels Fault Diagnosis Method Based on NARX Network and Linguistic Fuzzy Rule-Based Systems. Sustainability 2020, 12, 2011. [Google Scholar] [CrossRef] [Green Version]
- Whaley, C. Best Practices in Photovoltaic System Operations and Maintenance: 2nd Edition. Engineering 2016. [Google Scholar] [CrossRef] [Green Version]
- Klise, G.T.; Balfour, J.R.; Keating, T.J. Solar PV O&M Standards and Best Practices–Existing Gaps and Improvement Efforts; Sandia National Lab.(SNL-NM): Albuquerque, NM, USA, 2014. [Google Scholar]
- Chine, W.; Mellit, A.; Pavan, A.M.; Kalogirou, S. Fault detection method for grid-connected photovoltaic plants. Renew. Energy 2014, 66, 99–110. [Google Scholar] [CrossRef]
- Ayesh, S.; Ramesh, P.; Ramakrishnan, S. Design of wireless sensor network for monitoring the performance of photovoltaic panel. In 2017 Trends in Industrial Measurement and Automation (TIMA); IEEE: New York, NY, USA, 2017; pp. 1–6. [Google Scholar]
- Mellit, A.; Hamied, A.; Lughi, V.; Pavan, A.M. A Low-Cost Monitoring and Fault Detection System for Stand-Alone Photovoltaic Systems Using IoT Technique. In Lecture Notes in Electrical Engineering; Springer Science and Business Media LLC: Philadelphia, PA, USA, 2020; pp. 349–358. [Google Scholar]
- Lazzaretti, A.E.; Costa, C.; Rodrigues, M.; Yamada, G.; Lexinoski, G.; Moritz, G.; Oroski, E.; Goes, R.; Linhares, R.R.; Stadzisz, P.C.; et al. A Monitoring System for Online Fault Detection and Classification in Photovoltaic Plants. Sensors 2020, 20, 4688. [Google Scholar] [CrossRef] [PubMed]
- Herraiz, Álvaro, H.; Marugán, A.P.; Márquez, F.P.G. Photovoltaic plant condition monitoring using thermal images analysis by convolutional neural network-based structure. Renew. Energy 2020, 153, 334–348. [Google Scholar] [CrossRef] [Green Version]
- Sukwhan, K.O.; Youngseok, J.U.; Gi-Hwan, K.A.; Youngchul, J.U.; Hwang, H.; Junghun, S.O.; Hee-Eun, S.O. Korea Institute of Energy Research KIER, Assignee. Photovoltaic System Having Fault Diagnosis Apparatus, and Fault Diagnosis Method for Photovoltaic System. US Patent 10,389,300, 2019. Available online: https://patentswarm.com/patents/US10389300B2 (accessed on 17 October 2020).
- Ozemoya, A.; Swart, J.; Pienaar, C.; Schoeman, R. Factors impacting on the surface temperature of a PV panel. Sensors 2013, 100, 12. [Google Scholar]
- Navid, Q.; Hassan, A.; Fardoun, A.A.; Ramzan, R. An Online Novel Two-Layered Photovoltaic Fault Monitoring Technique Based Upon The Hybrid Parameters. In Proceedings of the 2019 4th International Conference on Smart and Sustainable Technologies (SpliTech), Split, Croatia, 18–21 June 2019; pp. 1–5. [Google Scholar]
- Cotfas, D.T.; Cotfas, P.A.; Machidon, O.M. Study of Temperature Coefficients for Parameters of Photovoltaic Cells. Int. J. Photoenergy 2018, 2018, 1–12. [Google Scholar] [CrossRef] [Green Version]
- Hu, Y.; Cao, W.; Ma, J.; Finney, S.J.; Li, D. Identifying PV Module Mismatch Faults by a Thermography-Based Temperature Distribution Analysis. IEEE Trans. Device Mater. Reliab. 2014, 14, 951–960. [Google Scholar] [CrossRef] [Green Version]
- Balasubramani, G.; Thangavelu, V.; Chinnusamy, M.; Subramaniam, U.; Padmanaban, S.; Mihet-Popa, L. Infrared Thermography Based Defects Testing of Solar Photovoltaic Panel with Fuzzy Rule-Based Evaluation. Energies 2020, 13, 1343. [Google Scholar] [CrossRef] [Green Version]
- Hussain, M.; Dhimish, M.; Titarenko, S.; Mather, P. Artificial neural network based photovoltaic fault detection algorithm integrating two bi-directional input parameters. Renew. Energy 2020, 155, 1272–1292. [Google Scholar] [CrossRef]
Figure 1.
Renewable energy capacity growth [1].
Figure 1.
Renewable energy capacity growth [1].
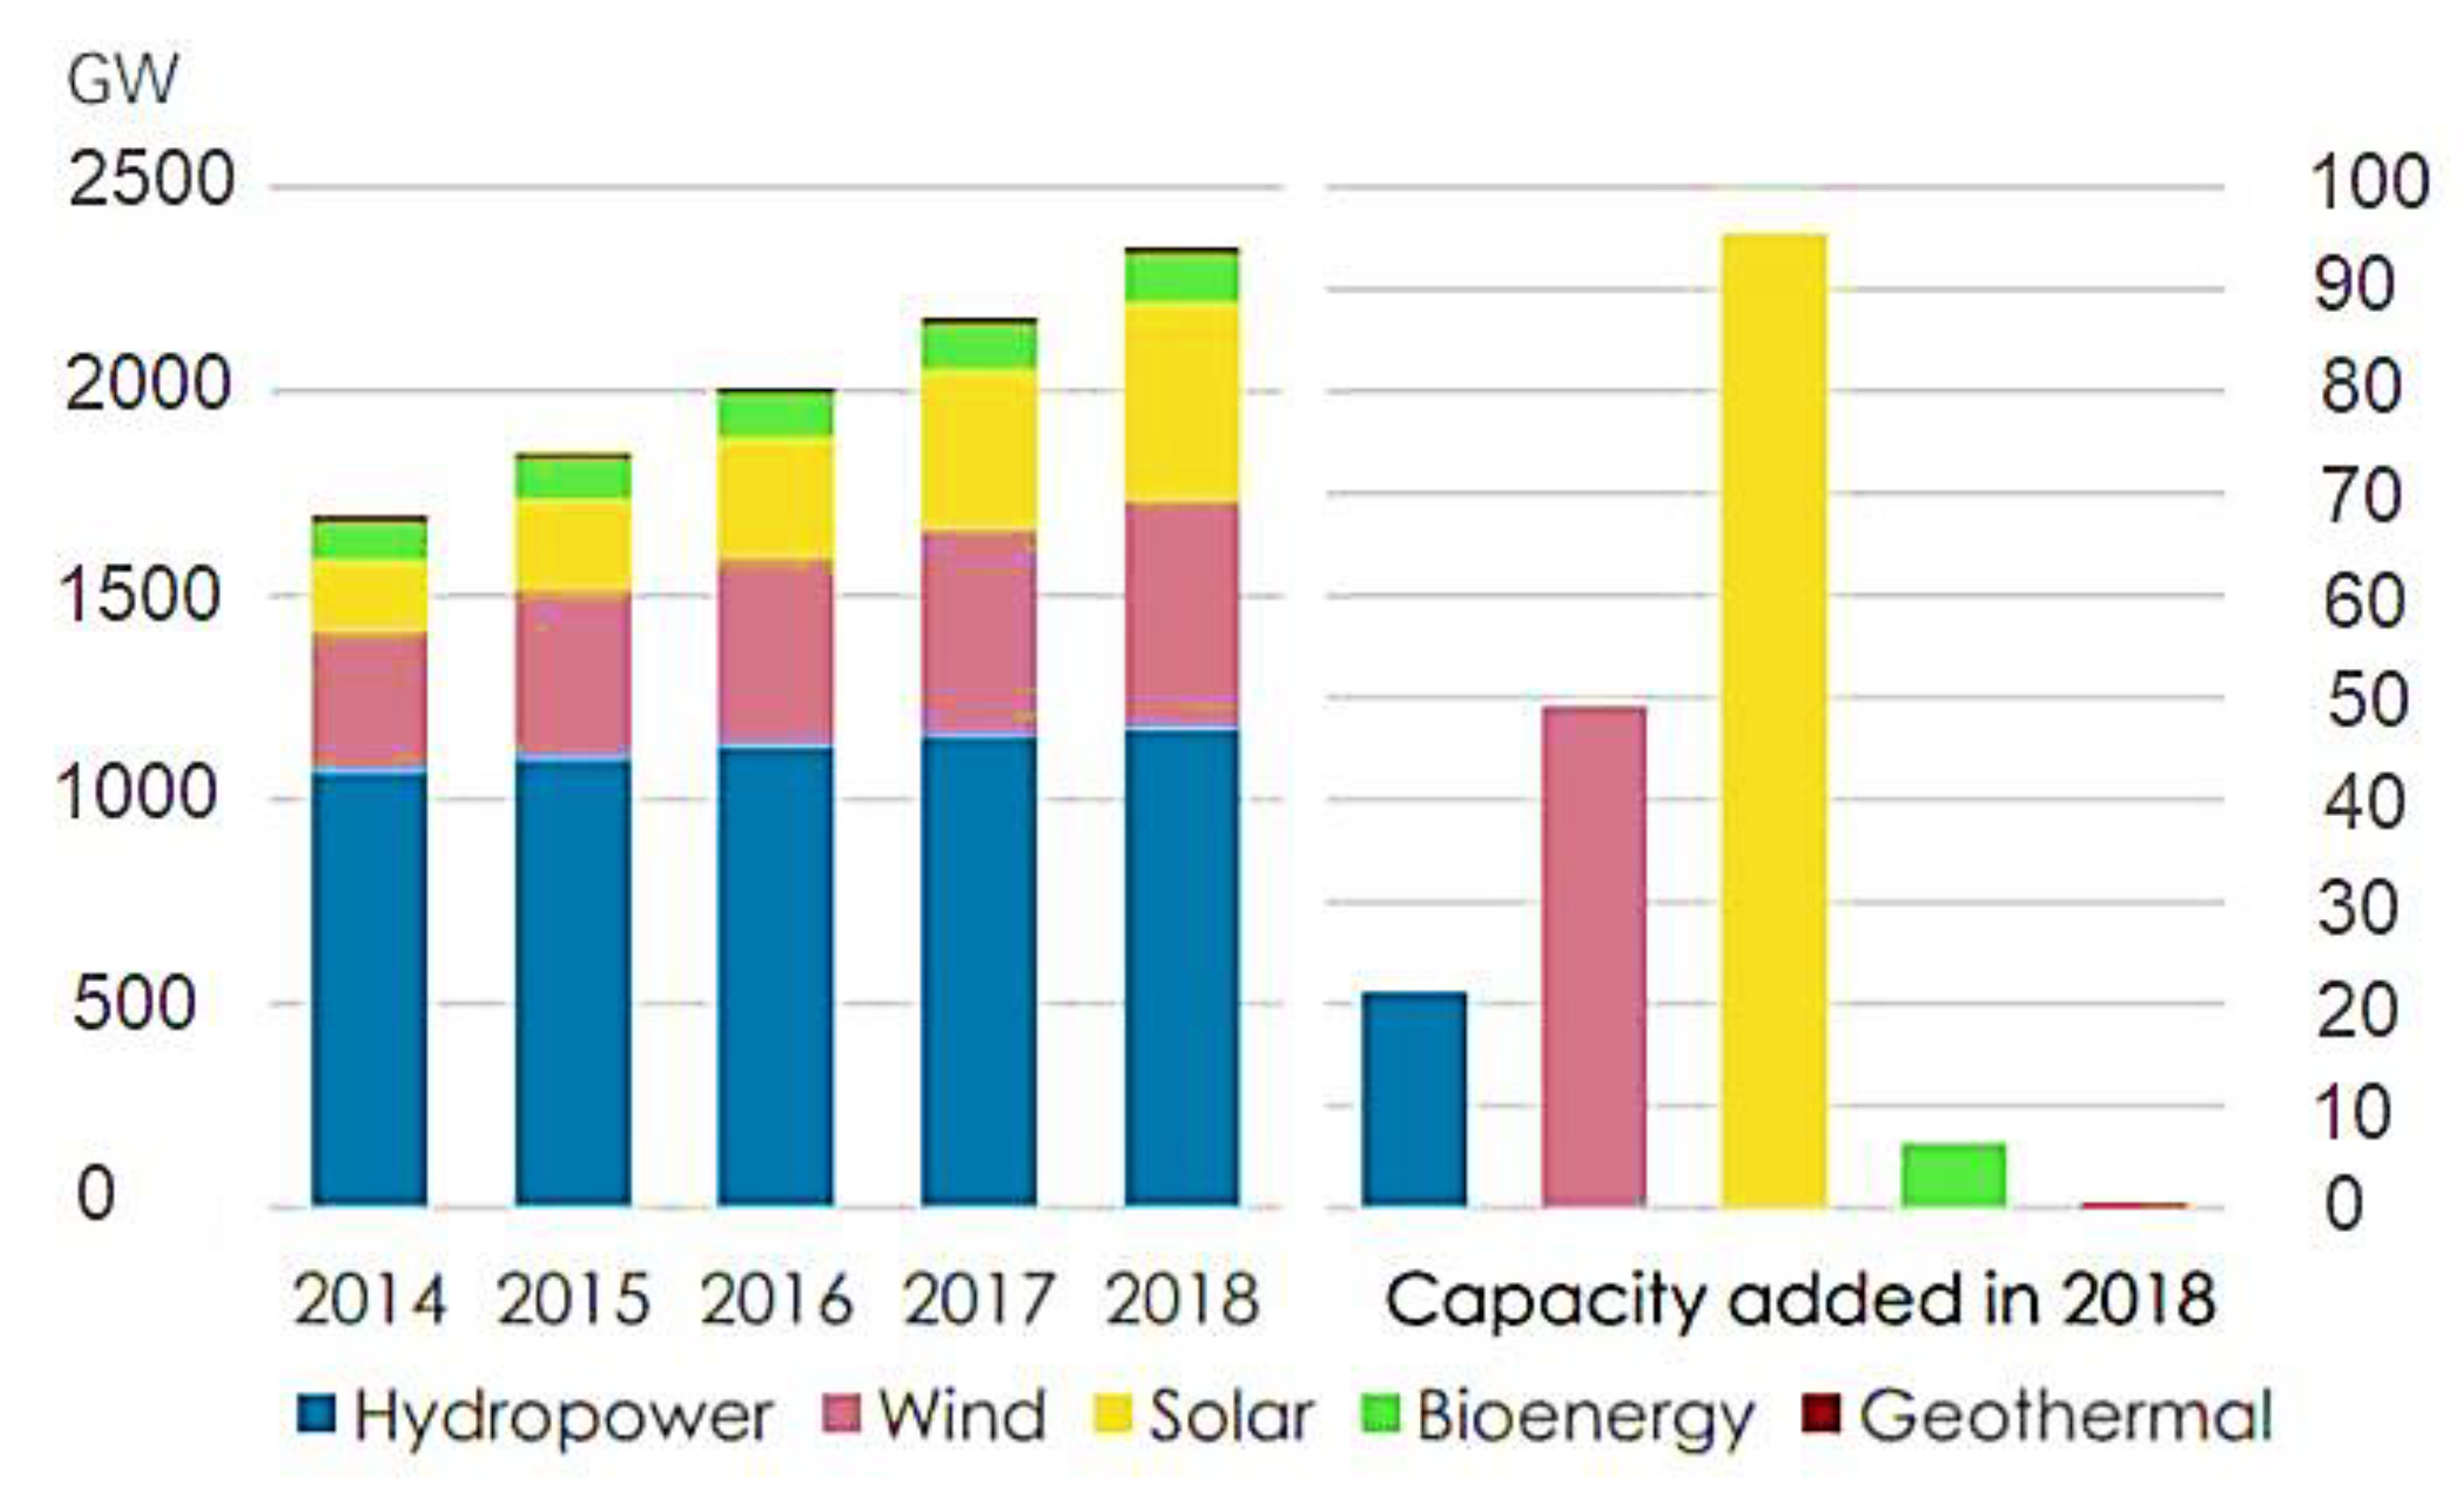
Figure 2.
Installed PV Array.
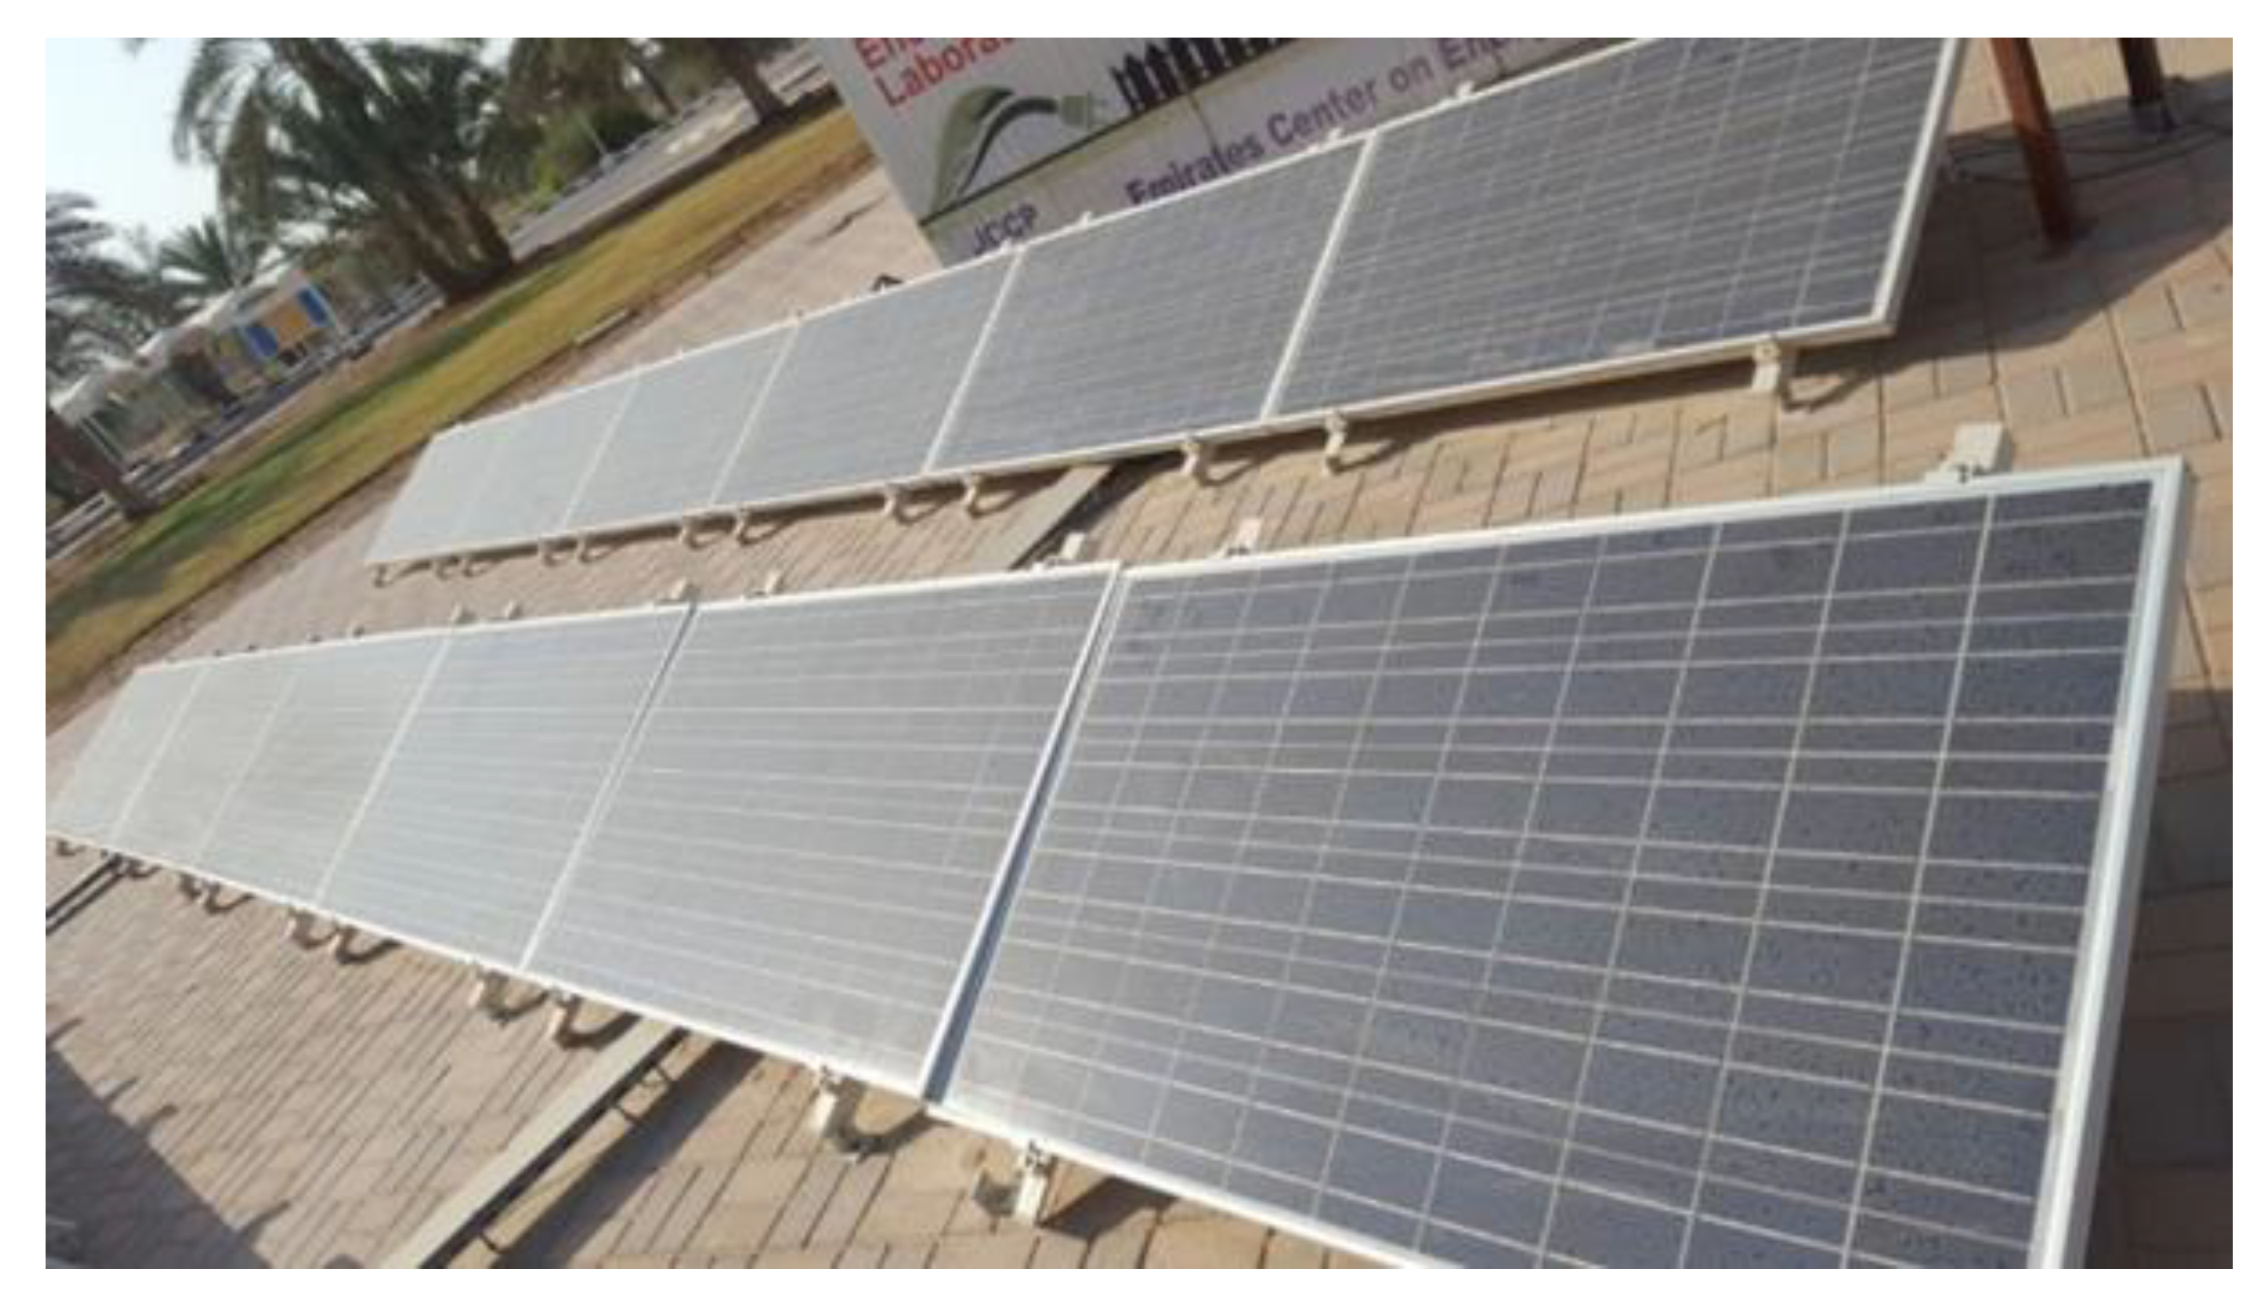
Figure 3.
(a) FLIR E-63900 Infrared Camera. (b) DEVIS Vantage Pro 2 Weather Station.
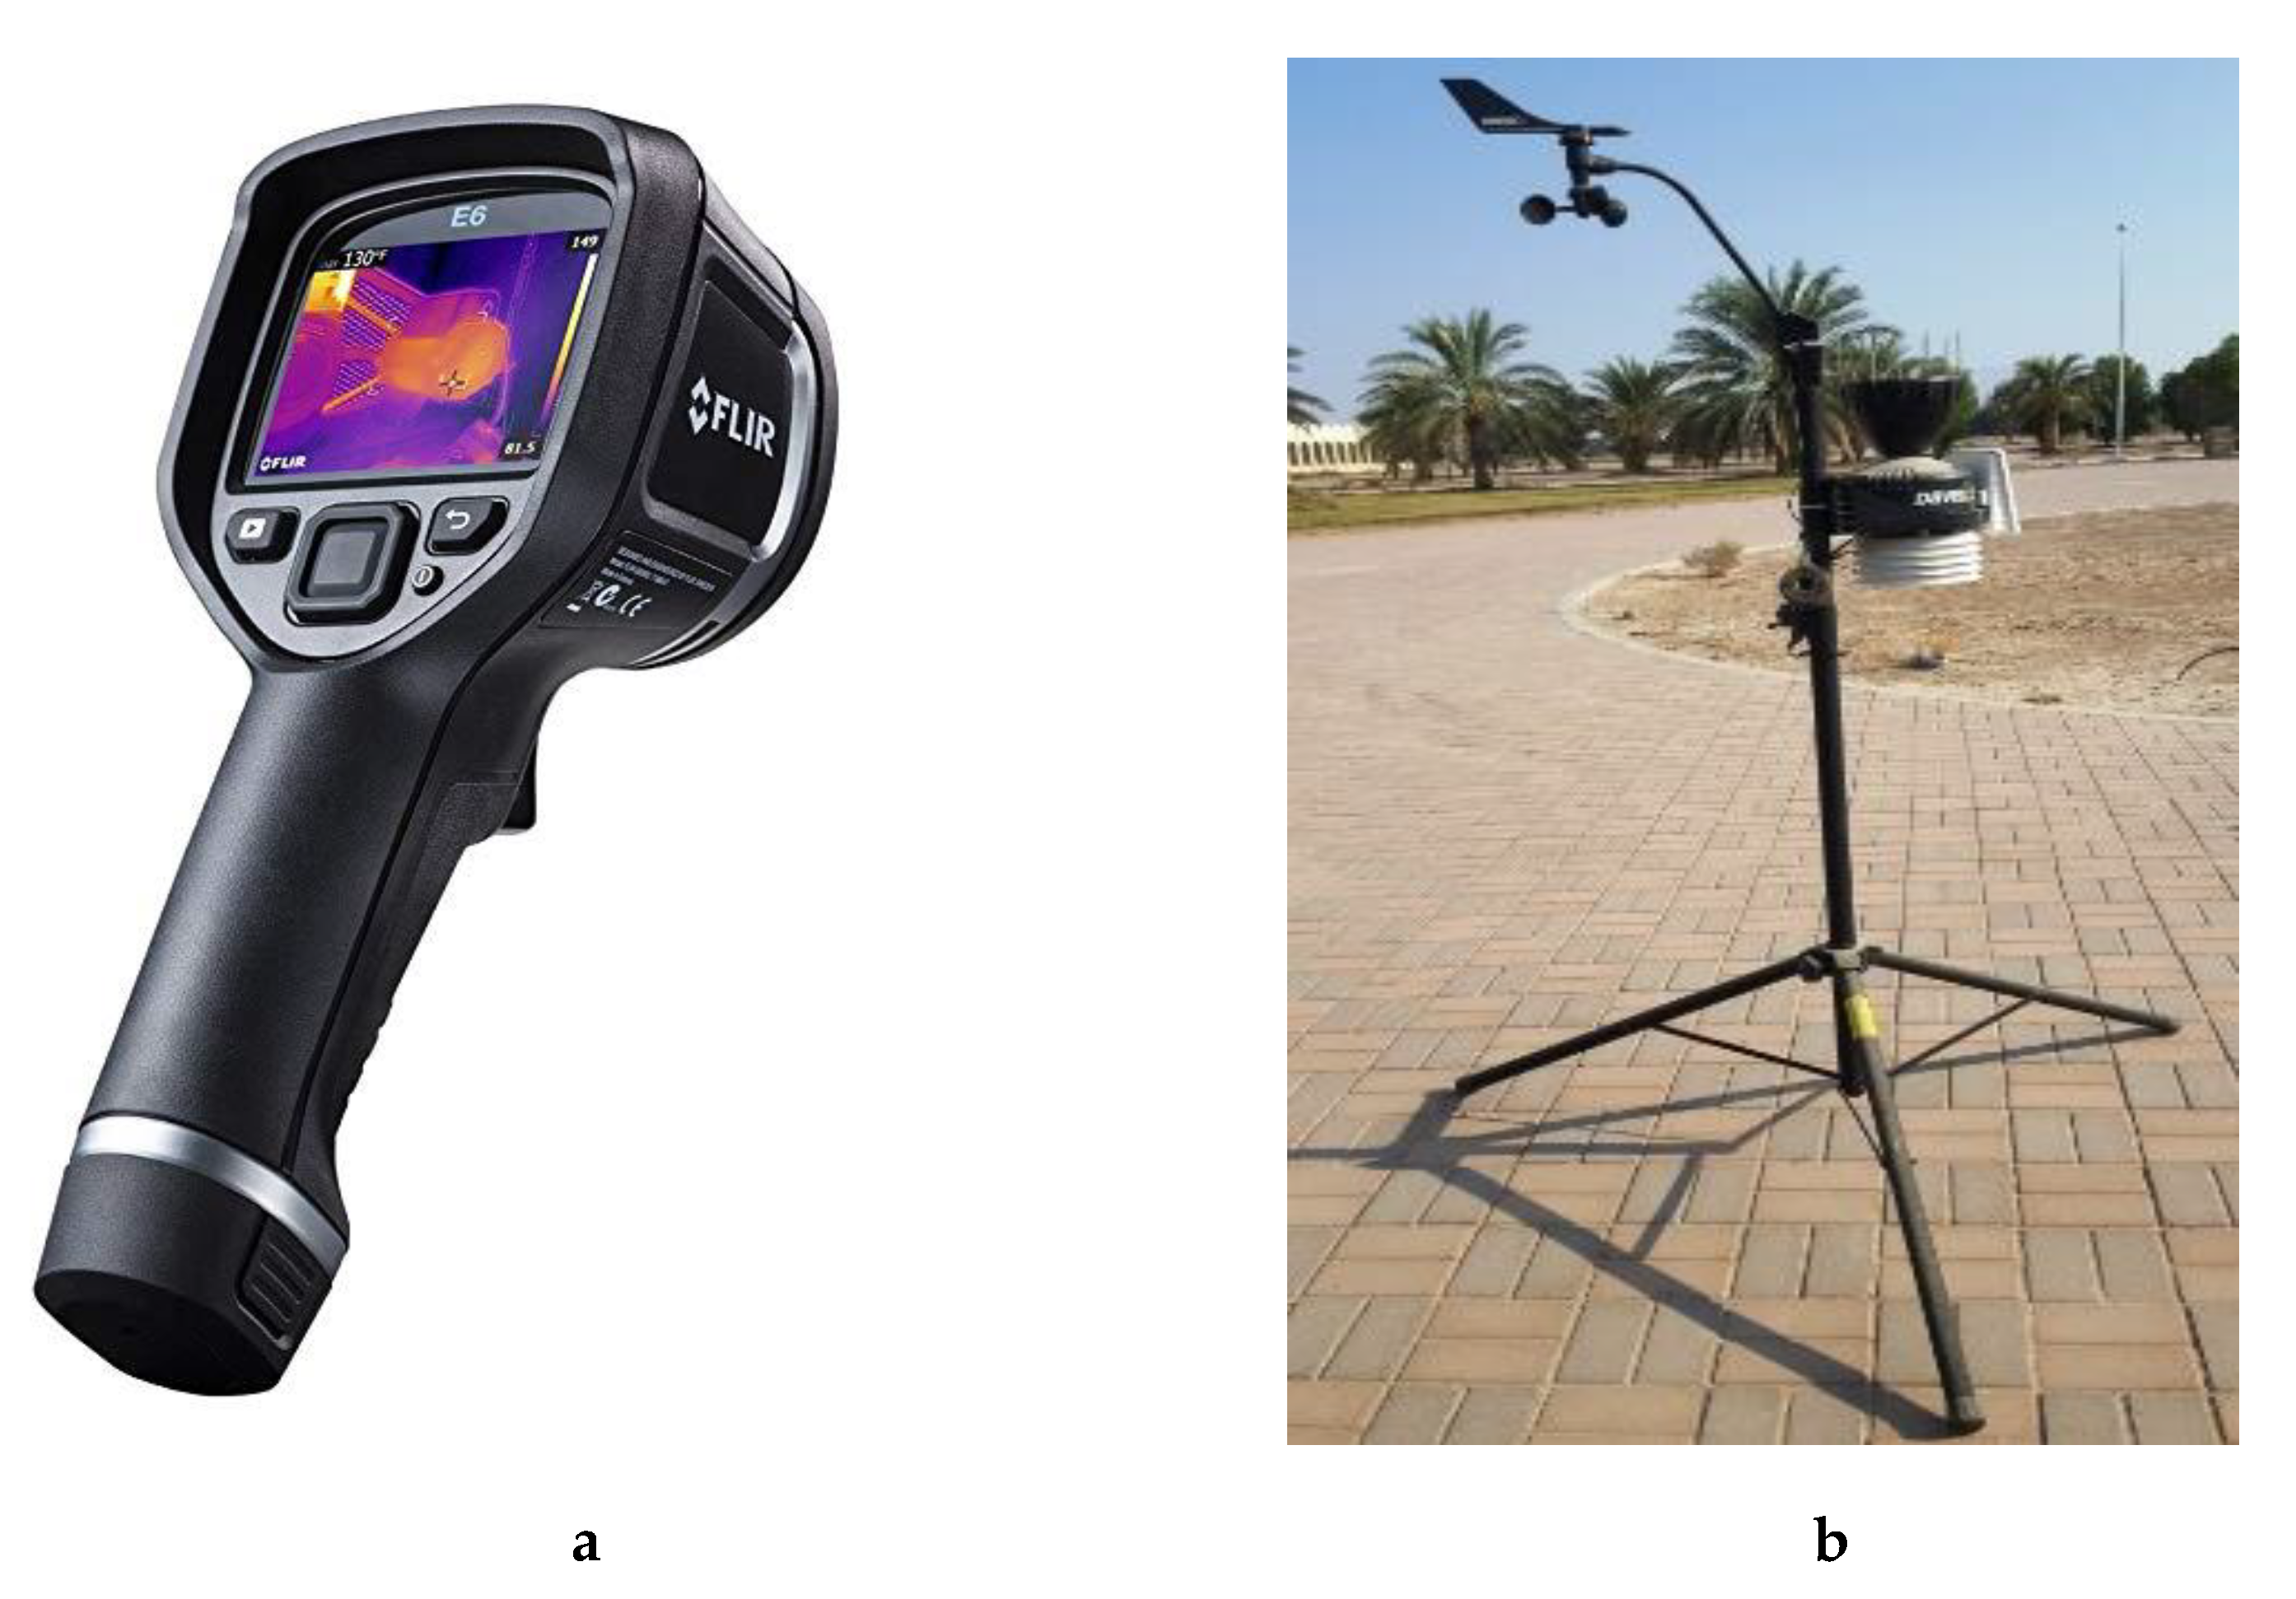
Figure 4.
Flow diagram of the PV fault diagnostic system.

Figure 5.
Data flow for PV fault diagnostic system.
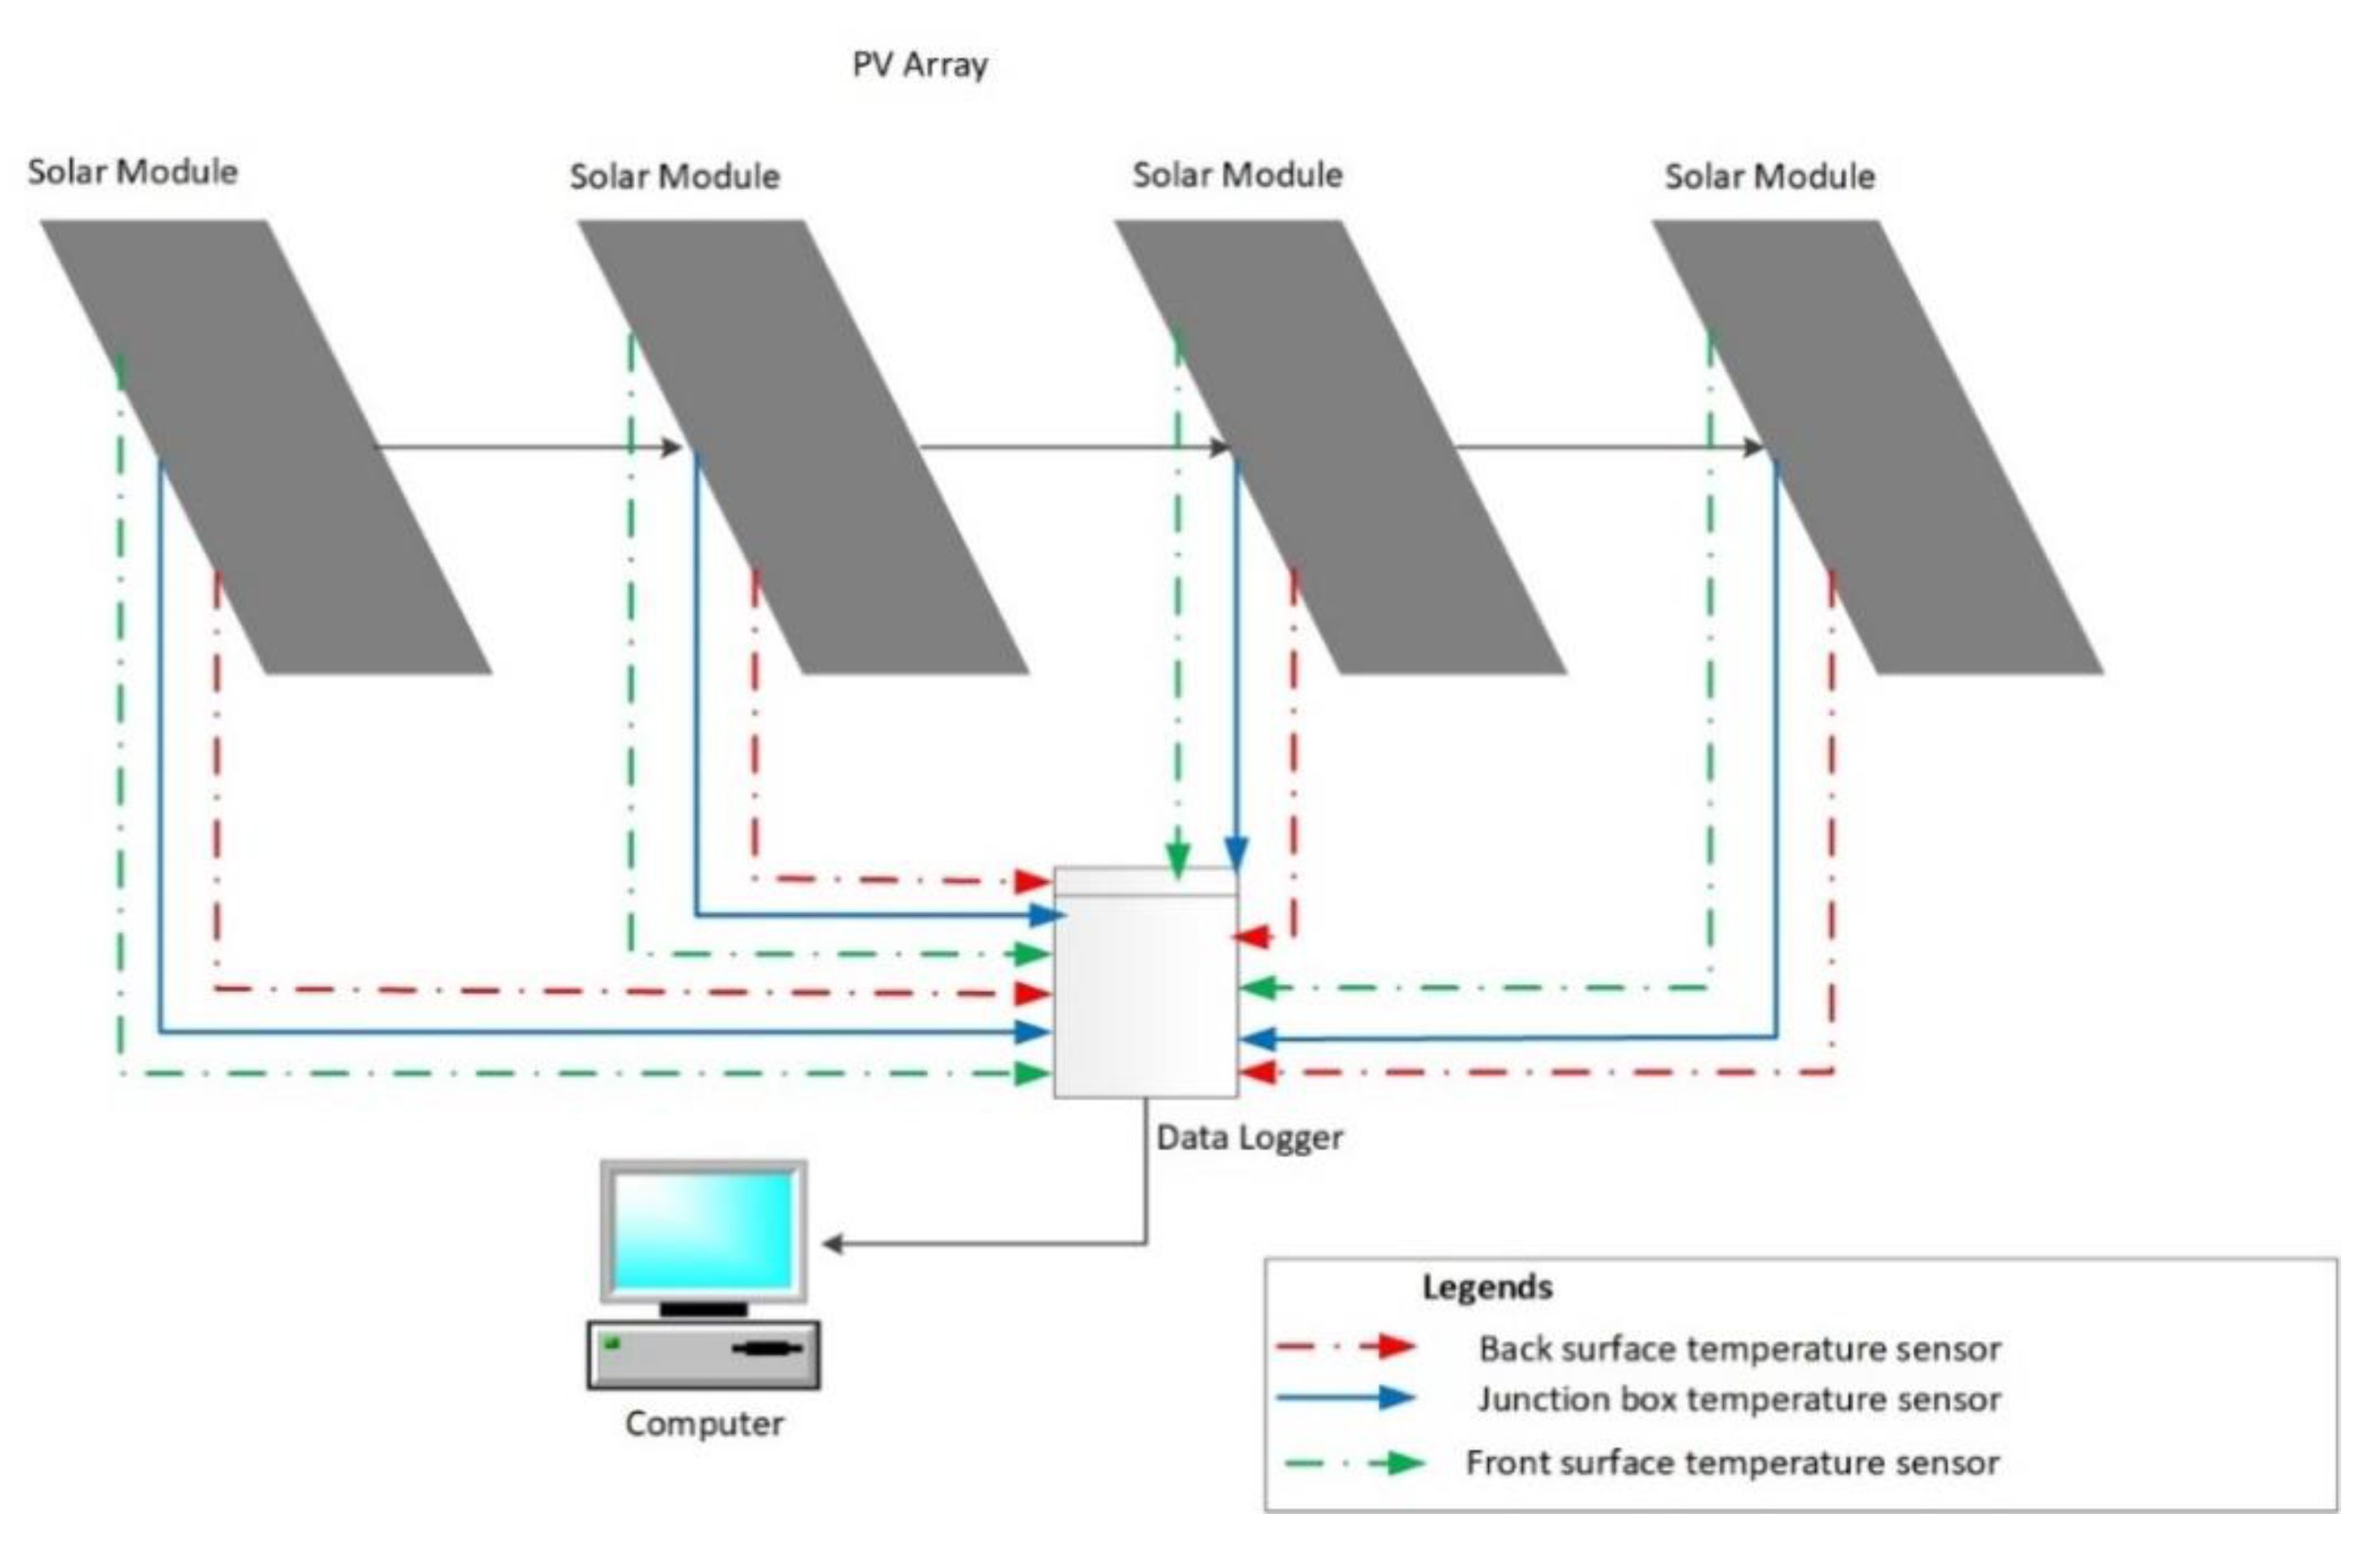
Figure 6.
PV module junction, front and back surface temperatures comparison under Short Circuit fault conditions.
Figure 6.
PV module junction, front and back surface temperatures comparison under Short Circuit fault conditions.
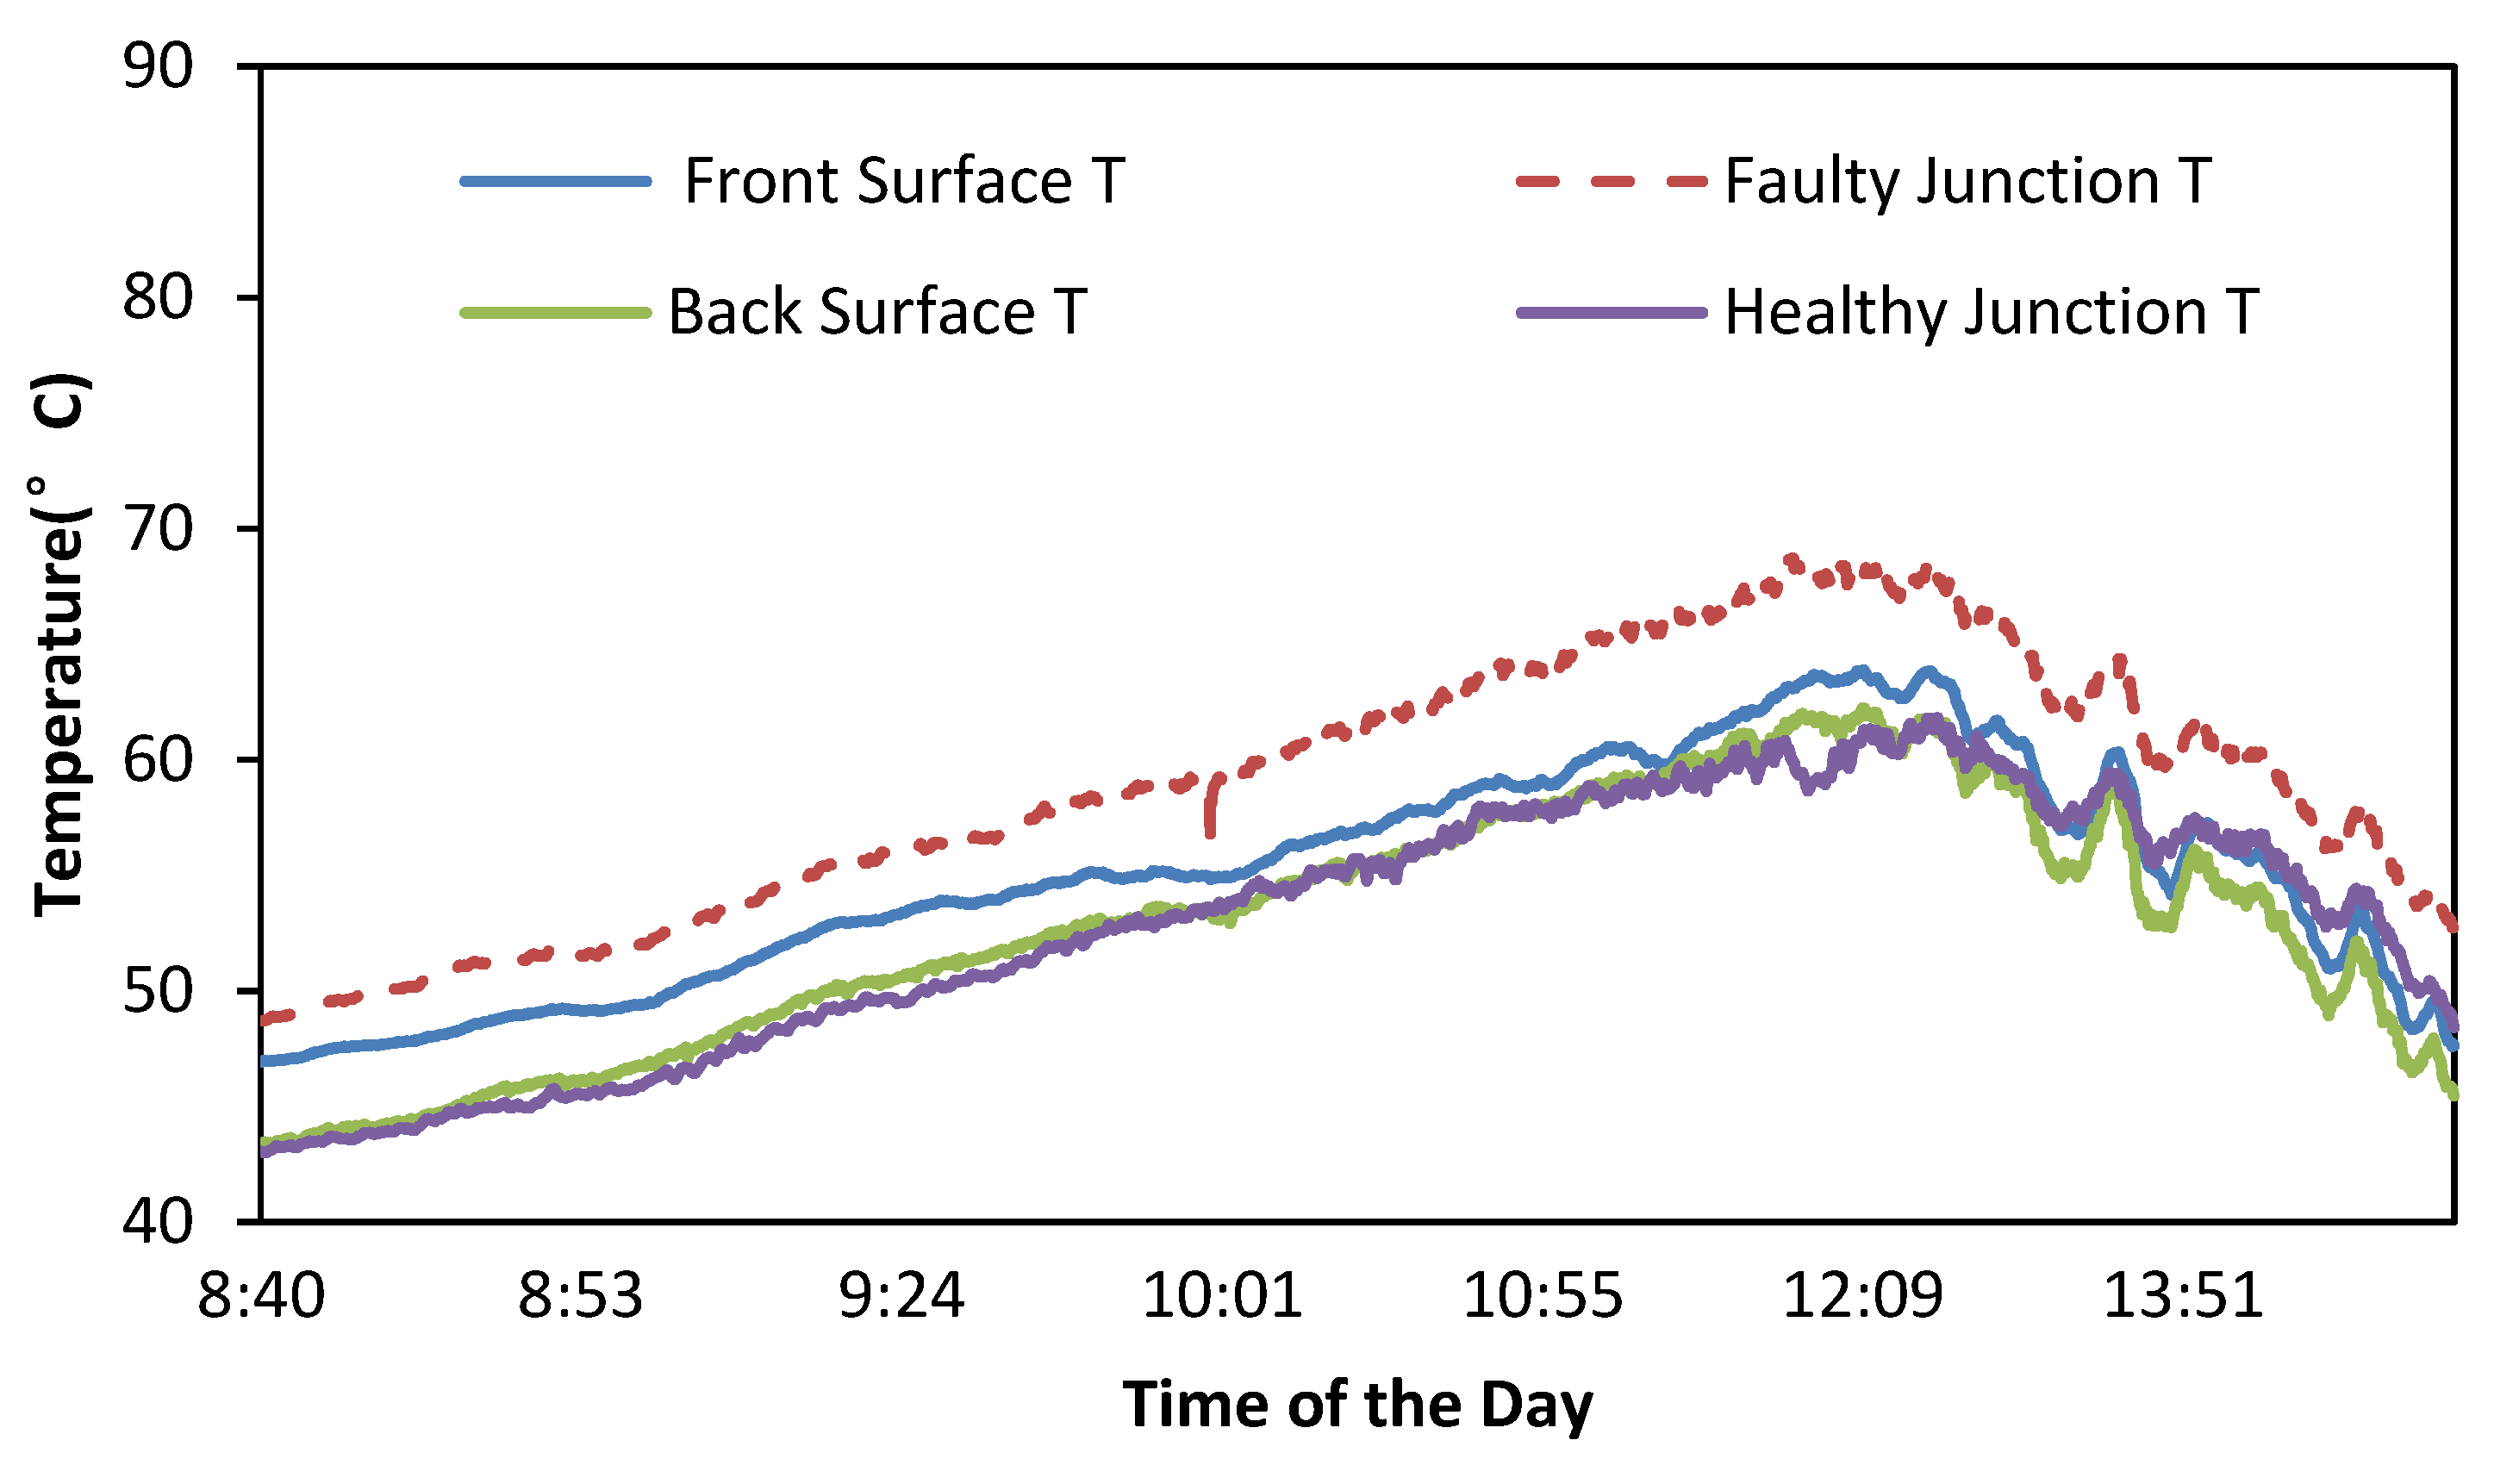
Figure 7.
(a) Healthy PV module thermal characteristics; (b) PV module thermal characteristics under Short Circuit Fault Condition.
Figure 7.
(a) Healthy PV module thermal characteristics; (b) PV module thermal characteristics under Short Circuit Fault Condition.

Figure 8.
PV module junction, front and back surface temperatures comparison under Ground fault conditions.
Figure 8.
PV module junction, front and back surface temperatures comparison under Ground fault conditions.
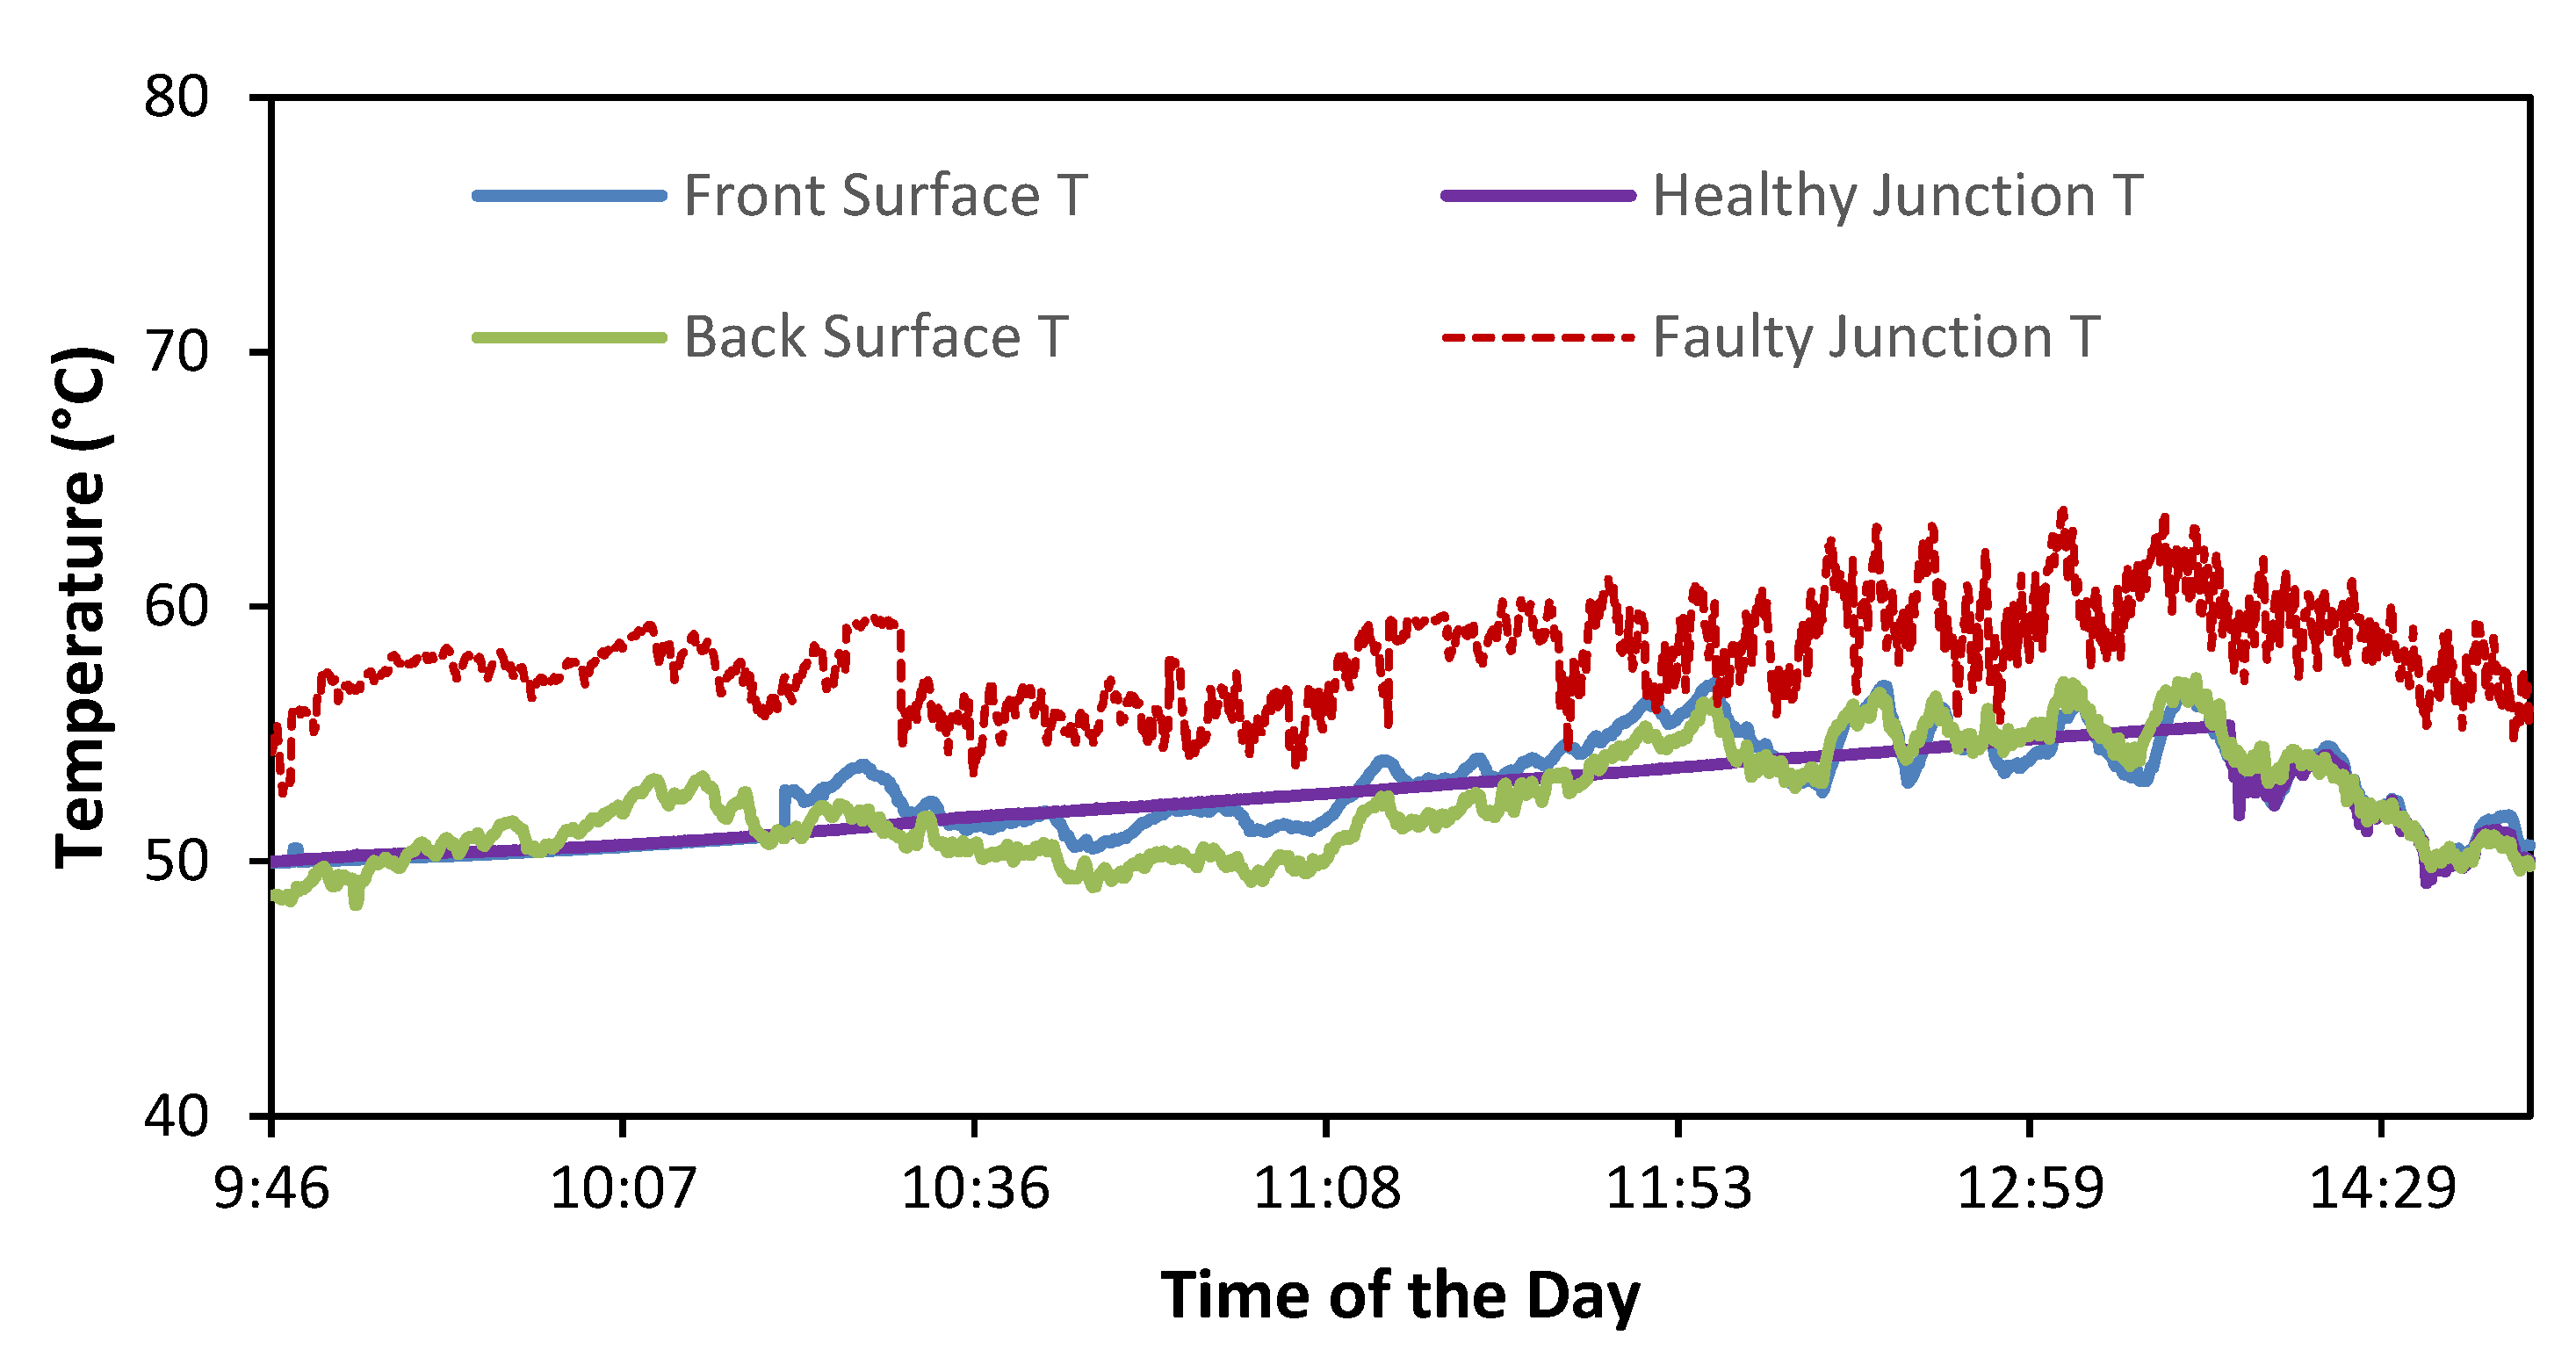
Figure 9.
(a) Healthy PV module thermal characteristics; (b) PV module thermal characteristics under Ground Fault Condition.
Figure 9.
(a) Healthy PV module thermal characteristics; (b) PV module thermal characteristics under Ground Fault Condition.

Figure 10.
PV module junction, front and back surface temperatures comparison under Open Circuit fault conditions.
Figure 10.
PV module junction, front and back surface temperatures comparison under Open Circuit fault conditions.
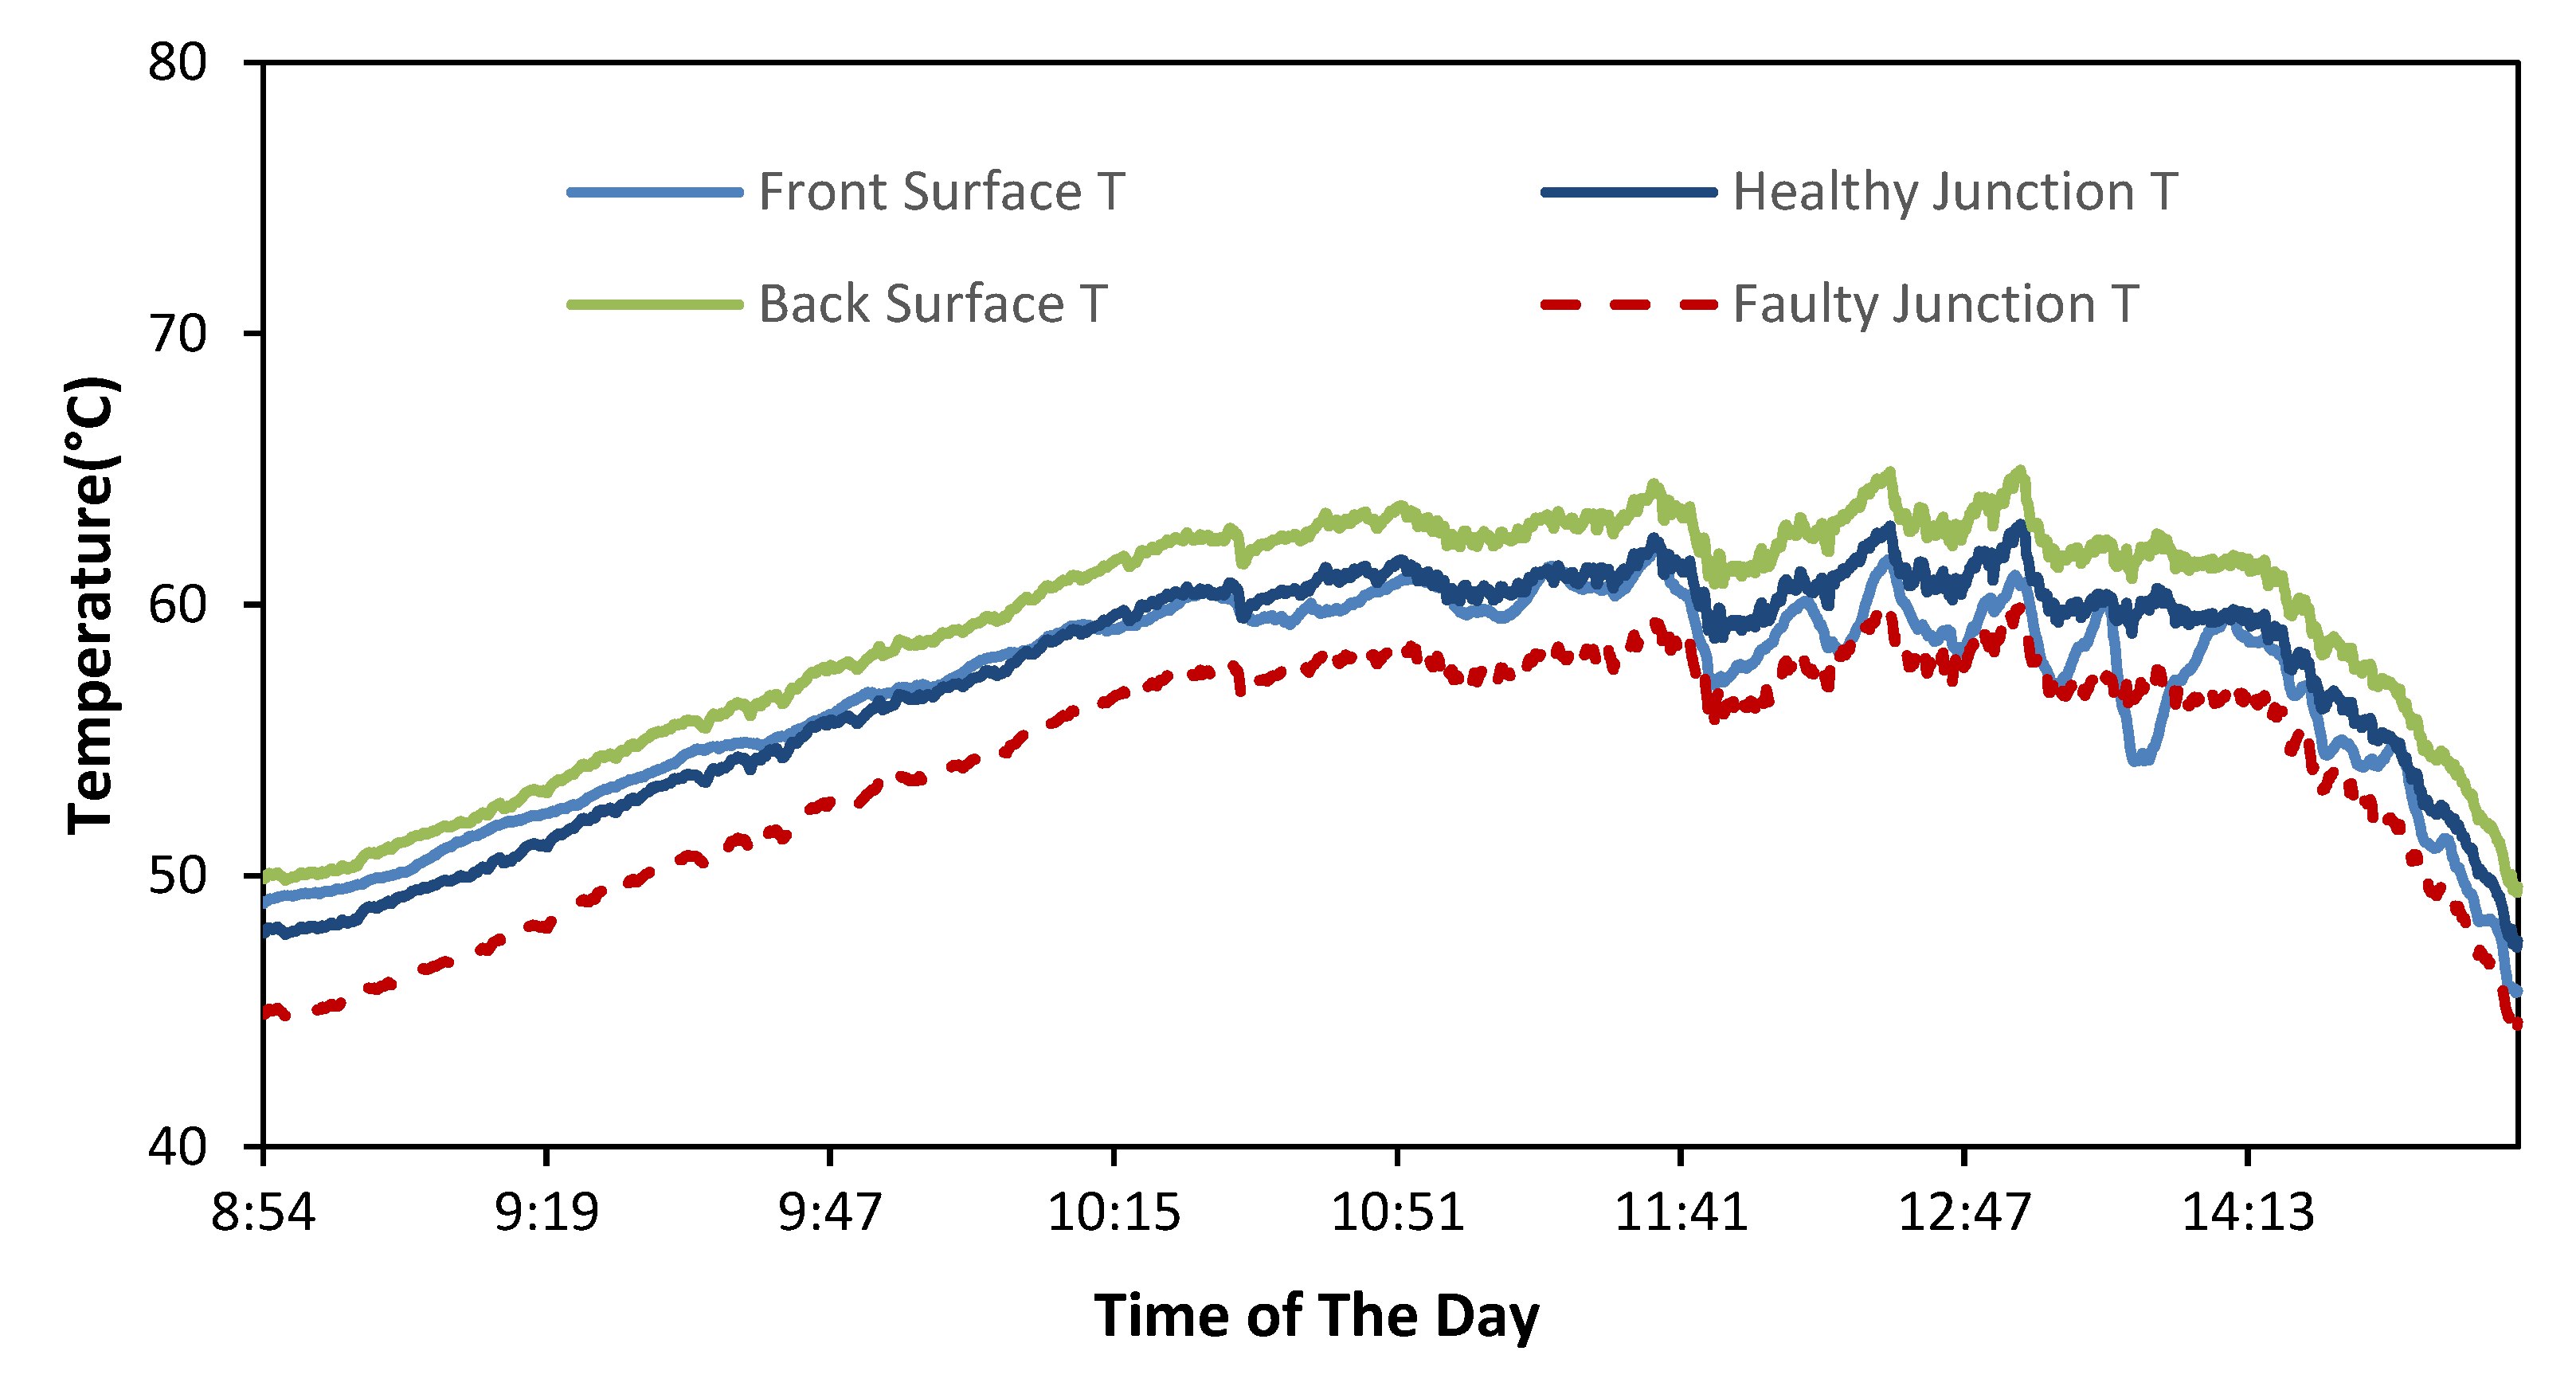
Figure 11.
(a) Healthy PV module thermal characteristics; (b) PV module thermal characteristics under Open Circuit Fault Conditions.
Figure 11.
(a) Healthy PV module thermal characteristics; (b) PV module thermal characteristics under Open Circuit Fault Conditions.
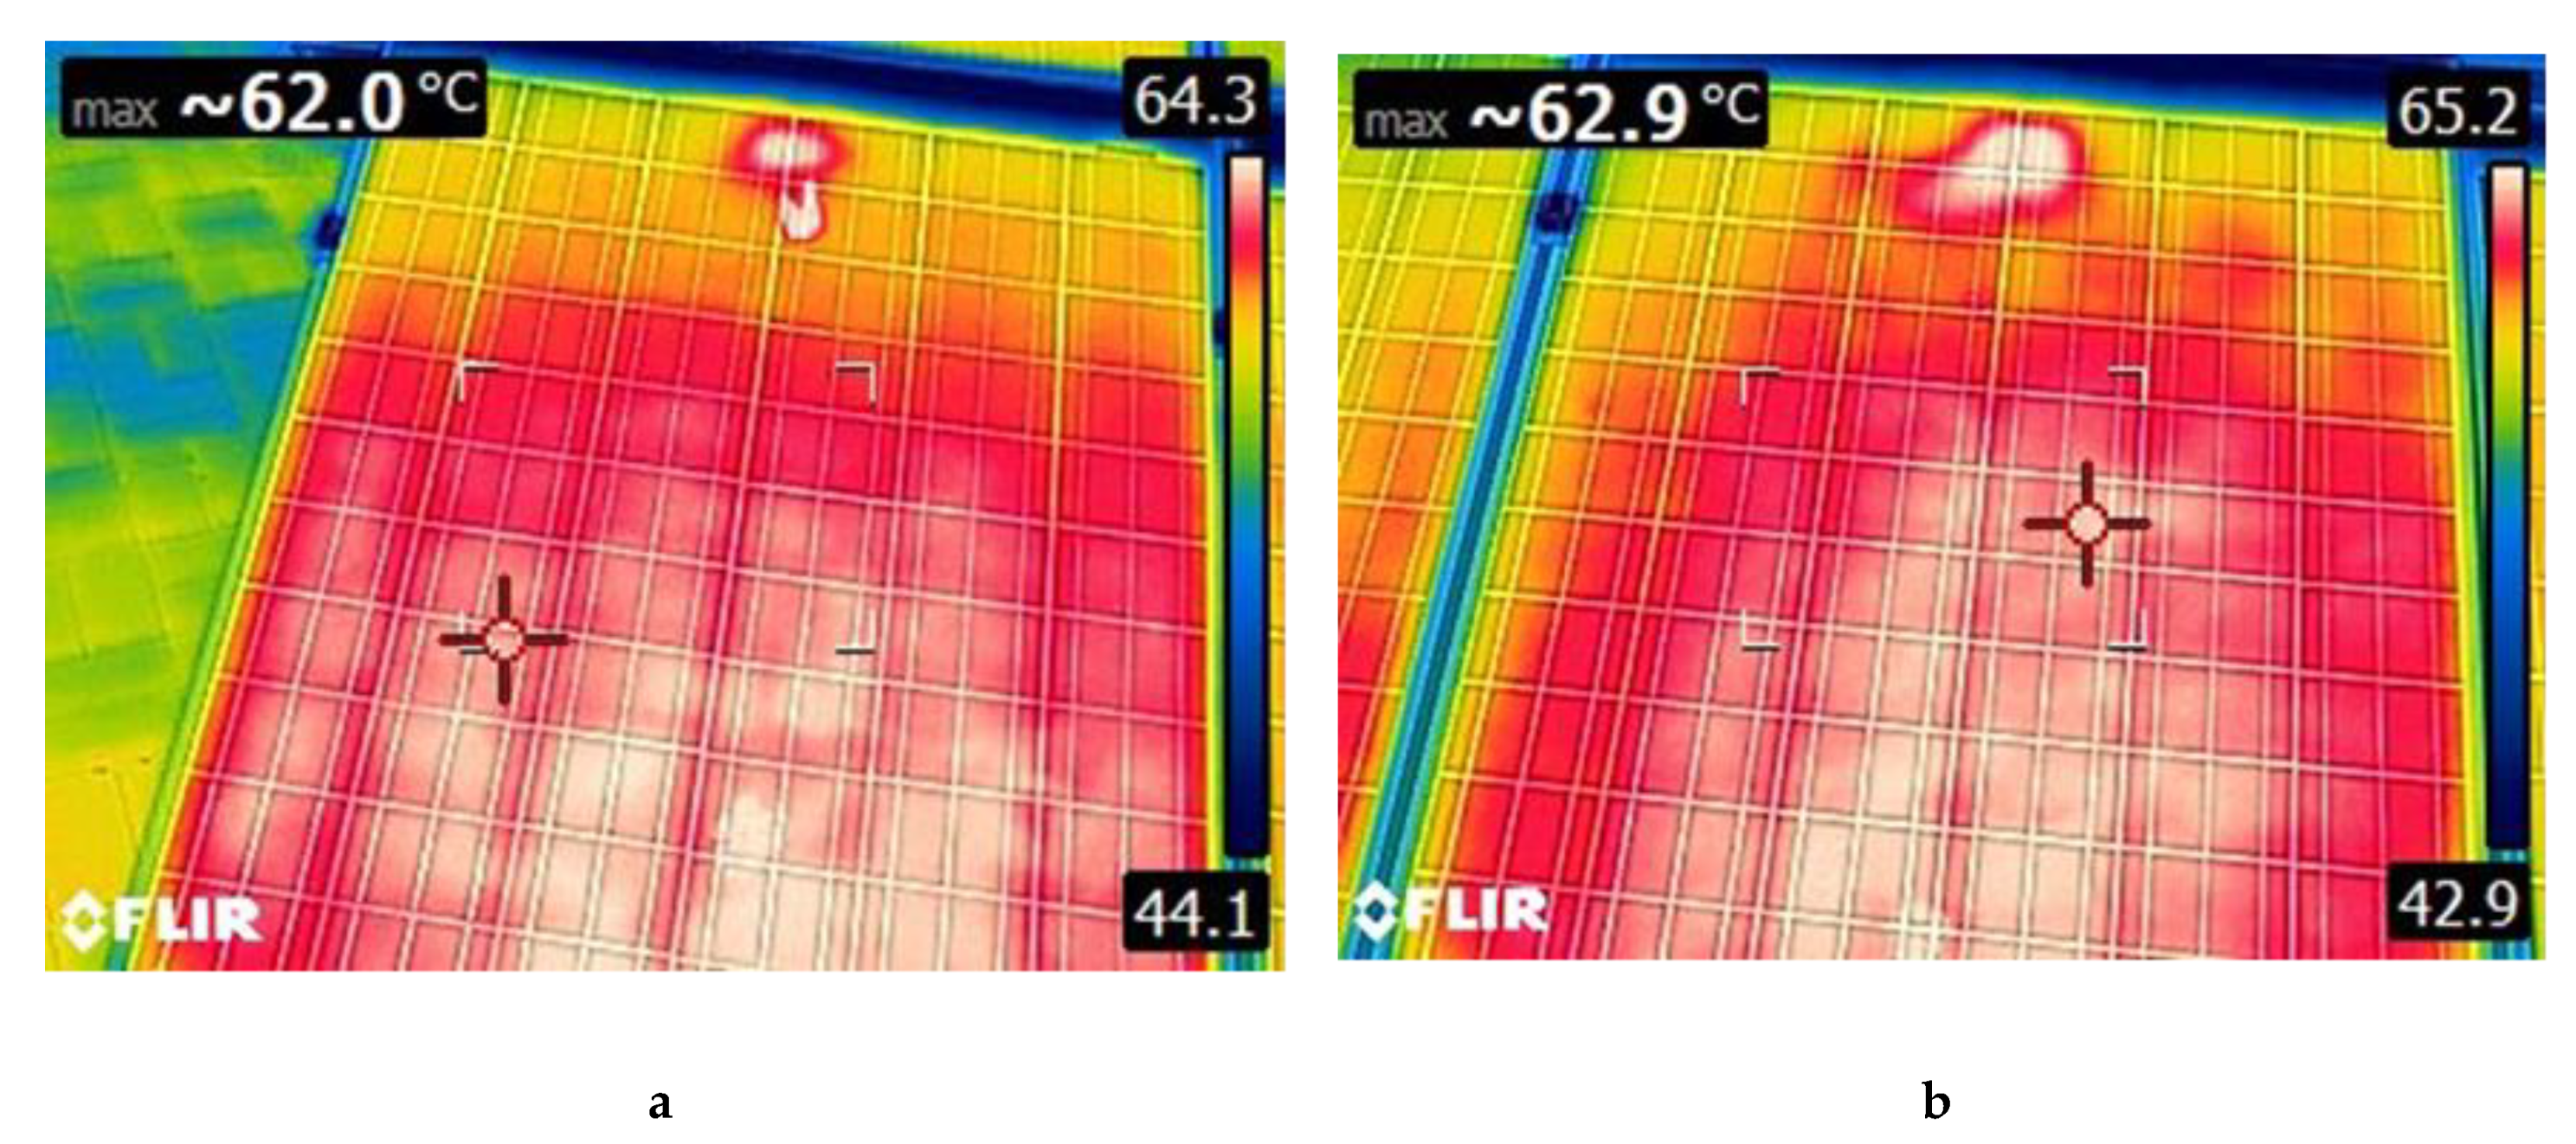
Figure 12.
PV module junction, front and back surface temperatures comparison under partial shading fault conditions.
Figure 12.
PV module junction, front and back surface temperatures comparison under partial shading fault conditions.


Table 1.
PV (photovoltaic) module IV characteristics.
| Pmax | 160 ±3% |
| Vmax | 36.20 |
| Imax | 4.59 |
| Voc | 43.32 |
| Isc | 5.05 |
Table 2.
Fault diagnostic system specifications.
| Parameter Measurement | Device | Model | Measurement Value Range | Resolution |
|---|---|---|---|---|
| Data logging | National Instrument | NI-cDAQ™-9178 | ±0.02% | |
| Surface Temperature Logging | National Instrument | NI-analogue module 9213 | −75 to 250 °C | ±1% |
| Voltage Measurement | National Instrument | NI-analogue Module 9229 | −75 to 250 °C | ±1% |
| Rear Surface Temperature measurement | RS Components Ltd. | K-types Thermocouple | ±1.5% | |
| Front Surface Temperature | FLIR | FLIR-E63900 | −20 °C to +250 °C |
Table 3.
Summary of the faults in the PV system, temperature differences, and monitoring methods.
| No | Type of Fault | Temperature Difference (Healthy and Faulty) in the Thermal Signature Technique | Thermography | Fault Monitoring by Thermography | Fault Monitoring by Thermal Signature Technique |
|---|---|---|---|---|---|
| 1 | Short Circuit | ≥5 | 4.7 | ✓ | ✓ |
| 2 | Grounded | ≤4–5 | 2.2 | ✓ | ✓ |
| 3 | Open Circuit | ≥4 | 0.9 | No | ✓ |
| 4 | Partial Shading | ≤3 | No | ✓ |
Publisher’s Note: MDPI stays neutral with regard to jurisdictional claims in published maps and institutional affiliations. |
© 2020 by the authors. Licensee MDPI, Basel, Switzerland. This article is an open access article distributed under the terms and conditions of the Creative Commons Attribution (CC BY) license (http://creativecommons.org/licenses/by/4.0/).
Share and Cite
MDPI and ACS Style
Navid, Q.; Hassan, A.; Ahmad Fardoun, A.; Ramzan, R. An Online Novel Two-Layered Photovoltaic Fault Monitoring Technique Based Upon the Thermal Signatures. Sustainability 2020, 12, 9607. https://doi.org/10.3390/su12229607
AMA Style
Navid Q, Hassan A, Ahmad Fardoun A, Ramzan R. An Online Novel Two-Layered Photovoltaic Fault Monitoring Technique Based Upon the Thermal Signatures. Sustainability. 2020; 12(22):9607. https://doi.org/10.3390/su12229607
Chicago/Turabian StyleNavid, Qamar, Ahmed Hassan, Abbas Ahmad Fardoun, and Rashad Ramzan. 2020. "An Online Novel Two-Layered Photovoltaic Fault Monitoring Technique Based Upon the Thermal Signatures" Sustainability 12, no. 22: 9607. https://doi.org/10.3390/su12229607
Note that from the first issue of 2016, this journal uses article numbers instead of page numbers. See further details here.