Article

Geotextile Tube Dewatering Performance Assessment: An Experimental Study of Sludge Dewatering Generated at a Water Treatment Plant

by
Maria Alejandra Aparicio Ardila
1,*,
Samira Tessarolli de Souza
1,
Jefferson Lins da Silva
1,
Clever Aparecido Valentin
1 and
Angela Di Bernardo Dantas
2
1
São Carlos School of Engineering (EESC), University of São Paulo (USP), São Carlos, São Paulo 13566-590, Brazil
2
Hidrosan Engenharia, São Carlos, São Paulo 13560-900, Brazil
*
Author to whom correspondence should be addressed.
Sustainability 2020, 12(19), 8129; https://doi.org/10.3390/su12198129
Submission received: 12 August 2020 / Revised: 15 September 2020 / Accepted: 22 September 2020 / Published: 2 October 2020

Abstract

:
Using geotextile tubes as dewatering technology may significantly contribute to sustainable treatment of sludge generated in different industries, such as the water industry. This is an economical alternative for dewatering sludge from a Water Treatment Plant (WTP), which prevents sludge from being directly deposited in water bodies and makes it possible to then transfer the sludge to landfills. This paper presents a laboratory study and a statistical analysis, carried out to evaluate the geotextile tube dewatering of sludge from a WTP, discussing the relation between the independent variables (initial Total Solids (TS) of the sludge and polymer dosing) and dependent variables (performance indices used in the literature) evaluated using semi-performance tests. Sludge from a WTP and three different types of geotextiles bags were used. Changes in the geotextiles’ characteristics after dewatering were also evaluated, quantitatively using permittivity tests and qualitatively by Scanning Electron Microscopy (SEM). The results indicated turbidity of effluent that met the Brazilian regulations for the discharge of effluents into Class 2 water bodies, as well as higher percent-solids than those obtained with mechanical dewatering technologies. This study underscores the importance of semi-performance tests to understand dewatering in geotextile tubes.

1. Introduction

Surface water sources have been increasingly mistreated by releasing debris, which is a result of population growth, industrial activities, and the disorderly occupation of protected areas [1]. Due to the low-quality conditions of water bodies, increasing quantities of chemical products need to be used to treat the water, thus increasing the generation of sludge. A Water Treatment Plant (WTP) sludge is a high-water content material, with a granulometric distribution of fine sediments. It originates mainly in decanters and filter washing, and its characteristics depend on different factors, such as the type and quality of crude water, chemical products used in treatment systems, and the operational conditions of the WTP [1,2,3].
Most Brazilian WTPs dispose of their sludge into watercourses, contradicting current legislation and causing environmental impacts [4], although Brazilian legislation (Law 9.605/98 and Law 12.305/10) establishes that the release of effluents into water bodies, when not approved by environmental agencies, is considered an environmental crime [5,6].
As environmental awareness is raised and more stringent regulations related to the treatment of WTP sludge emerge, technologies that aim to dewater sludge to facilitate its treatment and disposal become increasingly more important. Approximately two decades ago, sludge dewatering was carried out almost exclusively with conventional technologies such as settling ponds, mechanical presses, and centrifuges [7]. Despite the various alternatives and technologies available on the market, the main obstacles to WTP sludge dewatering are the high cost and operational complexity [3]. In this context, geotextile tube technology emerged. It was used for the first time in the 1990s by Fowler et al. [8] for dewatering sludge from a sewage treatment plant. It led to the initial understanding of how geotextile tubes can be used in dewatering applications [9]. Thus, showing the importance and relevance of the environment segment [10].
Geotextile tubes foster the natural physical separation between the solid and liquid fraction of the sludge, in addition to possibly containing contaminants present in the sludge [9], showing, in some cases, a better performance compared to conventional dewatering technologies. The solid fraction can be transferred directly to sanitary landfills and the liquid fraction (effluent) can be returned to the interior of the system, or sent directly to water bodies, as long as it complies with environmental regulations, which, if not met, will require a secondary treatment [11].
Chemical conditioning of the sludge and the filter cake formation is a fundamental aspect to be considered in geotextile tubes dewatering. Adding polymers, particularly polyacrylamide-based ones, to the sludge has become an essential component for the dewatering process in geotextile tubes, where the polymers act as flocculants, improving dewatering characteristics, increased dewatering rate, particle retention, and reducing the risk of clogging [9,12,13,14,15,16,17,18,19].
Another important aspect is the filter cake, which is a type of clogging inherent to the dewatering process, which occurs due to the suffusion of the fine particles of sludge, which form a layer on the inner surface of the tube. This layer is usually formed after the first filling cycle of the system, and substantially reduces the drainage capacity of the geotextile, governing the filtration [20,21,22,23,24,25,26,27,28]. Weggel and Ward [29] developed a numerical model of the formation of the filter cake in the geotextile tube during the dewatering process where the size distribution of the particles in various layers within the filter cake can be determined from the model. The model was verified by Weggel and Dortch [30] through tests with two low permittivity woven geotextiles and three types of sediments, where they compared the flow rate through the experiments with the rate predicted by the theory, obtaining satisfactory results in the prediction of the filter cake accumulation on geotextiles.
In order to improve the dewatering performance in geotextile tubes, several works have already been developed, using different treatments, test methodologies, residues or sludge, and polymers. Bourgès-Gastaud et al. [26] evaluated the dewatering of residues with different clay content using nonwoven geotextiles, showing the feasibility of using this type of geotextile in dewatering residues with fine granulometric characteristics. They also observed that the samples of residues with less than 25% of silt in the composition obtained less dewatering efficiency than the others, indicating that the sludge composition, and not the geotextile characteristics, determines the system’s dewatering efficiency, confirming the statement by Christopher and Fischer [31].
Compared with other natural technologies of dewatering, geotextile tubes show a lower dependence on meteorological conditions, as there is a lower input of rainwater through the geotextile [28]. These systems can be manufactured in different sizes, are simple to transport and use, and are significantly more economical [9]. Geotextile tubes in the national and international panorama present great potential for application, making them an efficient and viable solution from a technical and economical point of view.
The filtration criteria of geotextiles have limited applicability in geotextile tubes, due to the fact that the properties of the sludge are the dominant control factors in the filtration process [21,25]. However, knowledge of its filtration, operation, and improvement of design procedures is essential. The success of this application, and the duration of the dewatering and consolidation, depends on the filtration compatibility between the sludge and the geotextiles used to make the tubes [21,32]. Therefore, making preliminary performance tests is fundamental to assess the design conditions before installing the technology. Researchers and professionals have used several test methods alike as a means of evaluating the dewatering performance. These procedures comprise laboratory or field tests [33]. These methods include bench-scale tests (not standardized) such as the cone test (e.g., [28]), Falling Head Test (e.g., [34,35]), Pressure Filtration Test (e.g., [14,22,25,36,37]), and the Pressurized 2-Dimensional Dewatering Test (e.g., [33,38]). Moreover, midscale tests or semi-performance tests such as the Hanging Bag Test (HBT) formalized as a standard by the Geosynthetics Research Institute—GT14 [39] and the Geotextile Tube Dewatering Test (GDT) formalized as a standard by the Geosynthetics Research Institute—GT15 and the American Society for Testing and Materials (ASTM) D7880 [40,41]. Finally, full performance tests have limited use due to their complexity [9,25].
In studies carried out to compare the two methods of semi-performance tests, Koerner and Koerner [15] concluded that the GDT has more advantages compared to the HBT as it is user friendly and it evaluates more parameters such as the filling pressure. Therefore, carrying out this type of semi-performance test together with bench-scale tests is recommended when a full-scale test cannot be done.
The present study aims to contribute to the discussion and knowledge on geotextile tube technology used in WTP sludge dewatering. The implementation of this dewatering technology in the WTP could reduce the environmental impacts related to the disposal of WTP discharge. In addition, the present study seeks to evaluate the viability of using nonwoven geotextiles, a material with better filtration characteristics than the commonly used materials (woven geotextiles) that can be produced at a lower cost [42] and its use can economically benefit the installation of the systems. For this purpose, tests were carried out concurrently under the same conditions on two nonwoven geotextiles and a woven geotextile commonly used for this application, in order to have a performance reference. Thus, the study presents an evaluation of the dewatering of WTP sludge through GDT (semi-performance test) using sludge from a Brazilian WTP and bags made from geotextiles commercially used for dewatering application. Besides, a series of permittivity tests and SEM were carried out to analyze the geotextile characteristic changes due to sludge dewatering. Moreover, response surfaces graphs that establish the relationship between the dependent and independent variables that influence the dewatering performance are presented.

2. Materials and Methods

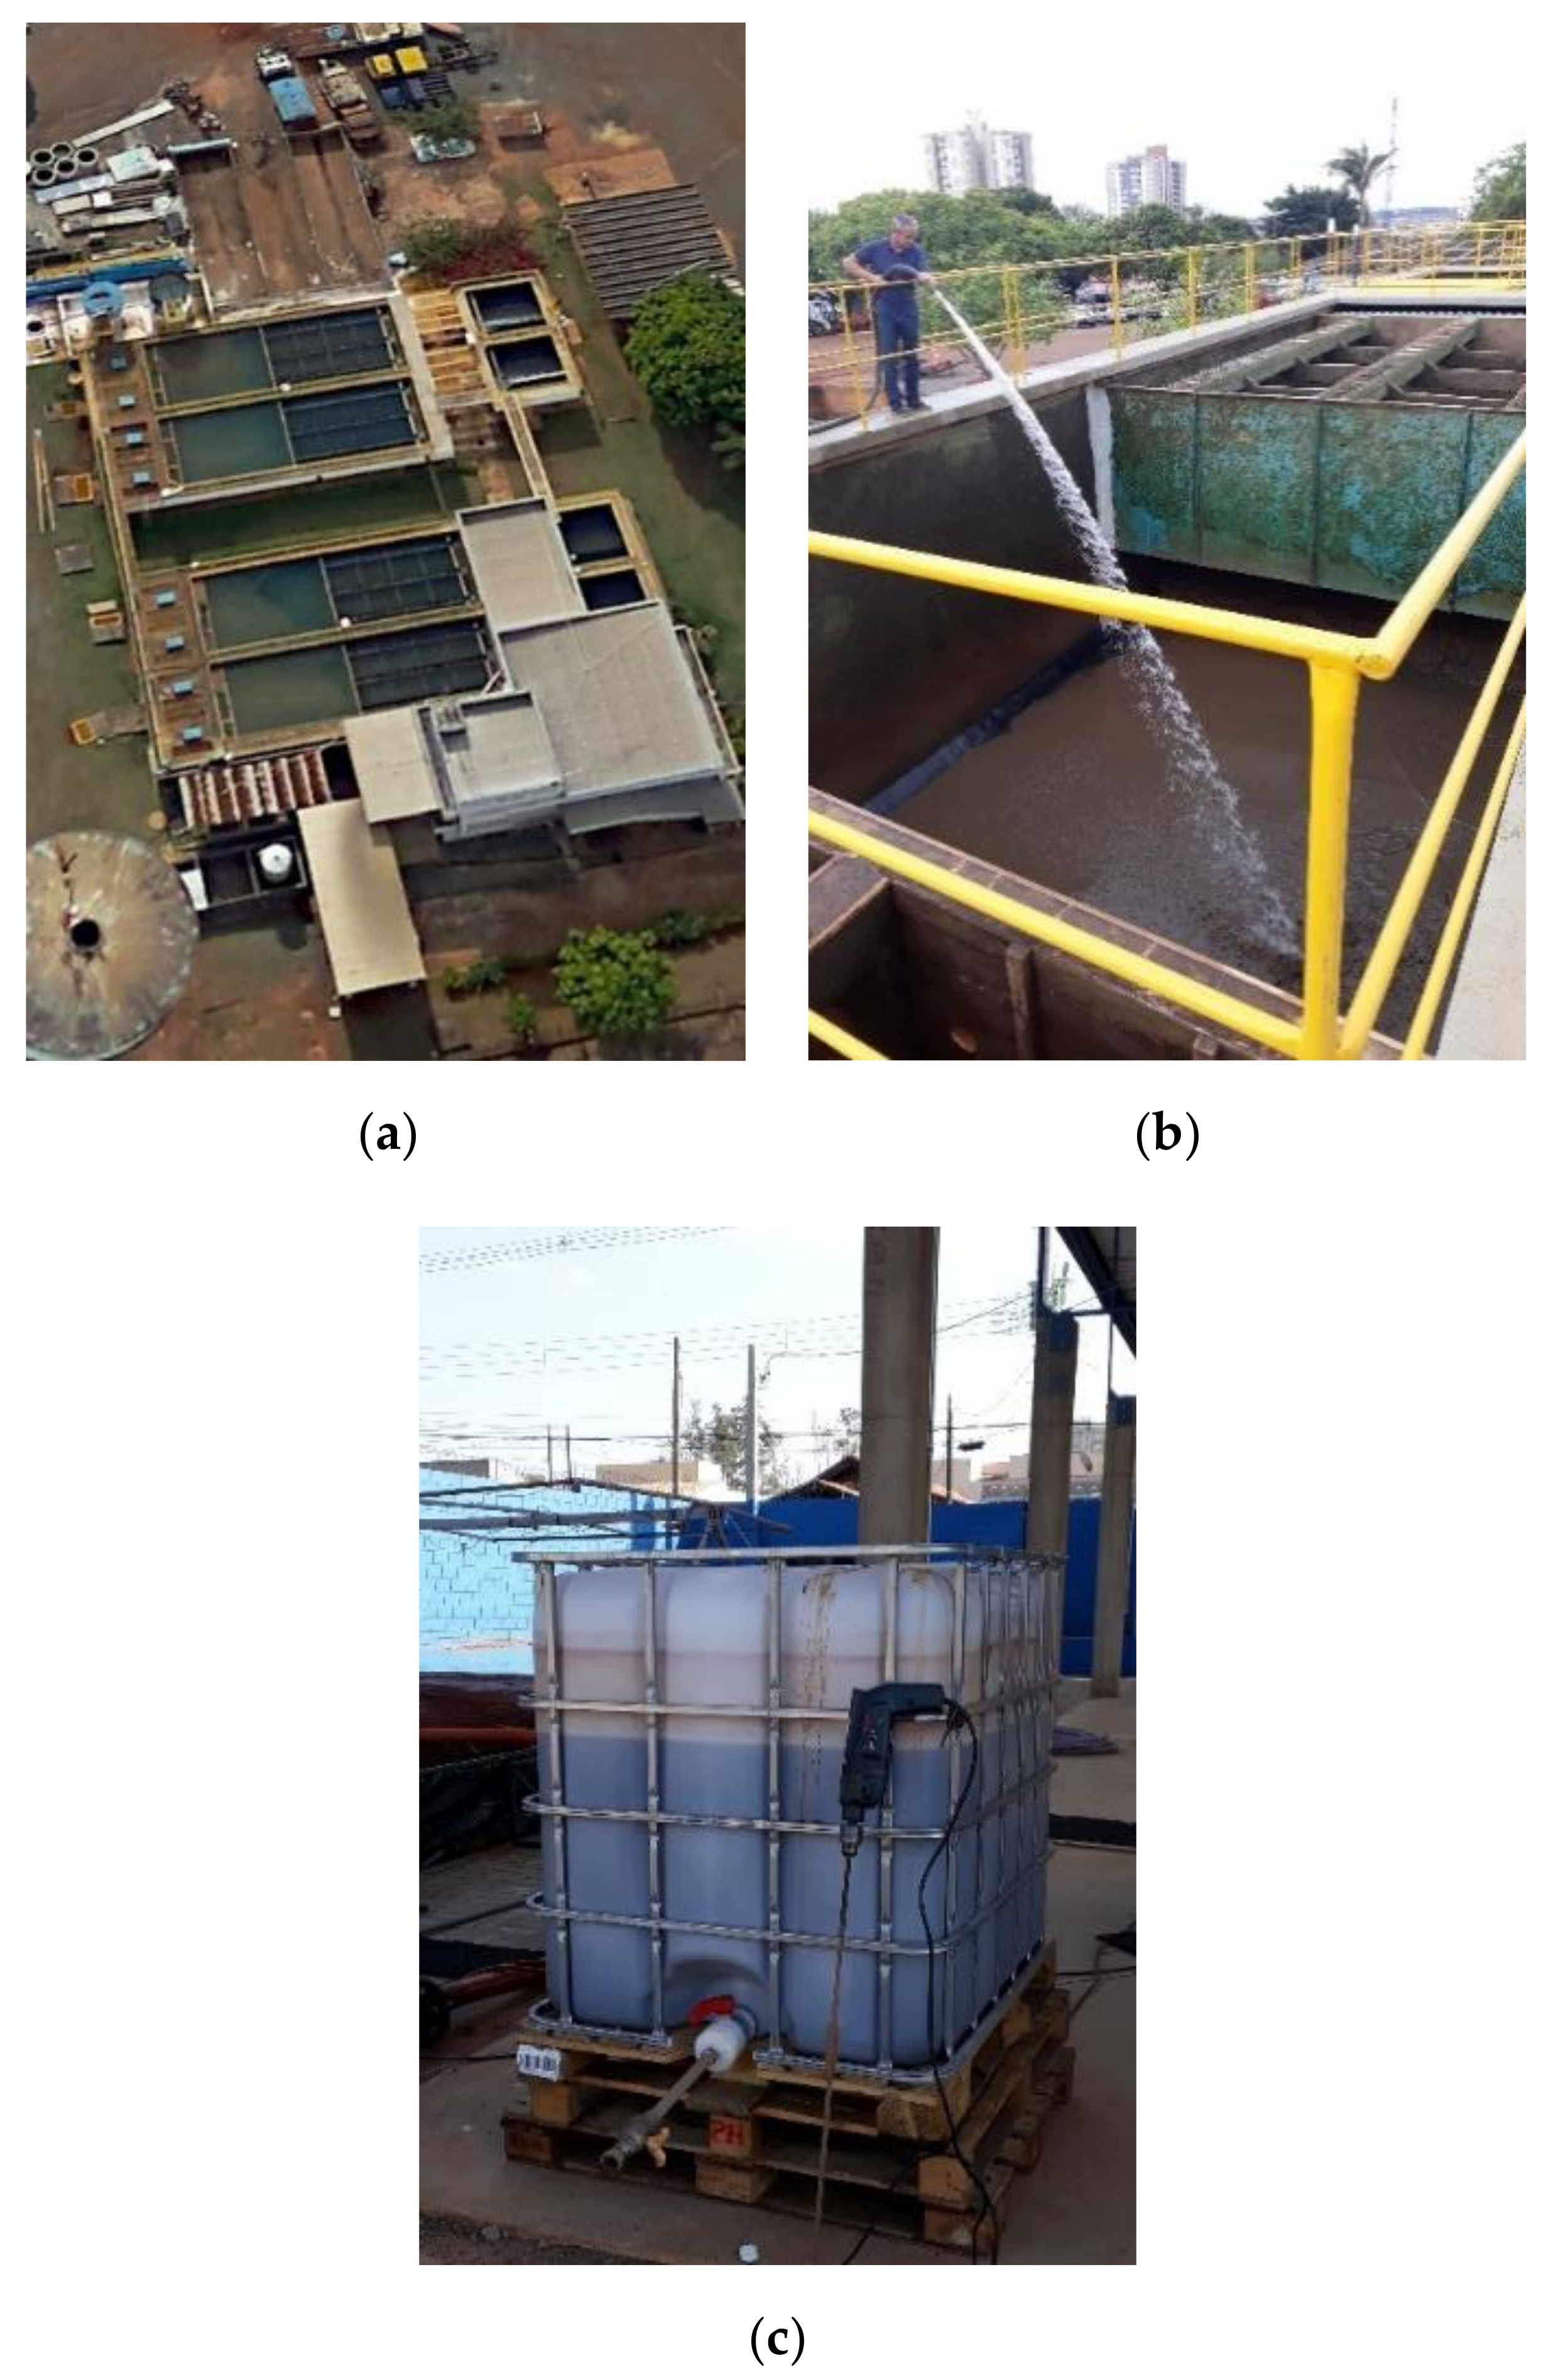
2.1. Sludge From WTP

The sludge used in the research was from a conventional WTP located in Nova Odessa, state of São Paulo, Brazil. This WTP treats an average of 15.5 million liters of water per day and uses poly aluminum chloride in the coagulation process. In order to carry out the tests, a single sludge sample was collected at the outlet of the decanter while washing one of the four decanters (Figure 1a,b) in a 1000-L reservoir (Figure 1c). The determination of total, fixed, and volatile solids was carried out in the WTP laboratory, according to test procedures of the Standard Methods for Examination of Water and Wastewater [43]. The results obtained in the tests of the solids contents are presented in Table 1.
The specific gravity of the grains test and granulometric analysis was carried out in the Soil Mechanics Laboratory at the University of São Paulo (USP) in São Carlos, state of São Paulo, Brazil. These tests were carried out according to the procedures of NBR 7181 and NBR 6458 [44,45], where the weight of the samples had to be adapted. The sample sludge presented specific gravity of the grains of 2.4 g/cm³. Figure 2 shows the granulometric distribution of the sludge. The granulometric curve of the sludge shows that the grain size distribution comprises 0.5% sand, 16.5% silt, and 83.0% clay.

2.2. Geotextiles

Three types of geotextiles were chosen that are commercially available in Brazil for dewatering applications. They consisted of two nonwoven (NW1 and NW2) and one woven geotextile (W1). The properties of the geotextiles are presented in Table 2. All the geotextile tests were carried out in the Geosynthetic Laboratory at the University of São Paulo (USP) in São Carlos, state of São Paulo, Brazil.

2.3. Polymer Floculant

The polymer was selected using jar test and cone tests. These tests were carried out in the WTP laboratory, aiming to identify the optimum polymer (flocculant) and dosage to increase the dewatering rate and minimize the effluent turbidity in the geotextile tubes. Ten polyacrylamide-derived polymers (anionic, cationic, and nonionic) were tested and the polymer that presented the best performance was the cationic polymer C8396. In recent years, many Brazilian studies have been carried out using the polymer C8396 (e.g., [28,51]).

2.4. Performance Index

The most common indexes for evaluating the dewatering performance are the Filtration Efficiency—FE (retention index) and Dewatering Efficiency—DE (dewatering index) [25]. Moo-Young and Tucker [36] expressed FE as the relation between the Total Solids (TS) of the sludge filtrate (effluent) and the TS of the sludge:
F E =   T S i n i t i a l T S f i n a l T S i n i t i a l ×   100   %
where T S i n i t i a l is the initial TS of the sludge (mg/L) and T S f i n a l is the final TS of filtrate (mg/L). However, determining the final TS concentration in the effluent is difficult if it has a low solids content. The retention performance can also be expressed in terms of effluent turbidity, as turbidity is a parameter that indicates the amount of TS present in the effluent, which consequently passed through the geotextile. On the other hand, the dewatering index DE measures how effectively fluid is drained from the sludge and is defined as:
D E =   P S f i n a l P S i n i t i a l P S i n i t i a l ×   100   %
where P S i n i t i a l is the initial percent solids of the sludge and P S f i n a l is the final percent solids of the sludge retained inside the tube. Equation (2) shows that DE has an inverse correlation with the initial percent solids content, indicating that DE can exceed 100%, hampering the interpretation. Bhatia et al. [25], recommend adopting of the index Percent Dewatered (PD) that can be easier to interpret because its maximum value its 100%, regardless of initial sludge concentration, and is defined as:
P D =   W i n i t i a l W f i n a l W i n i t i a l ×   100   %
where W i n i t i a l is the initial water content of the sludge, and W f i n a l is the final water content of the sludge retained inside the tube. The retention index and dewatering index adopted in this paper were turbidity and PD, respectively.

2.5. Statistical Analysis

The optimization of the GDT was carried out using the response surface methodology. Experimental planning called the Faced Centred Design (FCD) was carried out aiming to evaluate the dewatering according to Rodrigues and Iemma [52], in the function of the variable’s initial TS of the sludge and the polymer dosing. The FCD was carried out with one genuine repetition and three central points. Table 3 shows the levels of variables used in the experimental design.
For the initial TS variable (x1), the levels assessed by Queiroz and Guimarães [37,53] were adopted, where the maximum (20.00 g/L), medium (10.13 g/L), and minimum (0.25 g/L) were established as characteristic values for the discharge from the decanters, the equalization tank (filter washing water and the decanter discharge) and the filter washing water, respectively. The levels for polymer dosing (x2) were defined based on the literature and the jar test and cone test carried out.
The statistical analysis was carried out with a 90% confidence level and all data generated in the experimental designs were treated in the Protimiza Experimental Design software, obtaining the significance level of each researched variable (p-value). p-values equal to or greater than 0.10 (significance level) indicate that there was no statistical effect on the analyzed dependent variables. Mathematical models were obtained only with the results that showed statistical significance. Each mathematical model was subjected to analysis of variance (ANOVA) that incorporated the nonsignificant parameters into the residuals for the calculation. The adequacy of the predicted values with the experimental values was verified, and later the response surface graphs were generated for each dependent variable evaluated.
Statistical analysis using the Student’s t-distribution was carried out to validate the geotextile permittivity values after dewatering in all the test scenarios, with a confidence level of 98%.

2.6. Test Programme and Procedures

Table 4 shows the test program (scenarios), result of the experimental design with the coded values and the real values (between parentheses) of the studied variables. Moreover, 11 tests were carried out on each type of geotextile studied (totalized 33 GDT), whereby three of the tests were repeated at the central point (Tests No. 9, 10, and 11). A name was signed for each test number in order to facilitate the identification of the scenarios.
All the GDT were carried out in the WTP installations. The sample sludge collected with TS of 38 g/L was diluted in water from the same decanter until reaching the TS established in the experimental design for each scenario. The test methodology (apparatus) was adapted from ASTM D7880 [41] with 0.5 × 0.5 m bags (Figure 3).
The bags were filled with a 50 mm diameter tube, and the filling pressure resulted from the hydrostatic pressure due to the elevation of the reservoir above the geotextile bag specified in the ASTM D7880 [41] standard (1.10 m). The tube was connected to a system consisting of an elevated reservoir with a capacity of 100 L and a butterfly valve, which allowed us to control the volume of sludge inserted into each bag. The volume of sludge inserted was equal in all the tests (30 L), and the butterfly valve remained closed until the total volume of sludge required for each test was inserted in the reservoir. In order to allow the effluent to flow, the bags were supported on a metallic mesh, which was fixed to an easel made of PVC tubes. An impermeable layer was placed under the metallic mesh that led the effluent to the reservoirs placed at the bottom of the test configuration.
The solutions with the polymer dosing corresponding to each scenario were prepared in the WTP laboratory. The polymer was added directly to the elevated reservoir. The sludge and the polymer solution were homogenized with a metallic rod fixed to a drilling machine (for 1 min) keeping the solids in suspension. Subsequently, the test was started by opening the butterfly valve. The bottom reservoirs were changed at each time interval established in the procedure (5 min, 25 min, 1 h, 2 h, and 24 h), to collect and measure the effluent.
Dewatering was observed for one week. In the first 24 h, the volume and turbidity of the effluent were monitored, and samples of the sludge cake were collected within 24 to 168 h to calculate the evolution of the percent-solids.
In order to observe the changes (degradation) in the geotextiles after dewatering in the different scenarios analyzed, samples were collected from the bottom face of each bag to measure the permittivity property and for the SEM analyses. From each bag, five specimens were collected for permittivity tests according to the ASTM D4491 [49] standard. The exhumation was performed one month after each test, during which the bags remained closed. The SEM photomicrographs were obtained from the Chemical and Instrumental Analysis Center at the São Carlos Institute of Chemistry (CAQI/IQSC/USP) using ZEISS LEO 440 equipment (Cambridge, England) with an OXFORD detector (model 7060), operating with electron beam 15 kV, 2.82 A current, and 200pA I probe. The samples were covered with 6nm gold in a Coating System metallizer BAL-TEC MED 020 (BAL-TEC, Liechtenstein) and kept in a desiccator until the moment of analysis. The samples were covered with 6nm gold, in a Coating System metallizer BAL-TEC MED 020 (BAL-TEC, Liechtenstein) and kept in a desiccator until being analyzed.

3. Results and Discussion

In this section, the results of the dependent variables evaluated are presented and discussed: performance indices adopted in this work (effluent turbidity and PD), the dewatering rate, and the percent-solids observed at the end of the monitoring (Section 3.1, Section 3.2 and Section 3.3). The permittivity test and SEM analyses after dewatering are also shown (Section 3.4 and Section 3.5).

3.1. Effluent Turbidity

The results of turbidity obtained for each type of geotextile are analyzed in two steps, the initial step equal to 5 min after the start of the GDT and the second step 25 min after. The results of turbidity were presented in the initial periods evaluated of 5 and 25 min in Nephelometric Turbidity Unit (NTU), because data on the turbidity were missing in some scenarios in the periods of 1 h, 2 h, and 24 h due to the fact that the percolated volume was not sufficient to measure the turbidity. Considering that the bags were filled in a single cycle, a tendency to decrease turbidity was observed in the scenarios where it was possible to monitor the turbidity evolution during the 24 h. The second-order polynomial equations associated to the effluent turbidity results in each step for experimental design (geotextile type) are:
Turbidity at 5 min in NW1 (NTU) = 31.31 − 34.01 x2 + 80.45 x2244.20 x1 x2
Turbidity at 5 min in NW2 (NTU) = 24.55 + 14.31 x1 + 33.73 x22 + 16.01 x1 x2
Turbidity at 5 min in W1 (NTU) = 114.49 + 63.88 x1130.23 x2 + 144.84 x22161.76 x1 x2
Turbidity at 25 min in NW1 (NTU) = 7.22 + 15.27 x1 + 13.62 x12 + 7.80 x1 x2
Turbidity at 25 min in NW2 (NTU) = 9.75 + 19.81 x1 + 17.58 x12 + 8.63 x1 x2
Turbidity at 25 min in W1 (NTU) = 25.48 + 23.31 x112.36 x215.82 x1 x2
The mathematical models of the turbidity evaluated in the two times, showed that the two variables analyzed x1 (initial ST) and x2 (polymer dosing) presented statistical significance. The mathematical models were subjected to ANOVA and later the response surface graphs were generated. Figure 4, Figure 5 and Figure 6 show the response surfaces of turbidity in the GDT carried out with a bag made in NW1, NW2, and W1, respectively. The determination coefficients obtained for each response (Figure 4, Figure 5 and Figure 6) show that the regression models fit the experimental data, considering the inherent variability of the sludge. The values of determination coefficients (R2) were between 0.79 (Figure 5a) and 0.98 (Figure 6a).
After 25 minutes of testing (Figure 4b, Figure 5b, and Figure 6b) it was observed that in the three types of geotextiles evaluated there was a reduction in turbidity values, indicating that the filter cake was formed between the first 5 and 25 min of testing. Figure 4b and Figure 5b show that after 25 min the influence of the polymer dosing on the turbidity was weak for NW1 and NW2 (nonwoven geotextiles). Turbidity, in addition to being considered a retention index, is a parameter that indicates water quality. Analyzing turbidity as a quality parameter, turbidity values below 100 NTU were observed in all the experimental designs, indicating that after 25 min of test time, the effluent from the bags can be released into Class 2 water bodies, complying with Brazilian legislation [54,55]. It should be mentioned that turbidity is only one of the different parameters that evaluates the quality of the effluent and other physical–chemical parameters of the effluent established in the Resolution No. 430 [55] must be verified.
Regions that indicate a tendency to remove turbidity in the tests performed with NW1 and NW2 were observed (Figure 4b and Figure 5b). In the NW1 (Figure 4b), this region is delimited by the initial TS concentration below 5.75 g/L and polymer dosing above 2.33 mgPol/gTS. On the other hand, the turbidity removal effect in the NW2 (Figure 5b) was observed for sludge with initial TS also below 5.75 g/L and polymer dosing above 2.46 mgPol/gTS.
For Class 2 water bodies, the Brazilian National Environment Council (CONAMA) Resolution No.357 and No.430 [54,55] establish the effluent characteristics to discharge. However, in Brazil, there are no specific rules or legislation for the recirculation of effluents in the WTP [37,53]. As a result, internationally recommended values are used, such as the recommendation for recirculation of filtered washing water in the United Kingdom, which establishes a maximum value of turbidity of 5 NTU [56]. In compliance with the recommendation and considering the possible recirculation of the effluent generated in the dewatering of sludge, the response surfaces of the bags manufactured in each geotextile type were analyzed. In the bags made in NW1 (Figure 4b), the region that presents turbidity below 5 NTU is delimited by the initial TS concentration below 9.15 g/L and polymer dosing greater than 1.2 mgPol/gTS. In the bags made in NW2 (Figure 5b), this region is bounded by the initial TS concentration between 1.7 and 6.95 g/L and polymer dosing greater than 1.55 mgPol/gTS. Finally, in the bags made in W1 (Figure 6b), the region is delimited by the initial TS concentration below 1.85 g/L and polymer dosage below 2.50 mgPol/gTS. It is observed that for the three types of geotextile, the region that presented turbidity below 5 NTU is related to low initial TS concentrations.

3.2. Dewatering Rate

The rate of sludge dewatering in the bags manufactured in different types of geotextiles was evaluated in the initial and final monitoring stages. The rate of the initial stage was calculated with the volume of effluent collected during the first 5 minutes of testing, and the final rate calculated with the accumulated volume of effluent collected during the 24 hours of testing. The mathematical models of initial dewatering rate in each geotextile type are:
Initial dewatering rate in NW1 (cm3/s) = 57.97 − 20.01 x1 + 17.12 x12 + 4.95 x2
Initial dewatering rate in NW2 (cm3/s) = 56.68 − 24.04 x1 + 13.84 x12 + 11.93 x2
Initial dewatering rate in W1 (cm3/s) = 59.47 − 23.08 x1 + 21.49 x12 + 6.44 x29.11 x22 + 8.04 x1 x2
In all mathematical models (Equations (10)–(12)), the independent variables analyzed (x1 and x2) were statistically significant. The initial dewatering rate in the nonwoven geotextiles (Equations (10) and (11)) presented a second-order polynomial equation according to the same terms (x1, x12, x2), and the woven geotextile (Equation (12)) presented an equation according to all possible terms in a second-order polynomial equation.
The response surfaces for each type of geotextile and the determination coefficients are presented in Figure 7. It can be concluded that the models adjusted well to the experimental data. In fact, the minimum R2 value obtained in the response surfaces of the initial dewatering rate is 88% (Figure 7b), indicating that 12% of the total variation is not explained by the model.
Analyzing the response surfaces of the initial dewatering rate in the three geotextiles (Figure 7), it is observed that the dewatering responses in bags manufactured from NW1 geotextile (Figure 7a), presented higher dewatering rates compared to those observed in the other response surfaces (Figure 7b,c). The surface response (Figure 7a) shows dewatering rates greater than 50 cm3/s, with the exception of the sludge with TS concentration greater than 11.90 g/L and polymer dosage between 0.80 mgPol/gTS and 1.32 mgPol/gTS.
On the other hand, the mathematical models of the final dewatering rate presented the same equation (Equation (13)) in the different types of geotextile evaluated.
Final dewatering rate (cm3/s) = 0.30 − 0.03 x1
The equation indicates that only the linear term of the variable x1 (initial TS) have statistical significance in the model. The response surfaces of the final dewatering rate of each geotextile and the values of R2 are presented in the Figure 8. The decrease in the final dewatering rate may be related to evaporation, due to the fact that this rate is determined in function to the volume of effluent collected. It is noteworthy that the effluent was stored in the reservoir during the 24 h of testing and exposed to environmental conditions.

3.3. Percent-Solids and PD

The results of the percent-solids presented, referred to the end of the monitoring (168 h after testing). To calculate the dewatering index PD using Equation (3), the final water content of the sludge was the retained in the bag 168 h after testing. The mathematical models of percent-solids and PD are:
Percent-solids in NW1 (%) = 58.66 + 17.83 x140.82 x12
Percent-solids in NW2 (%) = 41.37 + 13.27 x128.10 x12
Percent-solids in W1 (%) = 46.11 + 15.06 x131.04 x12
PD in NW1 (%) = 99.05 + 48.16 x150.90 x12
PD in NW2 (%) = 98.44 + 47.13 x151.31 x12
PD in W1 (%) = 98.51 + 47.63 x150.88 x12
As in the mathematical model of the final dewatering rate, the models of percent-solids and PD have statistical significance only of the variable initial TS (x1). The equations are presented in the function of the linear and quadratic terms of the variable x1. Figure 9 shows the response surfaces of percent-solids and PD generated after the ANOVA.
The values of determination coefficients of percent-solids were between 0.70 and 0.88 (Figure 9a). It is observed that the maximum percent-solid point for the three types of geotextiles is obtained when the sludge has an initial TS concentration of 12.1 g/L. The maximum values of final percent-solids for NW1, NW2, and W1 are 60.59%, 42.9%, and 47.9%, respectively.
The determination coefficients obtained for the PD responses show that the regression model fits the experimental data correctly. In fact, R2 in PD was 99.90% in the three response surface models. It is observed that the maximum PD point is obtained at the initial TS concentration of 10.13 g/L (level 0 of the variable x1) for the three types of geotextiles. It is noteworthy that the PD response surface shown in Figure 9b shows values greater than 100%, because in the analysis of variance that influences the creation of the response surface, the maximum value is not established. However, the maximum values of the final PD in the experimental design for the geotextiles NW1, NW2, and W1 were 99.05%, 98.44%, and 98.51%, respectively, as observed in the mathematical models (Equations (17)–(19)) when x1 = 0.
It is observed that the GDT carried out in bags made in NW1 reached the highest final percent-solids and PD. The values of percent-solids obtained from tests with bags manufactured in W1 are within the range of values obtained by Guimarães [53] after 168 h of testing (from 40% to 60%). It should be stressed that the author followed the evolution of the content of solids inside the bags until reaching values above 90% (for approximately 40 days). Such results show the efficiency of sludge dewatering in the three types of geotextiles evaluated when compared with the literature that recommends solids content inside geotextile tubes above 20% [53], to a subsequent transfer to sanitary landfills.
Analyzing the evolution of percent-solids inside the bags during the test period in the three geotextiles tested (Figure 10), evaporation influences in the dewatering performance are clear by observing the increase of the percent-solids. According to Müller and Vidal [57], water loss occurs most significantly at the beginning of the dewatering process, through drainage, representing a large initial volume reduction, and subsequently, the evaporation represents the main water exit path of the geotextile tubes. Unfortunately, the evaporation of dewatering performance could not quantify in the GDT. It should underscore that the bags remained closed during the monitoring (168 h) and its feeding sleeve opened quickly only to collect samples of the sludge cake. In addition, the bags did not filter a significant volume of effluent after 24 h of testing. It was not possible to present the evolution of the percent-solids of the tests with an initial TS of 0.25 g/L (scenarios −1A, −1B, and −1C), as there was not enough volume of sludge kept inside the bag to determine the percent-solids. Figure 10a shows the evolution of the percent-solids for sludge with an initial TS of 10.13 g/L (scenarios 0A, 0B*-the average value of the central points of each experimental design, and 0C) and Figure 10b the evolution of the percent-solids for sludge with an initial TS of 20 g/L (scenarios 1A, 1B, and 1C). In general, it is observed that the GDT with initial TS of 10.13 g/L presented a final percent-solids (after 168 hours) higher than the GTD with an initial TS of 20 g/L. Comparing the test scenarios, the scenario with the highest final percent-solids was 0B* (with polymer dosing of 1,7 mgPol/gTS) in the GDT with bags elaborated in NW1 (Figure 10a), followed by the GDT in scenario 0A (with polymer dosing of 0.8 mgPol/gTS) where the evolution of the percent-solids in the GDT in the three types of geotextiles showed similar behavior (Figure 10a).

3.4. Geotextiles Permittivity

Table 5 shows the average values of permittivity carried out according to the ASTM D4491 [49], with the confidence interval (in parentheses) in each evaluated scenario where the reference is the permittivity value of the virgin sample of the geotextiles, and 0B* is the average permittivity value of the central points of each experimental design (average value of scenarios 0B1, 0B2, and 0B3).
Figure 11 shows the average permittivity values of the three types of geotextiles after dewatering in the nine scenarios (scenarios 0B1, 0B2, and 0B3 = scenario 0B*) resulting from the experimental design and the permittivity values of the virgin samples (Reference). In each bar (scenario), the sample variation is illustrated. After dewatering, it was observed that there was a decrease in permittivity in all scenarios evaluated in all the geotextiles (NW1, NW2, and W1) in relation to the average permittivity value of the virgin sample (Reference), highlighting that the reduction of this property over time is considered for the assessment of clogging in geotextiles [58,59,60]. It was found that the dewatering of the sludge generated a drastic reduction in the permittivity values, which affects the permeability, the decrease of which is related to the formation of the filter cake, which according to Moo-Young et al. [21], after its formation improves the characteristics of the effluent, but reduces the permeability of the system.
In the general analysis, the percentages of permittivity reduction varied from 19.27% (scenario 1C—NW2) to 50.04% (scenario −1C—NW2), in which NW2 was the geotextile with the greatest variation. Comparing the geotextiles in the scenarios with the same initial TS (Table 5 and Figure 11), it is observed that for the initial ST of 0.25 g/L (level −1) in nonwoven geotextiles (NW1 and NW2), the permittivity decreased with the increase in the polymer dosing. As for the initial TS of 10.13 g/L (level 0) in the three types of geotextile evaluated (NW1, NW2, and W1), the 0B* scenario with a dosage of 1.7 mgPol/gTS was the one that showed the greatest decrease in permittivity. In scenarios with initial TS of 20 g/L (level 1) in the nonwoven geotextiles (NW1 and NW2), scenario 1A with a dosage of 0.8 mgPol/gTS showed the greatest decrease in permittivity in relation to the virgin sample, and in the woven geotextile (W1) the scenarios 1A and 1C showed the same decrease in permittivity (45.20%). It was observed that the formation of the filter cake reflects in the decrease of the permeability [21], in this case in the permittivity that is directly proportional to the permeability.

3.5. SEM

Using SEM photomicrographs to evaluate geotextiles characteristics has been considered in the scientific literature, particularly for estimating the pore size distribution of nonwoven geotextiles used for filtration [61]. The SEM analyses were used to evaluate qualitatively the changes in the geotextiles, and highlight details of the disposition of sludge particles in the geotextiles fibers, complementing the results obtained in permittivity tests. SEM images are presented of the scenarios where there was a greater and lesser reduction in the permittivity. Figure 12 and Figure 13 show the nonwoven geotextiles SEM images that are presented with magnification 500×.
Figure 12a and Figure 13a show the virgin samples of the NW1 and NW2 geotextiles (both of polyester) where tiny portions of material adhered to the filaments and cracks in the fibers of the geotextiles are noted, which, according to the supplier, are due to the oil content used in the manufacturing process to reduce the friction between the polyester fibers during the needling process. This technique is commonly used in the manufacturing of nonwoven geotextiles. It noted that these characteristics do not compromise the filtration function of the geotextiles. The SEM analyses showed similar fiber sizes between the geotextiles, but the spacing is greater between the NW2 geotextile fibers, which represent its larger filtration opening.
Figure 12b,c show the images of the scenarios with the lowest (scenario 1B) and the largest (scenario 1A) reduction in permittivity in relation to the virgin sample in the geotextile NW1. In the scenario 1A (Figure 12c) the presence of larger sludge particles adhered to the geotextile fibers is high compared with the presented in the scenario 1B (Figure 12b). This particle adhesion can cause blinding, explaining the reduction of permittivity in the NW1.
The NW2 geotextile is the material with the highest mass per unit area (895 g/m2) used in the study and the geotextile that presented the scenario with the greatest reduction in permittivity between the three types of geotextiles evaluated. NW2 underwent a permittivity reduction of 50% in the 1C scenario (Figure 13c), as a result of the partial closure of the pores of the geotextile due to the amount of sludge particles adhered to the fibers. In the NW2 geotextile as well, it is noted by SEM analysis that in scenario 1C (Figure 13b) there were smaller particles adhered to the geotextile filaments, which influenced to a lesser extent the decrease in permittivity.
In the virgin sample of the W1 presented in Figure 13a, there are tiny portions of adhered material resulting from the manufacturing process. The images of this type of material were obtained with a magnification of up to 75× (Figure 14), as it was not necessary to have more detail, due to the fact that the fibers are organized and of larger size when compared to nonwoven geotextiles.
When evaluating the image of geotextile W1 in the scenarios with less and greater reduction in permittivity (Figure 14b,c), it was noted that the images do not provide much information, as only some sludge particles were deposited at the intersection of the fibers in both scenarios, showing the importance of carrying out an analysis of the cross section of the geotextile as performed by Mlynarek and Rollin [62], which in this case was not possible due to the difficulty of obtaining a sample of the unformed cross section. The importance of the representativeness of the samples is highlighted, which could be improved with the comparison of samples collected at different points of the same material.
The fact of not observing differences between the scenarios can also be related to the sample chosen to perform the SEM, considering the sample size is approximately 1 cm² and considering that there could be places with greater representativeness, which can be a disadvantage in the time to evaluate the results obtained.

4. Conclusions

The present experimental study aims to contribute to the knowledge and the dissemination of the geotextile tubes technology used in the WTP sludge dewatering. Based on the results, the following conclusions are presented below:
  • The use of the Faced Centered Design of the Response Surface Methodology was presented as an efficient tool for the experimental planning of the tests, optimizing the results obtained and facilitating their interpretation. The levels adopted for the analyzed independent variables (initial sludge TS and polymer dosing) were effective, since these were statistically significant.
  • Despite the fact that the independent variable polymer dosing did not have statistical significance in all the dependent variables analyzed, such as the final dewatering rate, the percent-solids, and the PD. The result is debatable as several related studies and preliminary cone tests carried out in this work have shown the importance of the chemical conditioning of the sludge as an accelerator in the dewatering. It is noteworthy that the results analyzed for percent-solids and PD were the final results obtained 168 h after the beginning of the test, and the final dewatering rate obtained 24 h after the beginning of the test, which could indicate that the polymer dosing influences the initial dewatering stage.
  • The GDT carried out proved to be adequate for the achievement of the proposed objectives, showing the importance of carrying out tests to evaluate the dewatering in geotextile tubes.
  • After dewatering, there was a decrease in permittivity in the three types of geotextile in all the evaluated scenarios, thus verifying the formation of the filter cake in the geotextile bags that was corroborated by the SEM analyses. It was also verified that the formation of the filter cake contributed to the improvement of the effluent quality.
  • In order for the effluent, resulting from sludge dewatering, to be directly deposited in water bodies or recirculated in the same WTP, it is proposed that the effluent collected at the beginning of the dewatering (before the formation of the filter cake) should be recirculated inside the geotextile tube so that it can be filtered again, and therefore improve its quality.
  • Analyzing the performance indices, the quality of the effluent, and the final percent-solids, this latter a fundamental parameter in the routine of treatment of WTP sludge. It is concluded that under the same test conditions, the dewatering performance was better in the bags fabricated in NW1 (nonwoven geotextile), followed by the bags fabricated in W1 (woven geotextile commonly used), indicating the feasibility of using nonwoven geotextile tubes for the dewatering of WTP sludge.
  • It is recommended to quantify the influence of evaporation on the dewatering of geotextile tubes in future research, due to this form of water loss is the one that runs the dewatering in the post-drainage stage. It is also interesting that full performance tests (real scale) are performed to verify the scale-effect and the influence of the dependent variables evaluated in the present work (initial TS and polymer dosing) in the dewatering performance.

Author Contributions

Conceptualization, investigation, and resources, M.A.A.A. and S.T.d.S.; methodology, M.A.A.A. and C.A.V.; software, A.D.B.D. and M.A.A.A.; validation, formal analysis, data curation, visualization and writing—original draft preparation, M.A.A.A.; writing—review and editing, J.L.d.S. and C.A.V.; supervision, J.L.d.S. and A.D.B.D.; project administration and funding acquisition, J.L.d.S. All authors have read and agreed to the published version of the manuscript.

Funding

This work was financially supported by the Laboratory of Geosynthetics of the University of São Paulo (USP) and the Coordenação de Aperfeiçoamento de Pessoal de Nível Superior (CAPES; 001).

Acknowledgments

The authors are grateful for the financial support received from the CAPES, Ober and Huesker for providing geotextile tubes and the CODEN for providing the sludge and the physical space in which conduct the tests. Also to, SEM facilities were provided by CAQI/IQSC/USP.

Conflicts of Interest

The authors declare no conflict of interest. The funders had no role in the design of the study; in the collection, analyses, or interpretation of data; in the writing of the manuscript, or in the decision to publish the results.

References

  1. Cordeiro, J.S. Processamento de lodos de Estações de Tratamento de Água (ETAs). In Resíduos Sólidos do Saneamento: Processamento, Reciclagem e Diposição Final; Projeto PROSAB: Rio de Janeiro, Brazil, 2001; pp. 121–142. [Google Scholar]
  2. Reali, M.A.P. Principais características quantitativas e qualitativas do lodo de ETAs. In Noções Gerais de Tratamento e Disposição Final de Lodos de ETA; ABES/PROSAB: Rio de Janeiro, Brazil, 1999; pp. 21–39. [Google Scholar]
  3. Dantas, A.D.B.; Voltan, P.E.N. Métodos e Técnicas de Tratamento de Água, 3rd ed.; LDiBe: São Carlos, Brazil, 2017; p. 1246. [Google Scholar]
  4. Achon, C.L.; Barroso, M.M.; Cordeiro, J.S. Resíduos de estações de tratamento de água e a ISO 24512: Desafio do saneamento brasileiro. Eng. Sanit. e Ambient. 2013, 18, 115–122. [Google Scholar] [CrossRef] [Green Version]
  5. LAW, Brazilian Environmental Crimes; Brazilian Law 9605/1998. 1998. Available online: http://www.planalto.gov.br/ccivil_03/leis/l9605.htm#:~:text=LEI%20N%C2%BA%209.605%2C%20DE%2012%20DE%20FEVEREIRO%20DE%201998.&text=Disp%C3%B5e%20sobre%20as%20san%C3%A7%C3%B5es%20penais,ambiente%2C%20e%20d%C3%A1%20outras%20provid%C3%AAncias (accessed on 8 September 2020).
  6. LAW, National Policy on Solid Waste, Alters Law 9605/1998 and Makes Other Provisions; Brazilian Law 12305/2010. 2010. Available online: http://www.planalto.gov.br/ccivil_03/_ato2007-2010/2010/lei/l12305.htm (accessed on 8 September 2020).
  7. Grzelak, M.D.; Maurer, B.W.; Pullen, T.S.; Bhatia, S.K.; RamaRao, B. A Comparison of Test Methods Adopted for Assessing Geotextile Tube Dewatering Performance. Geo-Front. 2011 Adv. Geotech. Eng. 2011, 2141–2151. [Google Scholar] [CrossRef]
  8. Fowler, J.; Bagby, R.M.; Trainer, E. Dewatering sewage sludge with geotextile tubes. In Proceedings of the 49th Canadian Geotechnical Conference, St. John’s, NL, Canada, 23–25 September 1996; pp. 1–31. [Google Scholar]
  9. Lawson, C. Geotextile containment for hydraulic and environmental engineering. Geosynth. Int. 2008, 15, 384–427. [Google Scholar] [CrossRef]
  10. Guimarães, M.G.A.; Urashima, D.d.C. Dewatering sludge in geotextile closed systems: Brazilian experiences. Soils Rocks 2013, 36, 251–263. [Google Scholar]
  11. Muthukumaran, A.; Ilamparuthi, K. Laboratory studies on geotextile filters as used in geotextile tube dewatering. Geotext. Geomembr. 2006, 24, 210–219. [Google Scholar] [CrossRef]
  12. Fowler, J.; Duke, M.; Schmidt, M.L.; Crabtree, B.; Bagby, R.M.; Trainer, E. Dewatering sewage sludge and hazardous sludge with geotextile tubes. In Proceedings of the 7th International Conference on Geosynthetics, Nice, France, 22–27 September 2002; Delmas, P., Gourc, H., Girard, G.P., Eds.; Swets & Zeitlinger: Lisse, The Netherlands, 2002; pp. 1007–1012. [Google Scholar]
  13. Koerner, G.; Koerner, R. Geotextile tube assessment using a hanging bag test. Geotext. Geomembr. 2006, 24, 129–137. [Google Scholar] [CrossRef]
  14. Satyamurthy, R.; Bhatia, S.K. Effect of polymer conditioning on dewatering characteristics of fine sediment slurry using geotextiles. Geosynth. Int. 2009, 16, 83–96. [Google Scholar] [CrossRef]
  15. Suits, L.D.; Sheahan, T.C.; Koerner, R.M.; Koerner, G.R. Performance Tests for the Selection of Fabrics and Additives When Used as Geotextile Bags, Containers, and Tubes. Geotech. Test. J. 2010, 33, 236–242. [Google Scholar] [CrossRef]
  16. Weggel, J.R.; Dortch, J.; Gaffney, D. Analysis of fluid discharge from a hanging geotextile bag. Geotext. Geomembr. 2011, 29, 65–73. [Google Scholar] [CrossRef]
  17. Maurer, B.W.; Gustafson, A.; Bhatia, S.; Palomino, A. Geotextile dewatering of flocculated, fiber reinforced fly-ash slurry. Fuel 2012, 97, 411–417. [Google Scholar] [CrossRef]
  18. Khachan, M.; Bhatia, S.K.; Bader, R.A.; Cetin, D.; RamaRao, B. Cationic starch flocculants as an alternative to synthetic polymers in geotextile tube dewatering. Geosynth. Int. 2014, 21, 119–136. [Google Scholar] [CrossRef]
  19. Kang, J.; McLaughlin, R. Simple systems for treating pumped, turbid water with flocculants and a geotextile dewatering bag. J. Environ. Manag. 2016, 182, 208–213. [Google Scholar] [CrossRef] [PubMed]
  20. Pilarczyk, K.W. BOOK REVIEW/CRITIQUE DE LIVRE Geosynthetics and geosystems in hydraulic and coastal engineering. Can. J. Civ. Eng. 2001, 28, 878. [Google Scholar] [CrossRef] [Green Version]
  21. Moo-Young, H.K.; A Gaffney, D.; Mo, X. Testing procedures to assess the viability of dewatering with geotextile tubes. Geotext. Geomembr. 2002, 20, 289–303. [Google Scholar] [CrossRef]
  22. Liao, K.; Bhatia, S.K. Geotextile Tube: Filtration Performace of woven geotextiles under pressure. North American Geosynthetic Conference. Presented at NAGS 2005/GRI 19 Cooperative Conference, Las Vegas, NV, USA, 14–16 December 2005; pp. 1–15. [Google Scholar]
  23. Cantré, S.; Saathoff, F. Design parameters for geosynthetic dewatering tubes derived from pressure filtration tests. Geosynth. Int. 2011, 18, 90–103. [Google Scholar] [CrossRef]
  24. Yee, T.; Lawson, C.; Wang, Z.; Ding, L.; Liu, Y. Geotextile tube dewatering of contaminated sediments, Tianjin Eco-City, China. Geotext. Geomembr. 2012, 31, 39–50. [Google Scholar] [CrossRef]
  25. Bhatia, S.K.; Maurer, B.W.; Khachan, M.M.; Grzelak, M.D.; Pullen, T.S. Performance Indices for Unidirectional Flow Conditions Considering Woven Geotextiles and Sediment Slurries. Found. Eng. Face Uncertain. 2013, 318–332. [Google Scholar] [CrossRef]
  26. Bourgès-Gastaud, S.; Stoltz, G.; Sidjui, F.; Touze-Foltz, N. Nonwoven geotextiles to filter clayey sludge: An experimental study. Geotext. Geomembr. 2014, 42, 214–223. [Google Scholar] [CrossRef] [Green Version]
  27. Khachan, M.; Bhatia, S. The efficacy and use of small centrifuge for evaluating geotextile tube dewatering performance. Geotext. Geomembr. 2017, 45, 280–293. [Google Scholar] [CrossRef]
  28. Guimarães, M.; Urashima, D.D.C.; Vidal, D.D.M. Dewatering of sludge from a water treatment plant in geotextile closed systems. Geosynth. Int. 2014, 21, 310–320. [Google Scholar] [CrossRef]
  29. Weggel, J.R.; Ward, N.D. A model for filter cake formation on geotextiles: Theory. Geotext. Geomembr. 2012, 31, 51–61. [Google Scholar] [CrossRef]
  30. Weggel, J.R.; Dortch, J. A model for filter cake formation on geotextiles: Experiments. Geotext. Geomembr. 2012, 31, 62–68. [Google Scholar] [CrossRef]
  31. Christopher, B.; Fischer, G. Geotextile Filtration Principles, Practices and Problems. Geosynth. Filtr. Drain. Eros. Control 1992, 1–17. [Google Scholar] [CrossRef]
  32. Shin, E.C.; Oh, Y.I. Analysis of geotextile tube behaviour by large-scale field model tests. Geosynth. Int. 2003, 10, 134–141. [Google Scholar] [CrossRef]
  33. Driscoll, J.; Rupakheti, P.; Bhatia, S.K.; Khachan, M.M. Comparison of 1-D and 2-D Tests in Geotextile Dewatering Applications. Int. J. Geosynth. Ground Eng. 2016, 2, 2. [Google Scholar] [CrossRef]
  34. Huang, C.-C.; Luo, S.-Y. Dewatering of reservoir sediment slurry using woven geotextiles. Part I: Experimental results. Geosynth. Int. 2007, 14, 253–263. [Google Scholar] [CrossRef]
  35. Huang, C.-C.; Jatta, M.; Chuang, C.-C. Dewatering of reservoir sediment slurry using woven geotextiles. Part II: Analytical results. Geosynth. Int. 2012, 19, 93–105. [Google Scholar] [CrossRef]
  36. Moo-Young, H.K.; Tucker, W.R. Evaluation of vacuum filtration testing for geotextile tubes. Geotext. Geomembr. 2002, 20, 191–212. [Google Scholar] [CrossRef]
  37. Queiroz, S.C.B. Influência das Características da Água Bruta no Desaguamento de Resíduos Gerados no Tratamento de Água Pela Filtração em Tubo Geotêxtil. Ph.D. Thesis, Universidade de Ribeirão Preto, Ribeirão Preto, SP, Brazil, 2019. [Google Scholar]
  38. Ratnayesuraj, C.R.; Bhatia, S.K. Testing and analytical modeling of two-dimensional geotextile tube dewatering process. Geosynth. Int. 2018, 25, 132–149. [Google Scholar] [CrossRef]
  39. GRI Test Method GT14:2004. Standard Test Method for Hanging Bag Test for Field Assessment of Fabrics Used for Geotextile Tubes and Containers; Geosynthetics Research Institute: Folsom, CA, USA, 2004. [Google Scholar]
  40. GRI Test Method GT15:2009. Standard Test Method for the Pillow Test for Test Field Assessment of Fabrics/Additives Used for Geotextile Bags, Containers and Tubes; Geosynthetics Research Institute: Folsom, CA, USA, 2009. [Google Scholar]
  41. ASTM D7880:2013. Standard Test Method for Determining Flow Rate of Water and Suspended Solids Retention from a Closed Geosynthetic Bag; ASTM International: West Conshohocken, PA, USA, 2013. [Google Scholar]
  42. Rawal, A.; Anandjiwala, R. Comparative study between needlepunched nonwoven geotextile structures made from flax and polyester fibres. Geotext. Geomembr. 2007, 25, 61–65. [Google Scholar] [CrossRef]
  43. Clesceri, L.S. Standard Methods for the Examination of Water and Wastewater, 22nd ed.; Rice, E.W., Baird, R.B., Eaton, A.D., Clesceri, L.S., Eds.; American Public Health Association: Washington, DC, USA, 2012; p. 724. [Google Scholar]
  44. Solo-Análise Granulométrica; Associação Brasileira de Normas Técnicas: Rio de Janeiro, Brazil, 1984; ABNT NBR 7181.
  45. Grãos de Pedregulho Retidos na Peneira de Abertura 4,8 mm—Determinação da Massa Específica, da Massa Específica Aparente e da Absorção de Água; Associação Brasileira de Normas Técnicas: Rio de Janeiro, RJ, Brazil, 2017; ABNT NBR 6458.
  46. Geossintéticos: Método de Ensaio Para Determinação da Massa Por Unidade de Área de Geotêxteis e Produtos Correlatos; Associação Brasileira de Normas Técnicas: Rio de Janeiro, RJ, Brazil, 2013; ABNT NBR ISO 9864:2013.
  47. Geossintéticos: Determinação da Espessura a Pressões Especificadas Parte 1: Camada Única; Associação Brasileira de Normas Técnicas: Rio de Janeiro, RJ, Brazil, 2013; ABNT NBR ISO 9863-1:2013.
  48. Geotêxteis e Produtos Correlatos: Determinação da Abertura de Filtração Característica; Associação Brasileira de Normas Técnicas: Rio de Janeiro, RJ, Brazil, 2013; ABNT NBR ISO 12956:2013.
  49. Standard Test Methods for Water Permeability of Geotextiles by Permittivity; ASTM International: West Conshohocken, PA, USA, 2015; ASTM D4491:2015.
  50. Geossintéticos: Ensaio de Tração de Faixa Larga; Associação Brasileira de Normas Técnicas: Rio de Janeiro, RJ, Brazil, 2013; ABNT NBR ISO 10319:2013.
  51. Guanaes, E.A.; Guimarães, M.G.A.; de Carvalho Urashima, D.; Pontes, P.P. Análise laboratorial do desaguamento do lodo residual de estação de tratamento de água por meio de geossintéticos. Educ. Tecnol. 2009, 14, 33–39. [Google Scholar]
  52. Rodrigues, M.I.; Iemma, A.F. Experimental Design and Process Optimization; CRC Press: New York, NY, USA, 2014. [Google Scholar]
  53. Guimarães, G. Eficiência do Desaguamento de Resíduo de Estação de Tratamento de Água em Tubo Geotêxtil. Ph.D. Thesis, Universidade de Ribeirão Preto, Ribeirão Preto, SP, Brazil, 2019. [Google Scholar]
  54. Resolution, Brazilian National Council of Environment, Establishes Provisions for the Classification of Water Bodies as Well as Environmental Directives for Their Framework, Establishes Conditions and Standards for Effluent Releases and Makes Other Provisions; CONAMA Resolution 357/05. Available online: http://www2.mma.gov.br/port/conama/legiabre.cfm?codlegi=459 (accessed on 8 September 2020).
  55. Resolution, Brazilian National Council of Environment, Provisions the Conditions and Standards of Effluents and Complements and Changes Resolution 357/2005; CONAMA Resolution 430/2011. 2011. Available online: http://www2.mma.gov.br/port/conama/legiabre.cfm?codlegi=646 (accessed on 8 September 2020).
  56. UKWIR. Guidance Manual Supporting the Water Treatment Recommendations from the Badenoch Group of Experts on Cryptosporidium; Water Industry Research Limited: London, UK, 1998. [Google Scholar]
  57. Müller, M.; Vidal, D. Comparison between Open and Closed System for Dewatering with Geotextile: Field and Comparative Study. Int. J. Civ. Environ. Eng. 2019, 13, 634–639. [Google Scholar]
  58. Junqueira, F.F.; Silva, A.R.; Palmeira, E.M. Performance of drainage systems incorporating geosynthetics and their effect on leachate properties. Geotext. Geomembr. 2006, 24, 311–324. [Google Scholar] [CrossRef]
  59. Yaman, C.; Martin, J.P.; Korkut, N.E. Effects of wastewater filtration on geotextile permeability. Geosynth. Int. 2006, 13, 87–97. [Google Scholar] [CrossRef]
  60. Palmeira, E.M.; Remigio, A.F.; Ramos, M.L.; Bernardes, R.S. A study on biological clogging of nonwoven geotextiles under leachate flow. Geotext. Geomembr. 2008, 26, 205–219. [Google Scholar] [CrossRef]
  61. Silva, R.A.E.; Negri, R.G.; Vidal, D.D.M. A new image-based technique for measuring pore size distribution of nonwoven geotextiles. Geosynth. Int. 2019, 26, 261–272. [Google Scholar] [CrossRef]
  62. Mlynarek, J.; Rollin, A.L. Bacterial clogging of geotextiles: Overcoming engineering concerns. In Proceedings of the Geosynthetics ‘95 Conference, Nashville, TN, USA, 21–23 February 1995; pp. 177–188. [Google Scholar]
Figure 1. Sludge from a Water Treatment Plant (WTP): (a) WTP decanters. (b) Washing the decanter. (c) Sludge sample collected.
Sustainability 12 08129 g001
Figure 2. Particle size distribution curve of the WTP sludge.
Sustainability 12 08129 g002
Figure 3. Geotextile tube dewatering test scheme.
Sustainability 12 08129 g003
Figure 4. Turbidity response surfaces in NW1: (a) at 5 min. (b) At 25 min.
Sustainability 12 08129 g004
Figure 5. Turbidity response surfaces in NW2: (a) at 5 min. (b) At 25 min.
Sustainability 12 08129 g005
Figure 6. Turbidity response surfaces in W1: (a) at 5 min. (b) At 25 min.
Sustainability 12 08129 g006aSustainability 12 08129 g006b
Figure 7. Initial dewatering rate response surfaces: (a) in NW1. (b) In NW2. (c) In W1.
Sustainability 12 08129 g007
Figure 8. Final dewatering rate response surfaces.
Sustainability 12 08129 g008
Figure 9. Response surfaces of the geotextiles: (a) Percent-solids. (b) Percent Dewatered (PD).
Sustainability 12 08129 g009
Figure 10. Evolution of the percent-solids in the Geotextile Tube Dewatering Test (GDT) scenarios with: (a) initial TS of 10.13 g/L (0A, 0B* and 0C) and (b) initial TS of 20.00 g/L (1A, 1B and 1C).
Sustainability 12 08129 g010
Figure 11. Geotextiles permittivity—effects of sludge dewatering.
Sustainability 12 08129 g011
Figure 12. NW1 SEM (magnification: 500×). (a) Virgin sample. (b) Sample with less permittivity reduction (scenario 1B). (c) Sample with high permittivity reduction (scenario 1A).
Sustainability 12 08129 g012
Figure 13. NW2 SEM (magnification: 500×). (a) Virgin sample. (b) Sample with less permittivity reduction (scenario 1C). (c) Sample with high permittivity reduction (scenario −1C).
Sustainability 12 08129 g013aSustainability 12 08129 g013b
Figure 14. W1 SEM (magnification: 60× and 75×). (a) Virgin sample. (b) Sample with less permittivity reduction (scenario 0C). (c) Sample with high permittivity reduction (scenario −1B).
Sustainability 12 08129 g014
Table 1. Total, fixed, and volatile solids of the sludge.
Parameter%
Total Solids (TS)3.80
Fixed Solids (FS)41.20
Volatile Solids (VS)58.80
Table 2. Geotextile properties.
PropertiesTest MethodNW1NW2W1
Structure, polymer type 1-NW, PETNW, PETW, PP
Mass per unit area (g/m2)ABNT NBR ISO 9864 [46]612895414
Thickness (mm)ABNT NBR ISO 9863-1 [47]3.964.872.81
Apparent opening size (µm)ABNT NBR ISO 12956 [48]5244200
Permittivity (s−1)ASTM D4491 [49]1.360.800.84
Tensile strength per unit width MD × CD 2 (kN/m)ABNT NBR ISO 10319 [50]35 × 2853 × 40109 × 106
1 NW, nonwoven; W, woven; PET, polyester; PP, polyester. 2 MD, machine direction; CD, cross direction.
Table 3. Levels of variables used in the experimental design.
VariableCodeLevel
−101
Initial TS of the sludge (g/L)x₁0.2510.1320.00
Polymer dosing (mgPol/gTS)x₂0.801.702.60
Table 4. Test program (scenarios).
TestIndependent Variables
No.NameInitial TS (g/L)Polymer Dosing (mgPol/gTS)
1−1A−1 (0.25)−1 (0.8)
21A1 (20.00)−1 (0.8)
3−1C−1 (0.25)1 (2.6)
41C1 (20.00)1 (2.6)
5−1B−1 (0.25)0 (1.7)
61B1 (20.00)0 (1.7)
70A0 (10.13)−1 (0.8)
80C0 (10.13)1 (2.6)
90B10 (10.13)0 (1.7)
100B20 (10.13)0 (1.7)
110B30 (10.13)0 (1.7)
Table 5. Permittivity properties of the geotextiles before and after dewatering of sludge.
ScenarioPermittivity (s−1)
NW1NW2W1
Reference1.36 (±0.25)0.80 (±0.12)0.84 (±0.07)
−1A0.93 (±0.23)0.60 (±0.07)0.48 (±0.05)
0A1.02 (±0.13)0.52 (±0.08)0.51 (±0.05)
1A0.77 (±0.16)0.55 (±0.13)0.46 (±0.02)
−1B0.92 (±0.13)0.57 (±0.05)0.44 (±0.02)
0B*0.87 (±0.19)0.46 (±0.03)0.50 (±0.01)
1B1.02 (±0.09)0.62 (±0.13)0.50 (±0.04)
−1C0.89 (±0.10)0.40 (±0.07)0.50 (± 0.04)
0C0.98 (±0.16)0.61 (±0.12)0.56 (±0.02)
1C0.88 (±0.18)0.65 (±0.13)0.46 (±0.03)
Intervals with a 98% confidence level in parentheses; 0B* (average value of triplicate).

