Factors Associated with Travel Behavior of Millennials and Older Adults: A Scoping Review


School of Earth, Environment & Society, McMaster University, 1280 Main St W, Hamilton, ON L8S 4K1, Canada
*
Author to whom correspondence should be addressed.
Sustainability 2020, 12(19), 8236; https://doi.org/10.3390/su12198236
Submission received: 15 September 2020
/
Revised: 30 September 2020
/
Accepted: 30 September 2020
/
Published: 6 October 2020
(This article belongs to the Section Sustainable Transportation)
Abstract
:This study aims to synthesize knowledge on the travel behavior of millennials and older adults based on literature from 2010 to 2018. The study looks into the different factors that contributed to shaping each generation’s travel behavior. Both qualitative and quantitative studies that fall within the selection criteria are reviewed, with a total of seventy-eight studies selected for review. Thirty-four papers focused on young adults/millennials, 35 included an older adult population, and 9 investigated both younger and older age groups. Six of the studies utilized qualitative methods, 68 applied quantitative methods, and 4 used mixed methods to explore the factors associated with travel behavior. Travel behaviors are explored in terms of mode choice, trip distance, trip frequency, use of alternative transport, ridesharing, and mobility tool ownership. Associated factors are categorized into five themes: personal attributes, geography and built environment, living arrangements and family life, technology adoption, and perceptions and attitudes towards travel options and environment. This study concludes that difference exists between generations in terms of travel behavior, and that the factors that influence each generation’s travel characteristics are either different or differ in their nature of influence (increase/decrease). Finally, based on the reviewed literature, this study proposes future research directions.
1. Background
In recent years, a growing body of transportation studies have focused on exploring the travel behaviors of different generations, including baby boomers (born approximately between 1945 and 1964), generation X (born between 1965 and 1979), and millennials (born between 1980 and 2000). Each generation’s travel behavior can be distinguished by certain features. Studies indicate, for example, that millennials or young adults are less likely to drive, are likely to travel shorter distances, delay obtaining their driver’s licenses, and use more public transit and non-motorized modes of transportation [1,2,3]. The travel behavior of baby boomers or older adults, on the other hand, is characterized by greater automobile use and much more limited use of transit [4,5]. Different reasons exist for these generational differences in travel behavior, such as the difference in trip purposes (i.e., commute, social trip), and perceptions of the physical and natural environment (i.e., safety, sustainability) among generations [6]. Another possible reason is the historical-, cultural-, socio-economic-, and technology-related experiences of a particular generation that has shaped their mobility patterns [6].
The overall objective of this study is to provide an up-to-date review of the literature emphasizing the travel behavior of young adults/millennials and older adults. Existing reviews mainly focused on different aspects of travel behavior of older adults. For example, Graham et al. [7] reviewed literature on the travel behavior of rural older adults, Luiu et al. [8] explored existing literature based on barriers and factors causing seniors’ unmet mobility needs, and Haustein and Siren [9] compared how different studies used various combinations of demographic, health, or transport-related attributes to segment older population into homogenous groups. Only one review was conducted on young adults, which synthesized evidence on their licensing decline and the influencing factors [10].
The current study differs from these previous studies as it not only reviews the literature on young and older adults’ travel behavior, but also provides a comparison of travel behaviors and associated factors between the two generations. In addition, this review explores the factors and determinants that contribute to shaping the travel characteristics of each generation. The scoping review framework proposed by Arksey and O’Malley [11] and developed by Levac et al. [12] was adopted to achieve this goal. A set of the existing literature are shortlisted based on selection criteria (discussed in the next section) and explored. The broader set of travel-behavior-related attributes explored in this study include mode choice, license-holding status, car ownership, other mobility tool ownership (i.e., bike, transit pass), trip frequency, trip distance, and use of alternative transport service, as well as shared mobility options (i.e,. taxi, ridesharing, community transport).
Based on the overall objective, this study will answer two research questions. First, what factors are associated with the travel behavior of young adults/millennials and older adults and do they differ between the two generations? Second, what future research directions can be derived? That is, what are the research gaps and research agendas that need to be addressed?
2. Methods
Literature Search: As the focus of this paper is to synthesize recent progress in the literature, published literature in the English language from 2010 to 2018 are included in this review. Four databases were searched for relevant literature: Transport Research International Documentation (TRID), Web of Science, Ovid databases, and SPORTDiscus. The search was conducted between March–April 2019. A combination of different keywords was used to search within the databases. Keywords included: generational differences, travel behavior/behaviour, trip pattern, seniors, older adults, baby boomers, millennials, young adults, university students, mobility, mobility options, automobile, driving, driving license, driving cessation, mode choice, transit use, walking, biking, life course, life events, demographic variation, cohort analysis, geographic variation, urban/suburban/rural, residential location, accessibility, living arrangement, technology adoption, smartphone adoption, alternative transport solution, ridesharing, shared mobility, Uber/Lyft, lifestyle, sustainability, perceptions and attitudes.
Literature Inclusion/Exclusion Criteria: All searched literature were exported to the bibliographic software EndNote. Duplicates were removed. The screening process involved three stages: i) initial selection was made by screening the titles based on the identified keywords, ii) secondary screening of abstracts for keywords and texts, and iii) final selection was completed by reading the full studies. This review of the literature considered the following inclusion and exclusion criteria:
Included:
- English language studies.
- Travel-behavior-related studies that either considered generational differences or focused on a specific generation (baby boomers/seniors/older adults, millennials/young adults).
- Studies where the age of the sample population is 16 years or over.
- Studies that considered attributes of daily travel behavior—specifically, mode choice; trip distance; trip frequency; use of alternative transport; ridesharing; and mobility tool ownership: driver’s license, car, bike, transit pass.
- The studies were conducted in developed countries.
Excluded:
- Studies that focused on the travel behavior of the overall population.
- Tourism-related studies, long-distance travel, maritime travel, air travel, and railway travel.
- Studies related to generation-specific travel-support smartphone application development and the use of automotive or electric vehicles.
- Accident-, injury-, and fatality-related researches.
- Studies that focused on health conditions, health-related attributes, and/or physical activity.
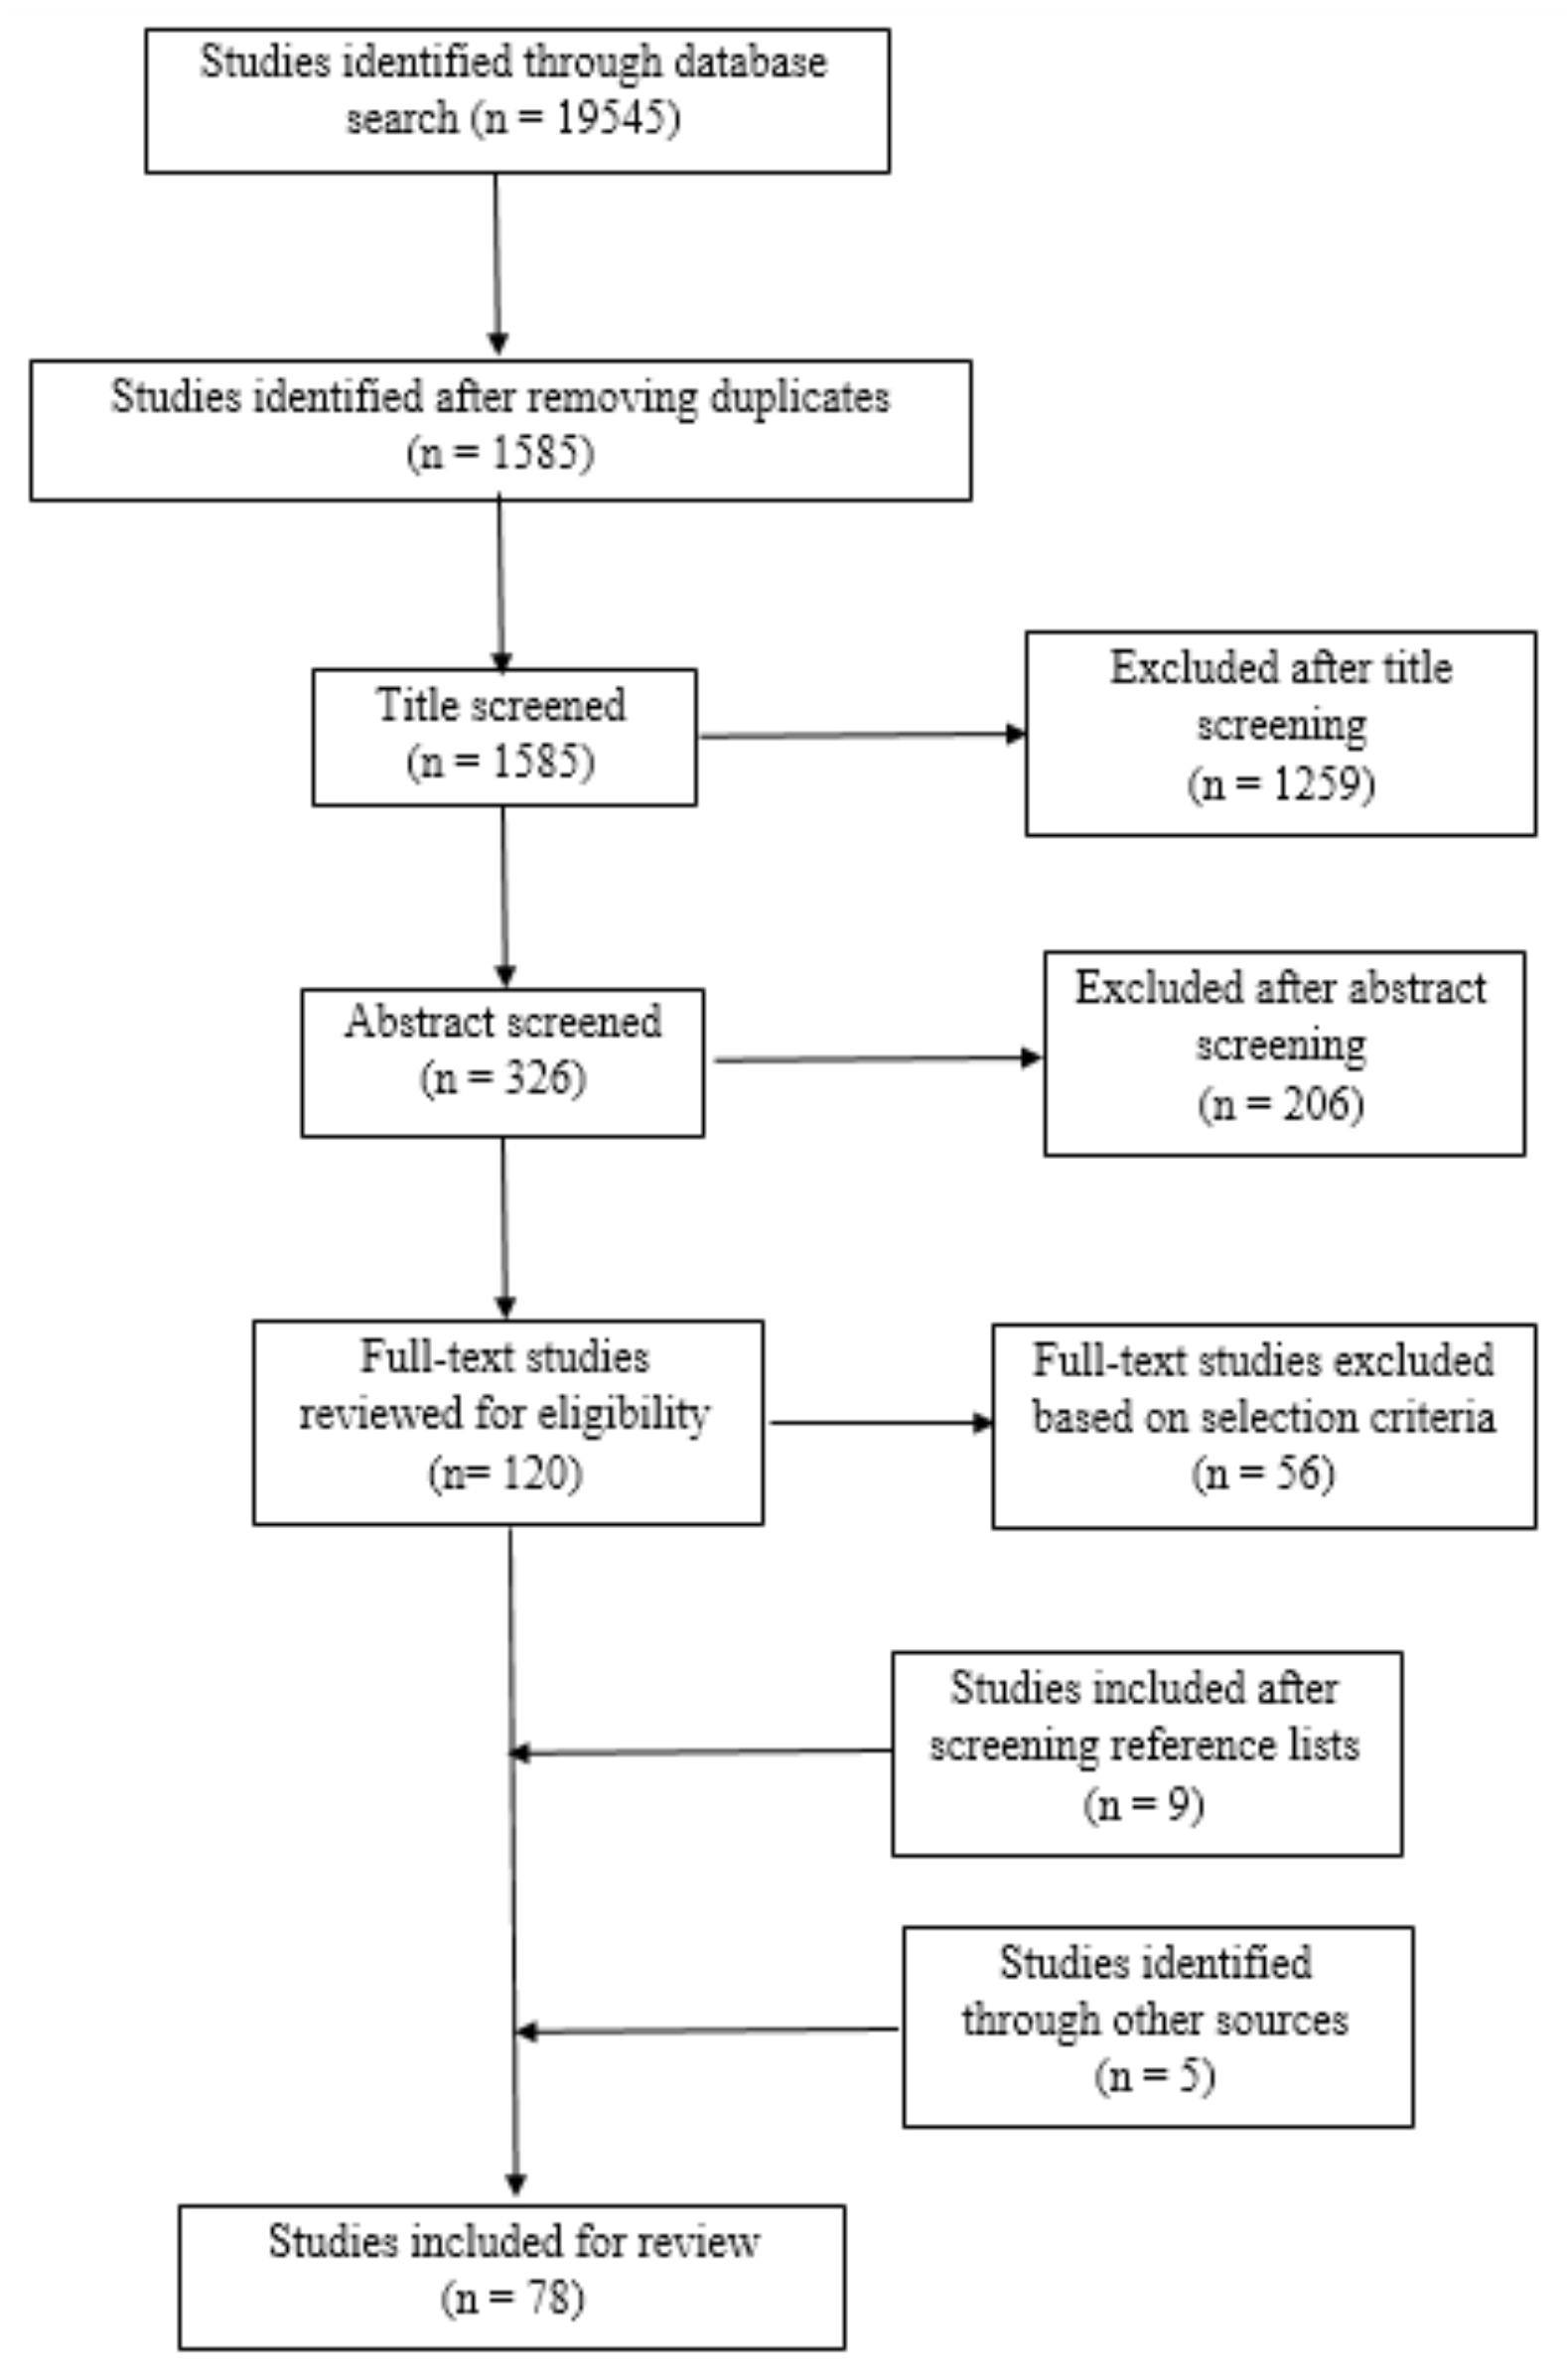
Stages of Search and Retrieval Process:Figure A2 shows the stages of the search and retrieval process for this study. The initial search with the different combinations of keywords in four databases resulted in 19,545 references. After removing duplicates (in many cases multiple versions of the same study), 1,585 studies were identified for title screening.
After screening the titles and abstracts based on the inclusion/exclusion criteria, a list of 120 studies were prepared for further review to explore their inclusion eligibility. Reference lists of the selected studies and relevant systematic and scoping reviews (e.g., Graham et al., [7]; Luiu et al., [8]; Haustein and Siren, [9]; Delbosc and Currie, [10]) were checked and key journals (Appendix A) were hand searched. Other sources such as ProQuest and Google Scholar were also explored. Finally, a list of 78 studies was prepared according to the selection criteria stated above, including 66 journal articles, 9 reports and 3 conference papers.
All selected literature were reviewed in detail to explore the distinct characteristics of the two generations and how different factors are associated with the travel behavior of each generation. A summary of the reviewed literature is provided in Table A1. The next section provides a brief description of the methodologies used in the reviewed literature. After that, an in-depth discussion of how key factors are associated with travel-related attributes in the reviewed studies is included. The final section provides key research agenda based on the selected studies.
3. Types of the Reviewed Literature
Of the 78 studies selected for review, 35 were conducted in North America (22 in the US and 13 in Canada), 29 in Europe, 7 in Australia, 1 in Asia and 6 of them considered multiple countries as their study area. Thirty-four of them focused on young adults/millennials, 35 included an older adult population, and 9 investigated both younger and older age groups. Six studies applied qualitative research methodology. Four of them employed focus group discussions to explore the mobility patterns of rural older adults [13], their use of alternative transport modes [14], the mode choice of young adults for short-distance travel [15], and their attitudes towards cars and licensing [16]. Berg et al. (2014) [17] followed a case study approach to explore how different individual, social, and geographical contexts impact older adults’ travel behavior after retirement. By conducting in-depth semi-structured interviews of 55 individuals, Delbosc and Nakanishi (2017) [18] addressed the interaction between life course and millennials’ travel preferences, and their attitudes toward the car.
Four studies utilized mixed methods [5,19,20,21]. The remaining studies (68 in total) applied quantitative techniques to explore the factors associated with travel behavior, with 50 using aggregate national or regional level datasets. Only two studies used panel data [22,23], and the rest are cross-sectional, although four studies created ‘pseudo panels’ using cross-sectional national level datasets [24,25,26,27].
Among the quantitative studies, authors mostly used a combination of descriptive analysis, and/or regression analysis (mostly linear or ordinal) and/or multinomial models to describe the influencing factors of travel behavior. These studies usually explored the direct relationship between the different aspects of travel behavior and their determinants. Two studies applied structural equation modeling techniques to explore how a wide range of socio-economic [24], lifestyle, and attitudinal attributes [3] impact different aspects of travel behavior and how both influencing factors and outcome variables are inter-related with each other. Two other studies used hazard-based formulas to explore the associated factors of mode choice and the trip lengths of seniors [28], and mode choice and time taken to acquire a driver’s license for young adults [29].
To take into account intra-generational heterogeneity, seven quantitative studies utilized techniques such as latent class analysis [30,31,32] and cluster analysis [33,34,35,36] to group individuals based on different characteristics to derive their travel patterns and associated factors. Studies using latent class analysis divided the generations into different segments based on socio-demographic [32] and travel characteristics [30,31]. Among the studies that followed the cluster analysis approach, Haustein (2012) [36] considered multiple sets of factors such as infrastructure, socio-demographic, and attitudinal statements to groups of elderly populations to analyze their travel behavior. Three other studies defined segments of the generations based on socio-demographic characteristics [34], travel characteristics [35], and neighborhood type and transportation system [33].
The next section provides an overview of the trends in travel behavior by older and younger adults. Due to variations in age groups considered in the selected studies, no distinct age limit can be assigned to each generation. Moreover, due to the difference in survey years, the age groups may vary within the generations. In this review, the population aged 16–34 years are considered as young adults/millennials, and those aged 50 years or over are considered as older adults. The following section will discuss how different factors influence the distinct travel characteristics of these two generations. For quantitative studies, only factors that are found or mentioned as significant by the authors are included in this review. Associated factors are categorized into five different themes:
Personal attributes, which include socio-demographic characteristics such as age, gender, income, employment, studentship, etc.
Geography and built environment, including residential location such as rural, suburban, or urban; neighborhood features such as density, proximity to facilities, surrounding transport options, etc.
Living arrangement and family life, including the type of dwelling (i.e., apartment, detached house, etc.), living alone/partnered/married/with family, the presence of a child, family members living nearby, etc.
Technology adoption, including dependence on technology, mobile phone possession, the frequency of web/social media/smartphone use, etc.
Attitudes and perceptions, including individuals’ lifestyle choices, attitudes, and perceptions towards different travel options and the environment.
4. Travel Trends Among the Two Generations
Older Adults: In general, older adults tend to travel less frequently, make more short-distance trips, and walk more frequently [4,37,38,39] compared to other generations. However, when facilities such as shopping and social activities are not nearby, they may need to travel longer distances. One study concluded that older adults living far from the Central Business District (CBD) travel longer distances for performing shopping and maintenance activities, as most of the activity places are concentrated within the CBD [40]. Buehler and Nobis [4] compared the travel behavior between German and US elderly populations and found that elderly Germans tend to walk, bike, and ride transit more frequently compared to the US elderly. Regarding the use of alternatives to the car, one study suggested that older seniors are resistant towards adopting alternative forms of transportation, although increasing use of alternative forms is noticed among younger seniors [25]. Unfamiliarity with the service, not being habituated in using the service, lack of knowledge on the required technology (e.g., smartphone applications) could be the reasons behind their lack of interest in using other modes of transport except the car [25,41].
Two studies found increased use of transit among some groups of older adults [20,34]. The reasons identified by the authors are not having access to a car, being unable to drive due to health conditions, free travel incentives for seniors, and improvements in transit services in the study area. Conversely, there is also evidence that the probability of using transit decreases with age for older adults [28,42]. Moreover, car ownership discourages transit ridership. Overall, transit use is low among older adults [17,25,28,39], especially among those with a car [5]. Mode choice also depends on trip purpose. For example, for social activity participation, older adults use transit more frequently [39] and bike or walk less frequently [40]. On the other hand, less frequent use of transit is noticed for shopping and maintenance activities [40].
Studies suggested that the frequency of using a car [4,20,34,37,38,39] and holding a driver’s license [43] declines with increasing age, illustrated by a declining number of trips with increasing age. Nevertheless, the car is the prominent mode among older adults [44] and holding a driver’s license is very important in order to fulfill their driving needs [45]. Studies mentioned several reasons behind the decrease in mobility as well as car trips such as aging [4,25,38,46], illness or physical impairment [5,13,21,46], taking care of a family member [21], retirement [46], and decline in affordability [5,21]. Widowhood may also shift away the mode of travel of older females from car-driver to other modes [13]. Still, older adults (baby boomers) are the greater users of automobiles compared to other generations, and have good access to cars, and they expect to continue this habit as they age [35].
Young Adults/Millennials: The travel patterns and transportation preferences are somewhat different among younger adults. Studies indicate that they are more likely to walk, bike, and use transit [26,27,47,48,49,50]. Also, millennials/young adults are more multimodal compared to other generations [18,19,48,49,51,52,53,54], own multiple mobility tools [32,33,34,35,36,37,38,39,40,41,42,43,44,45,46,47,48,49,50,51,52,53], and are open to use any mode that is most suitable for their needs [18]. They also tend to make fewer trips [24], own or use a car less [2,23,26,48], and are less likely to hold a valid driver’s license or are more likely to delay obtaining a driver’s license [50,51,55,56]. However, their likelihoods of obtaining a driver’s license [26,55], using the car [3,27,55,57], being multimodal [53], and owning multiple mobility tools [53] increases with age, while share of transit use [27,58] decreases with age. These patterns may be a result of an increase in income, employment, and changes in family patterns/living arrangements, residential relocation, etc. Compared to older adults, millennials are more technology-oriented and more likely to adopt ridesharing options [19,52,59].
5. Factors Associated with the Travel Behavior of the Two Generations
5.1. Personal Attributes
Figure A1 shows the most common personal-level attributes that are associated with different aspects of travel behavior in each generation. Associated factors are almost the same for each generation, with exceptions being age and studentship status. Based on the literature, increasing age is an important determinant of changes in travel behavior of older adults, whereas other personal attributes such as income, employment, and studentship status are mostly associated with the travel behavior of younger adults. However, the level and direction of the associations are different to some extent between generations. For example, studies showed that the license-holding status of young adults is associated with gender, income, ethnicity, employment, and education status whereas, for older adults, it is mostly age and gender.
Older Adults: Gender is the most common determinant that is used to describe different generations’ travel behavior. Studies mentioned that there is a gender gap in travel behavior, especially among older generations, with older women less likely to drive or being less dependent on cars both as drivers and passengers compared to men [4,12,20,31,35,37,39,40]. One of the reasons could be that women travel less compared to men in general. Older women are also more likely to use car alternatives such as walking, cycling, and using transit [20,25,35,37,40,42]. One study showed an opposite finding, reporting higher rates of walking, cycling, and transit use among males compared to females [38]. The study further explained that older men make a higher number of trips than women. As a result, their number of walking, cycling, and transit use, as well as car use, is higher compared to women. Men also show a higher probability of owning multiple mobility tools [31] and higher vehicle kilometers travelled [38,60,61] compared to women.
Older adults usually make shorter trips and their overall trip length declines with age [20,34,38,56,62,63,64]. As revealed by Moniruzzaman et al. [28] and Yang et al. [64], the likelihood of walking and walking trip length also declines with increasing age. The rate of decrease in license holding and access to a car with increasing age is higher for women [43,65]. Compared to men, older women are also found to make fewer trips and more short-distance trips as they age [28,34,46,62,65]. The rate of using or having knowledge of shared mobility options, such as ridesharing services (i.e., Uber/Lyft) is very low among older adults, and use decreases with increasing age [66,67]. Though men are more likely to use these services compared to women [63,67], as suggested by Ahern and Hine [13], the lower car dependency amongst women may also encourage them to use alternative transport services such as taxis, ridesharing, and community bus services.
Travel behavior also differs by ethnicity, with the reviewed studies showing that minorities are less likely to use the car and more likely to walk and bike. One study in the Netherlands suggested that in general, non-western older adults make fewer trips, travel less by car, and bike more as compared with native Dutch people [37]. In the UK, non-British nationals travel less compared with British nationals [46]. Black older adults are found to travel more, and Asians are found to use transit more than other ethnic groups [64]. The rate of using alternative modes such as taxis and ridesharing services is higher among whites [63,67], whereas racial and ethnic minority groups show a higher level of perceived need for alternative transport services [68].
Income is a strong predictor of defining travel behavior, with increasing income or rise in affordability increasing trip frequency [20], automobility [4,63], and multimodality [63] among older adults. Also, higher income tends to decrease transit use [20,28,40] and the number of short distance trips [62]. High-income older adults are less likely to realize the need for alternative transport [68] as most of them have convenient transport options available to them. High income is also associated with older adults’ possession of a higher knowledge of online ridesharing services [67]. Similarly, employment status is associated with older adults’ travel behavior. Being employed or economically active positively influence multimodality [63], automobility [4,28,39], multiple mobility tool ownership [31], transit use [28,39], number of trips [28,64], trip distance [28,61] and lower amounts of walking or biking [17] of older generations. Similarly, Siren and Haustein (2016) [69] found that retirement causes a decline in car use frequency and total mileage, with a greater impact for men compared to women, most likely due to fewer commute trips after retirement. Higher levels of education are associated with a decreased number of short distance trips [62], increased use of transit [42], and the increased probability of possessing knowledge on online ridesharing [67].
Studies also indicated associations among different aspects of travel behavior. For example, car ownership and holding a driver’s license influences older adults’ use of the car [4,5,20,37,39,46,61]. Also, higher trip frequency is associated with a higher probability of owning a car and holding a driver’s license [31]. On the other hand, transit-pass ownership positively affects the use of all other modes except the car [37]. Transit-pass ownership is also positively associated with less trip making [31]. Having no car and no license decreases the tendency to travel more for discretionary purposes [43]. Bike and transit-pass ownership negatively impact the number of short-distance trips [62], which can be mainly covered by walking.
Young Adults/Millennials: In the case of millennials, the gender gap in travel behavior is disappearing, indicating that the extent of variation in different of aspects of travel behavior between males and females is low compared to the older generation [48,49,54]. Compared to males, young females delay obtaining a driver’s license [29,53,70], own/use automobiles less [48,54,70,71,72], are less multimodal [53,54], and are more likely to use transit [27,53]. Another study found that males are less likely to be drivers and more likely to use active modes and transit [30].
According to Simons et al. (2014) [15], mode choice amongst young adults is largely dependent on vehicle ownership, travel purpose, financial cost associated with the mode, flexibility of the mode, comfort, travel time, and income. Income, employment, and education are important factors in shaping young adults’ travel behavior [71]. It is found that higher socio-economic status (SES) amongst young adults increases driving [57]. Higher income also positively influences holding a valid driver’s license [10,29,55,73,74], driving [75], number of car trips [24], car travel/commute [3,24,47], and car ownership/greater car access [23,54]. Conversely, high income (greater than $20,000) negatively influences transit use [27]. Also, car ownership is found to be low among the young adults who are financially dependent on their parents [23].
Life course may also impact driving behavior, with several studies suggesting that the travel behavior of millennials will change as they go through different transitions in life such as family formation and job change. For example, change in employment status influence the distance travelled by young adults [76]. With the transition from school to employment, an increasing number of trips by car are completed, while fewer trips are made by transit [22]. Furthermore, among young adults, employed young adults are more likely to drive [2,24], hold a driver’s license [55,70,73,74,77], have car access/ownership [23,54], make a greater number of car trips [24], and have higher car travel distance [78]. Higher education positively influences driver’s license possession [55,70,73,74,77] and driving [2,79]. Studentship status shows a positive association with transit use [27,58]. For example, full-time students are less likely to hold a driver’s license [55,73]. In the Greater Toronto Area (GTA), graduate students further delay in obtaining licensure compared to undergraduates [29]. Another study by Nash and Mitra [30] found that almost two-thirds of the post-secondary students in the GTA are dependent on sustainable transport options (i.e., walking, cycling, and transit) for their day-to-day travel.
In terms of young adults’ ethnicity, non-whites and immigrants are more likely to use transit [58]. A similar result is found by Le Vine and Polak [74] where migrants are seen as less likely to possess a driver’s license. Alemi et al. [59] reported that young adults of non-Hispanic origins are more likely to adopt ridesharing services.
As expected, holding a driver’s license or owning a car facilitates car use among young adults [30,47,79]. The number of cars in the household [29,70] and bike ownership [29] are positively associated with driver’s license possession of young adults, indicating multimodality among young adults. Car ownership also decreases the chance of transit-pass ownership [59]. On the other hand, bike ownership facilitates biking and multimodality [30].
5.2. Geography and the Built Environment
How geography and built environment attributes are associated with each generations’ travel behavior are shown in Figure A1. For older adults, factors are mostly associated with their mode choice and trip distance, whereas for young adults, factors are associated with their license-holding status, car ownership, and mode choice.
Older Adults: Neighborhood and built environment characteristics significantly impact older adults’ travel behavior. It is found that compact designs or urban forms such as high dwelling density [28,31,37], high population density [4,20,28,80], high employment density [28], high street density or connectivity [28,64,80], and mixed land use [28,37] stimulate transit-pass ownership, transit use, and walking, as well as short distance trips amongst the older adults. Despite this, older adults are highly car-dependent and Figueroa et al. (2014) [81] reported very little impact of high population density and high accessibility on their car travel or car travel distance.
Neighborhood-level socio-demographic attributes also influence older adults’ travel behavior. Older individuals living in neighborhoods with higher poverty levels usually make a lower number of total trips [64], and a higher number of short-distance trips [62]. Also, they use transit and active transportation modes more compared with those who live in high-income neighborhoods [64]. It is evident that the built environment shapes travel behavior. Physical elements such as the presence of a bus stop [80,82], street lighting [82], facilities within walking distance [36,82] and neighborhood safety/crime level [80,82] influence walking. Having a rail-based transit station nearby increases the likelihood of traveling beyond the neighborhood [62]. However, despite car access and transit availability, which offers an option for long-distance travel, older adults travel (mostly by car or walk) short distances within their neighborhood because of health constraints and reluctance to use transit [17]. The likelihood of traveling (by all modes) within a neighborhood and making short-distance trips increases with the increase in the proportion of residential land use [20] and also, when all necessary shops and services are within the neighborhood [62]. According to the study by Yang et al. (2018) [64], higher walk scores in the neighborhood increase the number of trips, the use of transit, and active transportation. While exploring walking for transport, it is seen that neighborhood walk score weakly influences transport walking among older persons, whereas higher transit score strongly influences active travel [83].
Older adults living in bigger cities are found to have less access to cars but have higher access to transit [43]. Living near public transit also facilitates older adults in fulfilling their leisure travel needs [45]. Fatmi and Habib (2016) [31] revealed that living within 10 km of regional centers increases the likelihood of owning multiple mobility tools, whereas living within 1 km of a highway exit facilitates car ownership. On the other hand, rural older adults make fewer trips [34,64] compared to those who live in urban areas. They are also less likely to use transit [13,64], with the main reason being the lack of transit systems or infrequent service in rural areas. In the case of urban areas, studies showed that urban living, or living in or near transit-oriented developments and CBDs decreases car use [4,38,40], and total distance travelled [20,40,61], and increases transit use [42], walking [80], and the number of short distance trips [38]. Urban areas are usually equipped with multimodal transportation system (e.g., transit, bikeway, sidewalks, etc.) and facilities such as shopping, and recreation are mostly centered within urban areas. Access to alternative modes of transport is also higher in urban areas compared to rural areas. Moreover, being closer to amenities reduces the need for long-distance travel. Similarly, studies have found that the use of transit increases if there is a transit stop near the home [42], and the probability of transit-pass ownership increases with residential locations near subway stations [31]. However, studies revealed that transit is only attractive within a certain distance. Habib (2015) [40], for instance, reported that older adults use transit more within a boundary of 5.35 kilometers of the CBD, with use decreasing after this distance, and lower use potentially associated with the discontinuity of transit infrastructure or less frequent transit services.
Young Adults/Millennials: Amongst millennials, transport mode preference is dependent on the type of land use and location of the home, work, and study, with millennials preferring to live in areas from where work, study, and facilities (e.g., shopping, restaurants) are easily accessible [18], especially by walking, biking or transit [50]. As urban areas offer this kind of mixed land uses, young adults are more willing to live in dense urban areas compared with other generations [18,19,33,71,84]. Young adults living in urban areas are more likely to walk and use transit [3,26,33,57,84], make fewer trips [33,49], have lower rates of automobile access/ownership [3,18,33,70,78], show a lower probability of holding a driver’s license [3,33,70], and are less likely to drive [2,33,57,78,84] as compared to older generations. On the other hand, due to homogenous land-use patterns, rural living encourages possession of a driver’s license [55], car use/driving [26,75,79], and higher driving distance [55]. The study by Nash and Mitra [30] revealed that young adults mostly prefer to live in areas that best suit their transport mode choice. For example, their study showed that active mode users and multimodal young adults are more likely to live in a bike-friendly neighborhood, whereas car users are more likely to live in car-oriented neighborhood or rural communities. Transit users are seen to put importance on transit proximity while selecting their residence [30].
Change in residential location can occur due to professional reasons such as transition into work life, change in income and job, as well as personal reasons such as moving in with a partner, and the birth of a child. This also influences mode change among young adults as found by Busch-Geertsema and Lanzendorf [22], in that the mode change rate is higher (almost double) among movers as compared with non-movers. An increase in income can increase the chance of buying a car and moving to suburban locations. Similarly, change in transit accessibility within residential and job locations and the distance between activity points (e.g., home, job, shopping, and school) increases the chance of mode change among young adults [22]. Young adults’ mode choice also depends on the neighborhood’s street quality, accessibility to facilities, weather, and perceived safety such as secure bike parking [15]. For example, widely spaced road intersections positively influence car ownership [53]. Proximity to public transport options from home increases the likelihood of delaying driver’s license possession [29,74], transit-pass ownership [53] and bike ownership [53]. In addition, the existence of a good-quality and accessible transit service decreases car access [70], and license possession [3,29], and increases the likelihood of commuting by transit [3,58]. The likelihood of using the ridesharing services among young adults is also positively associated with auto accessibility [52,59], urban living, and higher land-use mix [59].
Compared to any other modes, young adults use transit more frequently when it is available and accessible to them [29]. Transit provision is highly correlated with higher density (e.g., population density, urban density)—with higher population density encouraging transit-use and licensure delays [29], and decreased car travel [81]; whereas high employment density in the neighborhood encourages car ownership [53] for young adults. Neighborhood level socio-demographic characteristics such as living in higher income neighborhoods increase the likelihood of owning a driver’s license [32]), driving a car [75], and decreases the likelihood of transit-pass ownership [32]. Poor levels of neighborhood walkability influence early licensure [29] and car commutes [47], whereas higher residential density increases transit commutes [3,58] and decreases the likelihood of driver’s license possession [74].
Location of university/college campuses may also influence young adults’ commute behavior. Suburban campus locations and low multimodal accessibility decrease the number of students walking and increase the number of car commuters, whereas living near a campus reduces car commutes [47]. In the Greater Toronto Area (GTA), living far from the university campus (especially outside the City of Toronto) encourages early licensure [29] and discourages transit-pass ownership [53] and multiple mobility tool ownership [53]. Also, living near a subway station positively influences transit-pass ownership, and living near a highway exit positively influences car ownership and driver’s license possession among young adults in the GTA [32]. In downtown areas, how young individuals possess different mobility tools such as driver’s license, car, or bike, and use transit and active modes of transport is somehow complex and perhaps reflects individuals’ socio-economic status and socio-demographic aspects. For example, the study by Habib et al. [53] indicated that despite having full transit coverage, living in downtown Toronto discourages transit-pass ownership but encourages either possession of a driver’s license (on its own) or possession of a driver’s license and bike ownership together as a composite mobility tool among post-secondary students. According to the authors of the study [53], the quality of bike infrastructure along with easy access to carsharing and bikesharing options and transit facilities within the GTA core (i.e., downtown Toronto) enabled students to be multimodal and not rely on a specific mode for their commute.
5.3. Living Arrangements and Family Life
How different factors such as living arrangements, family life, technology adoption, lifestyle, attitudes, and perceptions towards travel are associated with travel behavior are displayed in Figure A1. Living status (Alone/Married/Partnered) is a strong predictor of the travel behavior of the older generation, whereas, young adults’ travel behavior is mostly associated with whether they are living with parents or not, and the presence of a child. Technology adoption and attitudes towards travel options and the environment are mostly associated with young adults’ travel behavior, whereas perceptions and experiences of travel options are associated with older adults’ travel behavior.
Older adults: Married or partnered older adults are more multimodal (Jones et al. 2018), own multiple travel tools [31], use taxi and ridesharing services more [63,67], and travel less frequently [46,64] compared to single older adults. Also, studies indicated that older adults living with a partner or in multi-person households have a lower amount of unmet leisure travel needs [45]. The authors further explained that perhaps living with more people either decreases the need for outside socialization or increases the number of chances to get a ride. Two studies concluded that older adults who are from a larger household are more likely to make fewer trips [34,46]. Living with others also decreases the probability of walking and using transit, but increases trip distances by car, potentially due to an increase in shared responsibility and a greater need to use a car [28]. On the other hand, the death of a partner can influence mode change, especially from car to transit [13,21].
To meet their travel needs, whether they live alone or not, older adults rely on and get support from friends and family living nearby [43], which is also common in rural settings [14,60]. Those who live alone usually make a higher number of car trips (mostly as a driver) and use transit less [20,42]. Also, having adult children living nearby [42] or someone else who drives them regularly [40] increases the number of car trips (as a passenger) amongst older adults, and decreases their frequency of transit use. Retired older adults are also found to provide informal care to their parents, children, and grandchildren—which again, increases their car use frequency [69]. However, those who are non-drivers and do not have family members living nearby to support them show a higher level of perceived need for alternative transport services [69].
Older adults living in apartments or condos are found to prefer transit when it is more accessible to them [40]. In urban areas with greater transit coverage, those who live alone show a lower probability of owning a driver’s license and car, and a higher probability of owning a transit pass [31].
Young Adults/Millennials: The travel behavior of young adults/millennials is mostly driven by their living arrangements and family life patterns. Living with parents, living in shared accommodation, or being in larger households encourages transit use [24,58] and discourages driving [2,47,55], carpooling [24], and driver’s license possession [29,74]. Nash and Mitra (2018) [30] found that living with parents is positively associated with car and transit use and negatively linked with the active mode use associated with commuting to university, a finding that is potentially related to the suburban/rural location of their parents’ houses, which results in longer commutes. Those who live with parents or are from larger households are also found to own multiple mobility tools [53], although they only use one or two modes for their regular commute [30,53]. On the other hand, living alone, with a partner, roommates, and someone from the same generation increases the likelihood of owning a driver’s license [53], although car ownership is low among the single-person households [54], potentially reflecting a lack of affordability. Compared to those who live with parents, young adults who are partnered/married and/or living with their own child tend to be drivers [75], hold a driver’s license, and drive higher mileage [55]. Also, young adults who are single and not living with parents tend to live in urban areas [33] and those who live in apartments or condos (which are usually in the core of the city) are more likely to delay obtaining a driver’s license [29].
Young women who are living with a partner, have a child, and are looking after a family are less likely to drive and hold a driver’s license compared to those who live with their parents [55]. Young individuals without children are more likely to live where transit is available [19], whereas parenthood decreases the use of transit for day-to-day travel [3,27]. Life events such as marriage, becoming parents, and living with one’s own child influence the modal shift from sustainable transportation options [18], and encourage driving [55], driver’s license holding [3,16,55,70] and car ownership [3,19,70]. The reason could be the change in travel needs due to the family extension, residential relocation, the rise in affordability, and personal preference. However, young adults may still prefer to live in urban areas even after a change in life stage as Sakaria and Stehfest [19] reported that though millennials who are parents are highly likely to buy a car, very few of them are moving to suburbs, which indicates that they are continuing some of their previous travel behaviors.
5.4. Technology Adoption
Older Adults: Relatively few studies explored the relationship between technology use and travel behavior among older adults. According to the studies, mobile phone possession is associated with a higher number of trips, higher distance travelled [20], and higher transit use [42], as well as car use [36]. However, car users tend to have greater access to the internet as compared to transit users [36]. Familiarity with technology is also important for older adults, as trip-making behavior is found to be influenced by the level of familiarity with smartphone technology and online ridesharing services [66].
Young Adults/Millennials: Millennials or young adults are highly technology-oriented and are frequent social media and smartphone users [52,59]. They prefer to use online services instead of traveling [50,77]. To save travel time, they also show preference towards being flexible with respect to activity locations and times by using digital resources [19]. Greater internet or social media use is associated with higher transit use [16,19,24,50,85] as they can use their electronic devices to perform online tasks as well as connect to social media while using transit. Tech-dependent lifestyles also reduce vehicle ownership [3] as well as carpooling [24]. Higher frequency of being engaged in information and communication technology (ICT)-based gaming negatively influences a car purchase, while higher social media usage positively influences millennials’ decision to purchase a car in the future [72]. The study further explained that while being engaged in gaming decreases the intention to travel, the use of social media increases the intention to travel for face-to-face communications and visit new places. On the other hand, the use of online ridesharing services (i.e., Uber/Lyft) reduces walking, biking and transit use [52].
The reasons behind not holding a driver’s license or reduction in driving among young adults could be the reduced need for commuting due to teleworking [51] and online shopping [2]. However, one study showed that those who work from home have higher driving mileage compared to those who work outside but don’t drive to work [55]. This can be supported by the findings of Delbosc and Currie [10,16,73] where the authors mentioned that driving or travel can’t be substituted by e-communication, rather, they encourage face-to-face communication, which eventually increases travel.
5.5. Attitudes Towards and Perceptions of Travel Options and Environment
Older adults: Older adults’ perceptions and experiences of transport modes influence their travel behavior. Studies revealed that satisfaction with a transport mode influences the use of that particular mode [21]. Similar findings are observed for the use of online ridesharing [67]. Even in rural areas, previous experience in using alternative transport modes influence the rate of using alternative transport [14]. How older individuals perceive different aspects of travel, especially distance, can also influence the probability of choosing a transport mode. Findings by Hess (2011) [80] revealed that perception of distance to bus stops influences transit ridership and walking to transit. It is seen that those who perceive distance to facilities from their residence to be short are more likely to walk [82]. The levels of awareness and familiarity of the services also influence the perceived need for and use of alternative transport services [41,68].
Haustein [36] found that a positive attitude towards walking and transit decreases car use. The study also revealed that positive attitude toward cycling increases cycling, and that pro-transit attitudes increase transit use. Attitudes towards different modes may also be dependent on the individual’s travel characteristics, such as driving status. For example, non-drivers show more positive attitudes toward all modes of transport compared to ex-drivers [45]. Another study by Tuokko et al. (2014) [86] suggested that those who have restricted driving show more negative attitudes towards driving, whereas those who have not restricted their driving show positive attitudes towards driving. Interestingly, Rahman et al. [41] found that compared to non-drivers, drivers are more positive about adopting alternative transport modes when they will not be in a condition to drive. Perhaps, non-drivers already have arrangements to fulfill their travel needs.
Young Adults/Millennials: Attitudes play a vital role in shaping young individuals’ travel behavior. Among young adults, those who live downtown or nearby consider the environment, cost saving, convenience, and health impacts while making transportation decisions [19]. Those who are technology oriented, pro-environment, and seek variety in life are more likely to adopt online ridesharing services [59]. Pro-environment attitudes also increase the chance of using active modes and being multimodal [30] and decrease driving [50]. Changing attitudes toward mobility have decreased driving among millennials [2]. However, pro-car attitudes, for example, considering that the car gives independence [22] and safety compared to other modes [30] strongly influence the use of a car. Lavieri et al. [3] revealed that pro-car attitudes positively impact car ownership, while pro-environment attitudes negatively impact car ownership. Following a sustainable lifestyle and using sustainable modes while in university reduces the probability of mode change in work life [22]. On the other hand, young adults seem to be more flexible in their attitudes toward travel modes than previous generations as they are ready to adopt modes that best suit their purpose [18]. To them, owning a car is not a symbol of luxury, but a symbol of adulthood and maturity instead [16]. However, attitudes towards the previous mode (i.e., feeling restricted in using transit, walking, and biking) significantly impact mode change while transitioning to employment from studentship [22]. Also, the experience of using a particular mode earlier in life may influence travel behavior in the future as evidenced by Muromachi [72], who revealed that travel to school by bike positively influenced ownership intentions, and travel by rail negatively influenced the intention to buy a car in future [72]. Also, those who consider car as a less attractive product show a lower likelihood of buying a car in future [72].
6. Future Research Prospects
It is beyond the scope of this study to propose a comprehensive research agenda, but several future research directions can be drawn from this literature review. Consequently, this study recommends the following six topics that require further investigation.
First, for both generations, there is a need to explore the combined and separate effects of how multiple factors impact travel behavior. Although studies on travel behavior widely recognize its relationship with socio-demographic and built environment characteristics, it is not yet well-established how living arrangements, attitudes and perceptions, and use of technology influence travel behavior. Significant differences may exist between each generation’s lifestyles, living arrangements and attitudinal factors, which should be incorporated in future travel behavior studies. Additionally, further thoughts and analysis are needed to explain the complex inter-relationships among associated factors and travel behaviors.
Second, residential location and its association with the stages of life events should be explored to understand the change in travel behaviors of different generations over time. Individuals make travel decisions (particularly commuter routes) based on their residential as well as work locations. Important research questions to be explored include: What differences exist between urban and rural older adults in fulfilling their travel demand(s)? Do retirement, financial strain, living alone, not being able to drive, and having no transport support from friends and family influence residential relocation for travel? Are there any intentions to move near services or transit facilities when they are no longer able to drive?
On the other hand, for millennials, changes in life events (i.e., change in household composition or employment) can result in a change in residential location as well as travel patterns. Though the presence of children influences travel behavior, the number of children per household in developed countries is declining. Even after changes in life stages, millennials or young adults may like to stay in urban areas because of lifestyle preferences. For those who are living with their parents, residential location type (urban/rural) can be the same for many of them, as they are already living in suburban/rural areas. In the future, they may continue some of their current travel habits even after owning a car and may not follow the same car-dependent lifestyles of the previous generation. Future research should explore how life cycle influences travel choices, with questions including whether young adults will continue their travel behavior (and especially their use of public transit) as they age and progress through the different stages of the life cycle, and whether there will be any change in preference for residential location type because of life-stage change and to what extent.
Third, the employment and economic status of both generations should be taken into account as transportation choice is highly correlated with economic forces [23]. Compared with the previous generation, the average age that young adults join the workforce is higher than for older generations, with younger adults more likely to work part time and to continue schooling to a later age [10,73]. Furthermore, older generations may continue to work even after the typical retirement age to remain active or to avoid financial burden. Future research should investigate these key questions: What is the role of economic forces in shaping each generation’s travel behavior? How will it evolve in future? Will being employed after retirement age impact older adults travel behavior? What changes in travel patterns (especially in commuting) are expected if there is a change in employment and income conditions of the young generation? Does change in fuel price impact automobility? How do changes in insurance policy, parking policy, and driving laws impact travel behavior?
Fourth, health-related attitudes such as health-consciousness and preferences for active transportation choices may impact individuals’ travel behavior, especially mode choice. More evidence is needed on how perception and experience of transportation options influence the current and future travel behavior of each generation. Important questions to be answered through future research include: What role do transport-related attitudes play in shaping travel behavior? Does health consciousness impact mode choice? Will perceptions and attitudes towards travel options change as generations age? How and to what extent do changing attitudes impact travel behavior?
Fifth, research is needed on the role of technology adoption in shaping each generation’s travel behavior. Among older adults, the level of technology adoption as well as using online services are very low, although the familiarity with technological solutions is increasing [66]. Future research should investigate the emerging trends in travel behavior as a result of technology adoption. Shared mobility options and their impact on each generation’s travel patterns need to be explored further. Research questions to be addressed include: To what extent are emerging technologies influencing travel behavior? How do different shared-mobility options influence the travel behavior of young adults? Will older adults adopt shared-mobility options, especially online ridesharing and carsharing to fulfill their travel demands? What are the challenges to overcome to make formal ridesharing a viable alternative transport option for older adults when they are no longer able to drive?
Sixth, neither the older nor the younger generations are homogenous. To consider intra-generational heterogeneity, researchers should disaggregate different generations as much as possible based on their unique features. Haustein and Hunecke [87] discussed different segmentation approaches for travel behavior analysis and suggested that individuals can be segregated based on their travel behavior, socio-demographic characteristics, geographic location, life stages, lifestyles, and attitudes. For example, older adults can be divided into sub-groups by significant age-related mobility events, such as reaching the age of 80 in Ontario, Canada, when older adults are required to renew their license every two years. Large datasets and/or big data would be more useful to apply segmentation approaches as it will scale-up the sample size and thus, the statistical power of the sub-groups. The key question to be explored is whether the travel behavior of different generations varies across sub-groups based on different attributes.
7. Conclusions
Based on the recent evidence from developed countries, this study summarizes the travel trends among young and older adults. Seventy-eight studies were explored to document the factors that influence the unique travel characteristics of each generation. Associated factors of travel behavior are divided into five themes: personal attributes, geography and built environment, living arrangements and family life, technology adoption, and perceptions and attitudes towards travel options and environment. Travel aspects that are focused on in the reviewed literature are mode choice, trip distance, trip frequency, use of alternative transport, ridesharing, and, mobility tool ownership: driving license, car, bike, and transit pass. Based on the reviewed literature, it can be concluded that differences exist between generations in terms of travel behavior and the factors that influence their travel characteristics. However, this review only explored the direct effects of the factors on the travel behavior of older and young adults.
This study also highlighted future research directions. To address those research challenges, both quantitative and qualitative research methods can be applied. For travel behavior analysis, interactions between socio-demographic, locational characteristics, life stages, and attitudes should not be ignored. There is a need to explore the complex relationships between travel characteristics and associated factors. Some of the reviewed studies recommend the use of more advanced research methods, such as Structural Equation Models (SEM) to address the complex causality between variables. Qualitative methods such as focus group discussion and the case-study approach will be useful to investigate the underlying theory behind those complicated relationships. This study also found the need for longitudinal data to explore the changes across generations. Lastly, to implement target group-specific interventions, individuals of different generations should be segmented into different groups based on a combined consideration of socio-demographic characteristics, geographical and built environment related variations, living arrangements, and attitudes, which will reduce the complexities and heterogeneity within the target generation.
Author Contributions
Conceptualization, S.J.; methodology, S.J.; validation, S.J. and K.B.N.; formal analysis, S.J.; investigation, S.J.; data curation, S.J.; writing—Original draft preparation, S.J.; writing—Review and editing, K.B.N. and S.J.; visualization, S.J.; supervision, K.B.N. All authors have read and agreed to the published version of the manuscript.
Funding
This research received no external funding
Acknowledgments
Shaila Jamal would like to acknowledge the Doctoral Fellowship she received from the Social Sciences and Humanities Research Council of Canada (SSHRC).
Conflicts of Interest
The authors declare no conflict of interest.
Appendix A
List of the journals that were hand-searched:
- Transport Research Part A: Policy and Practice
- Transport Research Part C: Emerging Technologies
- Transportation
- Travel Behavior and Society
- Journal of Transport Geography
- Transportation Research Record
- Journal of Transport and Land Use
- Transport Reviews
- Transport Policy

Table A1.
Summary of the 78 Reviewed Studies.
| Reviewed Study | Document Type | Data Used | Method | Country of the Study | Age Group Considered | Focused Topic/Dependent Variable |
|---|---|---|---|---|---|---|
| Ahern and Hine (2012) [13] | Journal paper | Qualitative | Focus group | UK | 65 and over | Car use among older adults, Use of community transport service, type of trips/trip purpose |
| Alemi et al. (2018) [59] | Journal paper | California Millennials Dataset 2015 | Descriptive, binary logit model | US | Millennials: 18– 34; Generation X: 35–50 | Adoption of on-demand ride services among millennials and generation X |
| Axhausen (2013) [71] | Report | Quantitative, multiple data sources | Descriptive analysis | Germany and Britain | Born in 80s and 90s | Automobile ownership, licensing, mileage |
| Bailey et al. (2015) [51] | Report | Quantitative, online survey, licensing data by VicRoads | Descriptive analysis | Australia | 18–29 | Reasons behind not holding a driving license |
| Bardazzi and Pazienza (2018) [44] | Journal paper | Quantitative, Household Budget Survey 1997–2013, Panel data | Tobit model | Italy | Different cohorts | Lifecycle and generational effects on transport-related energy use, dependent variables— Choosing private transport, and level of fuel expenditure per adult |
| Barnes et al. (2016) [83] | Journal paper | Quantitative, CCHS (Canadian Community Health Survey) Healthy Aging Cycle (2008/2009) | Logistic regression | Canada | 45 and over | Association between walk score, transit score, transit use, transport walking—whether associations differ across age groups and retirement status |
| Berg et al. (2014) [17] | Journal paper | Qualitative (case studies) and travel diaries | Content analysis | Sweden | 61–67 | After transition to retirement, how mobility is influenced by individual, social, and geographical contexts |
| Berrington and Mikolai (2014) [55] | Report | Quantitative, UK household study | Descriptive analysis, regression analysis | UK | 17–34 | Young adults’ license holding, driving mileage |
| Blumenberg et al. (2012) [24] | Report | Quantitative, National Household Travel Surveys | Descriptive, structural equiation model | US | 15–26 | Travel behavior of young adults—pseudo cohorts |
| Blumenberg et al. (2015) [33] | Report | Quantitative, National Household Travel Surveys | Descriptive, factor analysis, cluster analysis | US | 20–34 | Millennials’ travel behavior at different geographic settings |
| Blumenberg et al. (2016) [76] | Journal paper | Quantitative, 1990 Nationwide Personal Travel Survey, 2001 and 2009 National Household Data | Descriptive, multi-variate model | US | Different age groups | Factors behind young adults’ decline in travel |
| Böcker et al. (2017) [37] | Journal paper | Quantitative, Travel diary of six days | Zero inflated negative binomial regression models, multinomial logit model | Netherland | 65 and over | Seniors’ and non-seniors’ trip frequency and mode choice |
| Boschmann and Brady (2013) [38] | Journal paper | Quantitative, 2009 Travel Count Survey | Descriptive, logistic and OLS (Ordinary least squares) regression | US | 60 and over | Seniors’ travel behavior-trips, mode choice, distance, purpose |
| Brown et al. (2016) [58] | Journal paper | Quantitative, 2001 and 2009 NHTS—cross-sectional dataset | Descriptive, regression analysis | US | Different birth cohorts | Transit use among youth |
| Buehler and Nobis, 2010 [4] | Conference paper | Quantitative, national travel surveys 1982/83 and 2001/02—cohort analysis | Descriptive, logistics regression | US and Germany | 65 and over | Car use among elderly |
| Busch-Geertsema and Lanzendorf (2017) [22] | Journal paper | Quantitative, online three-wave panel study | Descritive, binary logit | Germany | University students | Mode choice behavior of millennials |
| Buys et al. (2012) [5] | Journal paper | Qualitative and quantitative | Thematic approach | Australia | 55 and over | Transit and car dependency of older adults |
| Circella et al. (2017) [52] | Conference paper | Quantitative, California Millennials Dataset | Descriptive | US | 18–34 | Millennials’ travel behavior |
| Corran et al. (2018) [46] | Journal paper | Quantitative, cross-sectional survey | Logistic regression | UK | Different age groups | Factors influencing elderly people’s non-travel |
| Davis et al. (2012) [50] | Report | Quantitative, National Household Travel Survey 2001 and 2009 | Descriptive analysis | USA | 16–34 | Decline in driving among young adults |
| De Paepe et al. (2018) [79] | Journal paper | Quantitative, cross-sectional survey | Hierarchical logistic regression | Belgium | University students | Mode choice for particular activities |
| Delbosc and Currie (2013) [73] | Journal paper | Quantitative, travel survey data 1994, 1999, 2007, and 2009 | Descriptive analysis, binary logistic regression | Australia | 18–30 | License holding of young adults |
| Delbosc and Currie (2014) [16] | Journal paper | Qualitative | Online focus group | Australia | 17–23 | Attitudes toward cars and licensing |
| Delbosc and Nakanishi (2017) [18] | Journal paper | Qualitative | Semi-structured interview | Australia | 18–30 | Interaction between life course and mobility preference, and attitudes toward cars of millennials |
| Fatmi and Habib (2016) [31] | Journal paper | Quantitative, 2006 Transportation Tomorrow Survey | Latent segmentation-based logit model | Canada | 65 and over | Ownership of multiple mobility tools— segments based on frequent trip makers and non-trip makers |
| Fatmi et al. (2014) [32] | Journal paper | Quantitative, 2006 Transportation Tomorrow Survey | Latent class logit model | Canada | 17–19 | Mobility tool ownership among youths |
| Figueroa et al. (2014) [81] | Journal paper | Quantitative, Danish National Travel Survey 2006-2011 | Probit model, ordinary least square model | Denmark | Different age groups | How built environment is correlated with the travel patterns of different generations |
| Fordham et al. (2017) [25] | Journal paper | Quantitative, O-D survey 1998, 2003, 2008, 2013 | Pseudocohort analysis | Canada | 50 and over | Public transit use among seniors |
| Giesel and Kohler (2015) [62] | Journal paper | Quantitative, Mobility in Germany 2008 survey | Logistic regression, descriptive analysis | Germany | 65 and over | Elderly people’s daily travel, factors influencing daily short-distance travel (traveling locally) |
| Habib (2015) [40] | Journal paper | Quantitative, NCR’s 2011 Household Travel Survey | Utility theoretic joint model | Canada | 65 and over | Mode choice and travel distance of older people |
| Habib (2018) [29] | Journal paper | Quantitative, travel survey of four universities in GTA | Hazard-based duration model | Canada | University students | Age of acquiring driving license, choice of not acquiring a driving license |
| Habib et al. (2018) [53] | Journal paper | Quantitative, 2015 travel survey of four universities in GTA | Cross-nested logit model | Canada | University students | Choice of owning basic mobility tools (driver’s license, car, transit pass, bike) or combination of basic tools |
| Hanson and Hildebrand (2011) [60] | Journal paper | Quantitative, cross-sectional | Descriptive analysis | Canada | 54–92 | Can rural drivers meet their travel needs without a car? |
| Haustein (2011) [36] | Journal paper | Quantitative, cross-sectional survey | Linear and ordinal regression analysis, cluster analysis | Germany | 60 and over | Older adults’ mobility by different segments |
| Haustein and Siren (2014) [45] | Journal paper | Quantitative, telephone survey of 863 individuals | Descriptive analysis, ordinal regression | Denmark | Born in 1939/40 | Amount of unmet mobility needs—used different segments of drivers. |
| Hess (2011) [80] | Journal paper | Quantitative | Descriptive analysis | US | 60 and over | How perception of distance to bus stops influence walking to bus stops among older adults |
| Hjorthol (2012) [43] | Journal paper | Quantitative, Norwegian nationwide survey of activities and daily mobilities, 2010 | Descriptive, logistic regression | Norway | 67 and over | Older adults’ mobility needs |
| Hjorthol (2016) [70] | Journal paper | Quantitative, Norwegian National Travel Survey data from 1985 to 2009, cross-sectional | Logistic regression, cohort analysis | Norway | 18–25 | Holding a driving license, access to a car |
| Hjorthol et al. (2010) [65] | Journal paper | Quantitative, National Travel Survey from 1984 to 2006, cross-sectional | Cohort analysis | Norway, Sweden, Denmark | 40–84 | Holding a driving license, access to a car |
| Jones et al. (2018) [63] | Journal paper | Quantitative, cross-sectional data, longitudinal research on aging drivers cohort study | Logistic regression | US | 65–79 | Driving distance by different modes, number of alternate transport sources rather than self-driving among older drivers |
| Klein and Smart (2017) [23] | Journal paper | Quantitative, panel study, panel study of income dynamics | Poission panel regression: random effect model, fixed effects model | US | Born in 80s and 90s | Car ownership, car access |
| Kroesen and Handy (2015) [85] | Journal paper | Quantitative, cross-sectional, LISS (Longitudinal Internet studies for the Social Sciences) panel data—used 2013 data | Linear regression | Denmark | 30 or younger, and above 30 | Attitudes toward car, attitudes toward public transport |
| Kuhnimhof et al. (2011) [48] | Journal paper | Quantitative, National Travel Survey from 1970 to 2013, cross-sectional | Descriptive analysis | Germany and Britain | Young population of different birth cohorts | Car ownership, distance, multimodality |
| Kuhnimhof et al. (2012) [54] | Journal paper | Quantitative, German Mobility Panel, German Income and Expenditure Survey for 1998 and 2008, time series data | Logistic regression, descriptive analysis | Germany | 18–34 | Car ownership, driving distance |
| Kuhnimhof et al. (2012) [78] | Journal paper | Quantitative, National Travel Survey | Descriptive analysis | Germany, France, Britain, Japan, Norway, US | 17–29 of different decades | Driver’s license, car ownership, distance |
| Kuhnimhof et al. (2012) [49] | Journal paper | Quantitative, National Travel Survey, 2002 and 2008 | Descriptive analysis, multilevel regression | Germany | 18–29 | Driver’s license, car ownership, distance |
| Lavieri et al. (2017) [3] | Journal paper | Quantitative, 2014 Mobility Attitudes Survey, cross-sectional | Structural equation model | US | 18–33 | Mode of transport, driver’s license holding, vehicle ownership |
| Le Vine and Polak (2014) [74] | Journal paper | Quantitative, 2010 British national travel Surveys | Logistic regression | UK | 17–29 | License holding |
| Leistner and Steiner (2017) [66] | Journal paper | Quantitative, cross-sectional data | Descriptive | US | 60 and over | Older adults’ dynamic ridesharing—ridesharing has the potential to increase mobility and accessibility |
| Licaj et al. (2012) [75] | Journal Paper | Quantitative, 2005 -2006 Household Travel Survey | Logistics regression | France | 16–24 | Relationship between driving and socio-economic and geographical factors |
| Mattson (2012) [34] | Report | Quantitative, National Travel Survey of 2001 and 2010 | Binary logit model, negative binomial logit model, cluster analysis | US | 65 and over | Frequency of driving and number of trips |
| McDonald (2015) [2] | Journal paper | Quantitative, NTS of multiple years | Regression analysis, descriptive analysis | US | 19–42 | Daily automobile mileage |
| Melia et al. (2018) [84] | Journal paper | Quantitative, NTS 2001 and 2011 | Regression analysis— fractional logit model | UK | 16–34 | Driving frequency, public transport use frequency |
| Mifsud et al. (2017) [39] | Journal paper | Quantitative, cross-sectional survey | Descriptive, regression analysis | Malta | 60 and over | Status of driving, public transport use |
| Mollenkopf et al. (2011) [21] | Journal paper | Mixed method—quantitative and qualitative, longitudinal study—1995, 2000, 2005 | Descriptive analysis, semi-structured interview, content analysis | Germany | 55 or over | Older adults’ perceptions of out-of-home mobility |
| Moniruzzaman et al. (2013) [28] | Journal paper | Quantitative, Montreal’s Household Travel Survey 2008 | Joint discrete-continuous model, hazard based model | Canada | 55 and over | Mode choice—walking, transit; trip length—car, walking, transit |
| Muromachi (2017) [72] | Journal paper | Quantitative, cross-sectional survey | Ordered probit model, descriptive analysis | Japan | 18–26, university students | Intention to purchase a car in future, |
| Nash and Mitra (2018) [30] | Conference paper | Quantitative, cross-sectional, segmentation | Latent class logit model | Canada | University students | University students’ travel behavior including attitudes, and lifestyle |
| Newbold and Scott (2017) [26] | Journal paper | Quantitative, General Social Survey 1998, 2005, 2010 | Descriptive analysis | Canada | Different cohorts | Licensure rate, mode choice |
| Newbold and Scott (2018) [27] | Journal paper | Quantitative, General Social Survey 1998, 2005, 2010 | Descriptive analysis, logistic regression | Canada | Different cohorts | Mode choice, determinants of transit use |
| Rahman et al. (2016) [41] | Journal paper | Quantitative, cross-sectional, nationwide survey | Descriptive analysis, ordered logit model | US | 65 or over | Older adults’ alternative transportation preferences |
| Sakaria and Stehfest (2013) [19] | Report | Qualitative (telephone survey) and quantitative (online survey) | Descriptive | US | 18–34 | Millennials’ lifestyle, attitudes and decision-making process related to daily travel |
| Schoettle and Sivak (2014) [77] | Journal paper | Quantitative, cross-sectional survey | Descriptive analysis | US | 18–39 | Drivers’ licensing |
| Simons et al. (2014) [15] | Journal paper | Qualitative | Focus group study, content analysis | Belgium | 18–25 | Factors affecting transport mode for short distance travel- focus is given on cycling |
| Simons et al. (2017) [57] | Journal paper | Quantitative, cross-sectional survey | Zero inflated negative binomial regression models | Belgium | 18–25 | Mode choice by different groups of young adults |
| Siren and Haustein (2013) [35] | Journal paper | Quantitative, cross-sectional survey | Cluster analysis, descriptive analysis | Denmark | Born in 1946 and 1947 | Travel habits, expectations and preferences |
| Siren and Haustein (2015) [69] | Journal paper | Quantitative, longitudinal survey. 2009 and follow-up survey in 2012 | Descriptive analysis | Denmark | Born in 1946 and 1947 | How retirement affects baby boomers’ travel—distinguished by ’still working’, ’early retirees’, ‘recent retirees’ |
| Sivak and Schoettle (2011) [56] | Journal paper | Quantitative, Federal Highway Administration on driver’s licenses, 1983 -2008 | Descriptive analysis | US | Different age groups | Driving license holding by age |
| Truong and Somenahalli (2011) [20] | Journal paper | Qualitative and quantitative, cross-sectional travel survey 2010 | Descriptive analysis | Australia | 65 and over | Daily trips, distance travelled, trip chain complexity |
| Truong and Somenahalli (2015) [42] | Journal paper | Quantitative, cross-sectional survey 2010 | Multinomial logistic regression | Australia | 65 and over | Factors influencing frequency of using transit |
| Tuokko et al. (2014) [86] | Journal paper | Quantitative, cross-sectional data, Canadian Driving Research Initiative for Vehicular Safety in Elder (Candrive II) | Descriptive analysis | Canada | 70 and over | Attitudes relevant to driving restriction |
| Turner et al. (2017) [68] | Journal paper | Quantitative, cross-sectional, nationwide survey 2013 | Multivariate analysis | US | 60 and over | Perceived alternative transport needs by older adults—driving groups vs. non-driving groups |
| Vale et al. (2018) [47] | Journal paper | Quantitative, cross-sectional survey 2015 | Descriptive analysis, spatial analysis | Portugal | University students | Commute mode |
| Van Cauwenberg et al. (2013) [82] | Journal paper | Quantitative, cross-sectional | Multilevel logistic regression | Belgium | 60 or over | How physical environmental factors influence older adults’ walking—amount of daily walking |
| Vivoda et al. (2018) [67] | Journal paper | Quantitative | Regression analysis | US | 65 and over | E-hail/ridesharing knowledge, use and level of reliance of older adults |
| Ward et al. (2013) [14] | Journal paper | Qualitative | Focus group | UK | 65 and over | Older adults’ car use |
| Yang et al. (2018) [64] | Journal paper | Quantitative, 2009 National Travel Survey | Linear regression, Logistic regression | US | 65 and over | Active travel trips, public transportation trips, travel purpose, distance travelled |
| Zmud et al. (2017) [61] | Report | Quantitative, multiple data sources | Descriptive analysis | Germany, US, UK, China, Japan | 65 and over | Older adults’ mobility patterns |
Figure A1.
Association between Travel Behavior and Different Factors.

Figure A2.
Stages of the Literature Search and Retrieval Process.
References
- Thakuriah, P.V.; Menchu, S.; Tang, L. Car ownership among young adults. Transp. Res. Rec. 2010, 2156, 1–8. [Google Scholar] [CrossRef]
- McDonald, N.C. Are millennials really the “go-nowhere” generation? J. Am. Plan. Assoc. 2015, 81, 90–103. [Google Scholar] [CrossRef]
- Lavieri, P.S.; Garikapati, V.M.; Bhat, C.R.; Pendyala, R.M. Investigation of heterogeneity in vehicle ownership and usage for the millennial generation. Transp. Res. Rec. 2017, 2664, 91–99. [Google Scholar] [CrossRef] [Green Version]
- Buehler, R.; Nobis, C. Travel behavior in aging societies. Transp. Res. Rec. 2010, 2182, 62–70. [Google Scholar] [CrossRef]
- Buys, L.; Snow, S.; van Megen, K.; Miller, E. Transportation behaviors of older adults: An investigation into car dependency in urban Australia. Australas J. Ageing 2012, 31, 181–186. [Google Scholar] [CrossRef] [Green Version]
- Circella, G.; Tiedeman, K.; Handy, S.; Alemi, F.; Mokhtarian, P.L. What Affects U.S. Passenger Travel? Current Trends and Future Perspectives? White Paper from the National Center for Sustainable Transportation; University of California: Davis, CA, USA, 2016. [Google Scholar]
- Graham, H.; de Bell, S.; Flemming, K.; Sowden, A.; White, P.; Wright, K. The experiences of everyday travel for older people in rural areas: A systematic review of UK qualitative studies. J. Transp. Health 2018, 11, 141–152. [Google Scholar] [CrossRef]
- Luiu, C.; Tight, M.; Burrow, M. The unmet travel needs of the older population: A review of the literature. Transp. Rev. 2016, 37, 488–506. [Google Scholar] [CrossRef]
- Haustein, S.; Siren, A. Older people’s mobility: Segments, factors, trends. Transp. Rev. 2015, 35, 466–487. [Google Scholar] [CrossRef] [Green Version]
- Delbosc, A.; Currie, G. Causes of youth licensing decline: A synthesis of evidence. Transp. Rev. 2013, 33, 271–290. [Google Scholar] [CrossRef]
- Arksey, H.; O’Malley, L. Scoping studies: Towards a methodological framework. Int. J. Soc. Res. Methodol. 2005, 8, 19–32. [Google Scholar] [CrossRef] [Green Version]
- Levac, D.; Colquhoun, H.L.; Nixon, S.A. Scoping studies: Advancing the methodology. Implement. Sci. 2010, 5, 69. [Google Scholar] [CrossRef] [Green Version]
- Ahern, A.; Hine, J. Rural transport—Valuing the mobility of older people. Res. Transp. Econ. 2012, 34, 27–34. [Google Scholar] [CrossRef]
- Ward, M.R.M.; Somerville, P.; Bosworth, G. ‘Now without my car I don’t know what I’d do’: The transportation needs of older people in rural Lincolnshire. Local Econ. 2013, 28, 553–566. [Google Scholar] [CrossRef] [Green Version]
- Simons, D.; Clarys, P.; de Bourdeaudhuij, I.; de Geus, B.; Vandelanotte, C.; Deforche, B. Why do young adults choose different transport modes? A focus group study. Transp. Policy 2014, 36, 151–159. [Google Scholar] [CrossRef]
- Delbosc, A.; Currie, G. Using discussion forums to explore attitudes toward cars and licensing among young Australians. Transp. Policy 2014, 31, 27–34. [Google Scholar] [CrossRef]
- Berg, J.; Levin, L.; Abramsson, M.; Hagberg, J.E. Mobility in the transition to retirement—The intertwining of transportation and everyday projects. J. Transp. Geogr. 2014, 38, 48–54. [Google Scholar] [CrossRef]
- Delbosc, A.; Nakanishi, H. A life course perspective on the travel of Australian millennials. Transp. Res. Part. A Policy Pract. 2017, 104, 319–336. [Google Scholar] [CrossRef]
- Sakaria, N.; Stehfest, N. Millennials and Mobility: Understanding the Millennial Mindset and New Opportunities for Transit Providers (No. Task 17, TCRP Project J-11); American Public Transportation Association: Washington, DC, USA, 2013. [Google Scholar]
- Truong, L.T.; Somenahalli, S. Exploring mobility of older people: A case study of Adelaide. In Proceedings of the 34th Australasian Transport Research Forum, Adelaide, Australia, 28–30 September 2011. [Google Scholar]
- Mollenkopf, H.; Hieber, A.; Wahl, H.-W. Continuity and change in older adults’ perceptions of out-of-home mobility over ten years: A qualitative–quantitative approach. Ageing Soc. 2011, 31, 782–802. [Google Scholar] [CrossRef]
- Busch-Geertsema, A.; Lanzendorf, M. From university to work life—Jumping behind the wheel? Explaining mode change of students making the transition to professional life. Transp. Res. Part. A Policy Pract. 2017, 106, 181–196. [Google Scholar] [CrossRef]
- Klein, N.J.; Smart, M.J. Millennials and car ownership: Less money, fewer cars. Transp. Policy 2017, 53, 20–29. [Google Scholar] [CrossRef] [Green Version]
- Blumenberg, E.; Taylor, B.D.; Smart, M.; Ralph, K.; Wander, M.; Brumbagh, S. What’s Youth Got to Do with It? Exploring the Travel Behavior of Teens and Young Adults; University of California Transportation Center: Berkeley, CA, USA, 2012. [Google Scholar]
- Fordham, L.; Grisé, E.; El-Geneidy, A. When I’m 64: Assessing generational differences in public transit use of seniors in Montreal, Quebec, Canada. Transp. Res. Rec. 2017, 2651, 31–41. [Google Scholar] [CrossRef]
- Newbold, K.B.; Scott, D.M. Driving over the life course: The automobility of Canada’s millennial, generation x, baby boomer and greatest generations. Travel Behav. Soc. 2017, 6, 57–63. [Google Scholar] [CrossRef]
- Newbold, K.B.; Scott, D.M. Insights into public transit use by Millennials: The Canadian experience. Travel Behav. Soc. 2018, 11, 62–68. [Google Scholar] [CrossRef]
- Moniruzzaman, P.A.; Habib, K.N.; Morency, C. Mode use and trip length of seniors in Montreal. J. Transp. Geogr. 2013, 30, 89–99. [Google Scholar] [CrossRef]
- Habib, K.N. Modelling the choice and timing of acquiring a driver’s license: Revelations from a hazard model applied to the University students in Toronto. Transp. Res. Part. A Policy Pract. 2018, 118, 374–386. [Google Scholar] [CrossRef]
- Nash, S.; Mitra, R. University Students’ Transportation Life-styles and the Role of Neighborhood Types and Attitudes (No. In 18-01770). In Proceedings of the 97th Annual Meeting of Transportation Research Board, Washington, DC, USA, 7–11 January 2018. [Google Scholar]
- Fatmi, M.R.; Habib, M.A. Modeling travel tool ownership of the elderly population: Latent segmentation-based logit model. Transp. Res. Rec. 2016, 2565, 18–26. [Google Scholar] [CrossRef]
- Fatmi, M.R.; Habib, M.A.; Salloum, S.A. Modeling mobility tool ownership of youth in Toronto, Ontario, Canada. Transp. Res. Rec. 2014, 2413, 92–100. [Google Scholar] [CrossRef]
- Blumenberg, E.; Brown, A.; Ralph, K.M.; Taylor, B.D.; Voulgaris, C.T. Typecasting Neighborhoods and Travelers: Analyzing the Geography of Travel Behavior among Teens and Young Adults in the US; US Department of Transportation (USDOT): Washington, DC, USA, 2015.
- Mattson, J.W. Travel Behavior and Mobility of Transportation-Disadvantaged Populations: Evidence from the National Household Travel Survey (No. DP-258); Upper Great Plains Transportation Institute: Fargo, ND, USA, 2012. [Google Scholar]
- Siren, A.; Haustein, S. Baby boomers’ mobility patterns and preferences: What are the implications for future transport? Transp. Policy 2013, 29, 136–144. [Google Scholar] [CrossRef] [Green Version]
- Haustein, S. Mobility behavior of the elderly: An attitude-based segmentation approach for a heterogeneous target group. Transportation 2011, 39, 1079–1103. [Google Scholar] [CrossRef]
- Böcker, L.; van Amen, P.; Helbich, M. Elderly travel frequencies and transport mode choices in Greater Rotterdam, the Netherlands. Transportation 2016, 44, 831–852. [Google Scholar] [CrossRef] [Green Version]
- Boschmann, E.E.; Brady, S.A. Travel behaviors, sustainable mobility, and transit-oriented developments: A travel counts analysis of older adults in the Denver, Colorado metropolitan area. J. Transp. Geogr. 2013, 33, 1–11. [Google Scholar] [CrossRef]
- Mifsud, D.; Attard, M.; Ison, S. To drive or to use the bus? An exploratory study of older people in Malta. J. Transp. Geogr. 2017, 64, 23–32. [Google Scholar] [CrossRef] [Green Version]
- Habib, K.N. An investigation on mode choice and travel distance demand of older people in the National Capital Region (NCR) of Canada: Application of a utility theoretic joint econometric model. Transportation 2015, 42, 143–161. [Google Scholar] [CrossRef]
- Rahman, M.; Strawderman, L.; Adams-Price, C.; Turner, J.J. Transportation alternative preferences of the aging population. Travel Behav. Soc. 2016, 4, 22–28. [Google Scholar] [CrossRef]
- Truong, L.T.; Somenahalli, S.V.C. Exploring frequency of public transport use among older adults: A study in Adelaide, Australia. Travel Behav. Soc. 2015, 2, 148–155. [Google Scholar] [CrossRef]
- Hjorthol, R. Transport resources, mobility and unmet transport needs in old age. Ageing Soc. 2012, 33, 1190–1211. [Google Scholar] [CrossRef]
- Bardazzi, R.; Pazienza, M.G. Ageing and private transport fuel expenditure: Do generations matter? Energy Policy 2018, 117, 396–405. [Google Scholar] [CrossRef]
- Haustein, S.; Siren, A. Seniors’ unmet mobility needs—How important is a driving licence? J. Transp. Geogr. 2014, 41, 45–52. [Google Scholar] [CrossRef] [Green Version]
- Corran, P.; Steinbach, R.; Saunders, L.; Green, J. Age, disability and everyday mobility in London: An analysis of the correlates of ‘non-travel’ in travel diary data. J. Transp. Health 2018, 8, 129–136. [Google Scholar] [CrossRef]
- Vale, D.S.; Pereira, M.; Viana, C.M. Different destination, different commuting pattern? Analyzing the influence of the campus location on commuting. J. Transp. Land Use 2018, 11, 1–18. [Google Scholar] [CrossRef] [Green Version]
- Kuhnimhof, T.; Buehler, R.; Dargay, J. A new generation: Travel trends for young Germans and Britons. Transp. Res. Rec. 2011, 2230, 58–67. [Google Scholar] [CrossRef]
- Kuhnimhof, T.; Armoogum, J.; Buehler, R.; Dargay, J.; Denstadli, J.M.; Yamamoto, T. Men shape a downward trend in car use among young Adults—Evidence from six industrialized countries. Transp. Rev. 2012, 32, 761–779. [Google Scholar] [CrossRef]
- Davis, B.; Dutzik, T.; Baxandall, P. Transportation and the New Generation: Why Young People Are Driving Less and What It Means for Transportation Policy; U.S. PIRG Education Fund & Frontier Group: Washington, DC, USA, 2012. [Google Scholar]
- Bailey, T.J.; Wundersitz, L.N.; Raftery, S.J.; Baldock, M.R. Young Adult Licensing Trend and Travel Modes (No. 15/01); Royal Automobile Club of Victoria (RACV): Melbourne, Australia, 2015. [Google Scholar]
- Circella, G.; Alemi, F.; Berliner, R.M.; Tiedeman, K.; Lee, Y.; Fulton, L.; Handy, S.; Mokhtarian, P.L. Multimodal behavior of millennials: Exploring differences in travel choices between young adults and gen-xers in California. In Proceedings of the 96th Transportation Research Board Annual Meeting, Washington, DC, USA, 8–12 January 2017. [Google Scholar]
- Habib, K.N.; Weiss, A.; Hasnine, S. On the heterogeneity and substitution patterns in mobility tool ownership choices of post-secondary students: The case of Toronto. Transp. Res. Part. A Policy Pract. 2018, 116, 650–665. [Google Scholar] [CrossRef]
- Kuhnimhof, T.; Wirtz, M.; Manz, W. Decomposing young Germans’ altered car use patterns. Transp. Res. Rec. 2012, 2320, 64–71. [Google Scholar] [CrossRef]
- Berrington, A.; Mikolai, J. Young Adults’ Licence-Holding and Driving Behavior in the UK: Full Findings; The Royal Automobile Club Foundation for Motoring Ltd.: London, UK, 2014. [Google Scholar]
- Sivak, M.; Schoettle, B. Recent changes in the age composition of U.S. Drivers: Implications for the extent, safety, and environmental consequences of personal transportation. Traffic Inj. Prev. 2011, 12, 588–592. [Google Scholar] [CrossRef]
- Simons, D.; de Bourdeaudhuij, I.; Clarys, P.; de Geus, B.; Vandelanotte, C.; van Cauwenberg, J.; Deforche, B. Choice of transport mode in emerging adulthood: Differences between secondary school students, studying young adults and working young adults and relations with gender, SES and living environment. Transp. Res. Part. A Policy Pract. 2017, 103, 172–184. [Google Scholar] [CrossRef]
- Brown, A.; Blumenberg, E.; Taylor, B.; Ralph, K.; Voulgaris, C.T. A taste for transit? Analyzing public transit use trends among youth. J. Public Transp. 2016, 19, 49–67. [Google Scholar] [CrossRef] [Green Version]
- Alemi, F.; Circella, G.; Handy, S.; Mokhtarian, P. What influences travelers to use Uber? Exploring the factors affecting the adoption of on-demand ride services in California. Travel Behav. Soc. 2018, 13, 88–104. [Google Scholar] [CrossRef]
- Hanson, T.; Hildebrand, E.D. Can rural older drivers meet their needs without a car? Stated adaptation responses from a GPS travel diary survey. Transportation 2011, 38, 975–992. [Google Scholar] [CrossRef]
- Zmud, J.; Green, L.; Kuhnimhof, T.; le Vine, S.; Polak, J.; Phleps, P. Still going… and going: The emerging travel patterns of older adults. Institute for Mobility Research. 2017. Available online: https://www.ifmo.de/files/publications_content/2017/2017_ifmo_senior_generation_mobility_en.pdf (accessed on 9 October 2020).
- Giesel, F.; Köhler, K. How poverty restricts elderly Germans’ everyday travel. Eur. Transp. Res. Rev. 2015, 7, 15. [Google Scholar] [CrossRef] [Green Version]
- Jones, V.; Johnson, R.M.; Rebok, G.W.; Roth, K.B.; Gielen, A.C.; Molnar, L.; Pitts, S.; DiGuiseppi, C.G.; Hill, L.L.; Strogatz, D.S.; et al. Use of alternative sources of transportation among older adult drivers. J. Transp. Health 2018, 10, 284–289. [Google Scholar] [CrossRef]
- Yang, Y.; Xu, Y.; Rodríguez, D.A.; Michael, Y.; Zhang, H. Active travel, public transportation use, and daily transport among older adults: The association of built environment. J. Transp. Health 2018, 9, 288–298. [Google Scholar] [CrossRef]
- Hjorthol, R.J.; Levin, L.; Siren, A. Mobility in different generations of older persons. J. Transp. Geogr. 2010, 18, 624–633. [Google Scholar] [CrossRef]
- Leistner, D.L.; Steiner, R.L. Uber for seniors? Exploring transportation options for the future. Transp. Res. Rec. 2017, 2660, 22–29. [Google Scholar] [CrossRef]
- Vivoda, J.M.; Harmon, A.C.; Babulal, G.M.; Zikmund-Fisher, B.J. E-hail (rideshare) knowledge, use, reliance, and future expectations among older adults. Transp. Res. Part. F Traffic Psychol. Behav. 2018, 55, 426–434. [Google Scholar] [CrossRef]
- Turner, J.J.; Adams-Price, C.E.; Strawderman, L. Formal alternative transportation options for older adults: An assessment of need. J. Gerontol. Soc. Work. 2017, 60, 619–646. [Google Scholar] [CrossRef]
- Siren, A.; Haustein, S. How do baby boomers’ mobility patterns change with retirement? Ageing Soc. 2015, 36, 988–1007. [Google Scholar] [CrossRef]
- Hjorthol, R. Decreasing popularity of the car? Changes in driving licence and access to a car among young adults over a 25-year period in Norway. J. Transp. Geogr. 2016, 51, 140–146. [Google Scholar] [CrossRef] [Green Version]
- Axhausen, K. Mobility Y: The Emerging Travel Patterns of Generation Y; Institute for Mobility Research: Zurich, Switzerland, 2013. [Google Scholar]
- Muromachi, Y. Experiences of past school travel modes by university students and their intention of future car purchase. Transp. Res. Part. A Policy Pract. 2017, 104, 209–220. [Google Scholar] [CrossRef]
- Delbosc, A.; Currie, G. Changing demographics and young adult driver license decline in Melbourne, Australia (1994–2009). Transportation 2013, 41, 529–542. [Google Scholar] [CrossRef]
- le Vine, S.; Polak, J. Factors associated with young adults delaying and forgoing driving licenses: Results from Britain. Traffic Inj. Prev. 2014, 15, 794–800. [Google Scholar] [CrossRef] [PubMed]
- Licaj, I.; Haddak, M.; Pochet, P.; Chiron, M. Individual and contextual socioeconomic disadvantages and car driving between 16 and 24 years of age: A multilevel study in the Rhone Departement (France). J. Transp. Geogr. 2012, 22, 19–27. [Google Scholar] [CrossRef] [Green Version]
- Blumenberg, E.; Ralph, K.; Smart, M.J.; Taylor, B.D. Who knows about kids these days? Analyzing the determinants of youth and adult mobility in the U.S. between 1990 and 2009. Transp. Res. Part. A Policy Pr. 2016, 93, 39–54. [Google Scholar] [CrossRef]
- Schoettle, B.; Sivak, M. The reasons for the recent decline in young driver licensing in the United States. Traffic Inj. Prev. 2013, 15, 6–9. [Google Scholar] [CrossRef]
- Kuhnimhof, T.; Buehler, R.; Wirtz, M.; Kalinowska, D. Travel trends among young adults in Germany: Increasing multimodality and declining car use for men. J. Transp. Geogr. 2012, 24, 443–450. [Google Scholar] [CrossRef]
- de Paepe, L.; van Acker, V.; Witlox, F.; de Vos, J. Changes in travel behavior during the transition from secondary to higher education: A case study from Ghent, Belgium. J. Transp. Land Use 2018, 11. [Google Scholar] [CrossRef] [Green Version]
- Hess, D.B. Walking to the bus: Perceived versus actual walking distance to bus stops for older adults. Transportation 2011, 39, 247–266. [Google Scholar] [CrossRef]
- Figueroa, M.J.; Nielsen, T.A.S.; Siren, A. Comparing urban form correlations of the travel patterns of older and younger adults. Transp. Policy 2014, 35, 10–20. [Google Scholar] [CrossRef]
- van Cauwenberg, J.; Clarys, P.; de Bourdeaudhuij, I.; van Holle, V.; Verté, D.; de Witte, N.; de Donder, L.; Buffel, T.; Dury, S.; Deforche, B. Older adults’ transportation walking: A cross-sectional study on the cumulative influence of physical environmental factors. Int. J. Health Geogr. 2013, 12, 37. [Google Scholar] [CrossRef] [Green Version]
- Barnes, R.; Winters, M.; Ste-Marie, N.; McKay, H.; Ashe, M.C. Age and retirement status differences in associations between the built environment and active travel behavior. J. Transp. Health 2016, 3, 513–522. [Google Scholar] [CrossRef]
- Melia, S.; Chatterjee, K.; Stokes, G. Is the urbanisation of young adults reducing their driving? Transp. Res. Part. A Policy Pract. 2018, 118, 444–456. [Google Scholar] [CrossRef]
- Kroesen, M.; Handy, S.L. Is the rise of the e-society responsible for the decline in car use by young adults? Transp. Res. Rec. 2015, 2496, 28–35. [Google Scholar] [CrossRef]
- Tuokko, H.; Jouk, A.; Myers, A.; Marshall, S.; Man-Son-Hing, M.; Porter, M.M.; Bédard, M.; Gélinas, I.; Korner-Bitensky, N.; Mazer, B.; et al. A Re-examination of driving-related attitudes and readiness to change driving behavior in older adults. Phys. Occup. Ther. Geriatr. 2014, 32, 210–227. [Google Scholar] [CrossRef]
- Haustein, S.; Hunecke, M. Identifying target groups for environmentally sustainable transport: Assessment of different segmentation approaches. Curr. Opin. Environ. Sustain. 2013, 5, 197–204. [Google Scholar] [CrossRef] [Green Version]
© 2020 by the authors. Licensee MDPI, Basel, Switzerland. This article is an open access article distributed under the terms and conditions of the Creative Commons Attribution (CC BY) license (http://creativecommons.org/licenses/by/4.0/).
Share and Cite
MDPI and ACS Style
Jamal, S.; Newbold, K.B. Factors Associated with Travel Behavior of Millennials and Older Adults: A Scoping Review. Sustainability 2020, 12, 8236. https://doi.org/10.3390/su12198236
AMA Style
Jamal S, Newbold KB. Factors Associated with Travel Behavior of Millennials and Older Adults: A Scoping Review. Sustainability. 2020; 12(19):8236. https://doi.org/10.3390/su12198236
Chicago/Turabian StyleJamal, Shaila, and K. Bruce Newbold. 2020. "Factors Associated with Travel Behavior of Millennials and Older Adults: A Scoping Review" Sustainability 12, no. 19: 8236. https://doi.org/10.3390/su12198236
Note that from the first issue of 2016, this journal uses article numbers instead of page numbers. See further details here.