Measuring Operational Performance of Major Chinese Airports Based on SBM-DEA


1
Department of International Trade, Inha University, 100 Inha-ro, Michuhol-gu, Incheon 22212, Korea
2
Department of International Trade, Yanbian University, Yanji, Jilin 133002, China
3
East Asia Environment Research Center, Inha University, Inharo 100, Inha-ro, Michuhol-gu, Incheon 22212, Korea
*
Author to whom correspondence should be addressed.
Sustainability 2020, 12(19), 8234; https://doi.org/10.3390/su12198234
Submission received: 14 August 2020
/
Revised: 24 September 2020
/
Accepted: 24 September 2020
/
Published: 6 October 2020
(This article belongs to the Special Issue Energy Efficiency and Urban Climate Adaption)
Abstract
:This study analyzes the sustainable feasibility of major airports in China in terms of airport operational efficiency (AOE). As AOE should be measured by economic performance as well as qualitative service management such as delay rate abatement, our study uses a multi-input/output slack-based data envelopment analysis model. We find that the 37 major airports in China have very low AOE levels, with an average of 48.2% during the study period of 2016–2019, implying great potential to enhance their efficiency. Even though the AOE trend is increasing upwards, it is still very much behind in terms of global standards. Moreover, this upward trend may come from external factors in the commercially driven eastern region airports and politically supported western region airports, and the AOE gap with airports in the central region is becoming larger. This implies that most airports in China are not yet self-sustaining. There are two ways for these airports to enhance AOE: more investment in infrastructure, such as airport facilities, and management upgrades from peer-learning efforts. We examined the feasibility of these two optimal paths and found that there is no need for decreasing returns to scale, implying that most of the airports can improve their AOE through additional investment, except for the eight airports with constant returns to scale, such as Beijing and Guangzhou. Moreover, each of the individual airports should learn from the top benchmarking airports on the production frontier. This study emphasizes the role of qualitative service performance and concludes that customized, self-sustaining innovation is required for all of the 37 major airports in China.
1. Introduction
As the regional network economy due to global outsourcing and global supply chain management has become more popular, the regional cooperative manufacturing system has seriously promoted the important role of the aviation industry. As an important component of the logistics infrastructure for cities and air transportation, airports play an important role in the integrated regional cooperative network economy. Moreover, as major airports lead the demand-driven economy of these regional networks, many of the world’s major countries have been actively developing regional hub airports, with airport expansions and modernization of facilities, seeking to attract passengers and cargo with better airport services [1]. To become a regional hub for this network economy, however, a large segment of the airport industry urgently needs to enhance its effective investment in infrastructure, as well as advanced airport management, to improve its own operating efficiency and effectively compete with other airports in neighboring areas. Nonetheless, it is not easy to achieve this enhanced efficiency to become a demand-driven regional hub. Therefore, there are some questions regarding the sustainable feasibility of the supporting policies of the Chinese government regarding airports [2].
In China, the air transport industry has been one of the fastest-growing industries in recent years. At present, China is ranked as the world’s second-largest civil aviation country, just after the United States. According to the International Air Transportation Association (IATA) (2019), Asia represented 35.4% of the world’s air transportation in 2018, followed by North America with 23.7%, and Europe with 23.3%. In terms of the major countries, the volume of air transportation in the United States was 42,985 million tons in 2018, accounting for 18.61% of the world’s total volume. China ranked second with 25,256 million tons, accounting for about 10.93% (Statistical Data on Civil Aviation of China, 2019). As of the end of 2019, all Chinese airlines have reached 148 destinations in 59 countries on six continents. Based on this rapid growth of the aviation industry, the government policy of China changed from the early stage of government-enterprise toward the reform of the management system, with the main goal of the “harmonious relationship between the government and aviation companies”. With the separation of “government and enterprise” in China’s civil aviation industry, air transportation companies and aviation service companies have gradually promoted the corporate management and operation system in market-oriented mechanisms. At the same time, the government’s role has gradually changed from government-led enterprises to market supervision. The government has been separated from the civil aviation industry and has become the market regulator of the civil aviation industry, with its main functions positioned as the civil aviation regulatory agency. Nonetheless, the strong leadership by the Chinese government may result in a superficial instantaneous effect without a sustainable performance of the operating mechanism. Unfortunately, most of the papers focus on the investment amount and/or improved facilities rather than the operating mechanisms or qualitative services from its management. Our research aims to fill these missing links in the role of regulator on the airport as the new generation of hub port.
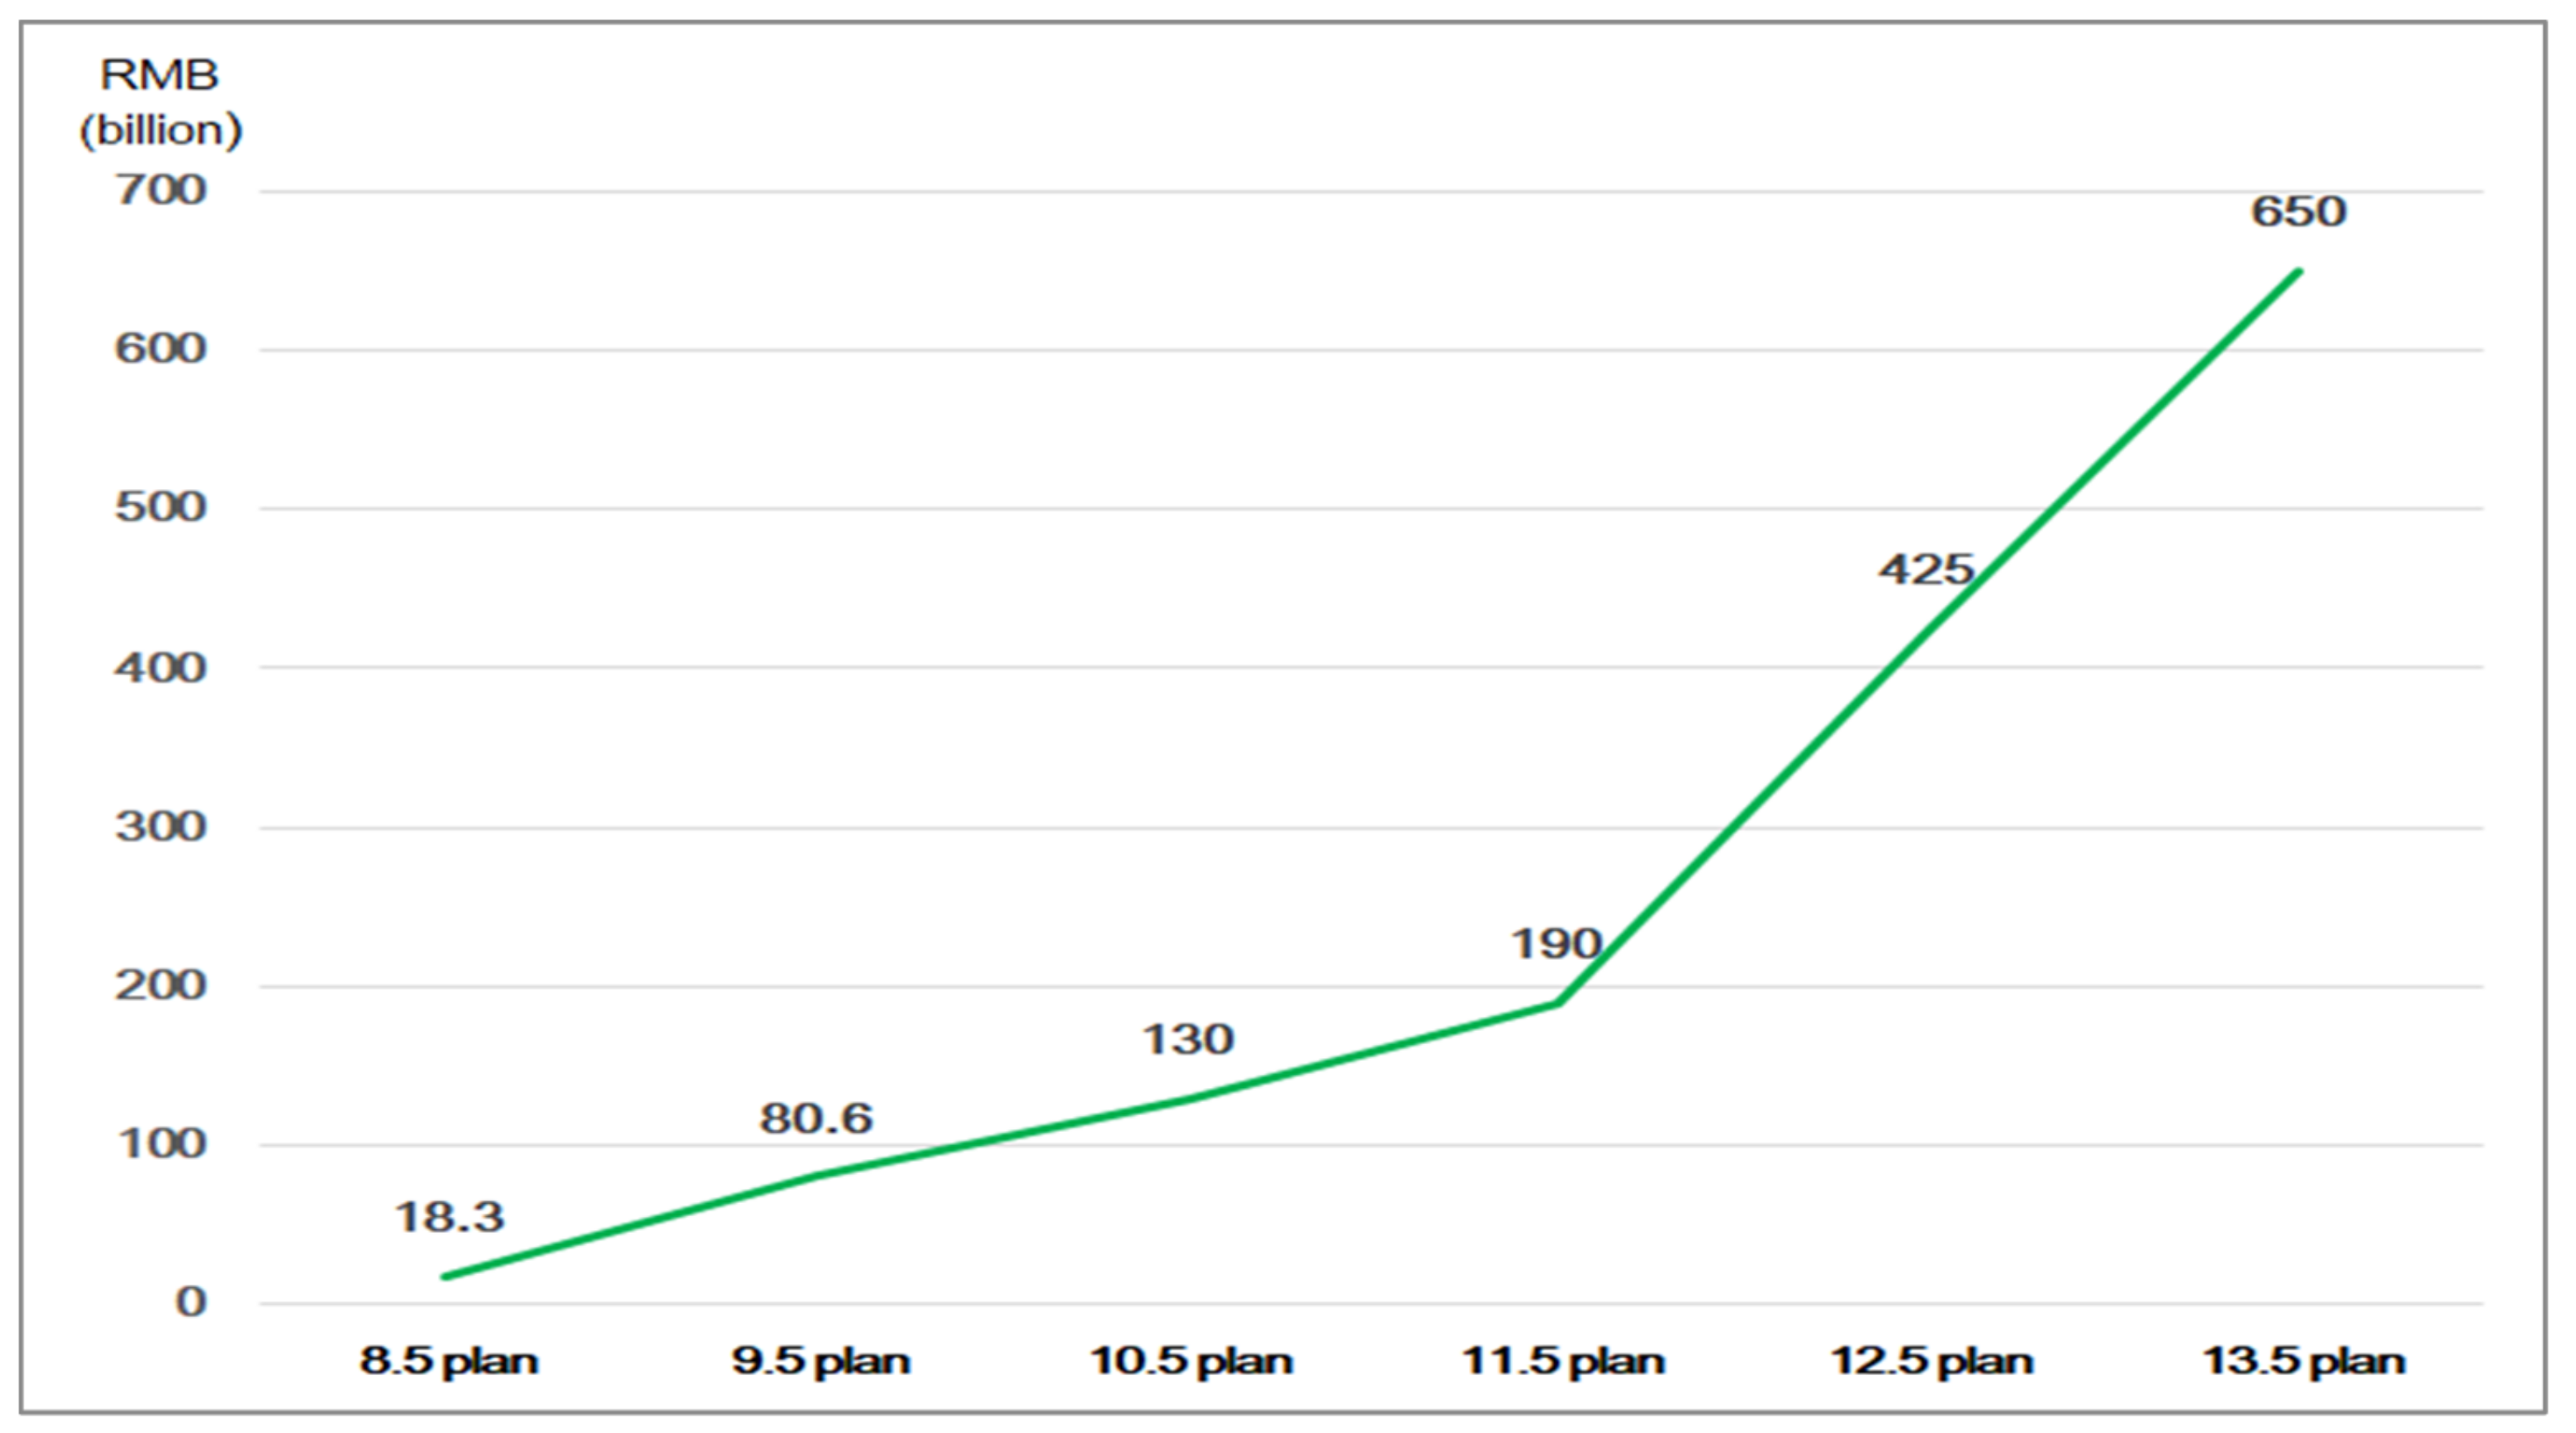
As shown in Figure 1, China has been greatly expanding its airports and related industries, with an average annual growth rate of over 10% in recent decades [3]. In the 11th Five-Year Plan (2006–2010), the focus was on hub-port upgrades in terms of facilities and advanced management skills, while the subsequent plan (2011–2015) promoted networking among the local airports. Since this period, the additional investment in airports and related industries has grown tremendously in volume, and, thus, there have been some unexpected over-supply issues with respect to the airport facilities. Some airports are working very well, but others would not be considered acceptable in terms of service quality and facility performance based on global standards.
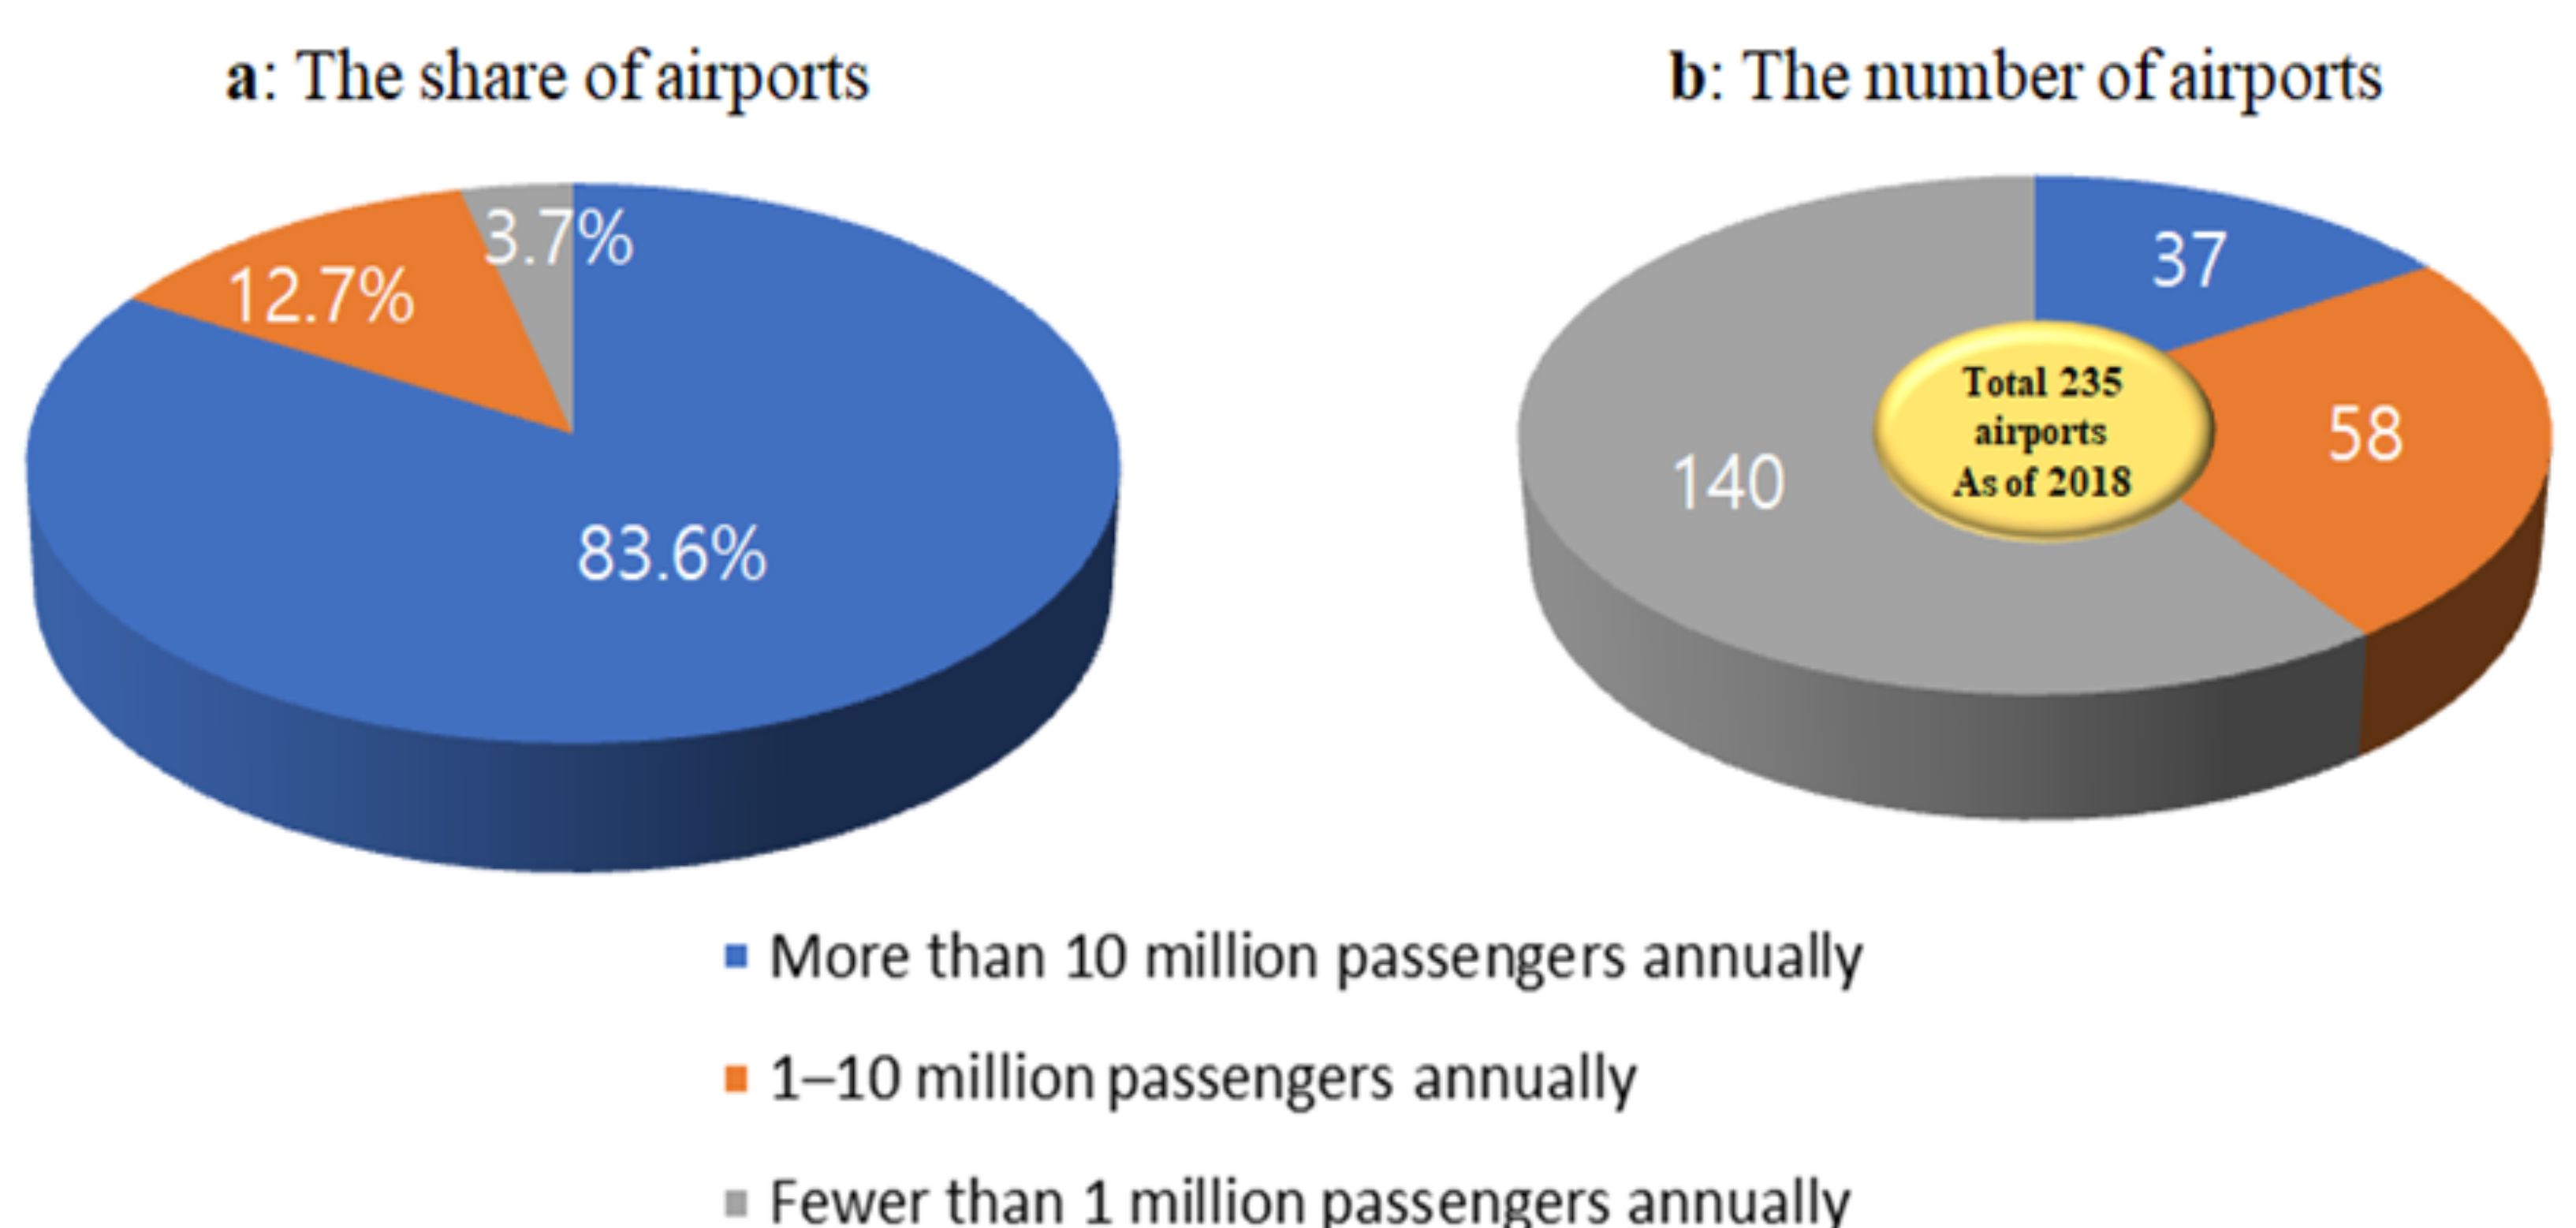
For the current Five-Year Plan (2016–2020), there will be a huge investment of 650 billion yuan in local airports, with a focus on major hub airports such as Kunming, Chengdu, Shenzhen, and Harbin. As shown in Figure 2, there are 235 airports in China. Among those, we chose 37 major airports with more than 10 million passengers per annum, which accounts for 83.6% of all passengers. Since these 37 airports handle most of the annual passengers in China, it could well represent the supporting policies of the Chinese government in the airport industry. Harbin Airport could be one of the examples as the northeast hub port. The Chinese government proclaimed the “International Hub Portal Promotion Strategy of Harbin 2018” to implement the second stage of the runway length expansion plan (T2) with 80 self-check-in counters and many other automatic facilities. Here, in Harbin Airport, however, the government should build the harmonized public–private partnership (PPP) with an airport operating company as a nudging partner, harmonizing partner, and responsible partner to promote these facilities sustainably performing well for the high-quality services [2].
The primary focus of the Chinese government is on the sustainable development of these 37 major airports, because most of these airports are the capitals of the 31 provinces of China. Thus, all local governments want to develop these major ports to promote the economic activities coming from these local hubs. Therefore, it is very important to evaluate the sustainable feasibility of the possible supporting policies on the local hubs, because the paradigm shift giving rise to the third-generation hubs is based not on political support, but on the logistics-value-creation capacity of the regional economy [4]. The paradigm of the first-generation regional hub is based on “geopolitical advantages”, such as Beijing Airport being the portal to the capital of China. The second-generation paradigm is based on the “transshipment efficiency” (or cost-effectiveness), due to the hub–spoke systematic cooperation in the region. The third-generation paradigm comes from the “value creation based on regional economic networking [5]”. Like Shanghai Pudong Airport, it should create logistics demand based on regional cooperation and, thus, provide multi-port functions such as serving as a financial hub, business hub, and technology hub. [6]. Thus, our study is based on the third-generation paradigm of value creation coming from hub port managerial services, such as a lower delay rate [4].
The direction of the political support on the effective networking of the aviation industry in China seems appropriate because these hub airports will promote the collaborative economic activities in the neighboring areas. Nonetheless, enhancing the operational quality of these hub airports will be of practical significance for the sustainable competitiveness of the Chinese domestic logistics and transportation industry. Therefore, the focus of our study shall be on the operational efficiency of the 37 airports, which have the potential to be mega-airports with over 10 million passengers per annum. However, some previous papers argued the larger airports show higher efficiency [7] but others do not agree with the political assumption by the Chinese government that the difference may come from the scale of the airports [8]. In other words, are these mega-airports efficient in their economic performance as well as their service-related qualitative performance for sustainable performance? If not, what actions should be taken by the Chinese government? In order to answer this research question, we consider the ”appropriateness” of the future investment plan by the Chinese government as well as the technical catch-up promotion strategy based on the empirical results on both economic performance and service quality. The former is related to the appropriateness of the scale of investment, while the latter deals with the feasibility of benchmarking and peer-learning. To address these economic as well as the qualitative service performance considerations, our methodological approach shall be based on multi-dimensional data envelopment analysis (hereafter DEA).
The unique contributions of this study can be summarized as follows. Regarding methodology, we used a slack-based DEA (SBM-DEA) model which shows stricter discriminative power in its accuracy than traditional DEA in terms of qualitative efficiency. It will help us figure out how to evaluate airports’ performance more precisely. With regard to data, we used the latest data for 2015–2019, which make it possible to draw useful implications for the rapidly growing air transportation industry. Most of all, they were useful to evaluate the feasibility of the 13th Five-Year Plan (2016–2020). Finally, as the most valuable element of airport service quality is based on the on-time departure rate, we used the delay rate as the undesirable output variable for service-oriented efficiency. Based on the slack estimation, our analysis provides the feasible, practical delay rate projection for each airport. The study concludes with the implications and suggestions for the Chinese government to promote or regulate airport investment as well as operational performance.
The rest of this paper is organized as follows. Section 2 examines the previous literature that has applied the DEA approach. Section 3 presents the methodological framework of SBM-DEA. Section 4 presents a description of the data and the empirical results for the 37 Chinese airports. Finally, Section 5 concludes with policy implications.
2. Literature Review and Theoretical Background
There are a wide variety of studies analyzing the efficiency of airports in terms of the variable selections, methodologies, and differences in time and global location. However, when multiple inputs and outputs are considered simultaneously, most of these studies utilize DEA. As shown in Table 1, due to the flexibility of the DEA model with respect to the inputs/outputs, this approach has been widely used to examine airport efficiency with diverse variables in different regions and countries. As DEA has the advantage of being able to examine multiple inputs and outputs, it is regarded as a useful methodology tool for examining multi-dimensional airport efficiency, as well. In addition, because DEA is a non-parametric approach, it does not require any prior information about the production characteristics, unlike a parametric approach under a specific function. However, the traditional DEA model could fail to account for slack because it takes a radial approach, resulting in overestimation and, thus, weak discriminative power. One of the purposes of this study is to find a precise comparison among the major Chinese airports. Therefore, our model will be based on the SBM-DEA model proposed by Tone [9], which takes a non-radial approach to overcome the limitations of the radial approach as mentioned above.
Gillen and Lall [10] used the DEA model for the first time to analyze the operational efficiency of 21 airports in the United States and then performed a second-stage regression analysis for the influencing factors of airport efficiency. Since then, the DEA model and its application for productivity analysis have been widely used to evaluate airport efficiency. Lin and Hong [11] compared the world’s 20 hub airports with non-hub airports to measure operational performance. They found that airport size and ownership structure do not have much to do with the efficiency of the airport, whereas the geographical location and the economic growth rate of the region in which the airport is located have a strong relationship with the airport’s operational performance. Lam, Low, and Tang [12] analyzed the efficiency of 11 major airports in the Asia-Pacific region for 2001–2005 and concluded that technical efficiency, scale efficiency, and mixing efficiency of most airports were generally high, while cost-efficiency was not. Liu [13] used network data envelopment analysis (NDEA) to evaluate the overall efficiency and operational efficiency of aviation service sub-processes of 10 East Asian airports from 2009 to 2013 and further adopted the panel data model to determine the key factors that affect the efficiency of each sub-process. Carlucci et al. [14] analyzed 34 Italian airports and found out airport size, presence of low-cost carriers, and cargo traffic have a significant influence on the technical and scale efficiency of Italian airports.
Specifically for research on Chinese airports, Fung et al. [15] measured the productivity changes from 1995 to 2004 for 25 regional airports in China. They concluded that productivity had grown consistently over 3% per year, and the Malmquist Productivity Index showed that this improvement came from technical investment rather than efficiency improvement efforts. Chi-Lok and Zhang [16] measured the efficiency of 25 Chinese airports over the 12 years from 1995 to 2006 using DEA and found that the government’s aviation reform policies with respect to the intensity of competition, airport localization, and stock market listings heavily influenced airport efficiency. He and Zhang [17] examined 30 Chinese airports’ efficiency based on DEA and concluded that airports in central and western China show lower technical efficiency compared to their counterparts in the eastern region, and major hub airports’ efficiency is higher than that of medium-sized and small airports.
Unfortunately, most previous studies evaluated the performance from a positive perspective only and, thus, neglect the oversupply issues of the airports. To evaluate these oversupply issues, our model shall include the delay rate as the undesirable output, and this inclusion could increase the uniqueness of the contributions in terms of implications and suggestions for the Chinese government.
3. Methodology and Empirical Tests
As explained above, SBM-DEA will be used in this study to construct the production frontier and examine the relative efficiency for each Chinese airport based on this frontier.
3.1. SBM-DEA
The traditional DEA model proposed by Charnes et al. [20] has some advantages. First, it derives the sole relative efficiency with multiple inputs and outputs, which makes it suitable for research in a complex industrial environment. Second, the DEA approach does not require the imposition of any pre-determined functional form on the underlying environmental technology; it provides an easier and more flexible means of estimation [21].
The DEA model is classified into two types of models: radial and non-radial. In a radial model, inputs and outputs are adjusted to the efficiency target by the same proportion, and, thus, this model may lack information regarding the idle (or neglected) efficiency of the inputs or outputs involved in the production process [22]. Meanwhile, the non-radial efficiency approach utilizes the neglected slack variables, leading to unbiased estimation. This also results in stronger discriminatory power for evaluation and a more suitable comparison for decision-making units (DMUs). As our focus is on the precise evaluation of airport performance in terms of delay rate, we could not use the normal SBM-DEA, as it cannot reflect an undesirable output. Therefore, following Choi et al. [23,24], we adopted the non-radial, undesirable SBM-DEA because it deals directly with input excesses and output shortfalls [9]. Our model shall capture the entire aspect of inefficiency, and, thus, provide a significant advantage in the precise evaluation of airport performance. This characteristic is expected to overcome the abovementioned limitations of radial models. In SBM-DEA, a specific DMU (airport) will be perfectly efficient with a value of unity if, and only if, it is on the frontier of the production possibility set with no input or output slacks. In this study, we named this efficiency as airport operational efficiency (AOE), and it can be obtained from Equation (1).
I = 1, 2,…, m index of inputs
slack variables (potential reduction of inputs)
m number of inputs
slack variables (potential expansion of outputs)
= 1, 2,… index of desirable outputs
= 1, 2,… index of undesirable outputs
slack variables (potential reduction of inputs)
slack variables (potential enhancement of desirable outputs)
slack variables (potential reduction of undesirable outputs)
a non-negative multiplier vector for production possibility set (PPS)
Equation (1) includes undesirable outputs in the SBM-DEA model; when , it implies all slack variables are 0 (, ), and the specific Chinese airport’s operation is perfectly efficient.
3.2. Efficiency Decomposition
Airport operational efficiency can be decomposed with pure technical operational efficiency and the enhanced efficiency coming from the additional investment over time. The former is related to the potential of the efficiency enhancement in terms of catching up to the best-operating companies on the production frontier (the benchmark DMU). The latter is related to the feasibility of the scale efficiency (SE). To decompose SE from AOE, we need to obtain the pure technical airport efficiency (PTAOE) under the variable returns to scale (VRS) condition. For this purpose, we applied Σλ = 1 in Equation (1). For this decomposition to enhance efficiency, we shall decompose AOE under the constant returns to scale (CRS) condition as follows.
Airport operational efficiency (AOE) = Pure technical airport operational efficiency * SE
An SE of 1 indicates that observations are operating at the most productive scale (Cooper, 2007) and exhibit CRS. If SE is lower than unity, there is some inefficiency given the current returns to scale. When a DMU shows scale inefficiency, over time, it may exhibit either increasing returns to scale (IRS) or decreasing returns to scale (DRS) to reach a higher level of efficiency. These three conditions are classified by the sum of weights vector (λ values) calculated using linear programming. If Σλ = 1, the DMU exhibits CRS, and both airport operational efficiency and pure airport technical operational efficiency are at unity. Therefore, when a specific airport shows CRS, this implies that it has appropriate input and output structures. When Σλ > 1, the DMU exhibits IRS, it means that the rate of increased output is higher than that of the input, implying that the increasing scale can enhance the DMU’s efficiency. When Σλ < 1, the DMU exhibits DRS, which implies a contrary situation to that of IRS.
4. Empirical Result and Its Implications
4.1. Descriptive Statistics on Data
To examine Chinese AOE, we collected data from 37 Chinese airports whose annual passenger volume is greater than 10 million for the period of 2016–2019. Based on the common variables shown in Table 1, we used terminal area and runway length as input variables, reflecting the basic infrastructure of an airport. As output variables, we set freight volume, the number of passengers, and aircraft movement as desirable outputs; all these variables can be found as common variables in Table 1 as well. (According to an anonymous comment of a reviewer, freight may not be a good proxy variable of output on operational efficiency under the consideration of another undesirable output of delay rate. However, in accordance with previous literature (Zou et al. [18], Fan et al. [25]), we found freights, passengers, and aircraft movement could be better to explain the bottleneck of delay rate, because local hub ports should be based on the demand-driven logistics support. Especially under the new regime of COVID19 nowadays, there are many cases when the number of passengers or aircraft movements are low, however, cargo movements are never stopped on the inter-dependent global economy, implying the freight should not be excluded to explain all the possible economic activities surrounding an airport. As Zhou et al. and Fan et al. suggested, aircraft movement and/or passengers from output variables could be harmonized with freight as outputs as well in this study.) We added the delay rate as an undesirable output variable to represent the qualitative service performance in terms of airport management. Even if the new investment in airport infrastructure is substantial, if there is not a corresponding effort for operations management of the new facilities, it may not suitable for these third-generation hub airports due to the lack of governance. Therefore, our selection of delay rate as an undesirable output should offer useful implications and suggestions for the sustainable development of these airports.
All data were retrieved from the Civil Aviation Administration of China (CAAS). The delay rate data were obtained using the average on-time departure ratio based on Variflight Report (https://data.variflight.com/). On-time departure and on-time departure ratio are defined as follows.
On-time departures by flight: actual departure time-planned departure time < 30 min
On-time departure ratio: on-time departures by flight/total departures by flight × 100%
Thus, delay rate was calculated from the equation: 1−On-time departure ratio. Since 37 airports were selected based on the year 2018, several airports show the number of passengers lower than 10 million, especially in 2016. Regardless of this annual fluctuation, we continue analyzing 37 airports. Table 2 shows the descriptive statistics for this study.
4.2. Airport Operational Efficiency and Rectified Efficiency
All AOE values for the four consecutive years of 2016 to 2019 were calculated using Equation (1). We used the MaxDEA software 6.2 (MaxDEA Co.: Beijing, China) for the calculation of the empirical tests. As shown in Table 3, the AOE values range from 0.125 to 1, and the average is approximately 0.482, with the remaining 51.8% as potential to be enhanced when each inefficient airport reaches the efficient frontier. From this result, we find the following implications. First, the AOE values are evenly distributed, implying that there are wide performance variations across Chinese airports. In general, the more economically developed metropolitan cities tend to show levels of higher efficiency, with the exception of Harbin.
With respect to the trend over time, there is a steadily increasing trend for the four years, from 0.411 in 2016 to 0.556 in 2019 on the average. This phenomenon occurs for all airports, and it implies that all Chinese airports are enhancing their efficiency due to the government’s supportive policies for all aviation-related industries. From Table 3, most of the mega-airports (e.g., Shanghai Pudong and Beijing Capital) show efficiency at unity, implying the top of the frontier, because mega-airports may have economies of scale everywhere, such as longer runways lengths and wider airport space, and all those may result in the more efficient airport operation. Conversely, relatively smaller airports (e.g., Kunming) remained at less than 50% of their potential, implying that much more effort is needed to enhance the efficiency in these airports. As explained in the introduction, some studies concluded the larger airports show higher efficiency [7] but others argued that the difference does not come from the scale of the airports [8]. For the correct answer for this conflict, we need to check the efficiency may come from the regional heterogeneity. To check this heterogeneity among the airports, we analyzed the regional differences of AOE.
4.3. Airport Operational Efficiency Based on Regional Heterogeneity
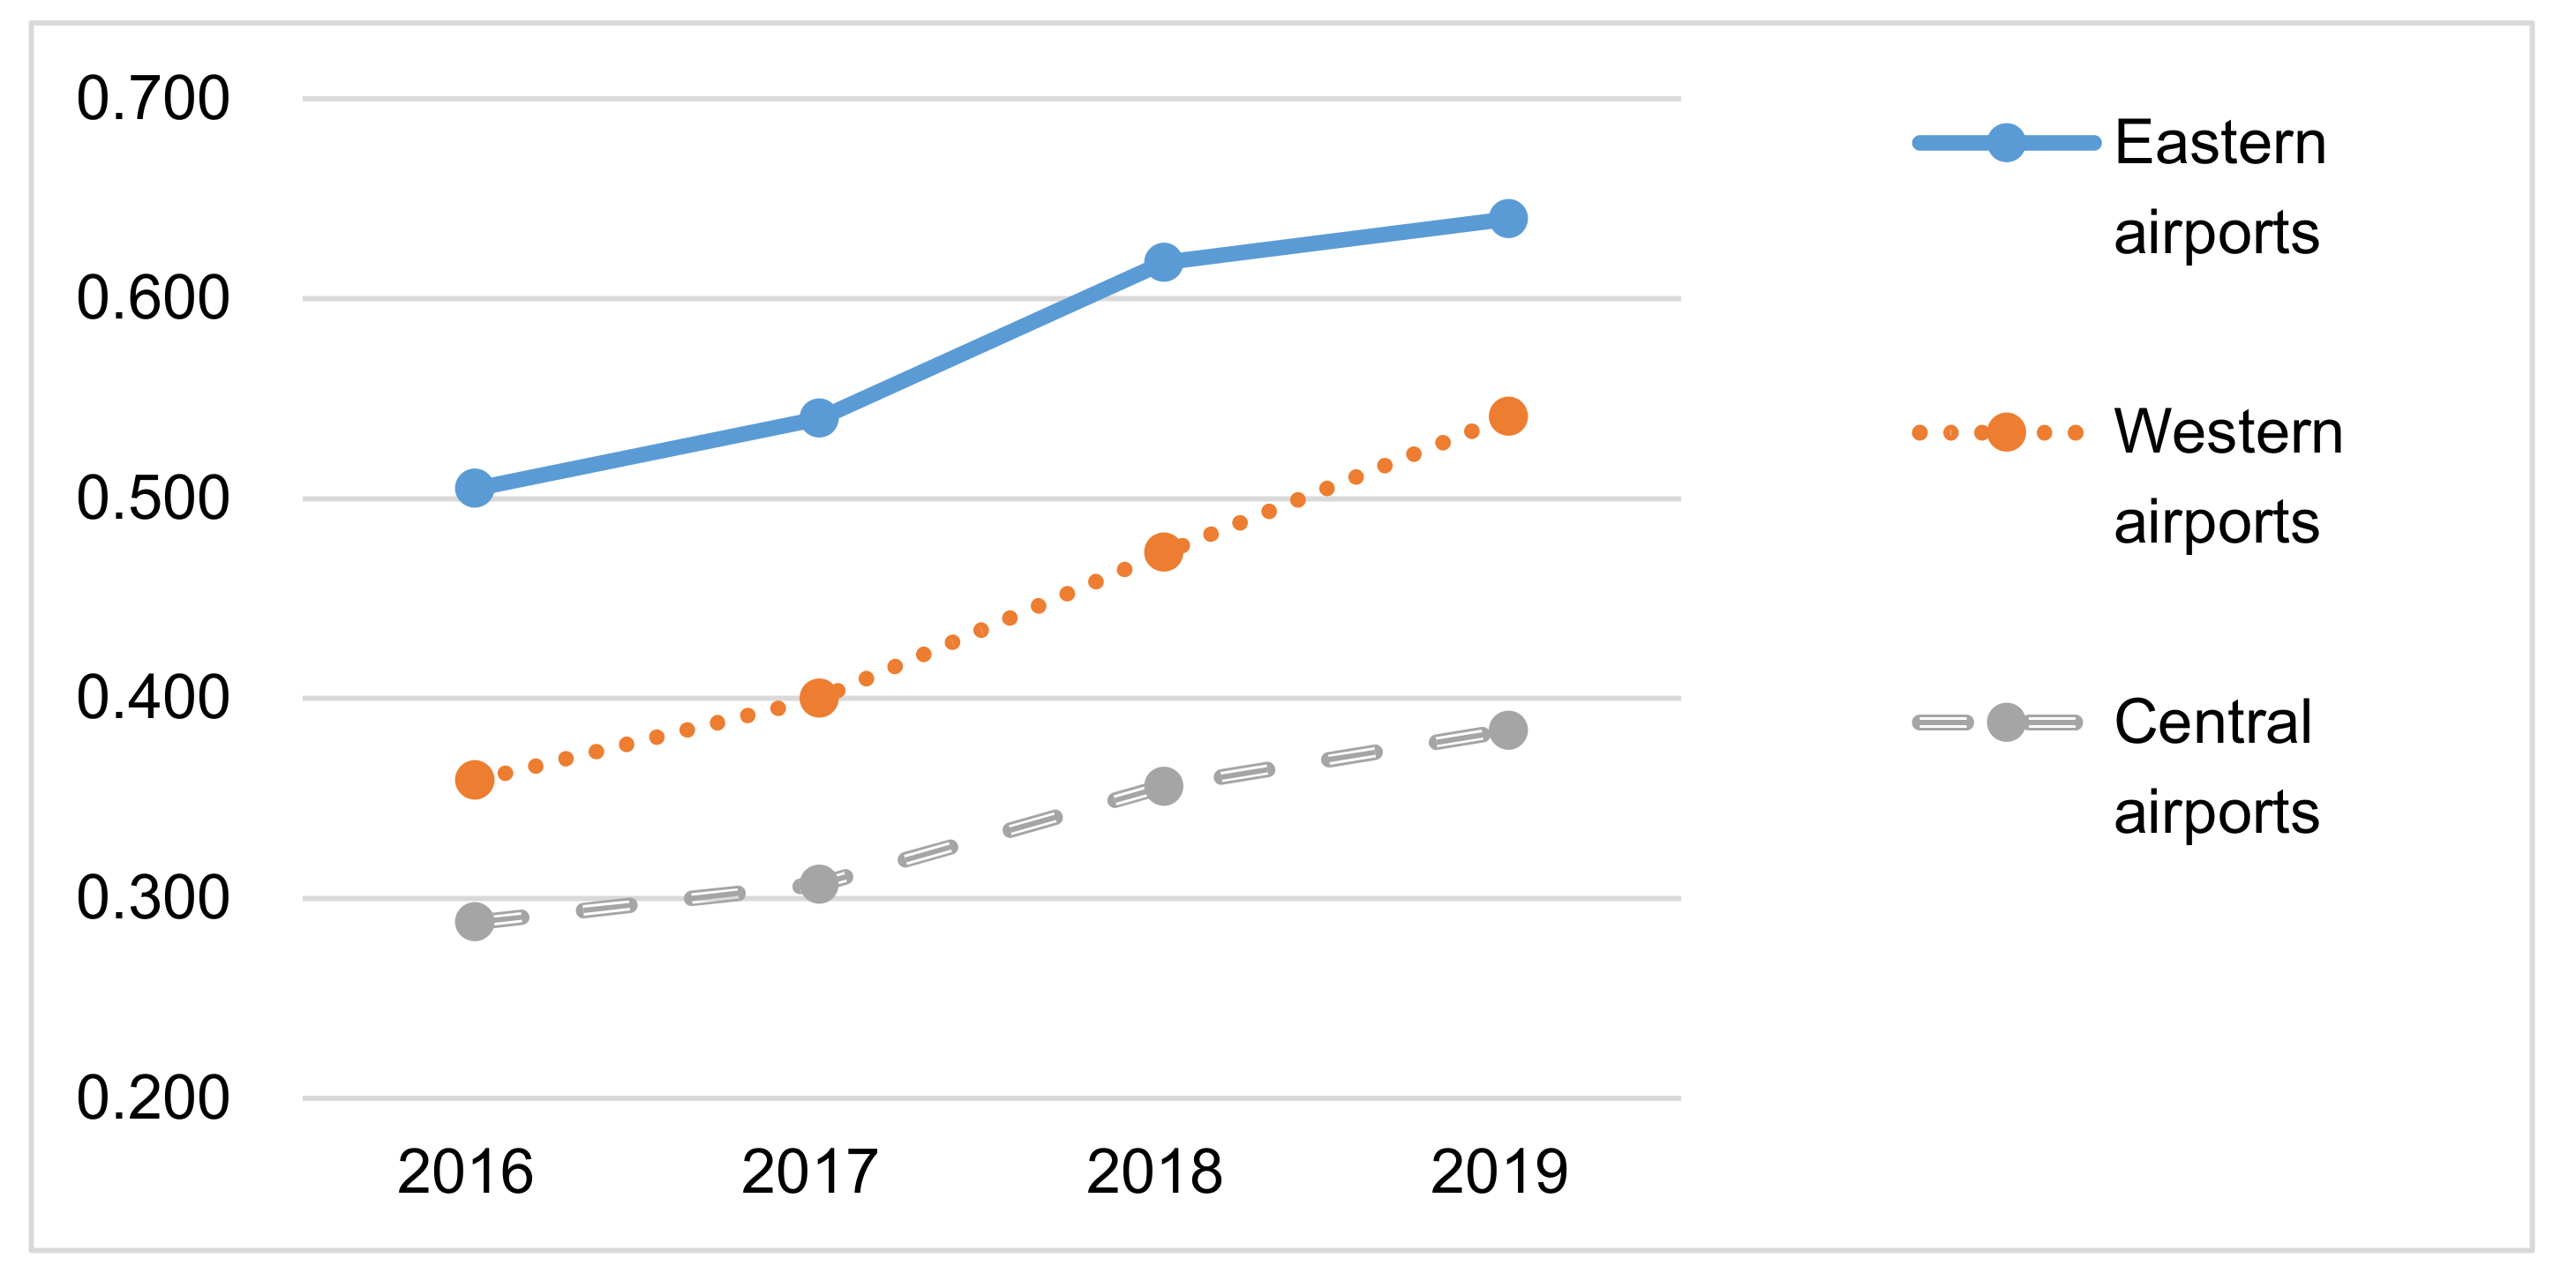
In this section, we examine the AOE differences coming from regional heterogeneity. Numerous studies exploring Chinese regional efficiency tend to classify the Chinese mainland into three regions: western, central, and eastern. In this paper, 37 Chinese airports are classified as follows. Here notation takes city name first, then its airport name. Western airports: Chengdu Shuangliu, Xi’an Xianyang, Kunming Changshui, Hohhot Baita, Urumchi Diwopu, Guiyang Longdongbao, Lanzhou Zhongchuan, Nanning Wuxu, Chongqing Jiangbei. Central airports: Harbin Taiping, Zhengzhou Xinzheng, Taiyuan Wusu, Changsha Huanghua, Nanchang Changbei, Hefei Xinqiao, Changchun Longjia, Wuhan Tianhe. Eastern airports: Shanghai Pudong, Beijing Capital, Qingdao Liuting, Shenzhen Bao’an, Xiamen Gaoqi, Guangzhou Baiyun, Ningbo Lishe, Hangzhou Xiaoshan, Dalian Zhoushuizi, Haikou Meilan, Shanghai Hongqiao, Sanya Phoenix, Shenyang Taoxian, Jinan Yaoqiang, Nanjing Lukou, Fuzhou Changle, Tianjin Binhai, Wenzhou Longwan, Zhuhai Jinwan, Shijiazhuang Zhengding. Based on this classification, we find significant AOE differences among regions through the Kruskal–Wallis test. According to the test result ( 24.360), all regions show an uptrend during the sample period, but they are significantly different. As shown in Table 4 and Figure 3, the eastern region has been always higher, but their trend is slowing. The western region shows a moderate, but rapidly increasing trend in AOE. The eastern region has a number of global hub cities, with relatively long histories of global transactions. Therefore, the value of freight and the number of passengers are overwhelming compared to other regions in China, thus, resulting in higher investment in infrastructure and facilities, driving higher efficiency. Even if these enlarged airport facilities were to enhance their AOE, this would not imply that this enhanced efficiency is enough, because the growth in efficiency is now steady, or even slow, compared with the western region due to the bottleneck or delay rate.
Although the efficiency value is lower than that of the eastern region, the western region shows the most rapidly increasing trend, because the airports in the western region have recently generated heavy financial support from the central government with the Belt and Road Initiative. Our findings support the argument of Cheng and Jing [26]. Based on the SBM-DEA model, Cheng and Jing examined 64 major airports in China and found that eastern airports are predisposed to achieve higher efficiency due to the geopolitical benefits associated with serving many travelers, while the western airports can enhance their AOE through the strong support from the Belt and Road Initiative. Unfortunately, airports in the central region do not have any specific impetus, such as commercial demand-driven investment or political support from the central government, resulting in the lowest AOE of all the regions, with an increasingly growing gap. However, there could be serious bottlenecks for the local activities in the central region, and, thus, the Chinese government should make more concerted efforts towards these airports as well.
Nevertheless, we cannot conclude that the effect of commercial drive or political support on airport efficiency is sustainable unless it shows no slag, which is an idle, neglected efficiency in the qualitative performance of the airport management. Easy access and spacious facilities are not enough to enhance managerial performance if there still a high rate of delay for departures. For example, Shanghai Pudong has shown perfect efficiency for the three years since 2017, but it showed over a 46% delay rate in 2017. Heavier financial investment may not result in the qualitative service performance represented by the delay rate. Therefore, it is better to check the delay rate as an undesirable output separately from others in its potential role to enhance AOE. The next section addresses these delay rate issues in more detail.
4.4. Airport Operational Efficiency with Projection for Delay Rate
As the delay rate influences airport service quality and efficiency, it should be reduced as much as possible. For the most recent four years, the delay rate ranged from 17.1% to 49.3% across airports, with an average value of 30.6%, as shown in Table 2. As this is very high according to global standards, the Chinese government set a target in the 13th Five-Year Plan to decrease the average delay rate to less than 20% by 2020, implying a reduction of more than 10 percentage points from the current 30.6%.
To see this delay rate projection in the evaluation of AOE, we calculated the potential abatement in the delay rate in terms of slack. The empirical result is shown in Table 5. In 2017, Shanghai Pudong showed a delay rate of 46.6%, and, thus, even if it shows an AOE of unity with no slack, it is too far from the desired service quality. The feasible way to decrease the delay rate should come from the elimination of the neglected slack variable in AOE, and, thus, Shanghai Pudong should eliminate at least 5.8% of the delay rate as a slack variable to reach the targeted delay rate of 30.9%. This delay rate projection shows with the elimination of 15.2% slacks, all airports can reduce their targeted delay rate by 15.4%, much tighter than the target set by the Chinese government. This implies that with the elimination of slack in the delay rate, the central government’s mission is actually feasible without any additional investment or managerial upgrade.
With respect to each airport target, interestingly, smaller airports show higher slack movement than larger airports. This implies that small airports show a higher delay rate, even though they manage lower freight and passenger volumes than major airports, purely due to a lack of managerial effort to minimize delays. For this reason, the central government should regulate or promote policies based on airports’ performance compared with their potential.
4.5. Decomposition of Efficiency and Benchmark Information
As we explained above, even with a lot of investment, Shanghai Pudong and other efficient airports may still need to enhance their quality of service management in terms of a decreased delay rate. For an airport to enhance its efficiency, it needs to consider two ways: additional investment for better facilities and peer-learning to catch-up with the benchmark airports on the frontier. To explore these two ways to enhance AOE, based on Equation (2), this section decomposes AOE into pure technical airport operational efficiency (PTAOE) and scale efficiency (SE). As shown in Table 6, PTAOE (0.627 on average) shows a higher value than AOE (0.482 in Table 3), because AOE is on the short-term production frontier and PTAOE is on the long-run frontier. Thus, AOE is always short of scale effects. Here, SE captures whether a DMU is benefiting from the scale effect or not. A higher SE means the specific airport is using the scale effect well.
Usually, PTAOE shares a similar pattern with AOE; however, if the gap between AOE and PTAOE is comparatively bigger, it causes a lower SE. For example, Nanning Airport shows a very low SE due to the abovementioned gap. Therefore, airports with lower SE values need to restructure their input scales to overcome inefficiencies caused by the scale effect.
To understand the implications of the scale effect, we calculate the sum of the weighted values, and, using this sum, each airport can decide whether it will increase or reduce its infrastructure. An airport’s returns to scale (RTS) status can be obtained from Equation (2) and the results are shown in Table 7. These results are limited to the year 2019 as the decision is related to future investment. Only eight Chinese airports, including Beijing and Guangzhou, show CRS conditions. Airports in this group currently reflect an ideal status without any further investment in scale, and they should maintain this status by placing more emphasis on the lessons from benchmark airports. It is noteworthy that the rest of the airports show IRS, and no airport shows DRS. This biased result indicates that almost all Chinese airports can enhance their AOE by expanding infrastructure. It also shows that China has the potential to materially improve its air transportation industry. Therefore, expanding the scale of airports or building new terminals could be options for the sustainable development of Chinese airports, except for the eight airports with CRS.
Once the scale status of each airport has been analyzed, to shrink the efficiency gap between AOE (SBM-CRS) and PTAOE (SBM-VRS), we need to find a way to increase AOE by restructuring the variables. Each DMU should approach its efficient frontier through peer learning from the benchmark DMUs on the frontier, given the current technology. This benchmark information could be provided based on the efficiency calculation of DMUs with similar input/output structures. Based on the result, each inefficient DMU should follow a certain target(s) as a benchmark, assigned by one or more efficient DMUs, called the “reference set”, and achieve an efficiency value of unity. Equation (4) explains how the input target is set.
Reference set’s input * λ value = inefficient DMU’s input target
The λ value can be defined as the level of influence of efficient DMUs on each inefficient DMU. All DMUs with values less than unity can obtain benchmark information using Equation (4). For example, Changsha Airport’s target value can be calculated from the total of Harbin (2019) and Shanghai Pudong (2018). In other words, 25.86% of Harbin’s variables’ value added to 31.29% of Shanghai Pudong variables’ value equals Changsha’s variables’ target. As shown in Table 7, every airport has different reference sets and λ values because they all have different patterns of the variables. Therefore, to reach the target value calculated by Equation (4), each airport should find executable ways that are suitable for their specific circumstances to enhance their AOE. As also shown in Table 7, nine Chinese airports, including Beijing and Shanghai Pudong, are reported as reference sets, implying that they can serve as role models for other airports with an efficiency value of unity.
5. Conclusions
The Chinese government has proactively promoted local airports to become regional hubs for global outsourcing and regional value chain management for the cooperative networking in the region. There are 37 mega-airports with more than 10 million passengers per annum in China to accomplish this mission. It may be too ambitious for all of these airports to become local or regional hubs during the 13th Five-Year Plan. However, due to strong financial support from the government, many airports have shown an uptrend in AOE, implying that their performance is sustainable not only in business performance in terms of passengers and cargo transportation but also in service quality represented by a decreased delay rate. In particular, this trend in AOE has developed from the commercial success of demand-driven airports in the eastern region and from the political support from the government under the Belt and Road Initiative in the western region. This implies that without the support of the market and/or government, these airports may not be sustainable. We clarified this new mission of qualitative improvement represented by the slack variable of the delay rate in Table 5. Therefore, for these airports to become local or regional hubs, we propose the following strategies.
First, “the more the merrier” is not necessarily true in some airports, such as Beijing and Guangzhou, because their capacity is already at the top of the curve under the CRS condition with the sum of weights vector (λ values) equal to one, and, therefore, no more investment is required in the infrastructure and facilities is required in for this group of airports in Table 7. Since these airports are in the CRS condition, more investment may result in over-supply issues, resulting in lower AOE; thus, these airports need only reshuffling of the internal use of resources to reduce the delay rate. For the reshuffling of the airports, it might be more related to other variables such as airport tax rate or tighter restrictions on delays. Most of the airports certainly showed IRS, implying that new investment in airport facilities and infrastructure is desirable to enhance the operational efficiency of airports. Therefore, all airports should consider their scale status prior to making new investments to avoid potential oversupply issues. Some small local airports showed very high delay rates, not because of a lack of additional investment, but due to the lack of qualitative service promotion efforts. Thus, similar to Beijing and the other seven airports under CRS conditions, most small airports should make qualitative service improvements in operational management to decrease the delay rate. Money is not the panacea to reach the top of the frontier for these airports.
Second, the Chinese airports should learn from other benchmark airports positioned on the production frontier. Most of the airports are too eager to expand their facilities, but improvements in service quality may not come from better facilities but from the advancement of sustainable management leadership and the organizational culture. Thus, there is great potential for inefficient airports to learn from benchmark airports and realize the catch-up effect. Our study proposes the ideal benchmarking airports for individual airports, implying that there is no one model to follow. Instead, the combinations of benchmarking airports are essential for most inefficient airports, as the peer-learning process should be customized based on similar input/output structures.
There is huge potential for greater operational efficiency for major airports in China. However, most infrastructure-oriented promotion will not be sustainable unless it matches with the qualitative management upgrades needed to avoid the undesirable outputs such as delay rates. Therefore, a customized solution for each individual airport should be provided to enhance AOE in terms of promoting information technology, optimizing operational procedures, improving equipment capabilities, and ensuring the quality of departure/arrival procedures. Through the customized supporting measures by the Chinese government, all the airport operating companies should establish a complete customer service system, enhance customer comfort and satisfaction, improve the convenience of passenger travel, and create an internationally competitive aviation enterprise and hub airport brand.
Author Contributions
The authors contributed to each part of the paper by conceptualization, Y.C.; methodology, H.L.; software, H.Y.; validation, Y.C.; formal analysis, H.L.; investigation, H.W.; resources and data curation, H.Y. writing—Original draft preparation, H.L.; writing—Review and editing, Y.C.; supervision, H.W.; project administration, Y.C.; funding acquisition H.W. All authors have read and agreed to the published version of the manuscript.
Funding
This work was supported by the National Research Foundation of Korea (Grant no. NRF-2019R1A2C1005326).
Conflicts of Interest
The authors declare no conflict of interest.
References
- Song, M.G.; Yeo, G.T. Analysis of the Air Transport Network Chacteristics of Major Airports. Asian J. Shipp. Logist. 2017, 33, 117–125. [Google Scholar] [CrossRef]
- Choi, Y. The Asian Values of Guānxì as an Economic Model for Transition toward Green Growth. Sustainability 2018, 10, 2150. [Google Scholar] [CrossRef] [Green Version]
- Zhang, Q.; Yang, H.; Wang, Q. Impact of high-speed rail on China’s Big Three airlines. Transp. Res. Part A Policy Pract. 2017, 98, 77–85. [Google Scholar] [CrossRef]
- Yu, Y.; Choi, Y.; Wei, X.; Chen, Z. Did China’s regional transport industry enjoy better carbon productivity under regulations? J. Clean. Prod. 2017, 165, 777–787. [Google Scholar] [CrossRef]
- Choi, Y.; Lee, H. International Transportation and Global Logistics; Chekyeon Publishing Co.: Seoul, Korea, 2018; pp. 34–35. [Google Scholar]
- Choi, Y. Challenges of Asian Models and Values for Sustainable Development. Sustainability 2019, 11, 1497. [Google Scholar] [CrossRef] [Green Version]
- Coto-Millán, P.; Casares-Hontañón, P.; Inglada, V.; Agüeros, M.; Pesquera, M.Á.; Badiola, A. Small is beautiful? The impact of economic crisis, low cost carriers, and size on efficiency in Spanish airports (2009–2011). J. Air Transp. Manag. 2014, 40, 34–41. [Google Scholar] [CrossRef]
- Bazargan, M.; Vasigh, B. Size versus efficiency: A case study of US commercial airports. J. Air Transp. Manag. 2003, 9, 187–193. [Google Scholar] [CrossRef]
- Tone, K. A slacks-based measure of efficiency in data envelopment analysis. Eur. J. Oper. Res. 2001, 130, 498–509. [Google Scholar] [CrossRef] [Green Version]
- Gillen, D.; Lall, A. Developing measures of airport productivity and performance: An application of data envelopment analysis. Transp. Res. Part E Logist. Transp. Rev. 1997, 33, 261–273. [Google Scholar] [CrossRef]
- Lin, L.; Hong, C. Operational performance evaluation of international major airports: An application of data envelopment analysis. J. Air Transp. Manag. 2006, 12, 342–351. [Google Scholar] [CrossRef]
- Lam, S.W.; Low, J.M.; Tang, L.C. Operational efficiencies across Asia Pacific airports. Transp. Res. Part E Logist. Transp. Rev. 2009, 45, 654–665. [Google Scholar] [CrossRef]
- Liu, D. Measuring aeronautical service efficiency and commercial service efficiency of East Asia airport companies: An application of Network Data Envelopment Analysis. J. Air Transp. Manag. 2016, 52, 11–22. [Google Scholar] [CrossRef]
- Carlucci, F.; Cirà, A.; Coccorese, P. Measuring and Explaining Airport Efficiency and Sustainability: Evidence from Italy. Sustainability 2018, 10, 400. [Google Scholar] [CrossRef] [Green Version]
- Fung, M.K.Y.; Wan, K.K.H.; Van Hui, Y.; Law, J.S. Productivity changes in Chinese airports 1995–2004. Transp. Res. Part E Logist. Transp. Rev. 2008, 44, 521–542. [Google Scholar] [CrossRef]
- Chi-Lok, A.Y.; Zhang, A. Effects of competition and policy changes on Chinese airport productivity: An empirical investigation. J. Air Transp. Manag. 2009, 15, 166–174. [Google Scholar] [CrossRef]
- Yan, H.E.; Zhang, Y. The Operating Performance of Chinese International Airports—DEA-based Evaluation and Optimization. Logist. Sci-Tech 2011, 5, 4–7. [Google Scholar]
- Zou, B.; Kafle, N.; Chang, Y.-T.; Park, K. US airport financial reform and its implications for airport efficiency: An exploratory investigation. J. Air Transp. Manag. 2015, 47, 66–78. [Google Scholar] [CrossRef]
- Hong, S.-J.; Jeon, M. The Technical Efficiency of French Regional Airports and Low-Cost Carrier Terminals. Sustainability 2019, 11, 5107. [Google Scholar] [CrossRef] [Green Version]
- Charnes, A.; Cooper, W.; Rhodes, E. Measuring the efficiency of decision making units. Eur. J. Oper. Res. 1978, 2, 429–444. [Google Scholar] [CrossRef]
- Zhang, N.; Wang, P. Toward green IT: Modeling sustainable production characteristics for Chinese electronic information industry, 1980–2012. Technol. Forecast. Soc. Chang. 2015, 96, 62–70. [Google Scholar] [CrossRef]
- Zhou, P.; Ang, B.; Wang, H. Energy and CO2 emission performance in electricity generation: A non-radial directional distance function approach. Eur. J. Oper. Res. 2012, 221, 625–635. [Google Scholar] [CrossRef]
- Choi, Y.; Yu, Y.; Lee, H. A Study on the Sustainable Performance of the Steel Industry in Korea Based on SBM-DEA. Sustainability 2018, 10, 173. [Google Scholar] [CrossRef] [Green Version]
- Choi, Y.; Yang, F.; Lee, H. On the Unbalanced Atmospheric Environmental Performance of Major Cities in China. Sustainability 2020, 12, 5391. [Google Scholar] [CrossRef]
- Fan, L.; Wu, F.; Zhou, P. Efficiency measurement of Chinese airports with flight delays by directional distance function. J. Air Transp. Manag. 2014, 34, 140–145. [Google Scholar] [CrossRef]
- Chen, Y.; Jing, C. Chinese medium and large airports operational efficiency study based on three-stage SBM-DEA with Undesirable output. Technol. Ind. 2020, 20, 101–107. [Google Scholar]
Figure 1.
Investment trends for the aviation industry from the Five-Year Plan.

Figure 2.
Market share of China’s airports. Source: Civil Aviation Administration of China (CAAC) webpage: accessed on the date of 20 July 2020 (http://www.caac.gov.cn/XXGK/XXGK/index_172.html?fl=11).
Figure 2.
Market share of China’s airports. Source: Civil Aviation Administration of China (CAAC) webpage: accessed on the date of 20 July 2020 (http://www.caac.gov.cn/XXGK/XXGK/index_172.html?fl=11).

Figure 3.
Regional AOE trends.


Table 1.
Research on airport efficiency based on data envelopment analysis (DEA).
| Authors | Analysis Target | Period | Input | Output | Model |
|---|---|---|---|---|---|
| Gillen and Lall [10] | 21 airports in the U.S. | 1989–1993 | (1) number of runways (2) number of gates (3) terminal area (4) number of employees (5) number of baggage collection belts (6) number of public parking spots | (1) number of passengers (2) pounds of cargo (3) air carrier movements (4) commuter movements | DEA |
| Lin and Hong [11] | world’s 20 hub airports | 2003 | (1) employees (2) check-in counters (3) number of runways (4) parking spaces (5) baggage collection belts (6) number of aprons (7) boarding gates (8) terminal area | (1) movements (2) passengers (3) cargo | DEA |
| Lam, Low, and Tang [12] | 11 major airports in Asia Pacific | 2001–2005 | (1) labor (2) capital (3) soft input (4) trade value | (1) aeronautic movements (2) passengers (3) tons of cargo | DEA |
| Liu [13] | 10 East Asian airports | 2009–2013 | (1) runway area (2) staff costs (3) other operating costs | (1) passengers and cargo (2) operating revenues | Network DEA |
| Carlucci, Cirà, and Coccorese [14] | 34 Italian airports | 2006–2016 | (1) labor costs (2) invested capital (3) other expenses | (1) passenger movement (2) cargo (3) aircraft movements (4) revenue | DEA |
| Fung, Wan, Van Hui, and Law [15] | 25 regional airports in China | 1995–2004 | (1) length of runway(s) (2) terminal size | (1) passenger throughput (2) cargo throughput (3) aircraft movement | DEA, Malmquist index |
| Chi-Lok and Zhang [16] | 25 Chinese airports | 1995–2006 | (1) runway length (2) terminal size | (1) passenger volume (2) cargo volume (3) aircraft movement | DEA, regression |
| He and Zhang [17] | 30 Chinese airports | 2008 | (1) terminal area (2) width of mooring | (1) passenger volume (2) freight volume (3) aircraft movement | DEA |
| Zou, B. et al. [18] | 42 primary US airports | 2009–2012 | (1) labor cost (2) materials cost (3)capital cost | (1) passenger enplanements (2) cargo (3) aircraft operations (4) non-aeronautical revenue (5) delay | Two-staged DEA |
| Seock-Jin Hong and Minjun Jeon [19] | 99 French airports | 2006–2012 | (1) employees (2) labor costs (3) debt (4) subsidization (5) operational costs | (1) passenger (2) cargo (3) aircraft movements (4) revenue (5) net profit | DEA Malmquist |
Table 2.
Descriptive statistics.
| Variable | Type | Unit | Mean | Max | Min | Std. Dev. |
|---|---|---|---|---|---|---|
| Terminal Area | Input | 10,000 | 33.1 | 140.4 | 5.5 | 31.9 |
| Length of Runway | Input | m | 5532.4 | 15,000 | 3200 | 2838.3 |
| Freight | output | ton | 418,075.4 | 3,824,279.9 | 31,511.6 | 700,118.3 |
| Passengers | output | person | 27,127,735.7 | 100,983,290 | 6,130,384 | 19,845,769.8 |
| Aircraft movement | output | EA | 95,126.7 | 295,135 | 24,754 | 60,693.6 |
| Delay | output | % | 30.6 | 49.3 | 17.1 | 7.7 |
Sources: Civil Aviation Administration of China (CAAS), Yearly Statistics Report, accessed on 30 July 2020 (http://www.caac.gov.cn/XXGK/XXGK/index_172.html?fl=11), English version (http://www.caac.gov.cn/en/SY/). Varyflight Report accessed on 30 July 2020 (https://data.variflight.com/reports).
Table 3.
Airport operational efficiencies (AOEs) of 37 Chinese airports.
| Decision-Making Unit (DMU) | 2016 | 2017 | 2018 | 2019 | Average |
|---|---|---|---|---|---|
| Shanghai Pudong | 0.823 | 1.000 | 1.000 | 1.000 | 0.956 |
| Beijing Capital | 0.904 | 0.876 | 1.000 | 1.000 | 0.945 |
| Qingdao Liuting | 0.861 | 0.886 | 1.000 | 1.000 | 0.937 |
| Harbin Taiping | 0.837 | 0.844 | 1.000 | 1.000 | 0.920 |
| Shenzhen Bao’an | 0.771 | 0.827 | 0.939 | 1.000 | 0.884 |
| Xiamen Gaoqi | 0.710 | 0.743 | 1.000 | 0.893 | 0.837 |
| Chengdu Shuangliu | 0.638 | 0.682 | 0.807 | 1.000 | 0.782 |
| Guangzhou Baiyun | 0.555 | 0.605 | 0.690 | 1.000 | 0.713 |
| Xi’an Xianyang | 0.446 | 0.529 | 0.818 | 1.000 | 0.698 |
| Ningbo Lishe | 0.521 | 0.593 | 0.685 | 0.694 | 0.623 |
| Hangzhou Xiaoshan | 0.504 | 0.582 | 0.653 | 0.676 | 0.604 |
| Dalian Zhoushuizi | 0.477 | 0.556 | 0.594 | 0.651 | 0.570 |
| Haikou Meilan | 0.447 | 0.536 | 0.634 | 0.648 | 0.566 |
| Shanghai Hongqiao | 0.501 | 0.504 | 0.561 | 0.599 | 0.541 |
| Kunming Changshui | 0.408 | 0.449 | 0.486 | 0.495 | 0.460 |
| Sanya Phoenix | 0.398 | 0.440 | 0.485 | 0.503 | 0.457 |
| Hohhot Baita | 0.314 | 0.385 | 0.450 | 0.510 | 0.415 |
| Shenyang Taoxian | 0.356 | 0.388 | 0.430 | 0.483 | 0.414 |
| Jinan Yaoqiang | 0.339 | 0.363 | 0.450 | 0.498 | 0.413 |
| Urumchi Diwopu | 0.308 | 0.371 | 0.426 | 0.484 | 0.397 |
| Guiyang Longdongbao | 0.308 | 0.371 | 0.426 | 0.484 | 0.397 |
| Zhengzhou Xinzheng | 0.327 | 0.362 | 0.389 | 0.399 | 0.369 |
| Nanjing Lukou | 0.326 | 0.363 | 0.374 | 0.388 | 0.363 |
| Lanzhou Zhongchuan | 0.269 | 0.299 | 0.319 | 0.377 | 0.316 |
| Taiyuan Wusu | 0.255 | 0.291 | 0.335 | 0.349 | 0.308 |
| Changsha Huanghua | 0.251 | 0.272 | 0.307 | 0.344 | 0.294 |
| Nanning Wuxu | 0.264 | 0.288 | 0.314 | 0.325 | 0.298 |
| Chongqing Jiangbei | 0.272 | 0.277 | 0.296 | 0.319 | 0.291 |
| Fuzhou Changle | 0.271 | 0.279 | 0.305 | 0.303 | 0.290 |
| Tianjin Binhai | 0.262 | 0.304 | 0.311 | 0.279 | 0.289 |
| Nanchang Changbei | 0.180 | 0.200 | 0.304 | 0.391 | 0.269 |
| Wenzhou Longwan | 0.241 | 0.245 | 0.270 | 0.278 | 0.259 |
| Hefei Xinqiao | 0.206 | 0.233 | 0.262 | 0.317 | 0.255 |
| Changchun Longjia | 0.220 | 0.237 | 0.234 | 0.250 | 0.235 |
| Wuhan Tianhe | 0.189 | 0.199 | 0.229 | 0.251 | 0.217 |
| Zhuhai Jinwan | 0.135 | 0.164 | 0.212 | 0.233 | 0.186 |
| Shijiazhuang Zhengding | 0.126 | 0.125 | 0.142 | 0.159 | 0.138 |
| Average | 0.411 | 0.450 | 0.517 | 0.556 | 0.482 |
Table 4.
The Kruskal–Wallis Test.
| Region | Obs | 2016 | 2017 | 2018 | 2019 | Average |
|---|---|---|---|---|---|---|
| Western | 9 | 0.359 | 0.401 | 0.473 | 0.541 | 0.443 |
| Central | 8 | 0.288 | 0.307 | 0.356 | 0.384 | 0.334 |
| Eastern | 20 | 0.505 | 0.540 | 0.618 | 0.640 | 0.571 |
| Test | Hypothesis | p-value | ||||
| Kruskal–Wallis | Western=Central=Eastern | 24.360 | 0.000 | |||
Table 5.
Delay projections and slack for 37 Chinese airports.
| DMU | 2016 | 2017 | 2018 | 2019 | Average | |||||
|---|---|---|---|---|---|---|---|---|---|---|
| Target | Slack | Target | Slack | Target | Slack | Target | Slack | Target | Slack | |
| Shanghai Pudong | 24.3 | −23.3 | 46.6 | 0 | 27.3 | 0 | 25.5 | 0 | 30.9 | −5.8 |
| Beijing Capital | 30.9 | −8.4 | 31.5 | −15.7 | 30.2 | 0 | 29.2 | 0 | 30.5 | −6.0 |
| Qingdao Liuting | 25.2 | 0.0 | 29.2 | −5.2 | 28.9 | 0.0 | 31.3 | 0.0 | 28.7 | −1.3 |
| Harbin Taiping | 20.4 | 0.0 | 26.7 | −6.3 | 27 | 0 | 29.9 | 0 | 26.0 | −1.6 |
| Shenzhen Bao’an | 20.5 | −14.4 | 22.9 | −13 | 24.7 | −1.2 | 26.3 | 0 | 23.6 | −7.2 |
| Xiamen Gaoqi | 26.5 | −14.4 | 27 | −22.3 | 35.4 | 0 | 28.7 | −13.7 | 29.4 | −12.6 |
| Chengdu Shuangliu | 20.5 | −4 | 23.6 | −7.7 | 22.8 | 0 | 21.9 | 0 | 22.2 | −2.9 |
| Guangzhou Baiyun | 30.1 | −5.9 | 32.1 | −4.6 | 26.9 | 0 | 21.5 | 0 | 27.7 | −2.6 |
| Xi’an Xianyang | 17.7 | 0 | 26.2 | 0 | 17.7 | 0 | 18.7 | 0 | 20.1 | 0.0 |
| Ningbo Lishe | 11.8 | −20.1 | 13.6 | −31.7 | 16.4 | −16.5 | 17.5 | −29.6 | 14.8 | −24.5 |
| Hangzhou Xiaoshan | 18.1 | −20.8 | 25.1 | −21.2 | 17.1 | −15 | 17.8 | −21.8 | 19.5 | −19.7 |
| Dalian Zhoushuizi | 11.8 | −9.7 | 16.6 | −9.4 | 17 | −3.9 | 19.5 | −5.1 | 16.2 | −7.0 |
| Haikou Meilan | 11.6 | −11.2 | 17.2 | −15 | 21.2 | −3.9 | 21.4 | −4.4 | 17.9 | −8.6 |
| Shanghai Hongqiao | 16.9 | −25.9 | 18.1 | −23.5 | 19.6 | −1.2 | 21.4 | −0.4 | 19.0 | −12.8 |
| Kunming Changshui | 19.6 | −5.1 | 22.1 | −10.8 | 23.2 | −1.2 | 21 | 0 | 21.5 | −4.3 |
| Sanya Phoenix | 14.9 | −12.3 | 19.1 | −16.2 | 20.7 | −7.5 | 21 | −7.8 | 18.9 | −11.0 |
| Hohhot Baita | 13.2 | −8.1 | 17.5 | −14.7 | 19.9 | −4.9 | 21.9 | −15.9 | 18.1 | −10.9 |
| Shenyang Taoxian | 6.6 | −18.1 | 7.9 | −28.4 | 8.9 | −23.4 | 9.7 | −24.6 | 8.3 | −23.6 |
| Jinan Yaoqiang | 7.2 | −14.3 | 11.6 | −17.2 | 14.9 | −5.1 | 15.8 | −11.6 | 12.4 | −12.1 |
| Urumchi Diwopu | 11.6 | −15.9 | 13.2 | −11.4 | 15 | −2.2 | 16.2 | −8.8 | 14.0 | −9.6 |
| Guiyang Longdongbao | 8 | −18.1 | 10.1 | −22.1 | 11.1 | −16.3 | 12.7 | −16.3 | 10.5 | −18.2 |
| Zhengzhou Xinzheng | 8.9 | −16.7 | 10.6 | −20.4 | 11.4 | −14.5 | 11.7 | −15.7 | 10.7 | −16.8 |
| Nanjing Lukou | 10.2 | −33.3 | 11.3 | −33.3 | 12 | −22.2 | 12.7 | −28.7 | 11.6 | −29.4 |
| Lanzhou Zhongchuan | 9.2 | −9.9 | 12.8 | −14.6 | 14.6 | −8.1 | 17.3 | −10.6 | 13.5 | −10.8 |
| Taiyuan Wusu | 8.4 | −9.7 | 13.7 | −17.7 | 15.7 | −8.8 | 15.8 | −15.6 | 13.4 | −13.0 |
| Changsha Huanghua | 9.1 | −20 | 11.5 | −21 | 13.6 | −11.1 | 16.3 | −12.3 | 12.6 | −16.1 |
| Nanning Wuxu | 5.1 | −22.7 | 6 | −34.7 | 6.4 | −24.3 | 6.6 | −25.3 | 6.0 | −26.8 |
| Chongqing Jiangbei | 15 | −6.2 | 15.6 | −10.1 | 16.3 | −3.7 | 17.2 | −2.8 | 16.0 | -5.7 |
| Fuzhou Changle | 5.3 | −23.2 | 5.4 | −35.2 | 6.0 | −24.3 | 6.1 | −34.0 | 5.7 | −29.2 |
| Tianjin Binhai | 7.8 | −20.9 | 9.2 | −27.7 | 9.7 | −18.2 | 9.1 | −26.6 | 9.0 | −23.4 |
| Nanchang Changbei | 3.6 | −18.3 | 4.9 | −28.1 | 7.9 | −18.8 | 7.8 | −23.3 | 6.1 | −22.1 |
| Wenzhou Longwan | 3.7 | −22.4 | 4.0 | −40.1 | 4.7 | −30.2 | 5.0 | −38.8 | 4.4 | −32.9 |
| Hefei Xinqiao | 3.5 | −22.4 | 4.1 | −35.5 | 4.8 | −29.7 | 6.5 | −35.0 | 4.7 | −30.7 |
| Changchun Longjia | 4.0 | −17.9 | 4.7 | −32.5 | 5.0 | −26.7 | 5.4 | −28.8 | 4.8 | −26.5 |
| Wuhan Tianhe | 9.5 | −17.1 | 10 | −22.1 | 10.2 | −13.1 | 11 | −15 | 10.2 | −16.8 |
| Zhuhai Jinwan | 5.8 | −36.9 | 4.1 | −42.1 | 7.2 | −19.7 | 8.3 | −24.4 | 6.4 | −30.8 |
| Shijiazhuang Zhengding | 3.7 | −20.9 | 7.6 | −35.6 | 4.9 | −25.5 | 4.9 | −32.6 | 5.3 | −28.7 |
| Average | 13.0 | −15.4 | 16.0 | −20.2 | 16.1 | −10.8 | 16.5 | −14.3 | 15.4 | −15.2 |
Table 6.
Pure technical airport efficiency and scale efficiency.
| DMU | 2016 | 2017 | 2018 | 2019 | Average | |||||
|---|---|---|---|---|---|---|---|---|---|---|
| PTAOE | SE | PTAOE | SE | PTAOE | SE | PTAOE | SE | PTAOE | SE | |
| Shanghai Pudong | 0.906 | 0.998 | 0.881 | 0.994 | 1.000 | 1.000 | 1.000 | 1.000 | 0.947 | 0.998 |
| Beijing Capital | 0.678 | 0.941 | 0.695 | 0.981 | 0.870 | 0.928 | 1.000 | 1.000 | 0.811 | 0.963 |
| Qingdao Liuting | 0.561 | 0.989 | 0.617 | 0.980 | 0.690 | 0.999 | 1.000 | 1.000 | 0.717 | 0.992 |
| Harbin Taiping | 1.000 | 0.837 | 0.909 | 0.929 | 1.000 | 1.000 | 1.000 | 1.000 | 0.977 | 0.942 |
| Shenzhen Bao’an | 1.000 | 0.861 | 0.912 | 0.972 | 1.000 | 1.000 | 1.000 | 1.000 | 0.978 | 0.958 |
| Xiamen Gaoqi | 0.829 | 0.992 | 1.000 | 1.000 | 1.000 | 1.000 | 1.000 | 1.000 | 0.957 | 0.998 |
| Chengdu Shuangliu | 0.785 | 0.982 | 0.837 | 0.988 | 0.951 | 0.987 | 1.000 | 1.000 | 0.893 | 0.989 |
| Guangzhou Baiyun | 0.858 | 0.520 | 0.535 | 0.989 | 1.000 | 0.818 | 1.000 | 1.000 | 0.848 | 0.832 |
| Xi’an Xianyang | 0.874 | 0.812 | 0.891 | 0.833 | 1.000 | 1.000 | 1.000 | 0.893 | 0.941 | 0.885 |
| Ningbo Lishe | 1.000 | 0.521 | 1.000 | 0.593 | 1.000 | 0.685 | 1.000 | 0.694 | 1.000 | 0.623 |
| Hangzhou Xiaoshan | 0.729 | 0.654 | 0.746 | 0.746 | 1.000 | 0.594 | 0.901 | 0.722 | 0.844 | 0.679 |
| Dalian Zhoushuizi | 0.533 | 0.946 | 0.592 | 0.984 | 0.668 | 0.978 | 0.681 | 0.993 | 0.619 | 0.975 |
| Haikou Meilan | 0.659 | 0.677 | 0.660 | 0.812 | 1.000 | 0.634 | 0.848 | 0.764 | 0.792 | 0.722 |
| Shanghai Hongqiao | 0.517 | 0.968 | 0.521 | 0.968 | 0.701 | 0.800 | 0.715 | 0.837 | 0.614 | 0.893 |
| Kunming Changshui | 0.436 | 0.936 | 0.458 | 0.981 | 0.512 | 0.949 | 0.560 | 0.884 | 0.492 | 0.938 |
| Sanya Phoenix | 0.558 | 0.551 | 0.600 | 0.618 | 0.907 | 0.469 | 1.000 | 0.484 | 0.766 | 0.531 |
| Hohhot Baita | 0.541 | 0.627 | 0.529 | 0.686 | 0.764 | 0.589 | 0.656 | 0.759 | 0.623 | 0.665 |
| Shenyang Taoxian | 1.000 | 0.314 | 0.516 | 0.747 | 1.000 | 0.450 | 0.615 | 0.829 | 0.783 | 0.585 |
| Jinan Yaoqiang | 0.604 | 0.660 | 0.600 | 0.732 | 0.649 | 0.747 | 0.660 | 0.763 | 0.628 | 0.726 |
| Urumchi Diwopu | 1.000 | 0.356 | 0.702 | 0.553 | 0.818 | 0.526 | 1.000 | 0.483 | 0.880 | 0.480 |
| Guiyang Longdongbao | 0.386 | 0.846 | 0.400 | 0.904 | 0.451 | 0.862 | 0.457 | 0.874 | 0.424 | 0.872 |
| Zhengzhou Xinzheng | 0.360 | 0.499 | 0.378 | 0.527 | 0.521 | 0.585 | 0.572 | 0.683 | 0.458 | 0.574 |
| Nanjing Lukou | 0.363 | 0.897 | 0.399 | 0.909 | 0.424 | 0.882 | 0.430 | 0.903 | 0.404 | 0.898 |
| Lanzhou Zhongchuan | 0.617 | 0.436 | 0.428 | 0.698 | 0.463 | 0.690 | 0.493 | 0.766 | 0.500 | 0.648 |
| Taiyuan Wusu | 0.371 | 0.836 | 0.381 | 0.837 | 1.000 | 0.342 | 0.413 | 0.865 | 0.541 | 0.720 |
| Changsha Huanghua | 0.306 | 0.819 | 0.324 | 0.841 | 0.363 | 0.846 | 0.392 | 0.878 | 0.346 | 0.846 |
| Nanning Wuxu | 1.000 | 0.255 | 0.426 | 0.682 | 0.491 | 0.681 | 0.484 | 0.721 | 0.600 | 0.585 |
| Chongqing Jiangbei | 0.472 | 0.559 | 0.490 | 0.587 | 0.540 | 0.582 | 0.549 | 0.592 | 0.513 | 0.580 |
| Fuzhou Changle | 0.363 | 0.568 | 0.388 | 0.600 | 0.443 | 0.591 | 0.489 | 0.647 | 0.421 | 0.602 |
| Tianjin Binhai | 0.335 | 0.812 | 0.307 | 0.902 | 0.407 | 0.728 | 0.430 | 0.742 | 0.370 | 0.796 |
| Nanchang Changbei | 0.417 | 0.650 | 0.409 | 0.682 | 0.462 | 0.659 | 0.448 | 0.677 | 0.434 | 0.667 |
| Wenzhou Longwan | 0.322 | 0.813 | 0.361 | 0.842 | 0.375 | 0.829 | 0.337 | 0.828 | 0.349 | 0.828 |
| Hefei Xinqiao | 0.425 | 0.567 | 0.413 | 0.592 | 0.474 | 0.569 | 0.483 | 0.576 | 0.449 | 0.576 |
| Changchun Longjia | 0.235 | 0.805 | 0.243 | 0.819 | 0.285 | 0.803 | 0.306 | 0.819 | 0.267 | 0.812 |
| Wuhan Tianhe | 0.445 | 0.495 | 0.428 | 0.554 | 0.453 | 0.517 | 0.473 | 0.529 | 0.450 | 0.524 |
| Zhuhai Jinwan | 0.219 | 0.618 | 0.265 | 0.619 | 0.341 | 0.621 | 0.353 | 0.660 | 0.295 | 0.630 |
| Shijiazhuang Zhengding | 0.265 | 0.475 | 0.252 | 0.498 | 0.292 | 0.485 | 0.309 | 0.514 | 0.280 | 0.493 |
| Average | 0.594 | 0.705 | 0.554 | 0.789 | 0.684 | 0.741 | 0.677 | 0.794 | 0.627 | 0.757 |
Table 7.
Returns to scale (RTS) and benchmark information for each airport (2019).
| Airport | RTS | Airport | RTS | ||
|---|---|---|---|---|---|
| Beijing Capital | CRS | Beijing Capital19(1.000000) | Nanning Wuxu | IRS | Shanghai Pudong18(0.187176); Shenzhen Bao’an19(0.054494) |
| Changchun Longjia | IRS | Shanghai Pudong18(0.195755) | Ningbo Lishe | IRS | Harbin Taiping19(0.580003); Shanghai Pudong18(0.007460) |
| Changsha Huanghua | IRS | Harbin Taiping19(0.258628); Shanghai Pudong18(0.312977) | Qingdao Liuting | CRS | Qingdao Liuting 19(1.000000) |
| Chengdu Shuangliu | CRS | Chengdu Shuangliu19(1.000000) | Sanya Phoenix | IRS | Harbin Taiping19(0.518708); Qingdao Liuting19(0.091059); Shanghai Pudong18(0.095369) |
| Dalian Zhoushuizi | IRS | Qingdao Liuting19(0.506938); Shanghai Pudong18(0.077388); Shenzhen Bao’an19(0.057721) | Shanghai Hongqiao | IRS | Shanghai Pudong19(0.106039); Shenzhen Bao’an19(0.709640) |
| Fuzhou Changle | IRS | Shanghai Pudong18(0.223351) | Shanghai Pudong | CRS | Shanghai Pudong19(1.000000) |
| Guangzhou Baiyun | CRS | Guangzhou Baiyun19(1.000000) | Shenzhen Bao’an | CRS | Shenzhen Bao’an19(1.000000) |
| Guiyang Longdongbao | IRS | Beijing Capital18(0.020047); Qingdao Liuting19(0.063486); Shenzhen Bao’an19(0.386065) | Shenyang Taoxian | IRS | Shanghai Pudong18(0.071972); Shenzhen Bao’an19(0.294502) |
| Harbin Taiping | CRS | Harbin Taiping19(1.000000) | Shijiazhuang Zhengding | IRS | Shanghai Pudong18(0.180212) |
| Haikou Meilan | IRS | Qingdao Liuting19(0.555693); Shanghai Pudong19(0.075054); Shenzhen Bao’an19(0.081226) | Taiyuan Wusu | IRS | Harbin Taiping19(0.455343); Shanghai Pudong18(0.081177) |
| Hangzhou Xiaoshan | IRS | Shanghai Pudong19(0.265953); Shenzhen Bao’an19(0.418153) | Tianjin Binhai | IRS | Shanghai Pudong18(0.332550) |
| Hefei Xinqiao | IRS | Harbin Taiping19(0.062757); Shanghai Pudong18(0.170089) | Wenzhou Longwan | IRS | Shanghai Pudong18(0.182839) |
| Hohhot Baita | IRS | Harbin Taiping19(0.722788); Shanghai Pudong18(0.010568) | Urumchi Diwopu | IRS | Harbin Taiping19(0.300731); Shanghai Pudong18(0.265034) |
| Jinan Yaoqiang | IRS | Harbin Taiping19(0.401150); Shanghai Pudong18(0.140069) | Wuhan Tianhe | IRS | Shanghai Pudong18(0.402404) |
| Kunming Changshui | IRS | Beijing Capital18(0.059523); Shanghai Pudong19(0.328773); Shenzhen Bao’an19(0.411288) | Xi’an Xianyang | CRS | Xi’an Xianyang19(1.000000) |
| Lanzhou Zhongchuan | IRS | Harbin Taiping19(0.493920); Shanghai Pudong18(0.091491) | Xiamen Gaoqi | IRS | Beijing Capital18(0.066600); Qingdao Liuting19(0.393833); Xiamen Gaoqi 18(0.406367) |
| Nanchang Changbei | IRS | Harbin Taiping19(0.087919); Shanghai Pudong18(0.188279) | Zhengzhou Xinzheng | IRS | Shanghai Pudong18(0.428688) |
| Nanjing Lukou | IRS | Shanghai Pudong18(0.465277) | Zhuhai Jinwan | IRS | Harbin Taiping19(0.156814); Shanghai Pudong18(0.130375) |
| Chongqing Jiangbei | IRS | Shanghai Pudong18(0.630748) | |||
© 2020 by the authors. Licensee MDPI, Basel, Switzerland. This article is an open access article distributed under the terms and conditions of the Creative Commons Attribution (CC BY) license (http://creativecommons.org/licenses/by/4.0/).
Share and Cite
MDPI and ACS Style
Choi, Y.; Wen, H.; Lee, H.; Yang, H. Measuring Operational Performance of Major Chinese Airports Based on SBM-DEA. Sustainability 2020, 12, 8234. https://doi.org/10.3390/su12198234
AMA Style
Choi Y, Wen H, Lee H, Yang H. Measuring Operational Performance of Major Chinese Airports Based on SBM-DEA. Sustainability. 2020; 12(19):8234. https://doi.org/10.3390/su12198234
Chicago/Turabian StyleChoi, Yongrok, Hua Wen, Hyoungsuk Lee, and Hang Yang. 2020. "Measuring Operational Performance of Major Chinese Airports Based on SBM-DEA" Sustainability 12, no. 19: 8234. https://doi.org/10.3390/su12198234
Note that from the first issue of 2016, this journal uses article numbers instead of page numbers. See further details here.