Article

Integrating Spatial Valuation of Ecosystem Services into Protected Area Management: A Case Study of the Cangshan Nature Reserve in Dali, China

1
School of Environment and Nature Resources, Renmin University of China, Beijing 100872, China
2
State Key Laboratory of Environmental Criteria and Risk Assessment, Chinese Research Academy of Environmental Sciences, Beijing 100012, China
3
Institute of Eastern-Himalaya Biodiversity Research, Dali University, Dali 671003, China
*
Authors to whom correspondence should be addressed.
Sustainability 2020, 12(22), 9395; https://doi.org/10.3390/su12229395
Submission received: 10 October 2020 / Revised: 5 November 2020 / Accepted: 6 November 2020 / Published: 11 November 2020
(This article belongs to the Section Sustainability, Biodiversity and Conservation)

Abstract

:
Given the importance of protected areas (PAs) in promoting the balance between conservation and sustainable development, it is crucial for planners and decision-makers to focus attention on the core areas that are of priority to PAs. However, few studies have addressed the balance between ecosystem service provision in PAs and regional development demands based on spatial valuation data. Herein, we present an integrated approach using the Cangshan Nature Reserve as a case study with the aim of identifying the core conservation areas of the reserve—the only national nature reserve in the 18-creek watershed of Cangshan—under different urbanization scenarios. The results show that the overall farmland in the watershed decreased and the architectural area increased, but the land use in the nature reserve remained stable from 1995 to 2035. With the increase in demand for water in the watershed, at least 24.3% of the Cangshan Nature Reserve should be designated as core conservation area to ensure the maintenance of sufficient water quantity and quality. This study can be used as a reference for the sustainable management of PAs based on our example of balancing ecosystem service provision and demand in a single watershed.

1. Introduction

Protected areas (PAs) are essential for protecting biodiversity and for providing ecosystem services [1]. In 2010, the Convention on Biological Diversity (CBD) set a target (i.e., Aichi Target 11) of protecting 17% of terrestrial land and inland water areas by 2020 [2]. The large-scale expansion of nationally protected area systems is becoming increasingly difficult due to the reduction in nearly intact habitats that are available [3], and there is a growing awareness of the importance of social factors in the establishment of PAs [4]. In recent decades, the management and planning of PAs has become a topic of concern for environmentalists all over the world. To balance the sustainable development of PAs and regions, PAs have become a main instrument for helping each conservation unit achieve its ideal function [5].
Traditionally, the conservation strategies behind PAs have held that biodiversity should be preserved, because species have both functional and inherent value [6,7]. Many methods have been developed to support these strategies, most of which are considered to identify issues in planning, developing conservation tasks, funding, and infrastructure [8,9], but the difficulty in managing PAs also depends on other factors. More recently, with the growth in populations and the improvement in human living standards, the demand for improved human well-being and, hence, for ecosystem services, is also increasing [10,11]. Meanwhile, the growing number of PAs around the world reflects the increasing awareness of the importance of PAs in protecting and providing ecosystem services. The maintenance of ecosystem services has become an increasingly important task in the management and sustainable development of PAs; thus, there has been a shift toward considering ecosystem services and human well-being in the design and management of PAs [12]. The combination of the management of PAs and their provision of ecosystem services is becoming increasingly important. This means considering ecosystem services, ecosystem features (i.e., biodiversity, structure, and function), and the natural and social development pressures that have an impact on them as a whole [13,14]. It is important to have an understanding of the overall system. Therefore, conservation plans increasingly emphasize the common protection of ecosystem services and biodiversity [15]. Especially in the phase of identifying spatial core conservation areas of PAs, ecosystem services may become a core aspect that is conducive to the formulation of conservation management planning and regional sustainable development.
Around the world, research on the integration of ecosystem services into PA management has focused on the assessment of the value of ecosystem services in PAs [16,17]. In such research, the ecosystem services of PAs were classified, for example, as provisioning services, regulating services, etc., according to ecosystem services classification frameworks, such as the Millennium Ecosystem Assessment (MEA), The Economics of Ecosystems and Biodiversity (TEEB), and the Intergovernmental Science-Policy Platform on Biodiversity and Ecosystem Services (IPBES) [18,19,20], and each service was then assigned a monetary value through a direct market valuation method and non-market method, amongst others [16]. For example, using the direct market method, the value of ecosystem services generated by India’s Nagarhole National Park is much greater than that of other land-use types, and its protection can inhibit the reduction of tropical forests caused by economic development [21]. The Hoge Veluwe National Park in the Netherlands provides annual timber production, recreational opportunities, water supply, and other services valued at approximately 2000 euros/hm2 per year, which is more than three times higher than the value of the agricultural land [22]. In China, researchers calculated the ecosystem service values of the Qinling Nature Reserve and Gongbu Nature Reserve using both a direct market valuation method and non-market method. They analyzed each reserve’s situation and the existing problems in the management of nature reserves, putting forward relevant recommendations [23,24]. These studies emphasized the monetary value of PAs amongst different stakeholders and how this may assist in the management of such PAs and in the evaluation of the management’s effectiveness.
However, monetary assessments of ecosystem services must be taken carefully into account as many people in society may mistake this for its intrinsic value rather than its intrinsic human value [25,26]. In addition, the classification framework of ecosystem services in different studies may be inconsistent, and the differences and reliability of their monetary accounting methods have always been a controversial issue. Monetary assessments of ecosystem services may be misleading for PA management practices; thus, non-monetary valuation methods can define a view of nature that is more directly concerned with the value of the ecosystem itself and its influence on social relationships [27], which could provide better guidance toward the aims of PA management [28]. These assessments range from a spatially oriented participatory Geographic Information System (GIS) and various models such as the Integrated Valuation of Ecosystem Services and Tradeoffs (InVEST), the Artificial Intelligence for Ecosystem Services (ARIES), and the Soil and Water Assessment Tool (SWAT) [29,30]. Moreover, non-monetary assessments can also evaluate the effects of land-use changes on ecosystem services. However, the current evaluations of PAs are mostly based on instantaneous value evaluations on the time scale, and there is a lack of analysis of future dynamic changes after the delimitation of PAs. Analysis of alternative future scenarios is often used as a tool to quantify the relationship between future land-use changes and ecosystem services [31,32]. For example, a scenario in which a National Forest Law is implemented will increase the quality of all forest goods and the benefits from services (e.g., carbon storage, provision of araucaria nuts, and habitat quality) and erosion control compared to, for example, a business-as-usual scenario in the southern Atlantic Forest, Brazil. This reflects the impact of different land-use scenarios on forest biodiversity conservation and ecosystem services [33]. Among the four future land-use scenarios modeled for the Zengcheng District, China, the soil conservation and woodland buffering scenarios will perform better than the baseline scenarios in terms of carbon storage, water purification, soil conservation, biodiversity conservation, and recreational opportunities [34]. Under future climate change scenarios in the Teshio River watershed, Japan, annual water yield, sediment, and nutrient loads are expected to increase. The sediment and nutrient loads mainly come from agricultural runoff under land use, which indicates that management of riparian zones and fertilizer use will be a potential mitigation strategy to reduce the negative impact of land use and climate change on water quality [35]. These studies combine future land-use changes with ecosystem services to make spatial recommendations for land management and policy. However, similar studies have mostly focused on national and regional scales, and few studies have addressed the balance of ecosystem service provision of PAs and regional development demand based on spatial valuation data.
In order to balance economic development and environmental protection, China has proposed an ambitious national plan for establishing an “Ecological Civilization” [36]. PAs are the core carrier of this and are an important symbol of “Beautiful China”. However, some PAs, especially those established under guidance of the “rescue protection” policy during earlier years, have insufficient standards, lack support from in-depth scientific investigations, and have used unscientific and unreasonable functional zoning [37]. Nature reserves comprise the main collection of China’s protected area system [38], accounting for approximately 14.86% of its total land area [39]. In recent years, the functional zoning division policy (such as the division of the core zone and buffer zone of PAs) has been widely used in nature reserves to achieve management and protection goals [40,41]. However, some unreasonable functional zoning has caused many contradictions, including the definition of the boundary [42]. Therefore, in order to meet the needs of “Ecological Civilization” and the construction of “Beautiful China”, the functional zoning of nature reserves requires reasonable reforms to support the protection of biodiversity and ecosystem services in addition to contributing to the sustainable development of the region and human well-being.
Cangshan Nature Reserve is one of the most popular tourist attractions in southwest China. It attracts a large number of tourists every year and provides considerable income for residents in the 18-creek watershed of Cangshan. More importantly, the reserve is the main source of clean water for residents in the watershed. Stakeholders have banned many human activities to maintain ecosystem services in the reserve, but how to formulate a scientific functional zoning reform plan was still a difficult problem in the management of the reserve. By providing spatial and temporal information on ecosystem services for the reserve, it can provide decision support for future functional zoning reform by stakeholders and contribute to the sustainable development of the watershed. In this study, we present an integrated approach using the Cangshan Nature Reserve, the only national nature reserve in the 18-creek watershed of Cangshan, as a case study. The major aims of this study were (1) to characterize the changes in the two key ecosystem services (i.e., water yield and nutrient loads) from 1995 to 2035 based on land-use changes; (2) to identify core conservation areas in the Cangshan Nature Reserve according to the prediction of water demand; and, (3) to provide reasonable recommendations for functional zoning and other management measures for PAs.

2. Materials and Methods
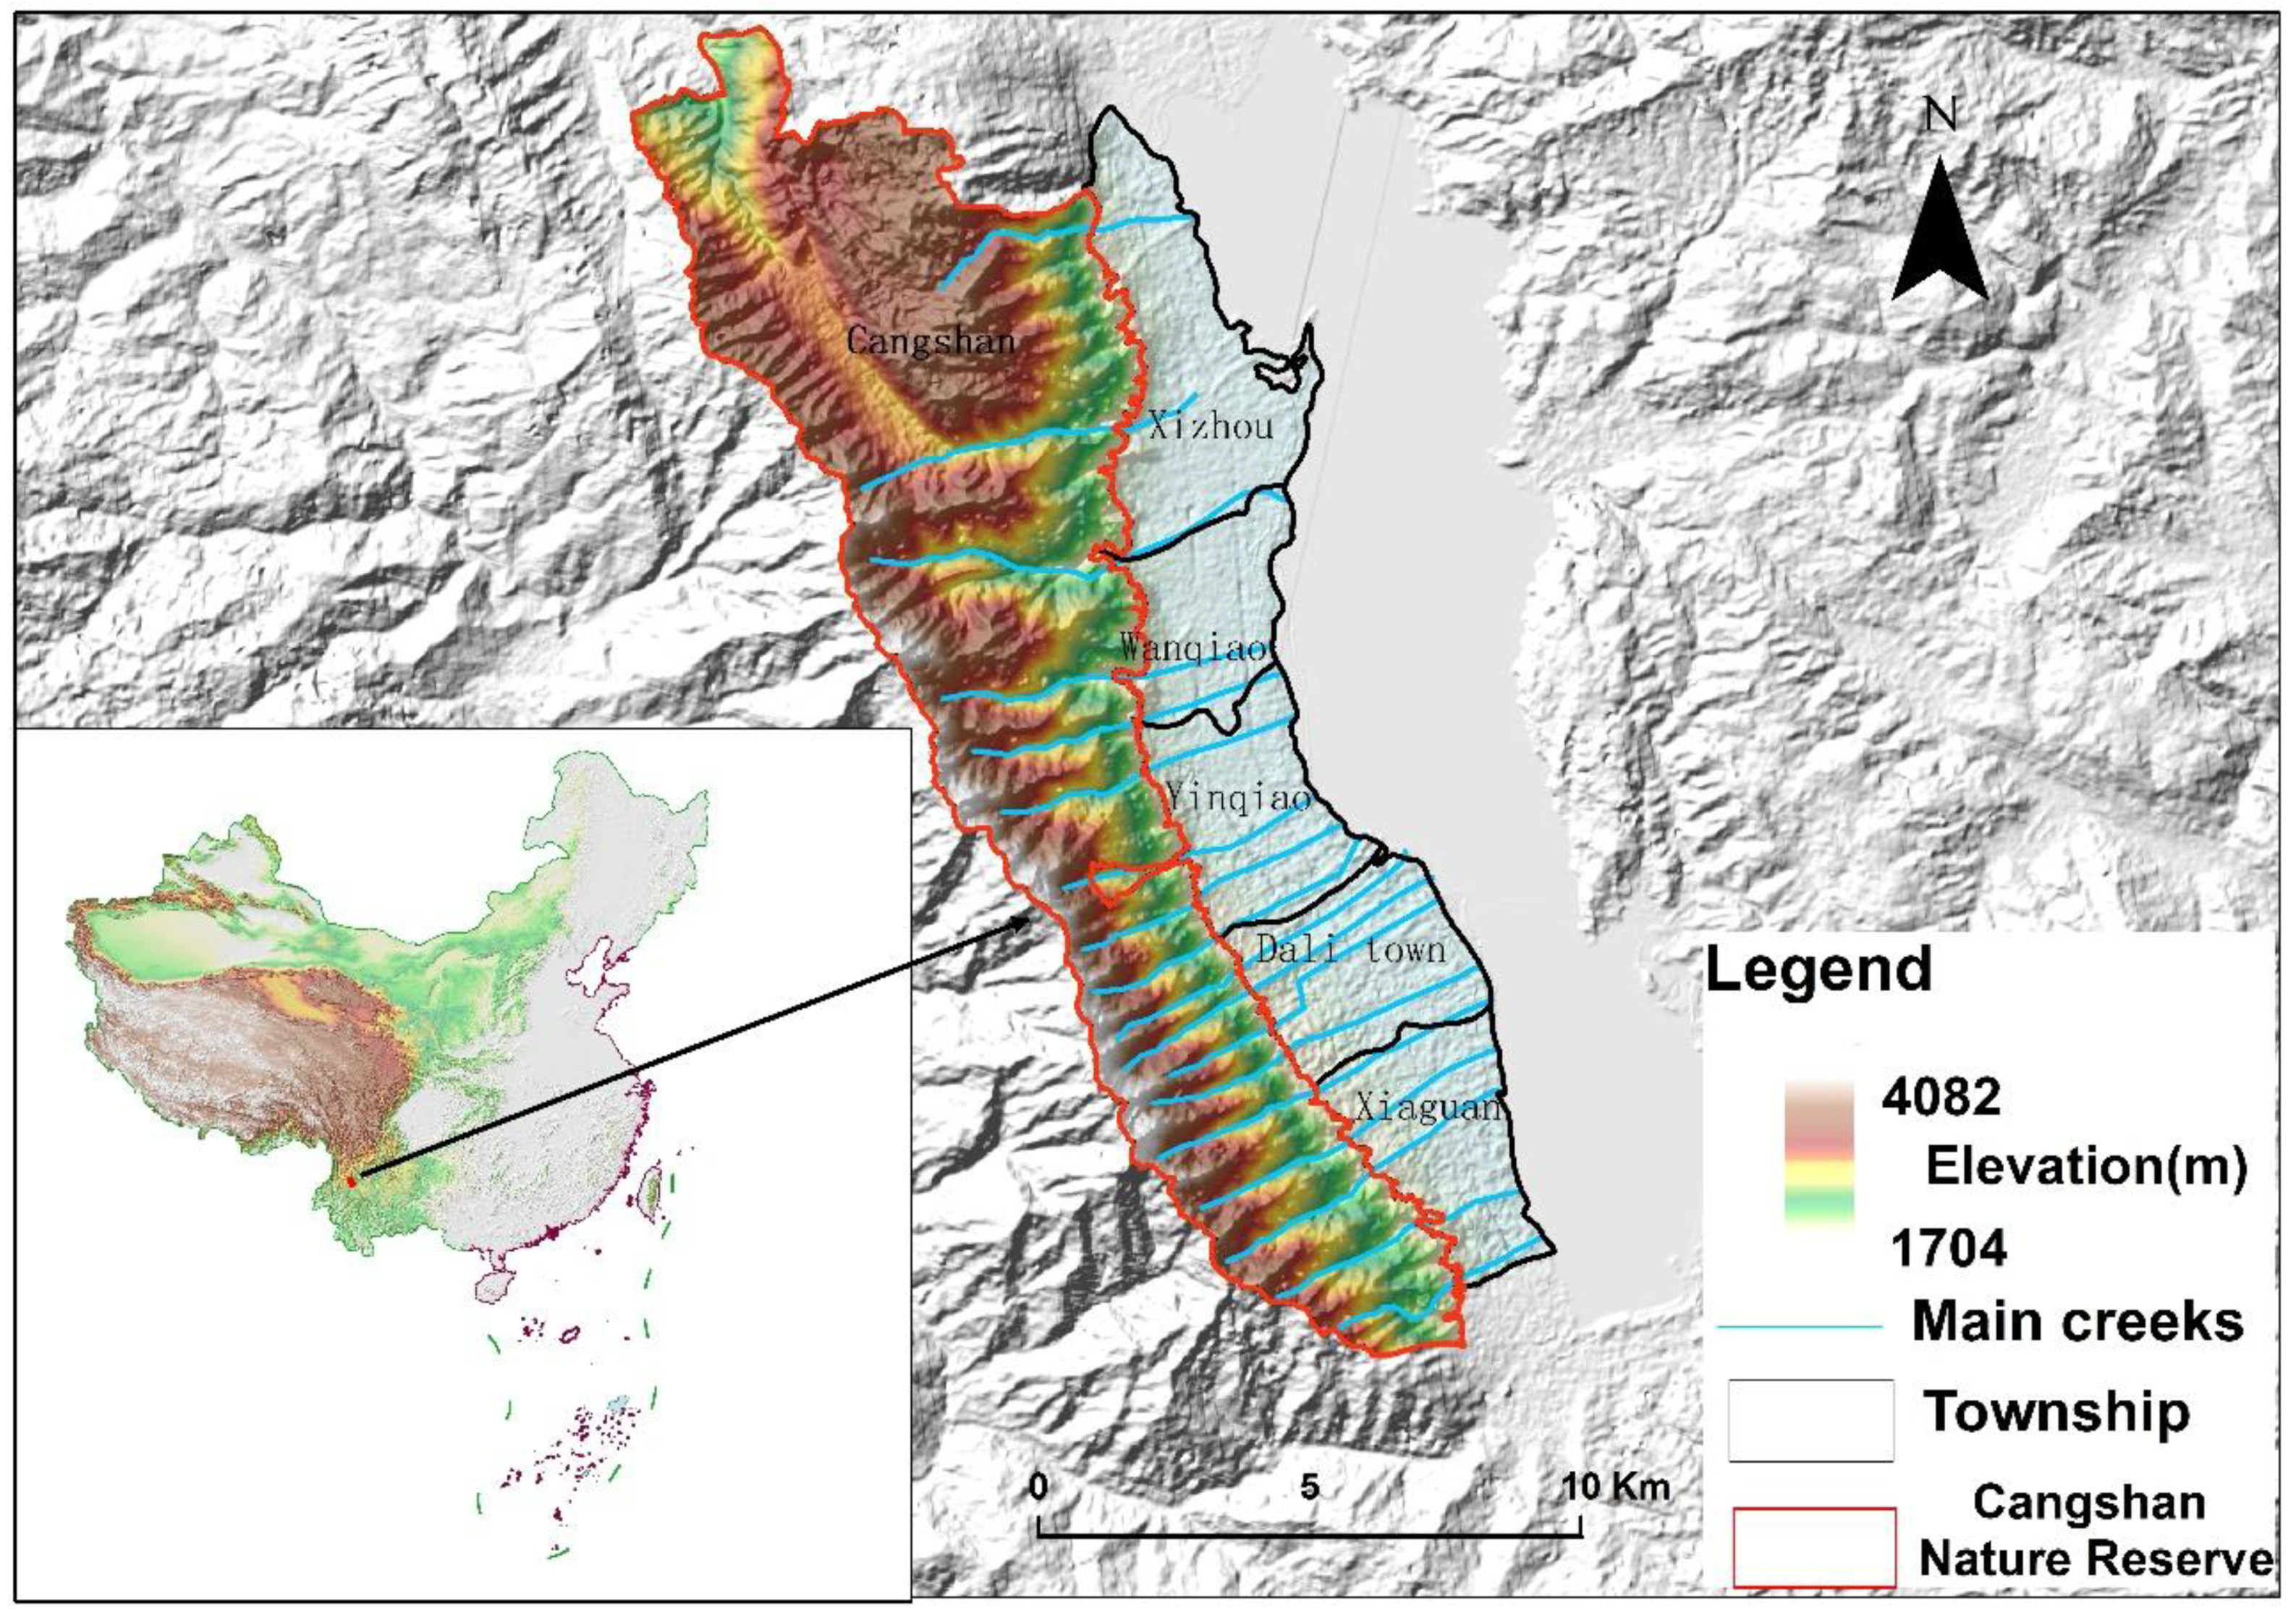
2.1. Study Area

The Cangshan’s 18-creek watershed is located in the Dali Prefecture, Yunnan, southwest China (90°57′–100°18′ E, 25°26′–26°00′ N), with an area of 44,404.74 ha. The 18 creeks are Xiayi Creek, Wanhua Creek, Yang Creek, Mangyong Creek, Jin Creek, Lingquan Creek, Baishi Creek, Shuangyang Creek, Yinxian Creek, Mei Creek, Tao Creek, Zhonghe Creek, Baihe Stream, Heilong Creek, Qingbi Creek, Mocan Creek, Tingle Creek, and Yangnan Creek. The average annual temperature is 15.5 °C, and the average annual precipitation is 1000–1100 mm. The watershed mainly consists of forest, farmland, and human settlements and is the location of five townships—Xizhou, Wanqiao, Yinqiao, Dali, and Xiaguan—which are dominated by agriculture and light industry. The average population of approximately 190,000 is concentrated in the five townships (Figure 1).
The Cangshan Nature Reserve (Figure 1) and the nearby five towns cover an area of 28,404 ha and provide a variety of ecosystem services for the residents of the five townships, with the most important ecosystem service being the water supply. The average natural water yield from the reserve is approximately 223.1 million m3 per year [43,44]. This has provided tremendous support for the life and economic development of the residents of these five townships.

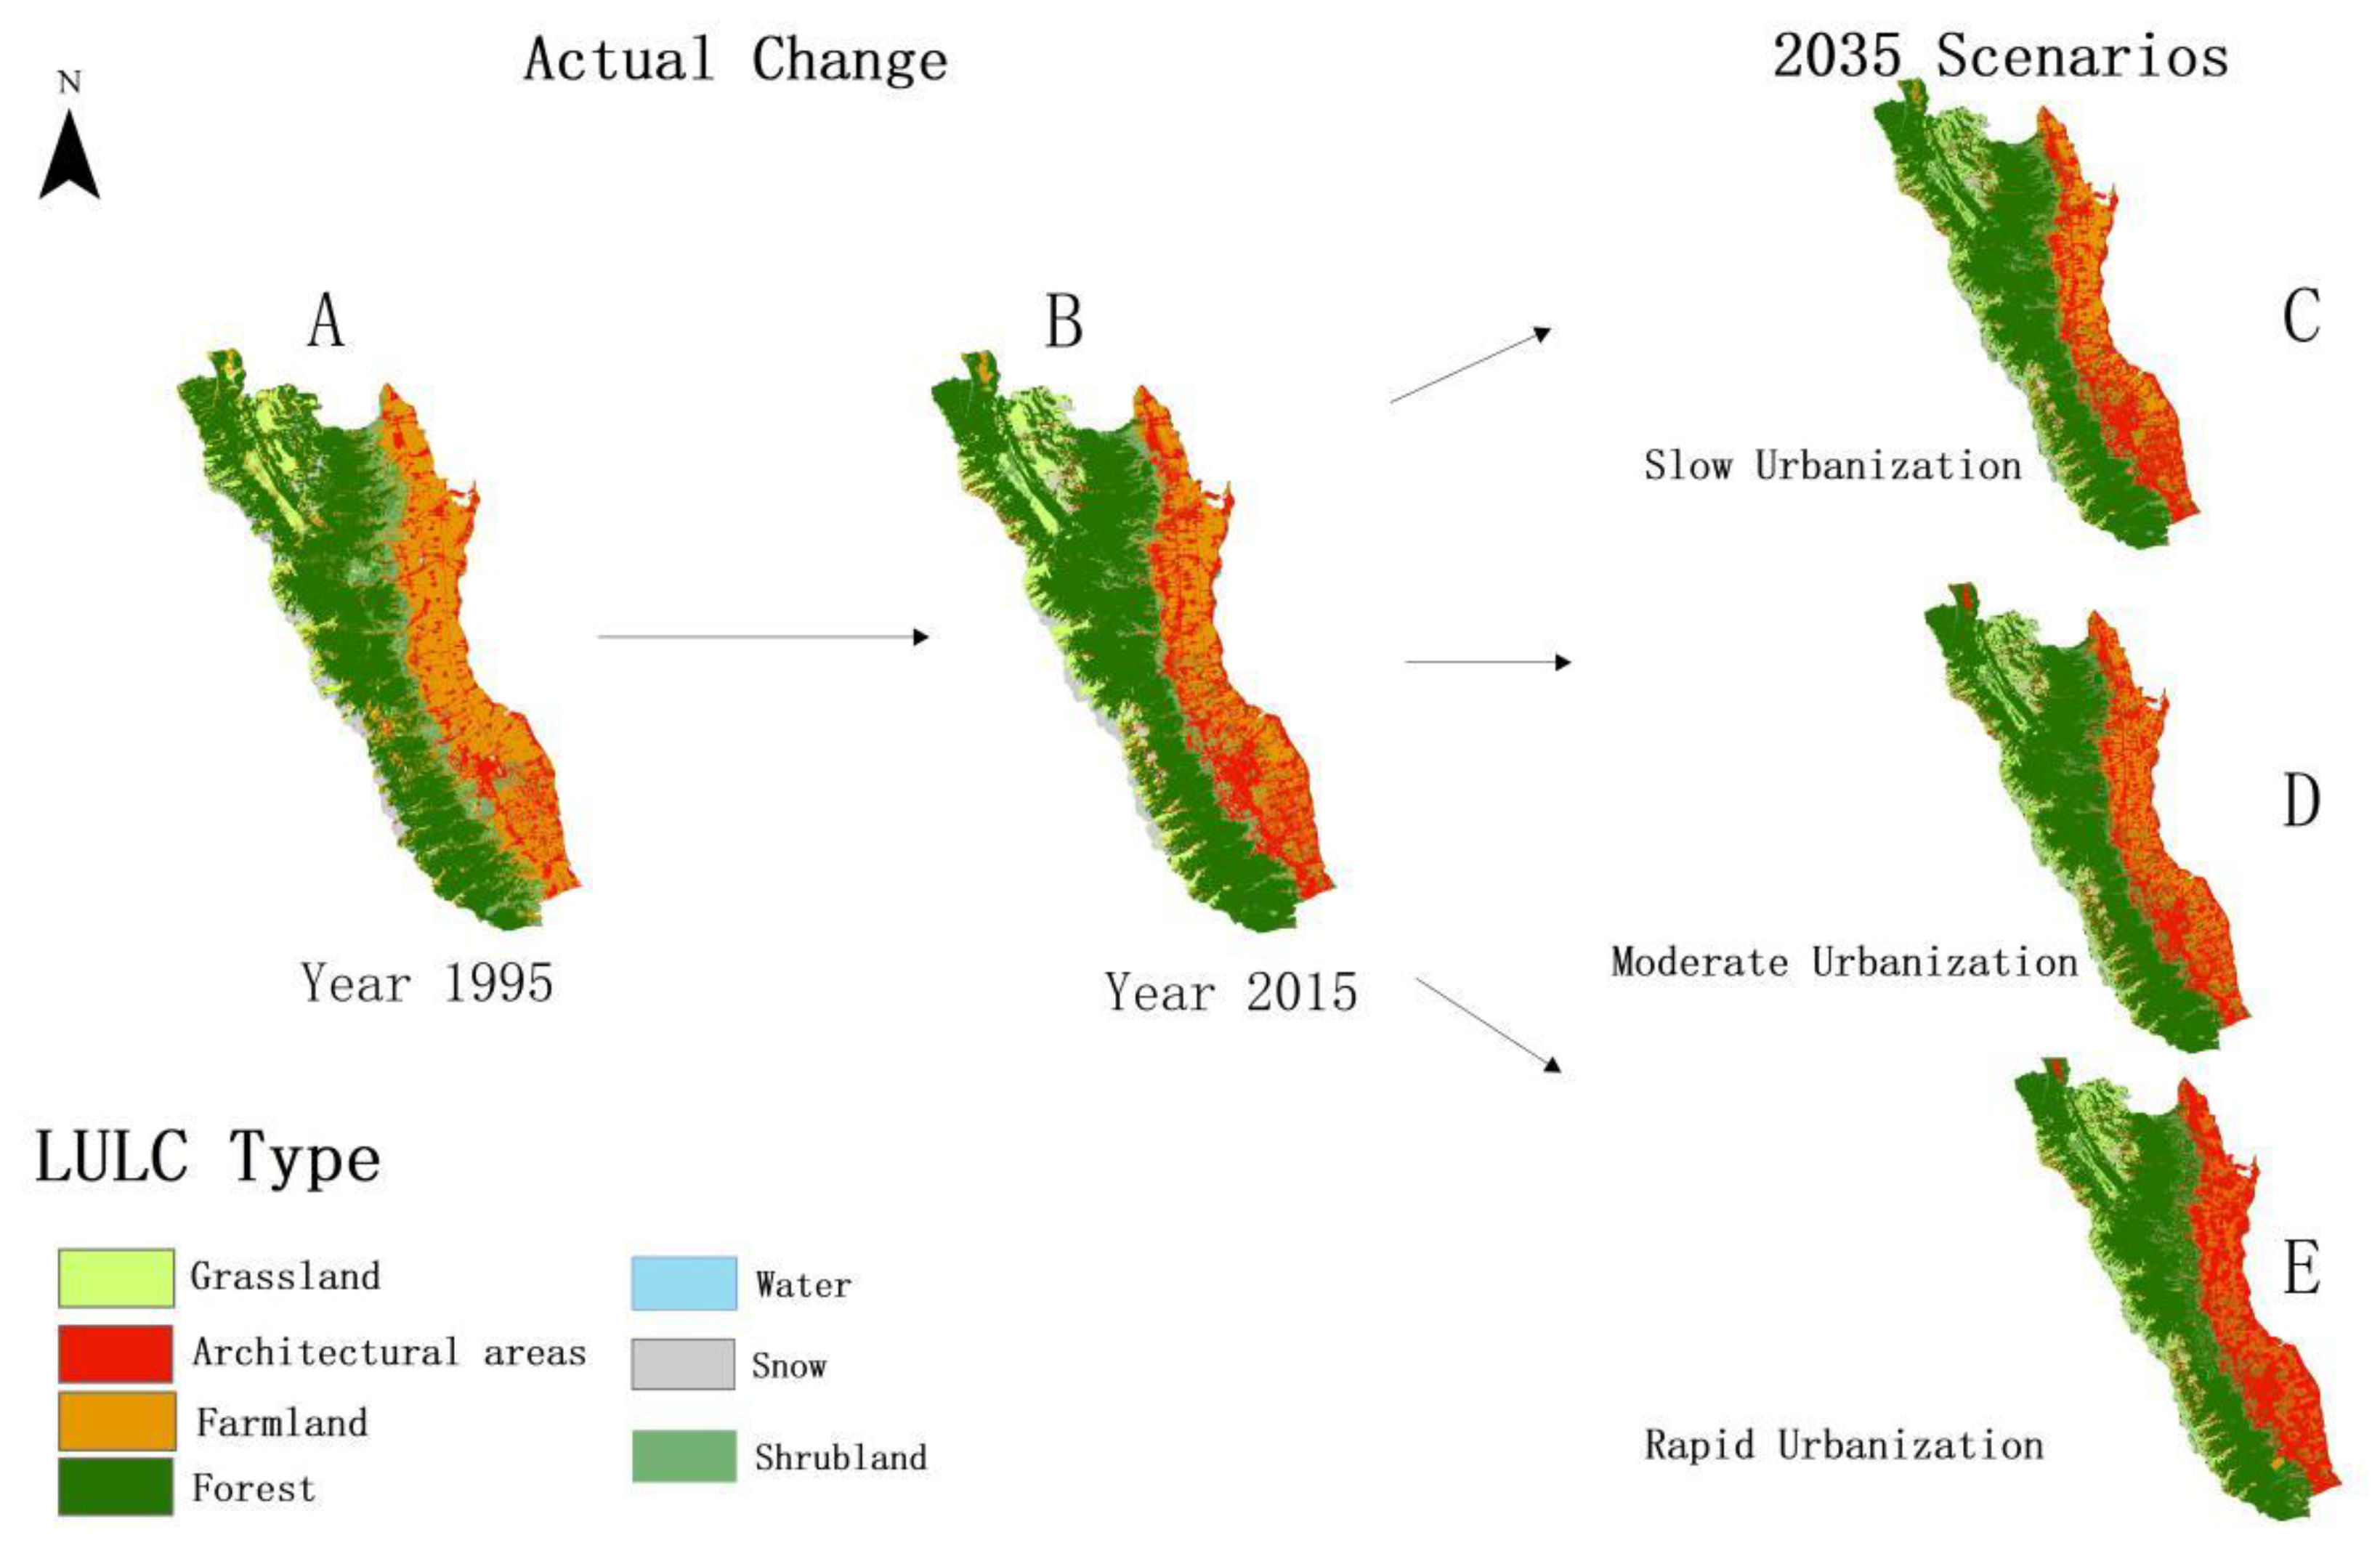
2.2. Future Land-Use and Land-Cover Prediction

We used the Scenario Generator module in the InVEST model to predict future land-use change scenarios. A scenario generator requires stakeholders to rank land-use types in order to assign weights. When multiple land-use types need to be converted into one, the land-use types with higher weights are preferentially converted. This tool provides a method for assigning weights to land-use types, that is, using a pairwise comparison matrix in an analytic hierarchy process (AHP) using nine points in a continuous scale; for example, relative to the A use-type, the C use-type is “very minor” (4/9 to 1), but the C use-type is “more important” than the B use-type (4/9 to 1/9). The conversion probability is also given by stakeholders and the value range is 0–10. At the same time, constraints can be set to prevent the land use from being forced to change, such as for the core area of nature reserves. In addition to the abovementioned stakeholder-driven factors, the Scenario Generator also provides an analysis of the physical and environmental factors and proximity suitability that determine the transformation of land-use suitability [45].
We predicted three future land-use patterns in this watershed according to the current temporal trends of land-use transition from the years 1995 to 2015 in the remote sensing interpretation image (Figure 2) of the “Dali Prefecture Urban System Planning (2016–2035)” and “Dali Prefecture Erhai Watershed Spatial Planning (2017–2035)” documents. The three scenarios were (1) Slow Urbanization (SU), (2) Moderate Urbanization (MU), and (3) Rapid Urbanization (RU). In this study, the three scenarios were used up to the year 2035 to explore the potential impact of land-use changes on water quantity and quality in the reserve as well as the changes in water demand for the five townships under different urbanization processes.

2.2.1. Slow Urbanization Scenario

Under this scenario, we set the urbanization rate of the five townships to 72% (Table 1), which is 11% less than the urbanization target in the “Dali Prefecture Urban System Planning (2016–2035)” document. At the same time, we set up a strict permanent basic farmland protection area so that it would not be converted to other land-use types. The probability of each type of land-use change in the reserve was slightly lowered based on the land transition rates for the period 1995–2015.

2.2.2. Moderate Urbanization Scenario

Under this scenario, we made extensive reference to the “Dali Prefecture Urban System Planning (2016–2035)” and the “Dali Prefecture Erhai Watershed Spatial Planning (2017–2035)” documents. The reserve follows the protection effectiveness required in these two documents. Meanwhile, we set the urbanization rate to 83% according to the requirements of these two planning documents.

2.2.3. Rapid Urbanization Scenario

The years 1995–2015 were a period of rapid urbanization in China. Under this scenario, we overlooked various restrictions and planning requirements, and land-use changes in Cangshan’s 18-creek watershed were based on a continuation of the land transition rates during the 1995–2015 period.

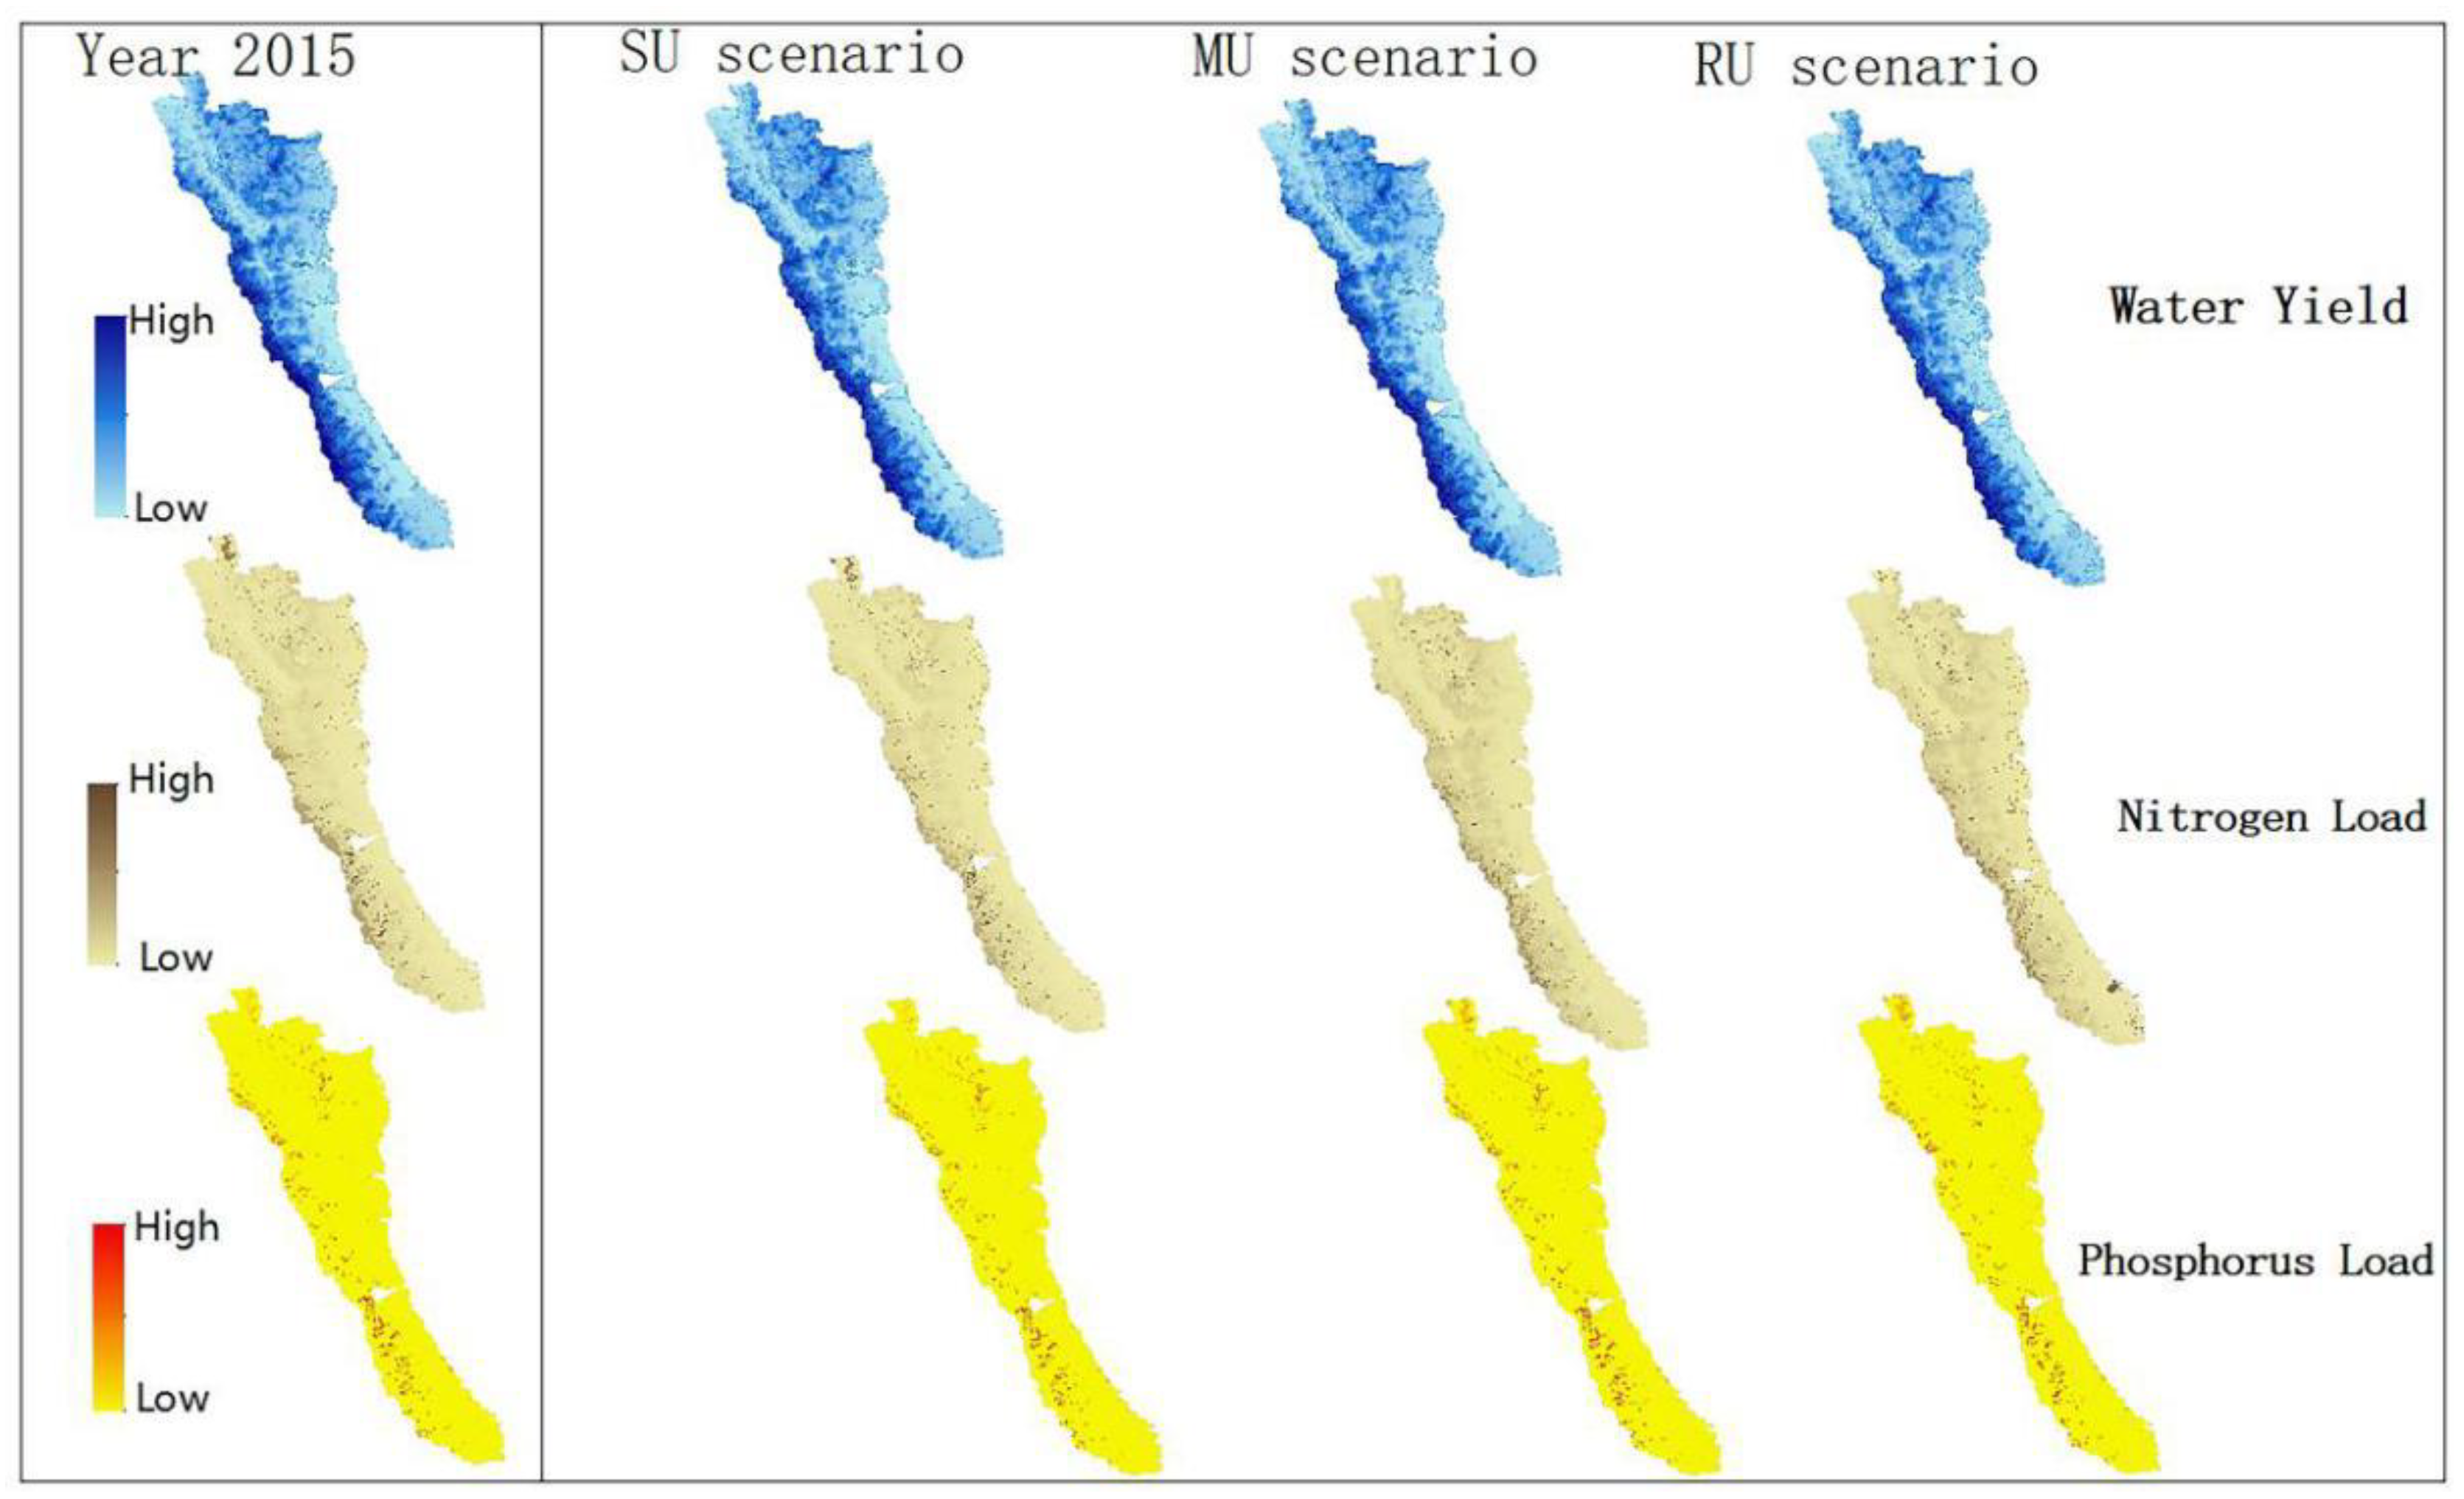
2.3. Mapping Ecosystem Services

In order to determine water quantity and quality under different scenarios in the reserve, we used InVEST to explore the relationship between land use and land cover (LULC) and ecosystem services, which is a better tool than SWAT and ARIES for mapping mountain ecosystem services where data collection is difficult [45]. InVEST aims to inform decisions about natural resource management. Essentially, it provides information about how ecosystem changes may lead to changes in the flow of benefits to humans. Policymakers, from governments to nonprofits to corporations, often manage land and water for multiple uses, and inevitably must assess the trade-offs between these uses [45]. We used the water yield and nutrient delivery ratio models from InVEST to map the two ecosystem services on water quantity and quality, namely, water yield and nutrient retention.

2.3.1. Water Yield

The InVEST water yield model can estimate the relative contribution of water from different parts of the landscape so as to understand how changes in land-use patterns affect the annual surface water yield. The water yield model is based on the Budyko curve and annual average precipitation [45]. We determined annual water yield Y(x) for each pixel of landscape x as follows:
Y x = 1 A E T x P x × P x
where AET(x) is the annual actual evapotranspiration for pixel x and p(x) is the annual precipitation on pixel x.

2.3.2. Nutrient Retention

The objective of the InVEST nutrient delivery model is to map nutrient sources from watersheds and their transport to streams. This spatial information can be used to assess the service of nutrient retention, and this retention service is of particular interest for surface water quality issues. For nitrogen (N) and phosphorus (P) retention, the InVEST nutrient delivery ratio model can generate two main outputs for both N and P, namely, the nutrient export to streams and the nutrient loads by each pixel of the landscape [45]. We used the nutrient loads (for surface transport) per pixel as indices for N and P retention services.

2.3.3. Model Accuracy

To guarantee the reliability of the ecosystem service results, this study compared the water yield and N and P load results simulated by the InVEST model with measured data from the literature and the Dali City Statistical Yearbook. We validated the performance of the model’s output using the relative error (RE) as follows:
R E = R s R a R a × 100 %
where Rs is the simulated result by the model and Ra is the result of another independent source [46].
The RE of the water yield, N loads, and P loads between the model simulation and measured values in 2015 were 0.9%, −4.7%, and −6.4%, respectively (Table A1). These validation results indicate that the model is able to reliably assess the impacts of future land-use changes on ecosystem services.

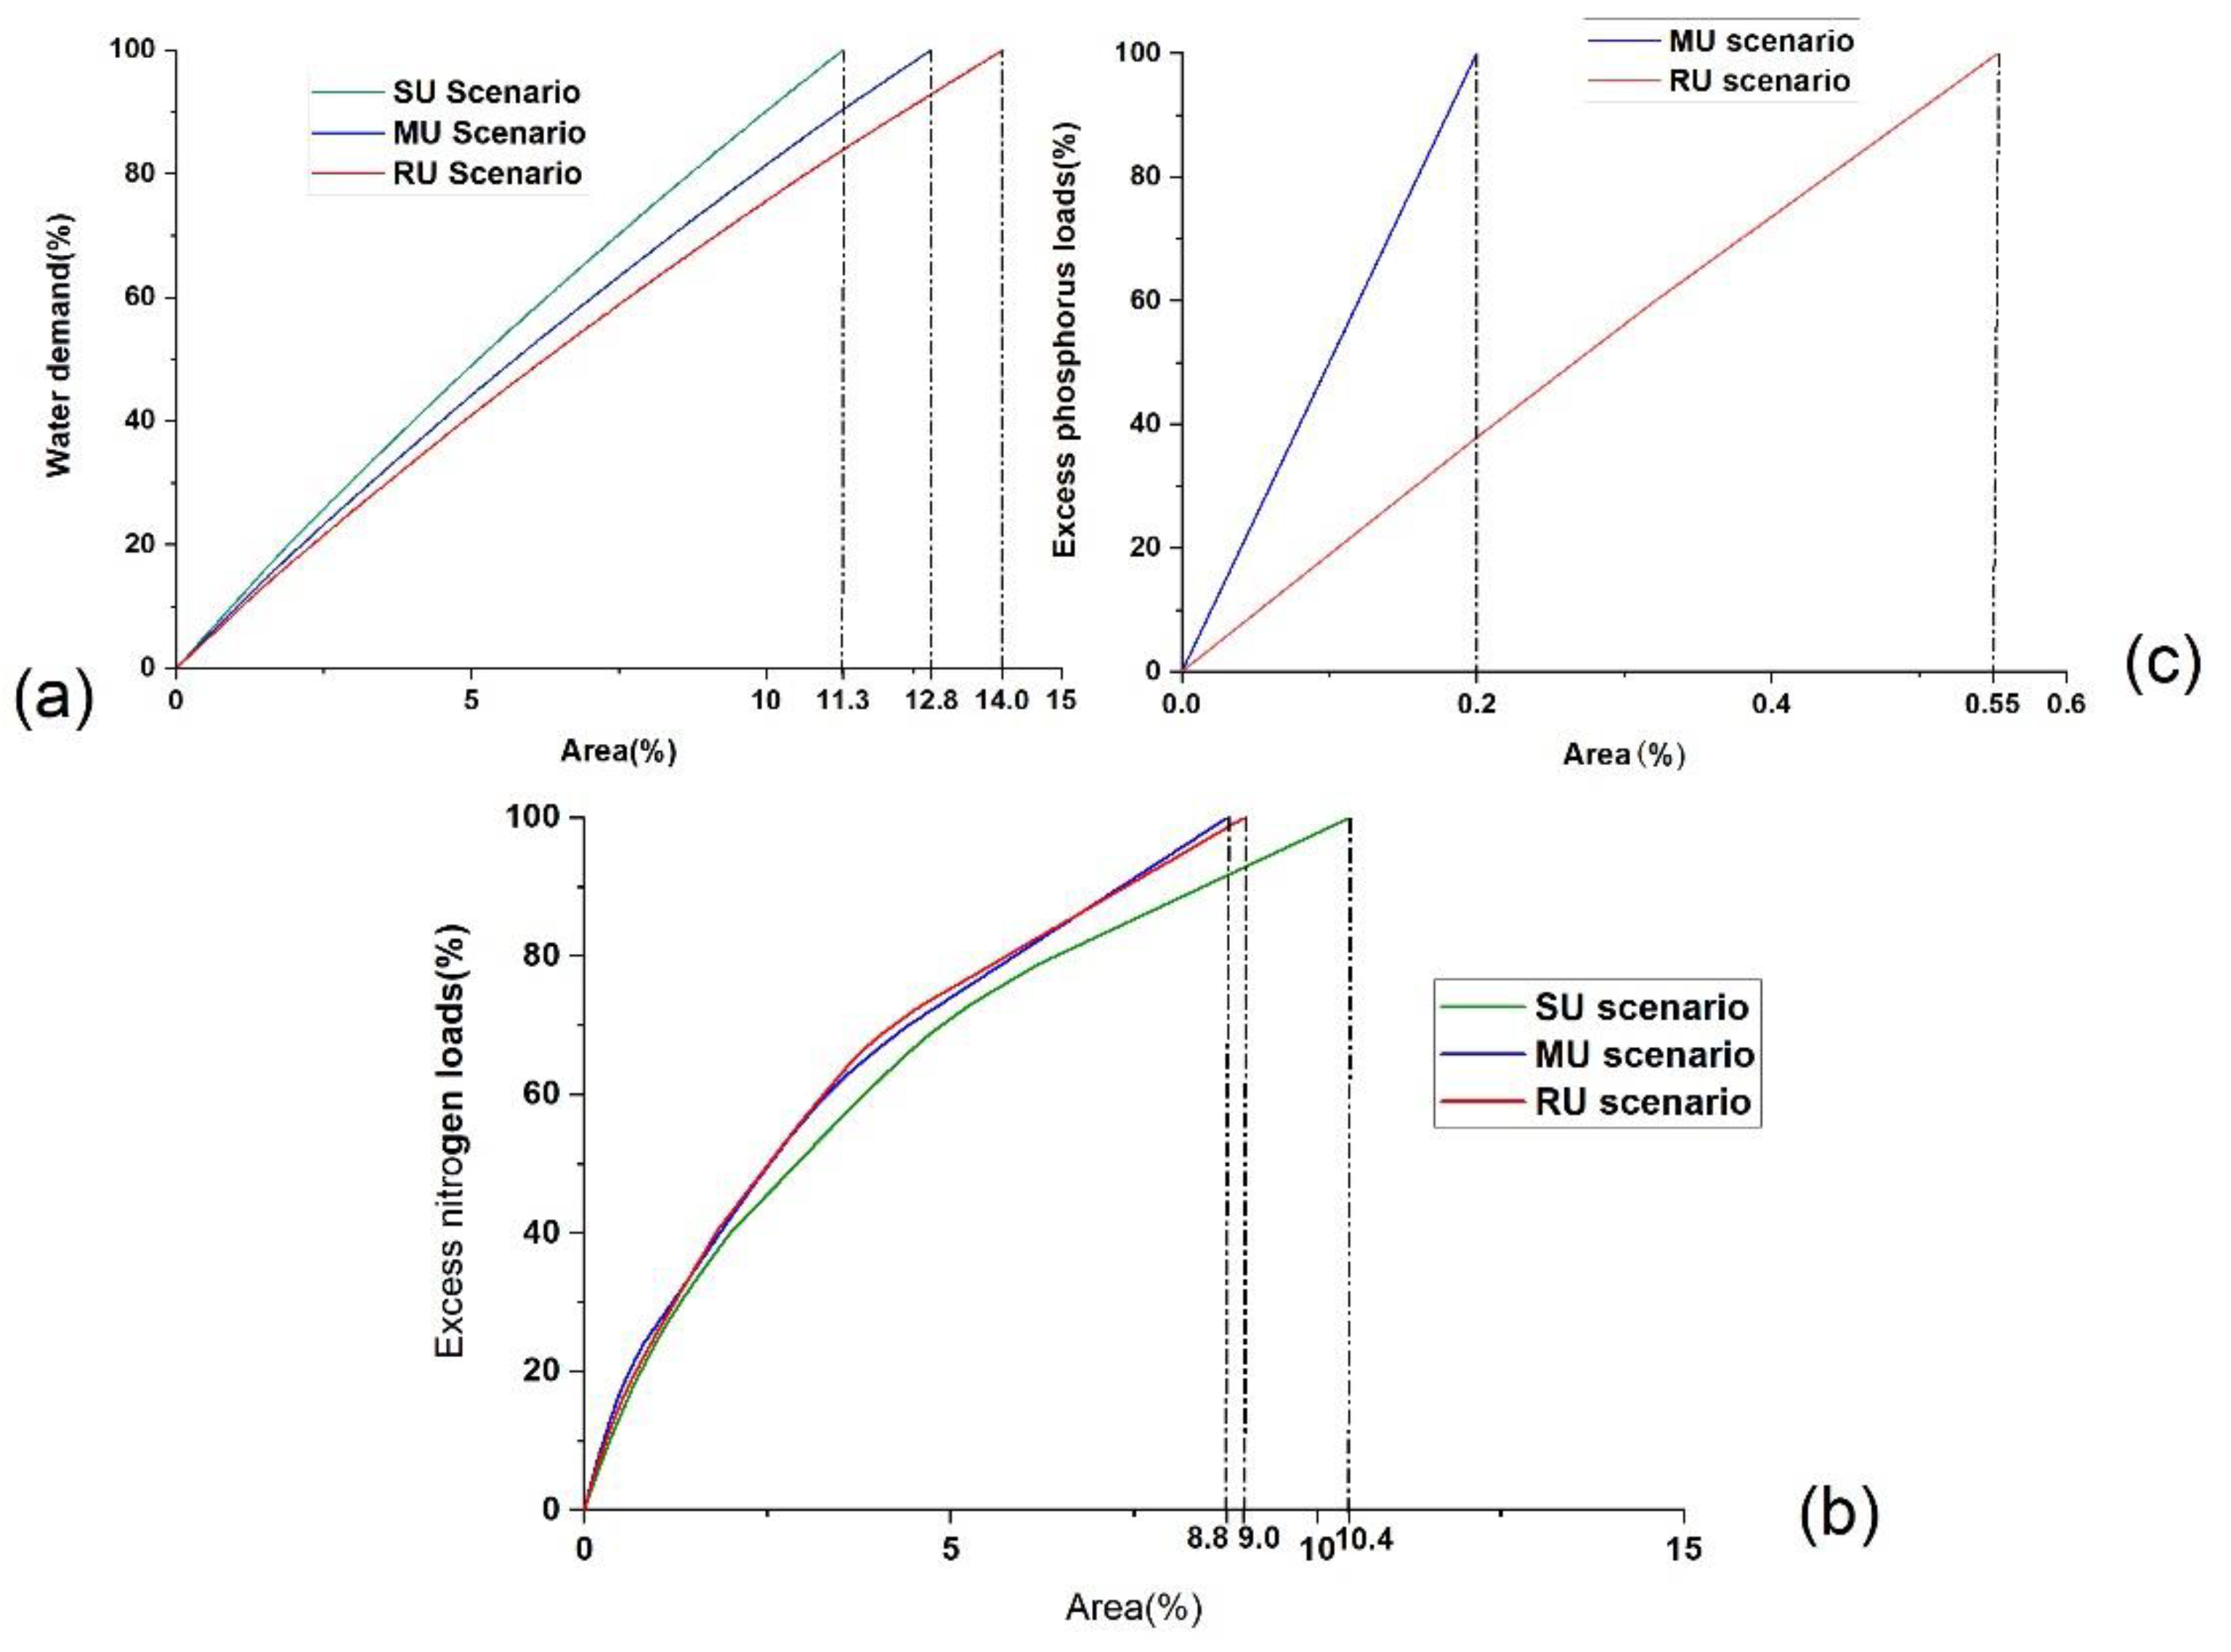
2.4. Analysis of Water Demand from the Reserve

In order to determine the water demand of residents in the five townships of the reserve under different urbanization scenarios, we determined the total amount of water drawn from the reserve and the different types of water demand for the five townships in 2015 using multiple sources in the literature [43,44,47] as well as the Dali City Statistical Yearbook. The different types of water demand were residential water (RW), livestock breeding water (LBW), agricultural water (AW), and enterprise water (EW) (Table 2). Then, we used the incremental method to determine the water demand under the three urbanization scenarios based on the urbanization rate changes, population changes, and water demand in 2015. The calculation method is as follows:
R E x = R E c 1 + 0.0058 U R c U R x P c P x
A L W x = A L W c L A c L A x
Equation (3) was used to predict the demand for RW and EW, while Equation (4) was used to predict demand for AW and LBW, where c indicates the current state (2015), x refers to scenario x, RE is RW or EW, UR is the urbanization rate, P is the population, ALW is AW or LBW, and LA refers to land areas of farmland.
We collected the water demand under the MU scenario according to the “Dali Prefecture Urban System Planning (2016–2035)” and the “Dali Prefecture Erhai Watershed Spatial Planning (2017–2035)” documents. The relative error for water demand under the MU scenario between the prediction (Table 3) and plans was no more than 6.78% (Table A2), indicating that the prediction reliably assessed water demand.

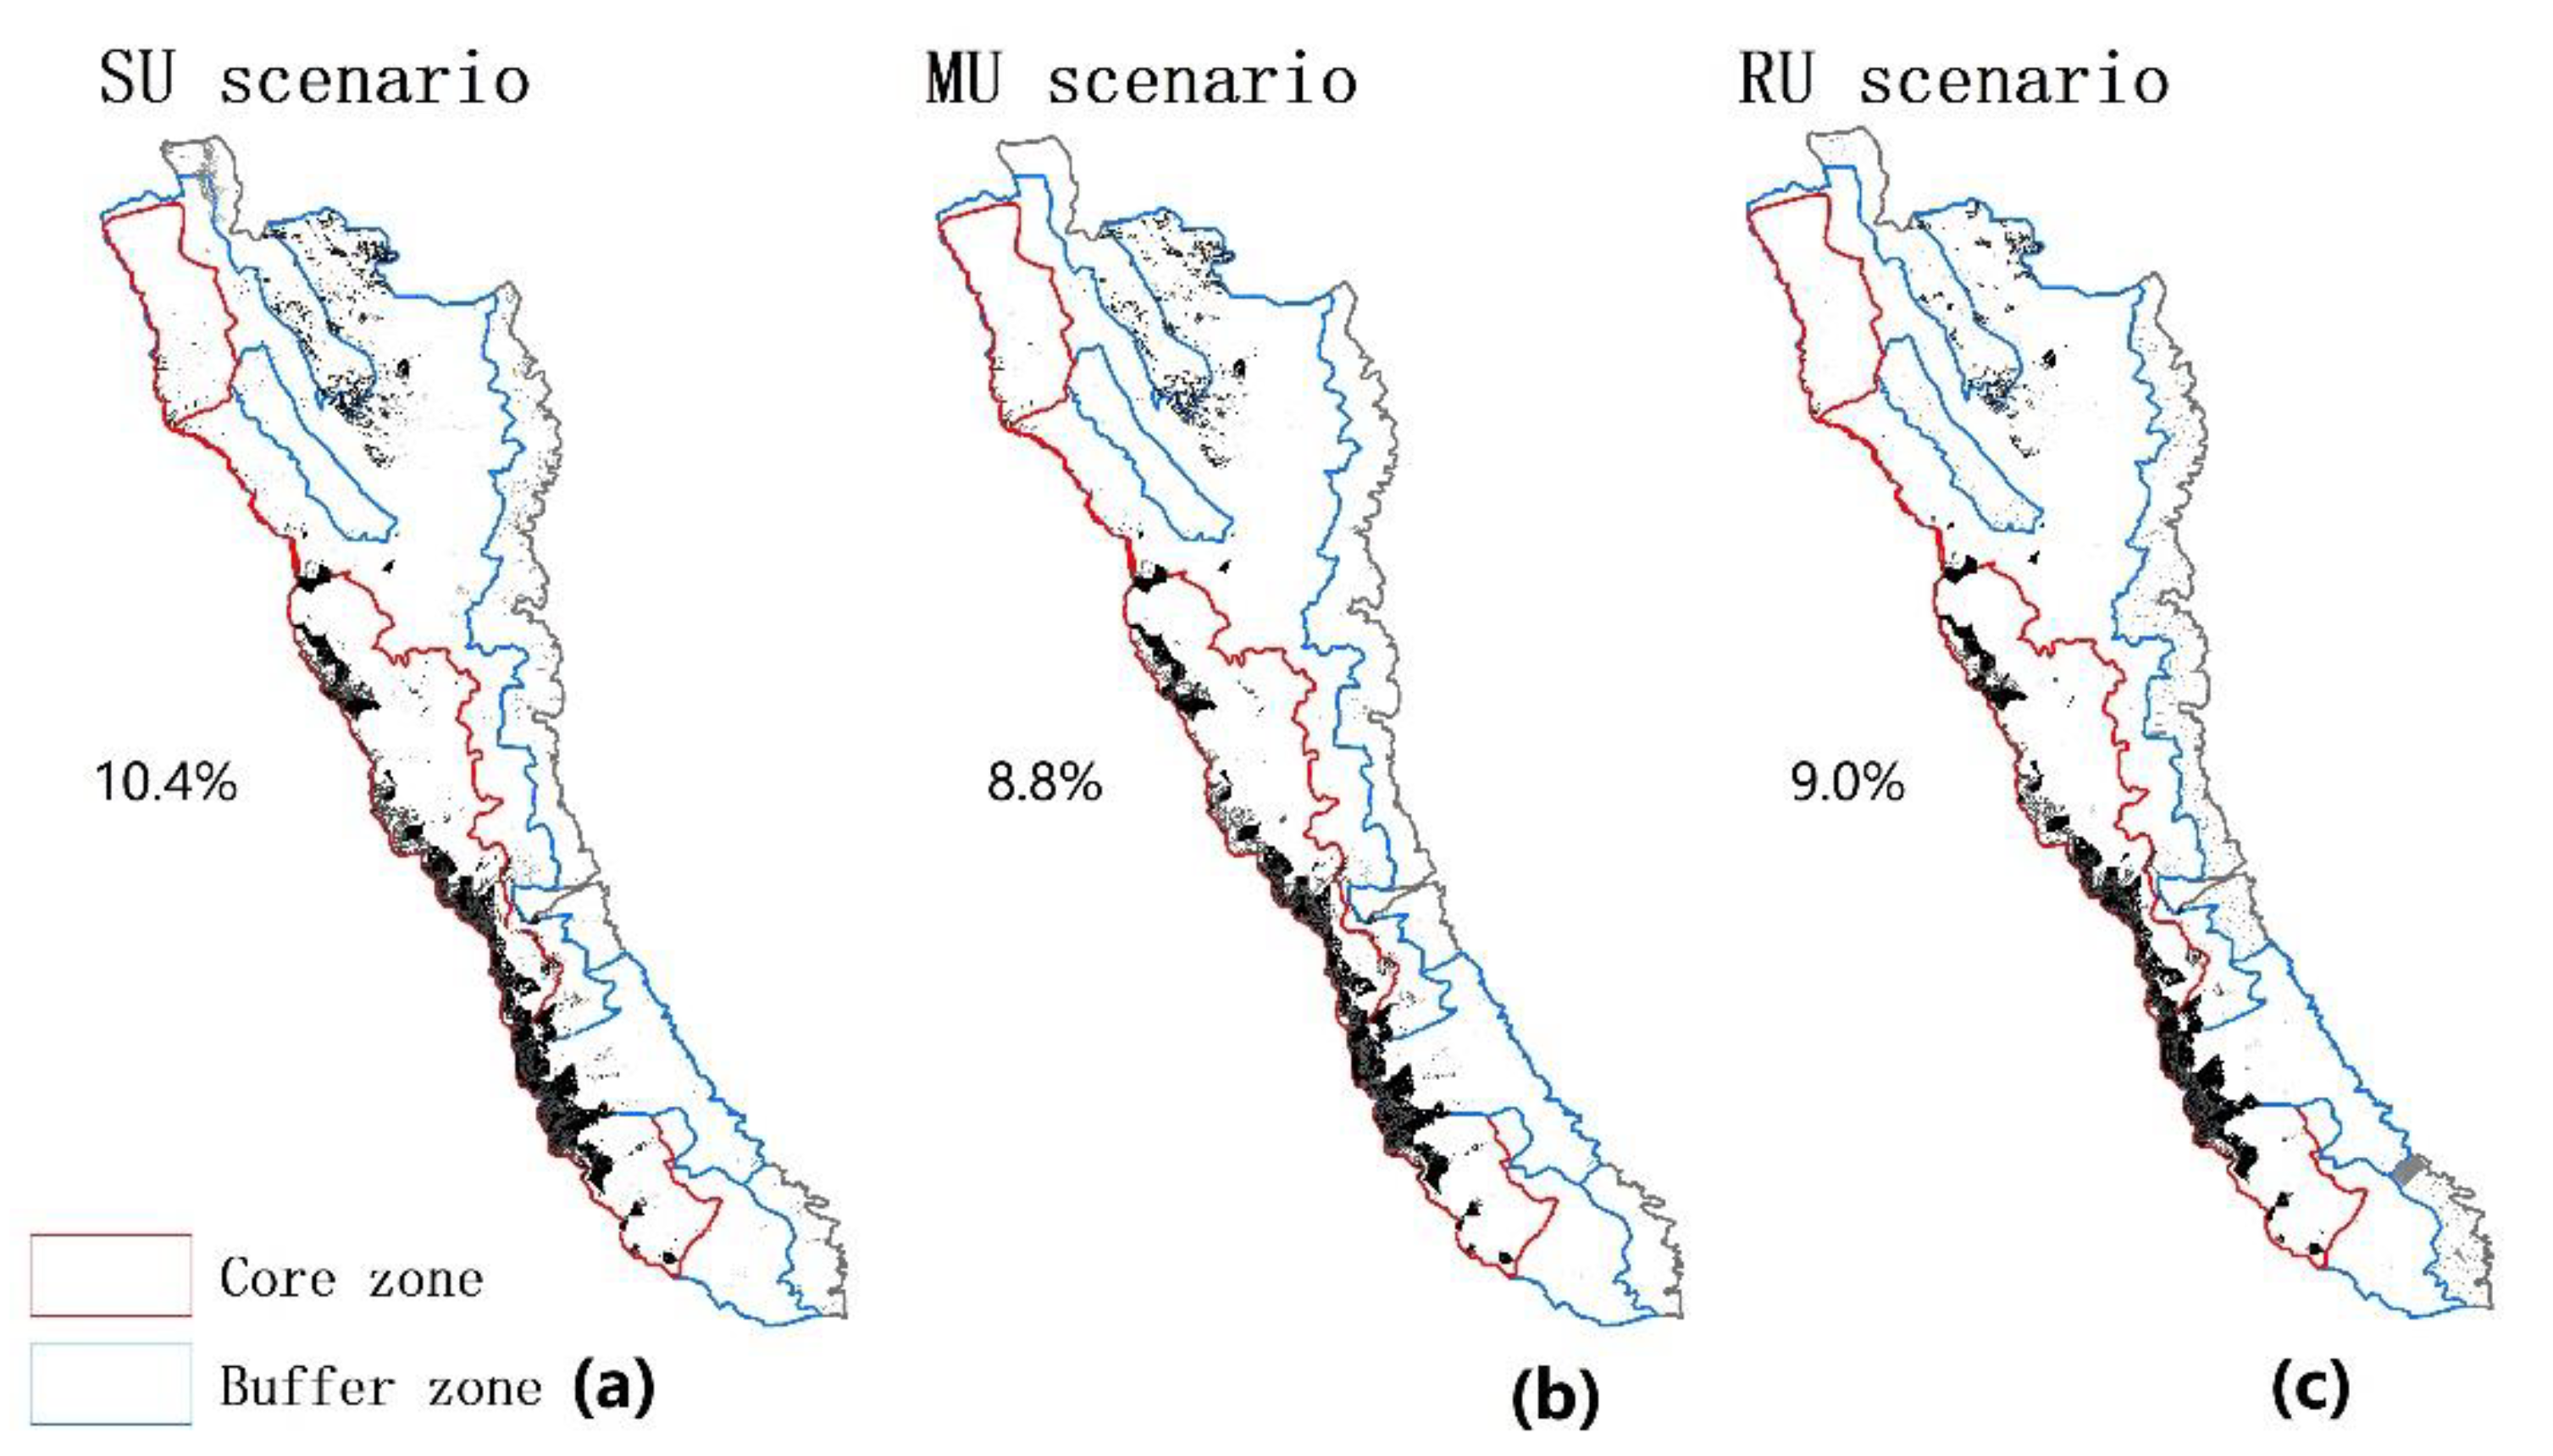
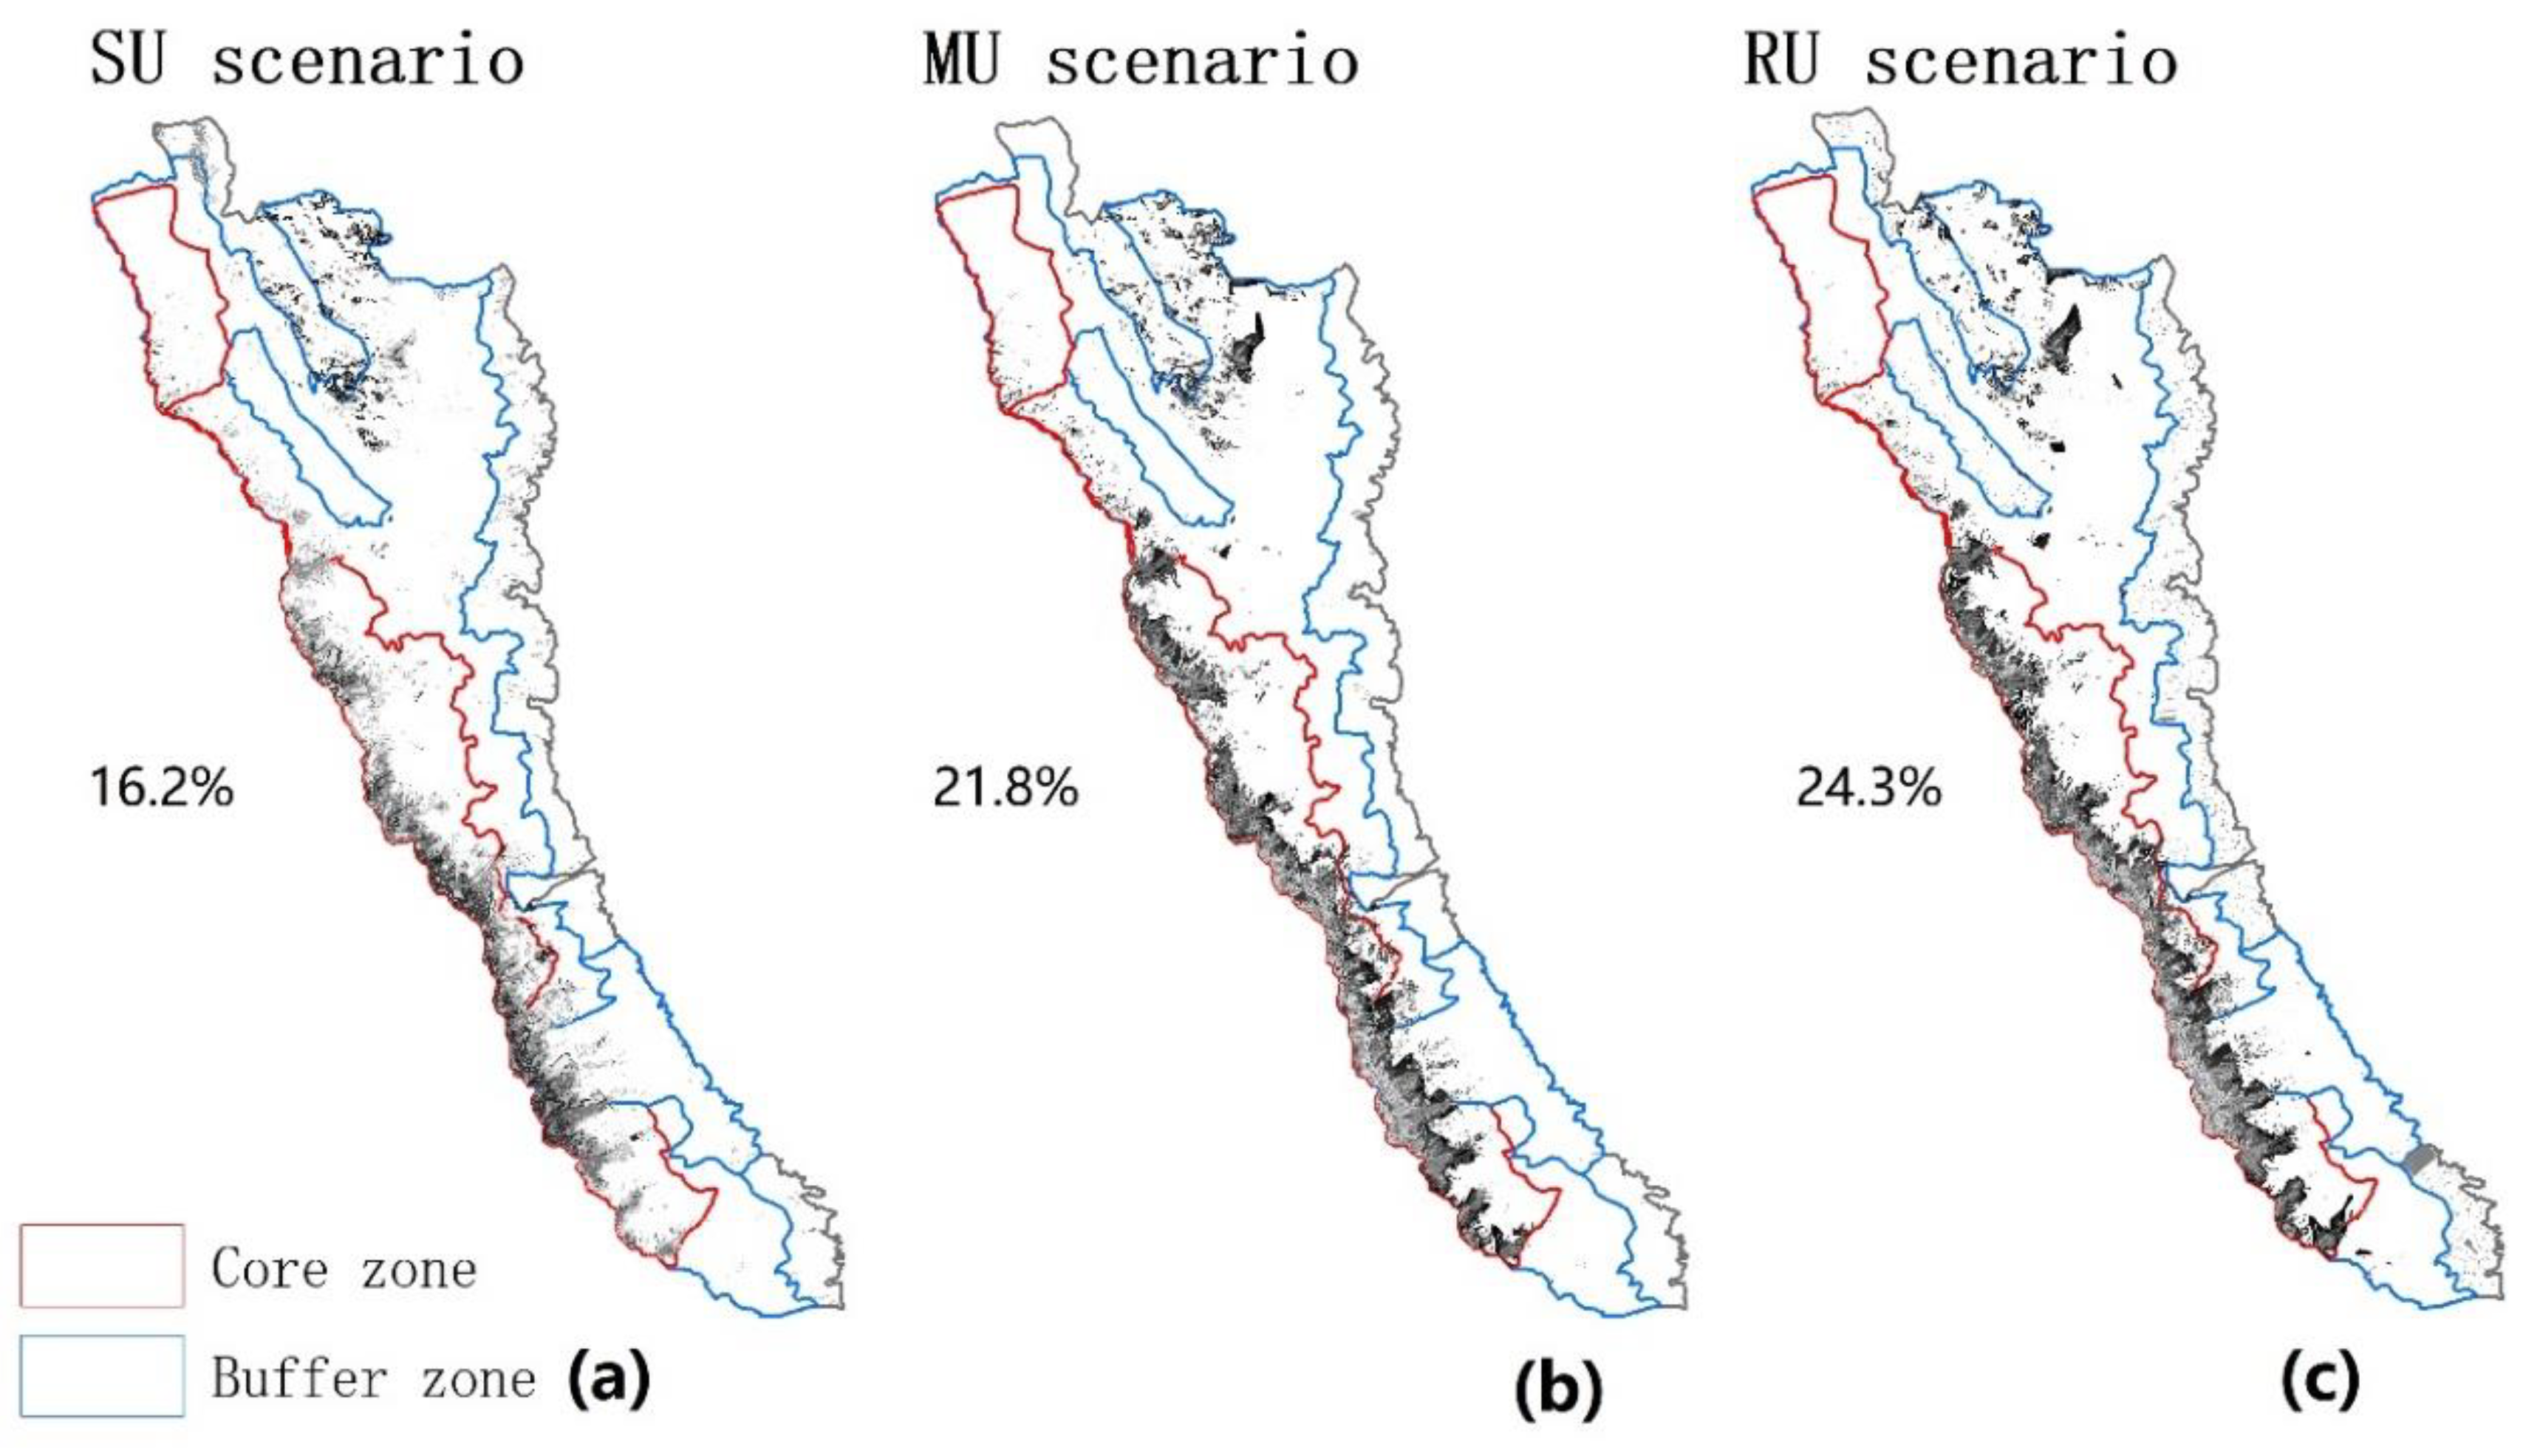
2.5. Selection of the Core Conservation Areas (CCAs)

In order to ensure the quantity and quality of the water provided to the five townships in the reserve, we used hot-spot analysis to identify the most important areas to ensure the quantity and quality of water, and we took these areas as the CCAs.
First, we used the “Raster to point” tool in ArcGIS 10.6 to count the water yield value of each pixel (Figure 3) and ranked these pixels from high value to low value. Then we calculated the area proportion of pixels (the range of each pixel is 30 m × 30 m and there may be multiple pixels with the same value) in the total area of the Cangshan Nature Reserve. Next, we accumulated these sorted pixels one by one until the accumulated value reached the total water demand of five townships (Table 2). Based on these accumulated values, the area proportion of the total area of the reserve occupied by the pixels to which these values belong can be obtained (Figure 4). Finally, we used the “Raster calculator” tool in ArcGIS 10.6 to find these pixels with high water yield value and identified the CCAs with high water yield (Figure A1).
We took the ratio of nutrient load to the total water yield as the overall water quality of the reserve. Average N and P contents were indicators of water quality. We calculated excess N and P loads under each scenario based on China’s surface water quality standards (N < 0.2 mg/L, P < 0.02 mg/L, Class I [48]). The calculation method was as follows:
Excess N loads(x) = (Average N content(x) − 0.2) × water yield(x)
Excess P loads(x) = (Average P content(x) − 0.02) × water yield(x)
Average N or P content(x) = N or P loads(x)/water yield(x)
In order to ensure that the water quality in the reserve meets China’s Class I surface water quality standards, the excess N and P loads need to be treated under the 2035 urbanization scenarios. We identified the CCAs with high N and P loads with the same method used for determining the CCAs with high water yield (Figure 4). Then, we overlapped these three types of CCAs (Figure A1, Figure A2 and Figure A3) and, finally, identified the CCAs in the reserve (Figure 5).

2.6. Data Sources and Processing

The data of this study mainly included LULC, climate, soil, digital elevation model, planning documents, geographical ancillary data, and model validation data. LULC remote sensing interpretation maps from 1995 and 2015 are available from a previous study [49]. Seven LULC classes were identified in the study area (Figure 2). Climate data included precipitation and average annual reference evapotranspiration (ET). Precipitation data were obtained from the measured data of Dali University, and a rain gauge was set at every 1000 m in the Cangshan Nature Reserve in 2015. CGIAR provides a global map of potential evapotranspiration based on WorldClim climate data that can be used for the reference ET (https://cgiarcsi.community/data/global-aridity-and-pet-database/). Soil data were obtained from the Second National Soil Survey in China data. Digital elevation model data were obtained from the National Spatial Geography Information Cloud Data (http://www.gisclound.cn/). Ancillary data and model validation data, such as population, administrative boundaries, creeks, water yield, and N and P loads, were obtained from the Dali City Statistical Yearbook (http//cyfd.cnki.com.cn/) and from the literature [43,44,47]. The “Dali Prefecture Urban System Planning (2016–2035)” and “Dali Prefecture Erhai Watershed Spatial Planning (2017–2035)” were obtained from the Dali Bai Autonomous Prefecture People’s Government (http://www.dali.gov.cn/dlrmzf/). All data used the same geographical WGS_1984_UTM coordinate system and were resampled to a spatial resolution of 30 m.

3. Results

3.1. Land-Use Changes from 1995 to 2035

The main land-use types in 1995 and 2015 of Cangshan’s 18-creek watershed included grassland, architectural areas, farmland, forest, shrubland, water, and snow. Land use across the five townships changed significantly over the past 20 years, driven by rapid urbanization and economic development. Farmland in the five townships decreased by 5743.17 ha (−12.93%) and architectural area increased by 3450.51 ha (7.77%) (Table 4).
With the different urbanization processes, the farmland in the five townships under the three different scenarios set in 2035 were predicted to continue to decrease and the architectural areas to continue to increase. Under the SU scenario (Figure 2C), where the urbanization rate was 72% (Table 1), the changes in farmland and architectural areas were −772.83 ha (−1.74%) and 724.32 ha (1.63%), respectively (Table 4). These two types of land-use changes in the five townships, from 2015 to 2035 under the SU scenario, were much smaller than the changes from 1995 to 2015 under the constraints of permanent basic farmland.
Under the MU scenario (Figure 2D) that strictly followed the watershed planning documents, the urbanization rate was 83% (Table 1), and changes in these two land-use types were −1374.57 ha (−3.1%) and 1374.57 ha (3.1%), respectively (Table 4). Mutual conversion between farmland and architectural areas occurred to meet the prescribed urbanization process and the residents’ needs. Under the RU scenario (Figure 2E), where the urbanization rate was 90% (Table 1), farmland had a significant decrease of 3755.34 ha (−8.46%), and architectural areas increased by 4106.7 ha (9.25%) (Table 4), which is comparable to the level of rapid urbanization from 1995 to 2015.
Forest was the dominant type of land use in the reserve. During the 1995–2015 period, most of the farmland and some of the shrubland in Cangshan were converted into forest, driven by the “Grain for Green” policy (Figure 2), totaling 1496.88 ha (Table 4). Under the requirements for the protection effectiveness of the Cangshan Nature Reserve, the forest area will continue to increase. Under the three different urbanization scenarios for 2035, compared to 2015, forest was predicted to increase by 1727.01 ha in the SU scenario, 1923.57 ha in the MU scenario, and 1166.49 ha in the RU scenario (Table 4). In addition, forest was predicted to cover 82% (SU scenario), 83% (MU scenario), and 80% (RU scenario) of the reserve.

3.2. Water Quantity and Quality in the Reserve

Under the different urbanization scenarios for 2035, since the land-use changes in this area were not dramatic, the water yield of the reserve was predicted to not significantly change compared to 2015. Under the SU scenario, the simulated water yield changed from 2.25 × 10⁸ m3 to 2.23 × 10⁸ m3, a decrease of approximately 0.02 × 10⁸ m3. Under the MU scenario, the simulated water yield basically did not change; meanwhile, in the RU scenario, the simulated water yield increased by 0.04 × 10⁸ m3 (Table 3). From the perspective of the spatial distribution of the water yield, the high-yielding water region was mainly concentrated in the region above 3000 m (Figure 1 and Figure 3), and there was no obvious change in the spatial distribution of the water yield from 2015 to 2035 (Figure 3).
The variability in the distribution of nutrient loads remained stable and expanded at a lower rate (Figure 3). The N loads were predicted to decrease under each of the scenarios in 2035: −0.19 × 10⁵ kg under the SU scenario, −0.57 × 10⁵ kg under the MU scenario, and −0.43 × 10⁵ kg under the RU scenario. On the contrary, P loads showed different changes under different scenarios in the future. Under the SU scenario, the P loads were predicted to decrease by 0.16 × 10³ kg, but under the MU and RU scenarios, were predicted to increase by 0.26 × 10³ and 0.91 × 10³ kg, respectively (Table 3).
The average N and P contents in 2015 were 0.267 and 0.0200 mg/L, respectively. Under the 2035 different scenarios, the N content was predicted to be reduced to 0.262 mg/L under the SU scenario, 0.243 mg/L under the MU scenario, and 0.244 mg/L under the RU scenario. In terms of P content, except for the SU situation (0.0196 mg/L), P content was predicted to increase to 0.0213 mg/L under the MU scenario and 0.0237 mg/L under the RU scenario (Table 3).

3.3. Spatial Distribution of Core Conservation Areas (CCAs) in the Reserve

The water demand of the five townships from the reserve will undoubtedly be higher in 2035 than in 2015. The total water demand of the five townships was predicted to increase by 954.55 × 10⁴ m3 (18.36%) under the SU scenario, 1659.07 × 104 m3 (31.91%) under the MU scenario, and 2218.13 × 104 m3 (42.67%) under the RU scenario (Table 2). In addition, the water demand was predicted to account for 27.6%, 30.5%, and 32.4% of the total water yield of each scenario. According to the cumulative curves shown in Figure 4a, with the increase in water demand, the area of high water yield in the reserve was predicted to gradually increase from 11.3% to 14.0%.
In order to ensure that the water quality in the reserve could meet of China’s Class I surface water quality standards, N should be reduced by 13,725.75 kg (SU scenario), 9613.30 kg (MU scenario), and 10,152.54 kg (RU scenario). Meanwhile, the P loads need to be reduced by 283.55 kg (MU scenario) and 854.17 kg (RU scenario) (Table 2).
By aggregating pixels with high N loads, we observed that the largest CCAs were in the SU scenario (10.4%) followed by the RU scenario (9.0%) and the MU scenario (8.8%) (Figure 4b). The distribution of CCAs with high N loads and CCAs with high water yields were roughly similar (Figure A1 and Figure A2). In terms of excess P loads, the cumulative curve shows that the CCAs with high P loads were only 0.2% (MU scenario) and 0.55% (RU scenario) in the reserve (Figure 4c). The distribution of CCAs with high P loads were almost scattered and negligible on the spatial map (Figure A3).
By overlaying these three types of CCAs, the CCAs in the reserve were finally predicted to cover 16.2% (SU scenario), 21.8% (MU scenario), and 24.3% (RU scenario) of the reserve and are mainly distributed in the current core and buffer zones (Figure 5).

4. Discussion

At present, the economic value of ecosystem services, such as water supply and water purification, has been determined in the Cangshan Nature Reserve [50]. However, monetary value cannot evaluate the spatial and temporal changes of the reserve and, thus, cannot provide stakeholders with a clear understanding of the spatial distribution of the ecosystem services in said reserve toward better providing reasonable suggestions for the future management of the reserve and to support the sustainable development of Cangshan’s 18-creek watershed. In this paper, we designed an integrated approach to identify the core conservation areas of the Cangshan Nature Reserve under different urbanization scenarios. We used the temporal and spatial changes in ecosystem services in the Cangshan Nature Reserve in 2035 based on scenario simulations, and we selected two ecosystem services (i.e., water yield and nutrient loads) to represent the water quality and quantity provided by the reserve—key factors to ensure the urbanization and human well-being of the townships surrounding the reserve. This integrated approach can identify the areas most in need of conservation under different scenarios to make the management of PAs more targeted toward finding a balance between ecological protection and regional development needs.
Identifying and determining key areas based on ecosystem services and scenario analysis has always been an important and effective way for regional sustainable management. Researchers have designed a coastal and marine spatial plan called Integrated Coastal Zone Management (ICZM) based on this approach in Belize. They focused on applying different management in each area that was characterized by having different ecosystem services [51]. In the Tampere region of Finland, researchers combine ecosystem services with land-use plans to answer practical needs in land-use management. They pay more attention to the actual needs of the specific areas for ecosystem services compared to the Belize case [52]. In the Qiantang River watershed in China, researchers have also worked out the most appropriate regional development scenarios to maintain and improve ecosystem services concerning mainly the impact of future land management plans on the ecosystem services in key areas [53]. In the management of PAs in China, ecosystem services often focus on the value of the entire PA. Most previous studies have emphasized the high value of ecosystem services in PAs within a region [21,22,23,24] and a lack of discussion on the spatial distribution of specific ecosystem services and high-value areas within the PAs as well as their future changes compared with the above research. Herein, we wanted to incorporate these methods of studying ecosystem services and future regional development into the management system of PAs. In addition, we wanted to know which areas in PAs need to be better protected given future changes in ecosystem services so as to better improve the effectiveness of PA management and support the sustainable development of the communities surrounding PAs. Our integrated approach could serve as a reference for other PA management systems in China.
In this paper, we found that forest occupied 70.9% of the area of the Cangshan Nature Reserve in 1995, meeting the 70% forest coverage requirement of the Cangshan Protection and Management Regulations. In 2015, forest accounted for 76% of the reserve in 2015 (Figure 2 and Table 4), which is consistent with the 79% forest coverage of the reserve in a previous study [54]. Under our different predicted urbanization scenarios, the forest coverage of the reserve was predicted not to exceed 83%. Changes in ecosystem services largely depend on changes in land use [55,56], meaning that the ecosystem services in the reserve will not change significantly. Our research confirmed that the water yield and nutrient loads in the reserve will not change more than 10% on average under the different urbanization scenarios (Figure 3 and Table 3); thus, we can draw the conclusion that the ecosystem services provided by the reserve in the future will be stable. Therefore, the reserve will be able to provide sufficient ecosystem services to its surrounding townships in the future. Even in the RU scenario, the water demand of the townships was predicted not to exceed 33% of the water yield in the reserve, which would meet the needs of urbanization and would not have a serious impact on the river ecology of the reserve.
However, despite the development of the Cangshan Nature Reserve and townships in a relatively safe supply and demand environment, under the “rescue protection” policy in the past, the management of PAs in China has been chaotic and unreasonable. The Cangshan Nature Reserve also has similar problems. In recent years, stakeholders have implemented some positive management measures. From the perspective of sustainable utilization of water resources, they rationally planned the functions of water bodies, the location of water intake, the amount of water taken, and the method of water intake to give full play to the best benefits of water resources. In addition, they banned the use and development of groundwater resources in the Cangshan Nature Reserve and quarrying of rocks and sand near river courses. Moreover, stakeholders may need more intuitive spatial information to improve the efficiency of PA management to support sustainable development. Therefore, we need to identify and strengthen supervision of the key areas in the Cangshan Nature Reserve that provide ecosystem services. To this end, we combined scenario analysis and hot-spot analysis to determine the CCAs of the Cangshan Nature Reserve in future urbanization scenarios of Cangshan’s 18-creek watershed. We found that it was necessary to set a sufficient amount of area in the reserve (16.2% areas in the SU scenario, 21.8% areas in the MU scenario, 24.3% in the RU scenario) as CCAs (Figure 5) in order to ensure the water quantity and quality of the townships surrounding the reserve in the watershed, which means that stakeholders need to pay more attention to managing approximately one-fifth of the area of the reserve in the future. Moreover, such attention needs to be applied to specific management strategies, such as for functional zoning of the reserve. Functional zoning of PAs in China has always been a hot issue in the construction of “Ecological Civilization”. The important functional zones in the Cangshan Nature Reserve are mainly the core zone, buffer zone. We found the CCAs to be concentrated in the core zone and buffer zone of the reserve and almost all of them were above 3000 m (Figure 1 and Figure 5). Targeted and effective management in high-altitude areas requires more support. Therefore, these areas require a concentration of funds and professionals for ensuring better supervision and protection in future.
In addition, Functional zoning is one of the important ways of China’s protected area management. Stakeholders of protected areas across the country are actively exploring reasonable zoning methods. It is important to consider both protection and regional sustainable development needs when using a series of established rules and regulations to adjust boundaries, instead of simply redrawing boundaries [57]. The current zoning management of protected areas in China focuses more on the protection of wildlife and important habitats. It has not attracted widespread attention in the protection of ecosystem services. Our study has shown that the distribution of CCAs also provides important reference information for stakeholders to merge and re-divide the functional zones of the reserve based on ecosystem services. Other protected areas can also identify key ecosystem services based on their main protection objectives and regional sustainable development needs. This can make China’s protected areas have a more reasonable and comprehensive reference in the process of zoning reform, and help improve the effectiveness of protection.

Author Contributions

Conceptualization, J.X. and W.W.; methodology, J.X. and W.W.; software, J.X., G.F. and M.C.; validation, J.X., W.W. and J.L.; formal analysis, J.X.; investigation, J.X. and W.W.; resources, W.W., J.X., Y.L. and W.X.; data curation, W.W. and W.X.; writing—original draft preparation, J.X.; writing—review and editing, W.W., J.L. and J.X.; visualization, J.X.; supervision, J.L., W.W.; project administration, W.W. and J.L.; funding acquisition, W.W. All authors have read and agreed to the published version of the manuscript.

Funding

This work was supported by the National Natural Science Foundation of China (NSFC #31300453) and The National Key R&D Program of China (No. 2016YFC0503304).

Acknowledgments

Some of the data have been provided by Institute of Eastern-Himalaya Biodiversity Research, Dali University. All assistance received has been greatly appreciated.

Conflicts of Interest

The authors declare no conflict of interest.

Appendix A

Table A1. Comparison of actual ecosystem services of Cangshan Nature Reserve in 2015 and the results simulated of the InVEST model.
Ecosystem ServicesActual ValueSimulated ValueRelative Error (%)
Water yield (× 108 m3)2.232.250.9
Nitrogen loads (× 105 kg)6.326.02−4.7
Phosphorus loads (× 103 kg)4.834.52−6.4
Table A2. Relative error of water demand prediction.
Actual Water Demand in 2015Water Demand of MU Scenario under DocumentsPrediction Water Demand of MU ScenarioRelative Error (%)
Residential water
(× 104 m3)
593.9714501392.53−3.96
Livestock breeding water (× 104 m3)278.24240223.73−6.78
Agricultural water
(× 104 m3)
3181.8726622558.47−3.89
Enterprise water
(× 104 m3)
1144.2825422682.705.54
The total water demand (× 104 m3)5198.366152.916857.43−0.53

Appendix B

Figure A1. Spatial distribution of the core conservation areas (CCAs) with high water yield under the 2035 scenarios (SU: slow urbanization; MU: moderate urbanization; RU: rapid urbanization): (a) CCAs account for 11.3% of Cangshan Nature Reserve under SU scenario, (b) CCAs account for 12.8% of Cangshan Nature Reserve under MU scenario, (c) CCAs account for 14.0% of Cangshan Nature Reserve under RU scenario.
Sustainability 12 09395 g0a1
Figure A2. Spatial distribution of the core conservation areas (CCAs) with high nitrogen loads under the 2035 scenarios (SU: slow urbanization; MU: moderate urbanization; RU: rapid urbanization): (a) CCAs account for 10.4% of Cangshan Nature Reserve under SU scenario, (b) CCAs account for 8.8% of Cangshan Nature Reserve under MU scenario, (c) CCAs account for 9.0% of Cangshan Nature Reserve under RU scenario.
Sustainability 12 09395 g0a2
Figure A3. Spatial distribution of the core conservation areas (CCAs) with high phosphorus loads under the 2035 scenarios (SU: slow urbanization; MU: moderate urbanization; RU: rapid urbanization): (a) CCAs account for 0.0% of Cangshan Nature Reserve under SU scenario, (b) CCAs account for 0.2% of Cangshan Nature Reserve under MU scenario, (c) CCAs account for 0.55% of Cangshan Nature Reserve under RU scenario.
Sustainability 12 09395 g0a3

References

  1. Watson, J.E.; Dudley, N.; Segan, D.B.; Hockings, M. The performance and potential of protected areas. Nature 2014, 515, 67–73. [Google Scholar] [CrossRef] [PubMed]
  2. Corlett, R.T. Safeguarding our future by protecting biodiversity. Plant Divers. 2020, 42, 221–228. [Google Scholar] [CrossRef] [PubMed]
  3. Tuanmu, M.-N.; Jetz, W. A global 1-km consensus land-cover product for biodiversity and ecosystem modelling. Glob. Ecol. Biogeogr. 2014, 23, 1031–1045. [Google Scholar] [CrossRef]
  4. Zafra-Calvo, N.; Garmendia, E.; Pascual, U.; Palomo, I.; Gross-Camp, N.; Brockington, D.; Cortes-Vazquez, J.-A.; Coolsaet, B.; Burgess, N.D. Progress toward Equitably Managed Protected Areas in Aichi Target 11: A Global Survey. BioScience 2019, 69, 191–197. [Google Scholar] [CrossRef] [PubMed]
  5. Morea, J.P. A framework for improving the management of protected areas from a social perspective: The case of Bahía de San Antonio Protected Natural Area, Argentina. Land Use Policy 2019, 87, 104044. [Google Scholar] [CrossRef]
  6. Li, J.; Wang, W.; Axmacher, J.C.; Zhang, Y.; Zhu, Y. Streamlining China’s protected areas. Science 2016, 351, 1160. [Google Scholar] [CrossRef] [PubMed]
  7. Chape, S.; Harrison, J.; Spalding, M.; Lysenko, I. Measuring the extent and effectiveness of protected areas as an indicator for meeting global biodiversity targets. Philos Trans. R. Soc. B Biol. Sci. 2005, 360, 443–455. [Google Scholar] [CrossRef] [Green Version]
  8. Gong, M.; Fan, Z.; Zhang, X.; Liu, G.; Wen, W.; Zhang, L. Measuring the effectiveness of protected area management by comparing habitat utilization and threat dynamics. Biol. Conserv. 2017, 210, 253–260. [Google Scholar] [CrossRef]
  9. Lopez-Rodriguez, F.; Rosado, D. Management effectiveness evaluation in protected areas of southern Ecuador. J. Environ. Manag. 2017, 190, 45–52. [Google Scholar] [CrossRef]
  10. Millennium Ecosystem Assessment. Ecosystems and Human Well-Being; Island Press: Washington, DC, USA, 2005. [Google Scholar]
  11. Wang, J.; Zhai, T.; Lin, Y.; Kong, X.; He, T. Spatial imbalance and changes in supply and demand of ecosystem services in China. Sci. Total Environ. 2019, 657, 781–791. [Google Scholar] [CrossRef]
  12. Doak, D.F.; Bakker, V.J.; Goldstein, B.E.; Hale, B. What is the future of conservation? Trends Ecol. Evol. 2014, 29, 77–81. [Google Scholar] [CrossRef] [PubMed]
  13. Reid, W.V.; Mooney, H.A.; Capistrano, D.; Carpenter, S.R.; Chopra, K.; Cropper, A.; Dasgupta, P.; Hassan, R.; Leemans, R.; May, R.M. Nature: The many benefits of ecosystem services. Nature 2006, 443, 749. [Google Scholar] [CrossRef] [PubMed]
  14. Cowling, R.M.; Egoh, B.; Knight, A.T.; O’Farrell, P.J.; Reyers, B.; Rouget, M.; Roux, D.J.; Welz, A.; Wilhelm-Rechman, A. An operational model for mainstreaming ecosystem services for implementation. Proc. Natl. Acad. Sci. USA 2008, 105, 9483–9488. [Google Scholar] [CrossRef] [PubMed] [Green Version]
  15. Graves, R.A.; Pearson, S.M.; Turner, M.G. Species richness alone does not predict cultural ecosystem service value. Proc. Natl. Acad. Sci. USA 2017, 114, 3774–3779. [Google Scholar] [CrossRef] [Green Version]
  16. Hummel, C.; Poursanidis, D.; Orenstein, D.; Elliott, M.; Adamescu, M.C.; Cazacu, C.; Ziv, G.; Chrysoulakis, N.; van der Meer, J.; Hummel, H. Protected Area management: Fusion and confusion with the ecosystem services approach. Sci. Total Environ. 2019, 651, 2432–2443. [Google Scholar] [CrossRef]
  17. Lanzas, M.; Hermoso, V.; de-Miguel, S.; Bota, G.; Brotons, L. Designing a network of green infrastructure to enhance the conservation value of protected areas and maintain ecosystem services. Sci. Total Environ. 2019, 651, 541–550. [Google Scholar] [CrossRef]
  18. Reid, W.V. Millennium Ecosystem Assessment; World Resources Institute: Washington, DC, USA, 2005. [Google Scholar]
  19. Kumar, P. The Economics of Ecosystems and Biodiversity: Ecological and Economic Foundations; UNEP/Earthprint: Nairobi, Kenya, 2010. [Google Scholar]
  20. Díaz, S.; Demissew, S.; Carabias, J.; Joly, C.; Lonsdale, M.; Ash, N.; Larigauderie, A.; Adhikari, J.R.; Arico, S.; Báldi, A. The IPBES Conceptual Framework—Connecting nature and people. Curr. Opin. Environ. Sustain. 2015, 14, 1–16. [Google Scholar] [CrossRef] [Green Version]
  21. Ninan, K.; Kontoleon, A. Valuing forest ecosystem services and disservices—Case study of a protected area in India. Ecosyst. Serv. 2016, 20, 1–14. [Google Scholar] [CrossRef] [Green Version]
  22. Hein, L. Economic benefits generated by protected areas: The case of the Hoge Veluwe forest, the Netherlands. Ecol. Soc. 2011, 16, 16. [Google Scholar] [CrossRef] [Green Version]
  23. Min, W.; Xiangzhao, F.; Liang, W.; Qun, G.; Qiurui, Z.; Chunxiu, T. The evaluation of ecological service value in a typical grassland nature reserve under the context of global climate changes. J. Desert Res. 2015, 35, 1700–1707. [Google Scholar]
  24. Hu, S.; Zhang, L. Study on the Management of the Nature Reserves Based on Evaluation of Ecosystem Service Value in Tibet: A Case of Gongbu Nature Reserve. Prog. Geogr. 2010, 29, 217–224. [Google Scholar]
  25. Costanza, R.; d’Arge, R.; De Groot, R.; Farber, S.; Grasso, M.; Hannon, B.; Limburg, K.; Naeem, S.; O’neill, R.V.; Paruelo, J. The value of the world’s ecosystem services and natural capital. Nature 1997, 387, 253–260. [Google Scholar] [CrossRef]
  26. Ludwig, D. Limitations of economic valuation of ecosystems. Ecosystems 2000, 3, 31–35. [Google Scholar] [CrossRef]
  27. Raymond, C.M.; Singh, G.G.; Benessaiah, K.; Bernhardt, J.R.; Levine, J.; Nelson, H.; Turner, N.J.; Norton, B.; Tam, J.; Chan, K.M. Ecosystem services and beyond: Using multiple metaphors to understand human–environment relationships. BioScience 2013, 63, 536–546. [Google Scholar] [CrossRef] [Green Version]
  28. Nieto-Romero, M.; Oteros-Rozas, E.; González, J.A.; Martín-López, B. Exploring the knowledge landscape of ecosystem services assessments in Mediterranean agroecosystems: Insights for future research. Environ. Sci. Policy 2014, 37, 121–133. [Google Scholar] [CrossRef]
  29. Fagerholm, N.; Käyhkö, N.; Ndumbaro, F.; Khamis, M. Community stakeholders’ knowledge in landscape assessments—Mapping indicators for landscape services. Ecol. Indic. 2012, 18, 421–433. [Google Scholar] [CrossRef]
  30. Brown, G.; Fagerholm, N. Empirical PPGIS/PGIS mapping of ecosystem services: A review and evaluation. Ecosyst. Serv. 2015, 13, 119–133. [Google Scholar] [CrossRef]
  31. Goldstein, J.H.; Caldarone, G.; Duarte, T.K.; Ennaanay, D.; Hannahs, N.; Mendoza, G.; Polasky, S.; Wolny, S.; Daily, G.C. Integrating ecosystem-service tradeoffs into land-use decisions. Proc. Natl. Acad. Sci. USA 2012, 109, 7565–7570. [Google Scholar] [CrossRef] [Green Version]
  32. Zank, B.; Bagstad, K.J.; Voigt, B.; Villa, F. Modeling the effects of urban expansion on natural capital stocks and ecosystem service flows: A case study in the Puget Sound, Washington, USA. Landsc. Urban Plan. 2016, 149, 31–42. [Google Scholar] [CrossRef]
  33. Alarcon, G.G.; Ayanu, Y.; Fantini, A.C.; Farley, J.; Schmitt Filho, A.; Koellner, T. Weakening the Brazilian legislation for forest conservation has severe impacts for ecosystem services in the Atlantic Southern Forest. Land Use Policy 2015, 47, 1–11. [Google Scholar] [CrossRef]
  34. Sun, X.; Li, F. Spatiotemporal assessment and trade-offs of multiple ecosystem services based on land use changes in Zengcheng, China. Sci. Total Environ. 2017, 609, 1569–1581. [Google Scholar] [CrossRef] [PubMed]
  35. Fan, M.; Shibata, H. Simulation of watershed hydrology and stream water quality under land use and climate change scenarios in Teshio River watershed, northern Japan. Ecol. Indic. 2015, 50, 79–89. [Google Scholar] [CrossRef]
  36. Fan, P.F.; Yang, L.; Liu, Y.; Lee, T.M. Build up conservation research capacity in China for biodiversity governance. Nat. Ecol. Evol. 2020, 4, 1162–1167. [Google Scholar] [CrossRef] [PubMed]
  37. Xu, W.; Pimm, S.L.; Du, A.; Su, Y.; Fan, X.; An, L.; Liu, J.; Ouyang, Z. Transforming Protected Area Management in China. Trends Ecol. Evol. 2019, 34, 762–766. [Google Scholar] [CrossRef] [PubMed] [Green Version]
  38. Zhang, Y.-B.; Wang, Y.-Z.; Phillips, N.; Ma, K.-P.; Li, J.-S.; Wang, W. Integrated maps of biodiversity in the Qinling Mountains of China for expanding protected areas. Biol. Conserv. 2017, 210, 64–71. [Google Scholar] [CrossRef]
  39. Tonghui, M.; Cai, L.; Guangchun, L. The spatial overlapping analysis for China’s natural protected area and countermeasures for the optimization and integration of protected area system. Biodivers. Sci. 2019, 27, 758–771. [Google Scholar] [CrossRef]
  40. Geneletti, D.; van Duren, I. Protected area zoning for conservation and use: A combination of spatial multicriteria and multiobjective evaluation. Landsc. Urban Plan. 2008, 85, 97–110. [Google Scholar] [CrossRef]
  41. Zhang, Z.; Sherman, R.; Yang, Z.; Wu, R.; Wang, W.; Yin, M.; Yang, G.; Ou, X. Integrating a participatory process with a GIS-based multi-criteria decision analysis for protected area zoning in China. J. Nat. Conserv. 2013, 21, 225–240. [Google Scholar] [CrossRef]
  42. Lin, J.; Li, X. Conflict resolution in the zoning of eco-protected areas in fast-growing regions based on game theory. J. Environ. Manag. 2016, 170, 177–185. [Google Scholar] [CrossRef]
  43. Tao, R.; Zhao, Y. Investigation and Analysis of Water Volume of 18-creek in Cangshan Mountain, Dali, Yunnan. Yangtze River 2015, 46, 44. [Google Scholar]
  44. Zhai, Y.; Zhou, C.; Liu, C. An analysis on the spatial and temporal distribution of precipitation of eighteen creeks’ watershed in Cangshan Mountain. J. Yunnan Univ. (Nat. Sci. Ed.) 2017, 39, 618–623. [Google Scholar] [CrossRef]
  45. Sharp, R. InVEST User Guide—InVEST 3. 7. 0 Documentation; The Natural Capital Project, Stanford University: Stanford, CA, USA; University of Minnesota: Minneapolis, MN, USA, 2018. [Google Scholar]
  46. He, C.; Zhang, D.; Huang, Q.; Zhao, Y. Assessing the potential impacts of urban expansion on regional carbon storage by linking the LUSD-urban and InVEST models. Environ. Model. Softw. 2016, 75, 44–58. [Google Scholar] [CrossRef]
  47. Zhai, Y.; Zhou, C.; Liu, C. Allocation and Management of Water Resource from the Perspective of Water Rights—A Case Study of Cangshan Eighteen Creeks. J. Kunming Univ. Sci. Technol. (Nat. Sci. Ed.) 2017, 42, 136–144. [Google Scholar] [CrossRef]
  48. EPBPRC. Environmental Quality Standards for Surface Water 2002, (GB 3838-2002); Environmental Protection Bureau: Beijing, China, 2002. [Google Scholar]
  49. Jin, Y.; Zhu, Y.; Wang, W. Changes of Ecosystem Service Functions of Dali Bai Autonomous Prefecture in Yunnan Province. Ecol. Econ. 2016, 32, 130–134. [Google Scholar]
  50. Zhai, Y.; Liu, C. Evaluation of Function of Aquatic Ecosystem and Its Economic Value in Eighteen Creeks of Cangshan. China Rural Water Hydropower 2015, 5, 77–80. [Google Scholar] [CrossRef]
  51. Arkema, K.K.; Verutes, G.M.; Wood, S.A.; Clarke-Samuels, C.; Rosado, S.; Canto, M.; Rosenthal, A.; Ruckelshaus, M.; Guannel, G.; Toft, J. Embedding ecosystem services in coastal planning leads to better outcomes for people and nature. Proc. Natl. Acad. Sci. USA 2015, 112, 7390–7395. [Google Scholar] [CrossRef] [Green Version]
  52. Tammi, I.; Mustajärvi, K.; Rasinmäki, J. Integrating spatial valuation of ecosystem services into regional planning and development. Ecosyst. Serv. 2017, 26, 329–344. [Google Scholar] [CrossRef] [Green Version]
  53. Sun, X.; Zhang, Y.; Shen, Y.; Randhir, T.O.; Cao, M. Exploring ecosystem services and scenario simulation in the headwaters of Qiantang River watershed of China. Environ. Sci. Pollut. Res. Int. 2019, 26, 34905–34923. [Google Scholar] [CrossRef]
  54. Chen, B.; Liu, F.; Wang, W.; Li, J. Assessment of forest conservation in the Cangshan Nature Reserve based on propensity score matching. Biodivers. Sci. 2017, 25, 999–1007. [Google Scholar] [CrossRef] [Green Version]
  55. Delphin, S.; Escobedo, F.; Abd-Elrahman, A.; Cropper, W. Urbanization as a land use change driver of forest ecosystem services. Land Use Policy 2016, 54, 188–199. [Google Scholar] [CrossRef] [Green Version]
  56. Sun, X.; Crittenden, J.C.; Li, F.; Lu, Z.; Dou, X. Urban expansion simulation and the spatio-temporal changes of ecosystem services, a case study in Atlanta Metropolitan area, USA. Sci. Total Environ. 2018, 622, 974–987. [Google Scholar] [PubMed]
  57. Hull, V.; Xu, W.; Liu, W.; Zhou, S.; Viña, A.; Zhang, J.; Tuanmu, M.-N.; Huang, J.; Linderman, M.; Chen, X.; et al. Evaluating the efficacy of zoning designations for protected area management. Biol. Conserv. 2011, 144, 3028–3037. [Google Scholar] [CrossRef]
Figure 1. The location of the study area—Cangshan’s 18-creek watershed.
Sustainability 12 09395 g001
Figure 2. Actual land-use and land-cover (LULC) changes between 1995 (A) and 2035 (B) and future LULC scenarios in Cangshan’s 18-creek watershed. The LULC in the slow urbanization (C), moderate urbanization (D), and rapid urbanization (E) scenarios.
Sustainability 12 09395 g002
Figure 3. Scenarios for the spatial distribution of the water yield and nutrient loads in the Cangshan Nature Reserve from 2015 to 2035 (SU, slow urbanization; MU, moderate urbanization; RU, rapid urbanization).
Sustainability 12 09395 g003
Figure 4. The cumulative curve of the core conservation areas (CCAs) selected under the 2035 scenarios (SU, slow urbanization; MU, moderate urbanization; RU, rapid urbanization). Area (%) represents the area occupied by CCAs in Cangshan Nature Reserve; (a) CCAs selection with water demand (11.3% under SU, 12.8% under MU, 14.0% under RU); (b) CCAs selection with excess nitrogen loads (9.0% under SU, 8.8% under MU, 10.4% under RU); (c) CCAs selection with excess phosphorus loads (0.2% under MU, 0.55% under RU).
Sustainability 12 09395 g004
Figure 5. Spatial distribution of the core conservation areas (CCAs) under the 2035 scenarios (SU: slow urbanization; MU: moderate urbanization; RU: rapid urbanization): (a) CCAs account for 16.2% of Cangshan Nature Reserve under SU scenario, (b) CCAs account for 21.8% of Cangshan Nature Reserve under MU scenario, (c) CCAs account for 24.3% of Cangshan Nature Reserve under RU scenario.
Sustainability 12 09395 g005
Table 1. Urbanization of the Cangshan 18-creek watershed between the 2015 and 2035 scenarios (SU, slow urbanization; MU, moderate urbanization; RU, rapid urbanization).
199520152035 SU2035 MU2035 RU
The urban population (K)30.697.5153.7192.8265.7
Total population (K)170.0191.2213.6232.1295.2
Urbanization rate (%)1851728390
Table 2. Multiple scenarios of water demand and excess nitrogen/phosphorus loads in 2015 and 2035 (SU, slow urbanization; MU, moderate urbanization; RU, rapid urbanization).
Residential Water
(× 104 m3)
Livestock Breeding Water
(× 104 m3)
Agricultural Water
(× 104 m3)
Enterprise Water
(× 104 m3)
The Total Water Demand
(× 104 m3)
Excess N Loads
(kg)
Excess P Loads
(kg)
2015593.97278.243181.871144.285198.36--
2035 SU1050.39247.592831.372023.566152.9113,725.75-
2035 MU1392.53223.732558.472682.706857.439613.60283.55
2035 RU1984.78129.311478.733823.677416.4910,152.54854.17
Table 3. Scenarios of water yield, nitrogen/phosphorus loads, and average nitrogen/phosphorus content from 1995 to 2035 (SU, slow urbanization; MU, moderate urbanization; RU, rapid urbanization) in the Cangshan Nature Reserve.
20152035 SU2035 MU2035 RU
Water yield
(× 108 m3)
2.252.232.252.29
Nitrogen loads
(× 105 kg)
6.025.835.455.59
Phosphorus loads
(× 103 kg)
4.524.364.785.43
Average nitrogen content (mg/L)0.2670.2620.2430.244
Average Phosphorus content (mg/L)0.02000.01960.02130.0237
Table 4. Land-use and land-cover (LULC) scenarios from 1995 to 2035 (SU, slow urbanization; MU, moderate urbanization; RU, rapid urbanization) in Cangshan’s 18-creek watershed.
LULC1995
Area (ha)
(%)
2015
Area (ha)
(%)
2035 SU
Area (ha)
(%)
2035 MU
Area (ha)
(%)
2035 RU
Area (ha)
(%)
Grassland2439.99
(5.49)
3770.46
(8.49)
3322.44
(7.48)
3558.15
(8.01)
3809.70
(8.58)
Architectural areas4079.07
(9.19)
7529.58
(16.96)
8253.90
(18.59)
8904.15
(20.05)
11,636.28
(26.21)
Farmland12,759.03
(28.73)
7015.86
(15.80)
6243.03
(14.06)
5641.29
(12.70)
3260.52
(7.34)
Forest20,128.95
(45.33)
21,625.83
(48.70)
23,352.84
(52.59)
23,549.40
(53.03)
22,792.32
(51.33)
Water98.19
(0.22)
67.50
(0.15)
67.50
(0.15)
56.25
(0.13)
12.06
(0.03)
Snow1467.99
(3.31)
1701.99
(3.83)
1238.04
(2.79)
1056.33
(2.38)
793.53
(1.79)
Shrubland3431.52
(7.73)
2693.52
(6.07)
1926.99
(4.34)
1639.17
(3.69)
2100.33
(4.73)
Total44,404.74 (100)
Publisher’s Note: MDPI stays neutral with regard to jurisdictional claims in published maps and institutional affiliations.

