Price Differentiation and Inventory Decisions in a Socially Responsible Dual-Channel Supply Chain with Partial Information Stochastic Demand and Cannibalization

Department of Operations Management and Business Statistics, Sultan Qaboos University, Al Seeb Al Khoudh SQU SEPS, Muscat OM 123, Oman
Sustainability 2020, 12(22), 9577; https://doi.org/10.3390/su12229577
Submission received: 26 September 2020
/
Revised: 6 November 2020
/
Accepted: 9 November 2020
/
Published: 17 November 2020
(This article belongs to the Collection Advanced Methodologies for Sustainability Assessment: Theory and Practice)
Abstract
:Corporate social responsibility (CSR) has received much of the attention in supply chain management, in particular the pricing decisions. Most existing models that enable CSR integration into pricing decisions in a supply chain context assume deterministic demand and focus on a single distribution channel. Despite the fact that dual-channel supply chain (DCSC) has received popularity, most pricing decisions models in DCSC assume fixed and deterministic market share distribution between channels, and no demand leakages (cannibalization). This paper addresses these gaps by proposing a CSR enabled DCSC model pricing in which the demand is considered to be stochastic and market share distribution between channels in DCSC is optimally determined using a differentiation price, and the impact of demand leakages is also taken into consideration. Unlike existing studies, which only enable pricing decisions due to deterministic demand consideration, comprehensive DCSC models are proposed that provide joint decisions framework on CSR investment, pricing, and inventories. We have also considered the extension of the demand scenario when the distribution of demand is unknown. The two most common coordination schemes, the centralized (integrated) and the decentralized coordination is explored for the three demand situations: (i) deterministic demand; (ii) stochastic with full information; and (iii) stochastic with partial information. We are able to find analytical (closed-form) solutions for most demand situations. The centralized coordination performed better compared to the decentralized for all demand scenarios. The models are benchmarked when the demand is stochastic with known and unknown distributions, as well as, the case of the deterministic demand. A detailed numerical analysis is also presented in order to study the impact of using the price differentiation for market segmentation, the demand leakage, and partial knowledge on the stochastic demand on the players’ decisions and revenues in the supply chain.
1. Introduction
The last two decades of tremendous growth in global e-commerce have witnessed several manufacturers adopting the online channel to achieve growth in revenues, sales, and market share [1,2,3,4,5,6,7]. Several reports show that e-commerce is growing at an impressive pace. For example, the work of [8] estimates e-commerce share in U.S. retail sales to increase over 17% by 2022. Experts in the B2B commerce domain emphasize the importance of developing an online (direct) distribution channel for the businesses that have hitherto relied solely on the traditional brick and mortar (regular) channel. The growth of online channel sales can also be partly attributed to the improvements in efficiencies of logistic services offered by third- and fourth-party logistic vendors [9,10]; for example, FedEx, DHL, UPS, ARAMEX, and others. Many leading manufacturers, including Apple, Samsung, Sony, Dell, Nike, IBM, Hewlett-Packard, Panasonic, and Estee Lauder and Chapters, among others, have adopted a dual channel strategy, which includes selling through direct online marketing in addition to the traditional channel to sell their products [11,12,13,14,15]. Dual-channel supply chain (DCSC) is gaining importance in supply chain management research and is largely seen as one of the important enablers to e-commerce.
The motivation for manufacturers to redesign distribution using DCSC is often aimed at exploiting the heterogeneity among customer preferences with respect to buying from a direct online channel versus a physical store. This heterogeneity of customer preferences often manifests in terms of the heterogeneity of the customers’ willingness-to-pay (WTP) and is exploited in a DCSC using price differentiation. In a DCSC, the price differentiation strategy from revenue management (RM) discipline may be employed to manage the firm’s market share among the two channels, regular and online, in order to optimize the total revenue. Today, many supply chain partners are also exploiting the DCSC to achieve sustainability goals including greening, closed-loop, carbon emissions reduction, and corporate social responsibility (CSR) through collaborative effort. Such efforts enhance the ability of the supply chains (SCs) to effectively achieve sustainability objectives and are also known to improve image and market share of the collaborating firms within the SC. Both price differentiation for revenue improvement and CSR constitute the main motivations behind the development of the models proposed in this paper.
Price differentiation is among the primary tools of revenue management (RM) [16,17,18,19,20]. Price differentiation implies offering same, slightly different, or substitutable product/services at distinct prices to customers. The price differentiation is often implemented through various means including distribution channels, product warranties, and re-saleable returns. Although, price differentiation can yield high profitability, the probability of achieving high profits can be dented by the cannibalization effect or the demand leakages between segments and demand related uncertainties [6,7,21]. The latter can adversely limit the benefit that a firm can reap through price differentiation. Therefore, any model developed in order to determine optimal price differentiation needs to account for the cannibalization or the demand leakage effects.
Recently, several organizations including for-profit firms are showing strong interest in corporate social responsibility (CSR) initiatives. CSR activities from business entities have contributed positively to gain reputation, customers’ choice preference, and cooperation avenues [22,23]. Although the significance of CSR in achieving positive outcomes for society is well established, the importance of CSR activities in supply chain has not been recognized adequately. Nevertheless, supply chain operations are among the single largest entity to be impacted by CSR initiatives [24,25,26]. Within supply chain operations, DCSCs present an interesting opportunity that can benefit from CSR initiatives. Thus, DCSC businesses can utilize both CSR initiatives and price discrimination (differentiation) to achieve higher profitability while being socially responsible at the same time.
This paper is motivated by exploring an integrated framework for pricing and CSR decisions in a DCSC while experiencing an uncertain demand situation. The price differentiation strategy from RM can be used in conjunction with a DCSC as it enables dividing a firm’s market share among two market segments, regular/in-store and online/direct. Within DCSC, in the regular channel the products are offered to customers having a higher WTP; hence, the CSR activities are introduced with an investment. In the regular market segment, the products are offered at a full price that is relatively higher compared to the discount price at which the products are offered in the online (direct) channel. Whereas in the direct online channel, customers have a relatively lower WTP, and, therefore, the products are offered at a discounted price and investment in CSR activities is zero. This paper develops coordination models for a DCSC within a systematic framework and determine solutions, closed-form or otherwise, for decisions, including: (i) Best differentiation price to optimally divide manufacturer’s market share into two channels, traditional regular and direct (online) distribution channel; (ii) Pricing and inventory (production) quantity decisions for the manufacturer and the retailer; and (iii) CSR investment decisions. These objectives are explored for three distinct demand situations: (a) Demand is deterministic and dependent on pricing and CSR activities; (b) Demand is stochastic and dependent on pricing and CSR activities; (c) Demand is stochastic and dependent on CSR activities, however, the information is only partially known. The DCSC coordination models are developed for integrated and decentralized analysis coordination. The case of deterministic demand is utilized to benchmark with the case of stochastic demand with full and partial demand information availability.
The remainder of the paper is organized as follows. In Section 2, a brief literature review is presented, and the main contribution of this paper is highlighted. In Section 3, the DCSC is analyzed for price-and-CSR dependent deterministic demand (hereafter referred to as deterministic demand). Both the integrated (centralized) and decentralized analysis coordination models are developed. The structural properties are explored, and an analytical (closed-form) solution is obtained. Section 4 extends the dual-channel coordination models for the case of price-and-CSR dependent stochastic demand (hereafter referred to as stochastic demand). The analysis is carried out to develop an efficient solution for computing the control decisions in the DCSC. Section 5 revisits the DCSC coordination when partial demand information is available for the stochastic demand to SC players. The shape of the distribution is unknown. For the partial information case, a closed-form solution is derived. A detailed numerical experimentation is presented in Section 6 for each of the three demand scenarios. The impact of market segmentation using the price differentiation tool exercised by the manufacturer is shown. Lastly, conclusions are drawn and limitations of the current research and directions for the future are discussed in Section 7.
2. Literature Review
2.1. Dual-Channel Supply Chain
Research problems in dual-channel supply chain (DCSC) has attracted the attention of several academics and practitioners in the supply chain domain [1,27,28,29,30,31]. The author of [32] has presented a comprehensive overview of DCSC where several aspects and challenges pertaining to DCSC are addressed. Pricing in a DCSC has been one of the cardinal areas with significant contributions from the research and practitioner communities. We briefly review some contemporary studies. The authors of [33] explored dynamic pricing strategy and coordination in a DCSC with the consideration of service value. The authors of [34] investigated the money back guarantees and personalized pricing within DCSC. The authors of [29] researched free riding and service-cost sharing aspects in a DCSC. The authors of [35] modeled DCSC decisions when the demand is dependent on pricing and delivery time. The authors of [36] explored greening a DCSC and developed pricing strategies for green and non-green products. The authors of [30] proposed coordination models for pricing and greening decisions in a three-tier DCSC. The authors of [37] explored differentiated product distribution in DCSCs. The authors of [38] modeled pricing and inventory decisions in a DCSC with learning and forgetting effects. The authors of [39] proposed models for pricing and coordination in a DCSC with consideration of green quality and sales effort. The authors of [40] explored pricing policies in a DCSC with greening investment and sales effort facing uncertain demand. The authors of [41] explored the choice of DCSC with the consideration of environmental responsibility. The authors of [42] explored maximizing profitability in a DCSC with disruption risks. The authors of [43] researched pricing decisions in a DCSC with asymmetric information. The work of [7] considered pricing differentiation and inventory coordination decisions in a single distribution channel green supply chain experiencing stochastic demand. The authors of [6] presented a DCSC model with risk-aversion and proposed a mean-variance analysis for green supply chain with cannibalization effects. The authors of [44] explored government reward-penalty schemes in a DCSC. The reference pricing effects along with quality decisions within a DCSC context are reported in [45]. The authors of [46] looked at joint pricing and greening decision in a DCSC using a robust probabilistic approach. The authors of [47] investigated product customization in a DCSC with greening consideration. The authors of [48] explored contracts in a DCSC for a socially responsible manufacturer.
2.2. Price Differentiation and Cannibalization
Models incorporating the effect of demand leakages into the determination of optimal differentiation price yield solutions that can prevent the adverse effects of inter-segment demand leakages on the profitability owing to suboptimal market segmentation [6,7,21,49]. Most quantitative models in DCSC literature often allocate a fixed fraction of the market share to the regular and online channels and often fail to take demand leakages into consideration [28,43,50,51,52,53]. In most of these studies, the fixed market share split is assumed between the distribution channels. This assumption can be very restrictive in capturing customers’ heterogeneity and dynamic preferences [16,54,55]. Phillips [16] addressed this problem by proposing a price differentiation approach to divide the market share into segments while considering demand leakages. Later, some contemporary studies have utilized the price differentiation approach for splitting the realized market share into segments using price differentiation and considered the demand leakage effect or cannibalization; for example, [6,7,56,57,58,59]. In contrast to this, [21] have considered demand leakages assuming that the market share is exogenously divided among market segments. They considered pricing fencing in defense against the demand leakages among the existing market segments. Recently, [55] developed models for price optimization for omnichannel retailers while accounting for customer heterogeneity.
2.3. Corporate Social Responsibility
The integration of corporate social responsibility (CSR) into supply chain operations has attracted many contemporary studies. The authors of [25] investigated the relationship between CSR and SC relationship and reported a positive impact of CSR initiatives. Later, [60] also published findings that point out how purchasing benefited from CSR initiatives. The authors of [61] documented a literature review and proposed a conceptual framework for sustainable SC. There is an increasing trend in the supply chain management literature focusing on CSR initiatives in supply chain and beyond. The rapid expansion in the literature can be easily judged from the systematic literature review using the bibliometric analytical tools on CSR in supply chains by [62]. In Table 1, a brief review of the published research interfacing CSR initiatives within supply chain operations is presented. There are several contemporary quantitative models in supply chain, including DCSC, which have considered consumer surplus as CSR initiative [3,63,64,65,66,67,68,69,70]. On the other hand, studies in [23,71,72,73] have considered a CSR related investment within supply chain operations. Noticeably, apart from [23,72], most of the studies in SC with consideration of CSR have assumed deterministic demand. These papers have also considered an additional investment for CSR activities, which enables augmentation of the anticipated stochastic demand. The authors of [74] studied periodic replenishment policies with CSR considerations in a pharmaceutical SC. Contemporary studies in dual-channel supply chain have considered a range of topics including cost sharing contract, governance mechanism, advertising, and the case of partial demand information [75,76,77,78,79]. A list of recent studies includes [26,33,80,81,82,83,84]. Noticeably, apart from [72] and [23] most of the studies in SC with consideration of CSR have assumed deterministic demand. These papers have also considered an additional investment for CSR activities, which enables augmentation of the anticipated stochastic demand.
2.4. Partial Demand Information
As stated earlier, most studies in SC have assumed deterministic demand despite the demand uncertainty inherent in all real world SCs. Few studies in the SC literature considered stochastic demand, however, these assume an exogenous (fixed) price. Most SC models typically adopt newsvendor problem framework when the demand is stochastic [98]. The consideration of pricing along with the inventory decisions is a rather recent development in SC with CSR [23,96]. Yet many of these studies considered only a single distribution channel. Another important aspect of SC coordination is the availability of demand information. In many real-world settings, the demand information in an SC may not be fully known. Limited information about the distribution of demand in terms of mean or variance may be available [58,59,99,100,101,102]. With the application to SC, there are limited studies that have considered the partial information on demand [6,7,23,31].
In Table 1, a comparative analysis is presented, which appropriately positions the work of this paper. The proposed models in this study enable optimal market share division among the two channels in a DCSC and also mimic the cannibalization between channels. To the best of the authors’ knowledge, this may be the first research study that integrates this aspect of optimizing the market segments using price differentiation as a tool in and CSR initiatives within a DCSC.
3. Deterministic Demand
The coordination between a single manufacturer and a retailer offering two products using the DCSC is studied. The two products are sold at distinct prices using two separate channels. Figure 1 illustrates the proposed dual-channel supply chain (DCSC) model. Within a leader-follower setting, the manufacturer acts as the leader in the market and splits the market share having a linear price sensitivity into two segments using a differentiation price . The differentiation price is used as the market segmentation tool that divides a monolithic market share into two market segments subject to linear price sensitivity of . Linear price-dependent deterministic demand is among the widely used for modeling pricing decisions in many applications, such as newsvendor pricing [101,103], pricing in RM [21,104,105], and pricing in SC [106,107,108]. Earlier studies have noted linear price-dependent demands are most suited because their ability to capture many realistic market scenarios while yet being simplistic [21,101,106,109]. The notion of differentiation price in the presence of cannibalization (demand leakage) described earlier in [16], and extended by a number of studies to split the market share optimally among the two market segments [6,7,23,58,59]. Table 2 details the list of notations that are used in the paper.
Next, between the two channels, the first channel is the regular market channel in which the manufacturer offers products at a wholesale price to the retailer whereas the retailer offers the product at price to the customer. The terms retailer and seller are used interchangeably in this paper. In the regular market channel, the manufacturer invests a onetime investment as a contribution towards CSR. However, the retailer does not contribute any investment for its CSR. The manufacturer’s CSR activities can include investment in social activities such as greening efforts, health care plan development, social welfare programs, human skill capital building, and similar activities. This investment from the manufacturer is assumed to increase the demand by a deterministic perceived valuation of , where is the coefficient of the CSR effect and and are assumed to be non-negative [23,72]. For both the regular and online direct channels, the cost to the manufacturer is per unit. The manufacturer also uses online direct channel for selling its products while not contributing for CSR in this channel. The manufacturer offers the products in the online direct channel at price .
The manufacturer uses a differentiation price to segment the perceived deterministic market demand where , into regular channel demand and the online channel demand . Since the CSR investment is only applied to the regular channel, the perceived demand is incremented by an additional amount . Therefore, the enhanced demand function with CSR investment is perceived as . A fraction is leaked due to customer cannibalization, also referred to as a demand leakage, from the retail (regular) channel to online (direct) channel due to the price differential . This results in an actual adjusted demand perceived, for the regular channel and for the online channel. Figure 1 shows these details in a graphical manner.
In the proposed SC coordination models, two distinct channel coordination schemes are considered:
- (i)
- Centralized analysis: The manufacturer and seller simultaneously decide the , and
- (ii)
- Decentralized analysis: The manufacturer decides the and whereas the seller responds by setting the .
As shown in Figure 1, in the case of decentralized analysis the manufacturer decides on the wholesale price , the online (direct) channel price , and CSR investment initiatives for the retail (regular) channel whereas the retailer or seller decides on , the price offered to the customer.
The model development is based on a number of assumptions that are commonly observed in supply chain quantitative models [6,7,106,110]. Here, we only list essential assumptions of the proposed models.
- Both the manufacturer and the retailer exhibit risk-neutral behavior and are rational decision makers.
- An information symmetry exists in the SC, hence, both players (manufacturer and retailer) have the same information.
In the following subsections in Section 2, the accent is used to denote deterministic demand or price-and-CSR dependent deterministic demand. Accents are also employed for modeling stochastic demand with full and partial information in later sections.
3.1. Centralized Analysis (Deterministic Demand)
In the case of centralized analysis, the manufacturer exercises the control for managing the total revenues in the SC,
Thus, in the centralized analysis, the optimization problem is
Subject to:
The nonlinear program in Equations (3)–(6) can be solved using Karush Kuhn Tucker (KKT) analysis. The analytical (closed-form) solution is reported in Proposition 1. To distinguish the centralized analysis from the corresponding decentralized analysis, we use superscript, ”.
Proposition 1.
In centralized analysis, the best response with respect to SC decisions () are
Also.
Proof.
See Appendix A. □
Proposition 1 enables determining the control decisions () in their closed-form solutions for the centralized analysis. Next, substituting these control decisions () into profit (revenue) function in Equation (3), we obtain the expression for the optimal revenue (profit) of the centralized analysis in Equation (10).
We remark here that in the SC decisions, , and the revenue, the two problem related influencing factors are: the coefficient of the CSR effect and the proportion of demand leakage . The effect of and is discussed in Remarks 1 and 2.
Remark 1 describes the effect of on control decisions, through a set of results reported in Table 3. Table 3 shows whether an increase () in increases () or decreases () the values of parameters, and and the conditions under which these results are valid. These conditions are satisfied in most of the real-life applications. For instance, the condition in the first row of Table 2 is true in most real-world examples since the manufacturer usually has a market share due to cost-based pricing [16,56,57]. Moreover, since the price sensitivity is expected to have a greater influence compared to CSR coefficient effect . The customer’s sensitivity toward price is greater than other parameters that influence the demand [111].
Remark 1.
In the centralized analysis, the impact of the coefficient of corporate social responsibility,
is summarized in Table 3.
Likewise Remarks 1 and 2 describe the impact of the proportion of demand leakage on the control parameters, and . These findings are reported in Table 4.
Remark 2.In the centralized analysis, the impact of demand leakage proportion,
, is summarized in Table 4:
As discussed for the results shown in Remark 1, the findings for Remark 2 are likely to be true in most practical applications as since and . Here, we conclude that impact of an increase () in the demand leakage proportion results in an increase in the prices in both the regular and online channels and might necessitate the manufacturer to increase her CSR investment. This can adversely affect the total revenue .
3.2. Decentralized Analysis (Deterministic Demand)
In the decentralized analysis, the manufacturer acts as the leader and decides the wholesale price , CSR investment and direct (online) channel price . The seller is a follower in this Stackelberg game who responds by deciding the retail price . Thus, the manufacturer’s payoff maximization problem is:
Subject to:
Being the follower, the retailer’s revenue maximization problem is
This leader-follower game (also referred to as Stackelberg game) is solved using backward substitution [23,112]. The results of backward substitution are reported in Proposition 2.
Proposition 2.
In decentralized analysis, the best SC decisions, (are
where,.
Proof.
See Appendix B. □
Proposition 2 enables determining a closed-form solution for the DCSC decision on pricing (, , ), and the CSR investment () for the case of decentralize channel coordination while the experiencing deterministic demand. Next, substituting the control decisions, ( into the expressions for manufacturer and seller (retailer) revenues, we obtain the following expressions.
Therefore, the total revenue for the SC is
Similar to the discussion in the case of centralized analysis in Section 3.1, a discussion is presented below to describe the effect of CSR coefficient and proportion of demand leakage on total SC revenue, . Remarks 3 and 4, similar to Remarks 1 and 2, describe the impact of and on decisions ( and SC player payoffs (, ) in the decentralized analysis setting. These analytical results are reported in Table 5 and Table 6, respectively. In Remark 3, similar to Remark 1, the impact of k is explored for the case of decentralized SC coordination. Table 5 reports the impact of increasing () CSR coefficient, k, results in an increase () in control decisions and SC player payoffs (, ) subject the same conditions listed in Table 5. In the forthcoming numerical, it will be shown that these analytical conditions are widely observed for a larger scenario of the applications.
Remark 3.In the decentralized analysis, the impact ofis summarized in Table 5.
In Remark 4, likewise Remark 2, the impact of demand leakage proportion, , is analytically explored, and it is reported in Table 6. In the case of decentralized SC coordination, increasing () results increase in the control parameters, (). While an increase in , that is more demand leakage, yields lower () revenues for SC players (, ).
Remark 4.In the decentralized analysis, the impact ofis summarized in Table 6.
Next, in Remark 5, a reduced form of the decisions is derived when the market segmentation is assumed to be perfect, and demand leakages absent, by setting in Equations (15)–(18).
Remark 5.In perfectly segmented market, , the SC decisions are reduced to
4. Stochastic Demand
We extend the study presented with the price-and-CSR dependent deterministic demand in Section 3 to case of the price-and-CSR dependent stochastic demand. Here, we assume that price-and-CSR dependent stochastic demand, has two components and must be non-negative. First, the price-and-CSR dependent deterministic demand component, as assumed in the section on analysis using deterministic demand in Section 3. The second component is the one independent of the price and CSR investment. The is assumed to have followed a probability distribution function, and a cumulative probability distribution function, . Further is bounded such that, , where, . Both, , and, , are assumed to be continuous and twice differentiable and to follow the strictly increasing generalized failure rate (Yao et al., 2006). The properties of the strictly increasing generalized failure rate are widely observed in several probability distributions functions such as normal, uniform, log-normal, etc.
In addition to the graphical model of price-and-CSR dependent deterministic model presented in Figure 1, the stochastic case needs manufacturer and retailer (seller) to make decisions with respect to inventory (order/production quantities). Thus, the manufacturer decides on the production quantity , in addition to its pricing decisions () and CSR investment decision . Likewise, the retailer (seller) decides on the retail price and the order quantity . In the case of stochastic demand, the accent is omitted to differentiate it from the mathematical analysis presented for the deterministic demand presented in Section 3.
4.1. Centralized Analysis
In the case of the centralized analysis, we use the script, . The revenue function in Equation (26) is built using the standard newsvendor problem (NVP) with pricing [101,111]. The holding and shortage penalties are ignored.
Subject to:
where, , also .
Thus, the revenue function established in Equation (26) can be reformulated as follows:
where , .
Unlike the cases of price-and-CSR dependent deterministic demand, finding the closed-form solution is difficult due to analytical intractability. Therefore, we suggest a convenient solution using the structural properties of the problem explored in Propositions 3 and 4.
Proposition 3.
In the centralized analysis, the following holds
- 1.
- Given the pricing and CSR investment decisions, () the unique optimal order quantities/inventories are:where,, ,.
- 2.
- Given the pricing and CSR investment decisions (),is jointly concave in optimal order quantities/inventories.
Proof.
See Appendix C. □
Proposition 3 enables determining a closed-form solution for estimating the order quantities (inventories), for any pricing and CSR investment related decisions (), for the case of an integrated channel coordination in SC. We also note here that this closed-form solution is unique and guarantees global optimality.
Next, substituting the optimal order quantity, into Equation (26), the revised problem is presented in Equations (33)–(36). We remark here this problem is reduced to finding out the pricing and CSR investment related decisions.
Subject to:
While analytically assessing the problem stated in Equations (33)–(36), we proposed Proposition 4, which enables determining optimal pricing and CSR investment decisions. However, due to complexity of the solution structure a closed-form is unlikely to be obtained for most demand distributions including the normal distribution.
Proposition 4.
In the centralized analysis, given a production decision,, The optimal price differentiation () and CSR investment decisions () are determined such that
Also,where,,.
Proof.
See Appendix D. □
As we have noted in Proposition 4, a closed-from solution for this problem is inevitable, nevertheless, the results of Propositions 3 and 4 can be utilized in developing an efficient solution procedure for this centralized analysis
- Step 1: Input , , , , , , . Select the probability distribution function for the demand.
- Step 2: Simultaneously solve (numerically) Equations (37)–(39) to determine , and
- Step 3: Set
- Step 4: Determine order quantity/inventory using Equation (32).
4.2. Decentralized Analysis
In the case of decentralized analysis, superscript, is used. The manufacturer’s payoff maximization problem is:
Subject to:
Then the seller’s problem can be written as
Likewise, the centralized analysis in Section 4.1, we have also addressed the order quantities, first for any exogenous (fixed) pricing and CSR investment decisions. Recall here, using backward analysis, the best response from the retailer can be written as stated in Proposition 5 for decisions, ().
Proposition 5.
In the decentralized analysis, the retailer’s best response function is
- 1.
- Maximum price,that satisfies
- 2.
- where.
Proof.
See Appendix E. □
While observing the retailer’s best response function in Proposition 5, these best responses of retailer regarding the price and the inventory are now substituted into the manufacture’s revenue maximization problem. The results are summarized in Proposition 6.
Proposition 6.
In the decentralized analysis, the best decisionsare achieved by solving the following system of Equations
where,,.
Proof.
See Appendix F. □
Likewise, the centralized analysis in Section 4.1, we have utilized the Propositions 5 and 6, in order to develop an efficient solution procedure for this decentralized analysis
- Step 1: Input , , , , , , , and choose the probability distribution for the demand.
- Step 2: Simultaneously solve (numerically) Equations (44)–(47) to determine , and
- Step 3: Set
- Step 4: Determine order quantity/inventory such that , where . and . Also, , .
5. Stochastic Demand with Partial Demand Information
5.1. Centralized Analysis
We recall from the Section 4.1, the revenue maximization problem for the SC is:
Subject to:
Then Equation (48) can be rewritten using , where . That is,
Applying the distribution-free approach based on Scarf’s (1958) rule, we obtain
Notice in Equation (52), . While substituting the expression developed for into Equation (51), we obtained a lower bound, in Equation (53). To segregate price-and-CSR dependent stochastic demand with full information from the partial information case, accent is used. Therefore, a lower bound on revenue function, in Equation (51) is written in Equation (53).
Since revenue function in Equation (53) is unrestricted in order quantities . Next, using the first order optimality conditions , can be written as
where and .
Now, substituting obtained in Equation (50) into Equation (49), and simplifying we get
The term, in Equation (55), can re-written as . We observe here that when , is maximum. This may require developing a worst analysis on the lower bound, . This worst-case analysis is referred to as using an accent, ” “. Consequently, the revised lower bound based on worst-case analysis can be given by
where , .
Finally, for the SC the revised problem can be given by
Subject to:
The revenue maximization problem in Equations (57)–(59) is solved using KKT optimality conditions, and a closed-form solution obtained which is reported in Proposition 7. Given the complexity of the results the properties of these decision are explore numerically.
Proposition 7.
In the centralized analysis, the optimal pricing and CSR investment decisions are
Also,.
Proof.
See Appendix G. □
Using the optimal decisions, () obtained in Equations (60)–(62), we find the optimal revenue in the centralized analysis by substituting these results into the revenue function expression in Equation (57).
5.2. Decentralized Analysis
The decentralized analysis for the case of stochastic demand whose distribution in unknown extends the study reported in Section 4.2.
Subject to:
The retailer’s problem would be:
The revenue function for the retailer can be written as
Following the analysis in Section 5.1, a lower bound can be reformulated using the distribution free approach
Substituting , the revised revenue function for the seller (retailer) , which also constitutes the lower bound on is
Finding the best response on the inventory decision such that
where and
Next, substituting, obtained in Equation (70) into Equation (69), and simplifying yields
The term, in Equation (71) can be re-written as . We observe here that when , is maximum. This can lead us to develop a worst analysis on the lower bound . This worst-case analysis is distinctively presented using an accent “ ”. Thus, the revised lower bound on the retailer (seller)’s revenue is
where , .
The best response function of the retailer determined using the first order optimality condition, can be given by
Using the similar analogy, the manufacturer’s revenue function is
Subject to:
Now using the superscript, , the following closed-form solutions for pricing and CSR investment decisions for the manufacturer are obtained analytically. Proposition 8 reported a closed-form solution for the pricing decisions (, ) and the CSR investment, .
Proposition 8.
In the decentralized analysis, the manufacturer’s pricing and CSR investment decisions are
Proof.
See Appendix H. □
Now, using the manufacturer’s decision from manufacturer in proposition 8 on wholesale price and the CSR investment and substituting these into retailer’s price in Equation (73), we get
Recall here that .
Finally, we substitute the best control decisions in the decentralized analysis () in Equations (77) and (80) to compute the best revenues (profits) for the manufacturer and retailer. Next, in Section 6 a numerical analysis is the presented to explore the properties of the models developed.
6. Numerical Analysis
In this section, a numerical analysis of the proposed models is presented. The data used in the numerical study are adopted from [16]. The basis parameters are: , , , .
6.1. Deterministic Demand
In Table 7, a detailed experimentation study with the price-and-CSR dependent deterministic demand using two channels, integrated and decentralized, is discussed. A sensitivity analysis is presented with the two additional input parameters related to CSR adopted from [23], which are the coefficient of the CSR, , and the demand leakage proportion In this simulation study, the selection values are: and . We clearly observe here that as the proportion of the demand leakage increases, the revenues deteriorate for a given, CSR coefficient, . However, for a given , as increases both the manufacturer and the seller (retailer) are able to achieve better profitability. An increase in results in a greater demand leakage from regular to online channel. In order to minimize the demand leakages, SC players simultaneously sell at increased prices while reducing the difference in the prices of regular and the online channels. While comparing decentralized and centralized analyses, the SC revenues are found to be higher in the case of centralized analysis, , where j = Integrated (joint) channel, = Decentralized analysis. This finding conforms to those reported in earlier studies [23,69,70,91,113]. Similarly, we also observe here, , . The revenues of manufacturer are larger compared to the seller since the manufacturer receives revenues from both channels whereas seller only from the regular channel. Further, when the market responsiveness to CSR is more positive, that is, as increases the manufacturer increases the CSR investment to a greater degree in the centralized analysis compared to the decentralized. That is, .
6.2. Stochastic Demand
The numerical experimentation with the price-and-CSR dependent stochastic demand is reported in Table 8. The findings that are earlier observed with the case of deterministic demand are also noted here. Thus, the numerical experimentation results confirm, , , and when the demand in the SC is stochastic. In contrast to the deterministic demand results reported in Table 6, for the case of the stochastic demand, manufacturer and seller lower the price in response to the stochastic nature of the demand, for integrated and decentralized analyses. Therefore, . Conversely, for the case of stochastic demand, manufacturer and seller stock more inventory compared to the corresponding deterministic case, that is, .
Finally, the numerical experimentation for the stochastic with partial demand information is reported in Table 9. Similar to earlier findings, for the partial demand information too , , also . This is mainly because the stochastic behavior is unknown. To minimize the possibility of worst possible behavior, the manufacturer and seller lower the price to improve the share of price-and-CSR dependent deterministic demand, whose distribution is unknown. Similarly, the CSR investment here, for the decentralized analysis is higher than the corresponding CSR investment by the manufacturer when full information of stochastic demand distribution is available, i.e., . Consequently, we have also observed, for the case of centralized analysis.
6.3. Impact of Differentiation Price
One of the distinguishing contributions of this paper is the use of differentiation price, by the manufacturer for segmenting its market share into two channels, regular and online (direct) channel. The use of the differentiation price enables the manufacturer to optimally segment its market share among the two market channels. To demonstrate the significance of the proposed market segmentation via price differentiation, we conduct numerical simulations. Consistent with related studies [16,114] we have experimented with the fixed price differentiation at and compared the revenue gains and the control decisions (pricing, inventory, and CSR investment) with the corresponding when it is decided by the manufacturer rationally in the decentralized and the centralized analysis settings. We also jointly study the impact of k and compare two scenarios. The first scenario is where the firm does not contribute towards its CSR. This case is regarded as “No CSR”, and the model assigns a value of zero to . The second scenario is when CSR investment is finite and positive; for example, . Figure 2 shows that the total SC revenues are higher when the manufacturer performs segmentation by selecting the best differentiation price in lieu of fixing the differentiation price to a predetermined value. For example, . The CSR investment invariably augments the SC revenues regardless of whether is optimized or predetermined. However, the SC revenue gains improve considerably when the manufacturer selects the best differentiation price, .
A detailed assessment of the split of the revenues for the manufacturer, and retailer, is presented in Figure 3. We observe here that the manufacturer considerably benefits from the exercising the segmentation of its market share into two channels using the best decision on differentiation price, . Further, CSR investment by the manufacturer improves the revenue gains of the manufacturer and the retailer. However, revenue gains from differentiation price decision are significantly higher compared to those realized from CSR investments. While the manufacturer clearly benefits from exercising the market segmentation decision in the decentralized analysis the retailer (seller) does not benefit from market segmentation. For the retailer, the revenues are significantly better when the differentiation price is predetermined by the manufacturer, for example in this simulation study. Another observation is that the rise in the demand leakages deteriorates the revenue gains for both the retailer and the manufacturer. Figure 3 shows the impact of price differentiation on SC players’ (manufacturer and retailer) revenue gains. Likewise Figure 4, studies in the impact of pricing differentiation, and demand leakage proportion, onto the pricing decisions () and the inventory decisions ().
7. Conclusions, Limitations, and Future Research Suggestions
Sustainability is gaining importance in supply chains (SCs). Corporate social responsibility (CSR) is a key aspect of contemporary SCs becoming popular due to governments incentives and societal awareness. Customers nowadays patronize CSR products and firms that are engaged in CSR related initiatives. However, the impact of CSR activities on revenue and other business goals is an important research problem. The problem is of greater importance in dual-channel supply chains (DCSC) since customers’ heterogeneity in the markets can play an important role. The current study investigated the dynamics of pricing and CSR investment and their corresponding impact on the revenues and profitability to the members in the DCSC. The study initiated the investigation with a restrictive assumption of deterministic demand and gradually generalized to consider the DCSC coordination for the stochastic demand with full and partial information of demand distribution. Both integrated and decentralized coordination models provided different insights. This may be the first study to consider the DCSC problem with no restrictions on the proportion of the market share allocated to regular and online market segments. To the best of the authors’ knowledge, the demand leakages between regular and online market segments have seldom been investigated in regard to the DCSC coordination problem. The inclusion of these components was possible because of the utilization of price differentiation tool from revenue management.
The numerical analysis illustrated that centralized analysis is superior compared to the corresponding decentralized analysis in terms of higher revenues regardless of the nature of demand. Further, the changes in demand leakage and the effect of the CSR investment on the revenues and CSR investment are illustrated, which have revealed that the market share distribution between to two distribution channels in DCSC using a price differentiation augments the DCSC revenues compared to fixed market share allocation. Using price differentiation, the SC players are also well positioned to mitigate the adverse effects of demand leakage, also referred to as cannibalization. This evidence is observed in all three-demand situations investigated in this paper, since it yielded superior revenue gains (profitability) when compared to an arbitrarily fixed market share in the presence of cannibalization. The finding using also illustrate that the changes in CSR investment in DCSC could improve the revenue gains for a firm under most demand scenarios, including the case of partial demand information, however, it will be largely be dependent on the extent of cannibalization (demand leakage) and the firm strategy to optimally set the differentiation price for the two distribution channels.
The study can be further enhanced by incorporating other elements such as cooperation between manufacturer and retailer using some well-known SC contracts for sharing revenues. Another avenue would be to consider multiple retailers distribution channel and, therefore, extend beyond DCSC. Decision and controls could also be extended to incorporate decision, and, therefore, the variables of interest such as quality, carbon footprint, tariffs, and emissions. This study is limited to DCSC in which the players are risk-neutral and players’ risk information is fully known to all players within SC. Thus, in a future study, risk aversion may be integrated into the proposed framework. To this avenue, Value-at-risk (VaR), Conditional Value-at-Risk (CVaR), and Mean Variance analysis are some popular assessment criteria that can be employed to render the problem more generalized and capture more real-world aspects of green supply chain coordination. Lastly, the case of partial demand information is only explored for additive linear stochastic demand situation. Although the numerical evidences show it is very competitive to full information case, but the revenue losses could be significant when the stochastic demand behavior is only partially known, and may have followed a modeling framework other than linear additive, such as iso-elastic and multiplicative.
Funding
This research received no external funding.
Conflicts of Interest
The author declares no conflict of interest
Appendix A. Proof of Proposition 1
We drop the accents and superscripts, such that
Here, , . We compute the KKT conditions:
We recall here, . Thus from Equation (A4), we get:
Here, we may have fours scenarios in Equation (A8) refer to the case of pricing.
Based on the analysis presented in Table A1, the only unique solution exists at , , . Replacing these parameters in Equations (A2) through Equation (A5), we obtain:
Solving Equations (A9)–(A11) simultaneously, we get:
Finally, we restore the accent and superscripts, such that .

Table A1.
Scenarios assessment.
| Scenarios | Remarks |
|---|---|
| , | Yields , which fails to achieve price differentiation. Therefore, discarded. |
| , | Infeasible, since Equation (A4) is violated. |
| , | A unique solution is obtainable, , since . Thus, , |
| , | Infeasible, since Equation (A4) is violated, since , thus |
Appendix B. Proof of Proposition 2
Here, we drop the accents and superscripts, such that . Recall here that and .
Using the backward induction, we first find the best response from the retailer by solving the following Lagrange function for the retailer.
Using the KKT optimality condition on L we obtain:
Recall here, ,
Solving Equation (A15), we obtain:
Next, the manufacturer’s Lagrange function would be:
where in Equation (A17), , ,
Subsequently, we get following KKT optimality conditions:
Also
Notice here in Equation (A19), we have a unique solution , since , . This yield, in Equations (A18) through to Equation (A21), we get .
Replacing, , we obtain the following analytical (closed-form) solution:
Finally, we restore the accent and superscripts, .
Appendix C. Proof of Proposition 3
- Part (1)
We have:
The first order optimality condition would be,
which yields:
where in Equation (A30),
- Part (2)
We explore the hessian matrix, here:
Here, , also, .
The first two principal minors, . And the second principal minor, . This proves the joint concavity of in order quantities, .
Appendix D. Proof of Proposition 4
The Langrage function would be:
The KKT optimality conditions are:
Similar to the analysis presented in proof of proposition 1 in Appendix A, we recall here, . Thus, Equation (A35), can only be satisfied, once we have achieved, , and, thus, . This selection also enables to yield market segmentation via using the differentiation price, . That is, . We observe here that, , , , .
Next, simplifying Equation (A33) through Equation (A36) using substitutions, we obtain:
One can solve (numerically) Equations (A37)–(A49) simultaneously to find unique solution for , and . Recall here, optimal price differentiation is . It may also be possible to obtain a closed-form solution for the of some distributions, namely, uniform distribution.
Appendix E. Proof of Proposition 5
- Part (1)
Here,
We find the first order optimality condition yields:
Solving for determining, by setting, results:
In Equation (A42), we have .
- Part (2)
Now, substituting the value of order quantity, into Equation (A40), we the revised revenue function for the retailer, which the function of and only.
We again use the first order optimality condition, to determine the retailer’s best response on the retail price,
In Equation (A44), we can substitute , and ,
Appendix F. Proof of Proposition 6
Like previous analyses, we drop the scripts for convenience, thus ).
where in Equation (A46), .
Using the first order optimality condition, to determine the inventory,
Solving Equation (A47), yields:
where in Equation (A48), we have
Next, the Lagrange function for revenue maximization problem of the manufacturer would be:
where in Equation (A50), is from Equation (A49). Recall, here , , , , .
Incorporating the retailer best response function as constraints in addition to the KKT optimality conditions, we get:
Here in Equation (A53), we have, . This reduces the Equation (A53) to:
Given the complimentary conditions in Equations (A55) and (A56), we have a unique solution, , . This satisfies, Equation (A53), and Equations (A55) and (A56) as we have, Next, we recall here, , , , , , . The following system of nonlinear equation is restored:
We note here that in Equations (A59)–(A62). , , since . Finally, Equations (A59)–(A62), can be solved simultaneous (numerically) to determine the decentralized channel control, ( ).
Appendix G. Proof of Proposition 7
Lagrange function, would be:
We drop the accent, in the forthcoming analysis. The KKT optimality conditions are:
Similar earlier analysis (see, proof of proposition 1), here in Equation (A66), we have a unique solution such that , and . This also satisfies Equations (A68)–(A69), when . Substituting these results into Equations (A64)–(A65), and Equation (A67) and solving for a closed-form solution yield:
Appendix H. Proof of Proposition 8
We drop here the accent, in the forthcoming analysis:
Next, incorporating the best response on price, (see Equation (A70) in appendix G) and substitute into Equation (A73):
Using the KKT optimality conditions, we get
Again, while considering the Equation (A78), we observe here that a feasible solution could be , and . This results in Equations (A75)–(A80) are such that .
Next, we substitute these simplifications into Equations (A75)–(A80), gives a closed-form solution:
Using the manufacturer’s decision on wholesale price, and the CSR investment, and substituting these into retailer’s price, in Equation (A74), we get:
References
- Chiang, W.C.; Chen, J.C.; Xu, X. An Overview of Research on Revenue Management: Current Issues and Future Research. Int. J. Revenue Manag. 2007, 1, 97. [Google Scholar] [CrossRef]
- Xu, G.; Dan, B.; Zhang, X.; Liu, C. Coordinating a Dual-Channel Supply Chain with Risk-Averse under a Two-Way Revenue Sharing Contract. Int. J. Prod. Econ. 2014, 147, 171–179. [Google Scholar] [CrossRef]
- Modak, N.M.; Panda, S.; Sana, S.S.; Basu, M. Corporate Social Responsibility, Coordination and Profit Distribution in a Dual-Channel Supply Chain. Pac. Sci. Rev. 2014, 16, 235–249. [Google Scholar] [CrossRef] [Green Version]
- Modak, N.M.; Panda, S.; Sana, S.S. Channel Coordination, Pricing and Replenishment Policies in Three-Echelon Dual-Channel Supply Chain. Control Cybern. 2015; 44, 481–518. [Google Scholar] [CrossRef] [Green Version]
- Li, B.; Zhu, M.; Jiang, Y.; Li, Z. Pricing Policies of a Competitive Dual-Channel Green Supply Chain. J. Clean. Prod. 2016, 112, 2029–2042. [Google Scholar]
- Raza, S.A.; Govindaluri, S.M. Pricing Strategies in a Dual-Channel Green Supply Chain with Cannibalization and Risk Aversion. Oper. Res. Perspect. 2019, 6, 100118. [Google Scholar]
- Raza, S.A.; Govindaluri, S.M. Greening and Price Differentiation Coordination in a Supply Chain with Partial Demand Information and Cannibalization. J. Clean. Prod. 2019, 229, 706–726. [Google Scholar] [CrossRef]
- Keyes, D. E-Commerce Will Make up 17% of All US Retail Sales by 2022—and One Company Is the Main Reason. Business Insider, Business Insider, 11 August 2017. Available online: www.businessinsider.com/E-Commerce-Retail-Sales-2022-Amazon-2017-8 (accessed on 1 September 2020).
- Zerkte, K. Importance of Information Technologies and Systems (ITS) in the Traceability of the Supply Chain. 2018 Int. Colloq. Logist. Supply Chain Manag. (Logistiqua) 2018, 2147483647, 13–18. [Google Scholar] [CrossRef]
- Imran, M.; Hamid, S.N.B.A.; Aziz, A.; Hameed, W.U. The Contributing Factors towards E-Logistic Customer Satisfaction: A Mediating Role of Information Technology. Uncertain Supply Chain Manag. 2019, 7, 63–72. [Google Scholar] [CrossRef]
- Hua, G.; Wang, S.; Cheng, T.C.E. Price and Lead Time Decisions in Dual-Channel Supply Chains. Eur. J. Oper. Res. 2010, 205, 113–126. [Google Scholar] [CrossRef]
- Tsay, A.A.; Agrawal, N. Channel Conflict and Coordination in the E-Commerce Age. Prod. Oper. Manag. 2009, 13, 93–110. [Google Scholar] [CrossRef] [Green Version]
- Kouvelis, P.; Chambers, C.; Wang, H. Supply Chain Management Research and Production and Operations Management: Review, Trends, and Opportunities. Prod. Oper. Manag. 2009, 15, 449–469. [Google Scholar] [CrossRef]
- Dumrongsiri, A.; Fan, M.; Jain, A.; Moinzadeh, K. A Supply Chain Model with Direct and Retail Channels. Eur. J. Oper. Res. 2008, 187, 691–718. [Google Scholar] [CrossRef]
- Yan, R.; Pei, Z.; Ghose, S. Reward Points, Profit Sharing, and Valuable Coordination Mechanism in the O2O Era. Int. J. Prod. Econ. 2019, 215, 34–47. [Google Scholar] [CrossRef]
- Phillips, R.L. Pricing and Revenue Optimization; Stanford University Press: Standford, CA, USA, 2005. [Google Scholar]
- Talluri, K.T.; Van Ryzin, G.J. The Theory and Practice of Revenue Management; Springer Science and Business Media LLC: Berlin/Heidelberg, Germany, 2004; Volume 68. [Google Scholar] [CrossRef]
- Quante, R.; Meyr, H.; Fleischmann, M. Revenue Management and Demand Fulfillment: Matching Applications, Models and Software. In Supply Chain Planning; Springer Science and Business Media LLC: Berlin/Heidelberg, Germany, 2009; pp. 57–88. [Google Scholar] [CrossRef] [Green Version]
- Haensel, A.; Mederer, M.; Schmidt, H. Revenue Management in the Car Rental Industry: A Stochastic Programming Approach. J. Revenue Pricing Manag. 2011, 11, 99–108. [Google Scholar] [CrossRef]
- Board, S.; Skrzypacz, A. Revenue Management with Forward-Looking Buyers. J. Politi- Econ. 1046. [Google Scholar] [CrossRef] [Green Version]
- Zhang, M.; Bell, P.C.; Cai, G.; Chen, X. Optimal Fences and Joint Price and Inventory Decisions in Distinct Markets with Demand Leakage. Eur. J. Oper. Res. 2010, 204, 589–596. [Google Scholar] [CrossRef]
- Dahlsrud, A. How Corporate Social Responsibility Is Defined: An Analysis of 37 Definitions. Corp. Soc. Responsib. Env. Manag. 2008, 15, 1–13. [Google Scholar] [CrossRef]
- Raza, S.A. Supply Chain Coordination under a Revenue-Sharing Contract with Corporate Social Responsibility and Partial Demand Information. Int. J. Prod. Econ. 2018, 205, 1–14. [Google Scholar] [CrossRef]
- Mohr, L.A.; Webb, D.J.; Harris, K.E. Do Consumers Expect Companies to Be Socially Responsible? The Impact of Corporate Social Responsibility on Buying Behavior. J. Consum. Aff. 2001, 35, 45–72. [Google Scholar] [CrossRef]
- Carter, C.R.; Jennings, M.M. Social Responsibility and Supply Chain Relationships. Transp. Res. Part E Logist. Transp. Rev. 2002, 38, 37–52. [Google Scholar] [CrossRef]
- Galvão, A.; Mendes, L.; Marques, C.; Mascarenhas, C. Factors Influencing Students’ Corporate Social Responsibility Orientation in Higher Education. J. Clean. Prod. 2019, 215, 290–304. [Google Scholar] [CrossRef]
- Chiang, W.-Y.K.; Monahan, G.E. Managing Inventories in a Two-Echelon Dual-Channel Supply Chain. Eur. J. Oper. Res. 2005, 162, 325–341. [Google Scholar] [CrossRef]
- Dan, B.; Xu, G.; Liu, C. Pricing Policies in a Dual-Channel Supply Chain with Retail Services. Int. J. Prod. Econ. 2012, 139, 312–320. [Google Scholar] [CrossRef]
- Zhou, Y.-W.; Guo, J.; Zhou, W. Pricing/Service Strategies for a Dual-Channel Supply Chain with Free Riding and Service-Cost Sharing. Int. J. Prod. Econ. 2018, 196, 198–210. [Google Scholar] [CrossRef]
- Heydari, J.; Govindan, K.; Aslani, A. Pricing and Greening Decisions in a Three-Tier Dual Channel Supply Chain. Int. J. Prod. Econ. 2019, 217, 185–196. [Google Scholar] [CrossRef]
- Modak, N.M.; Kelle, P. Using Social Work Donation as a Tool of Corporate Social Responsibility in a Closed-Loop Supply Chain Considering Carbon Emissions Tax and Demand Uncertainty. J. Oper. Res. Soc. 2019, 1–17. [Google Scholar] [CrossRef]
- Li, Y.Y. Overview of Research on Dual-Channel Supply Chain Management. In International Conference on Economic Management and Green Development (ICEMGD 2018) September 2018; Atlantis Press: Amsterdam, The Netherlands, 2018. [Google Scholar]
- Zhang, F.; Wang, C. Dynamic Pricing Strategy and Coordination in a Dual-Channel Supply Chain Considering Service Value. Appl. Math. Model. 2018, 54, 722–742. [Google Scholar] [CrossRef]
- Li, W.; Chen, J.; Liang, G.; Chen, B. Money-Back Guarantee and Personalized Pricing in a Stackelberg manufacturer’s Dual-Channel Supply Chain. Int. J. Prod. Econ. 2018, 197, 84–98. [Google Scholar] [CrossRef]
- Saha, S.; Modak, N.M.; Panda, S.; Sana, S.S. Managing a retailer’s Dual-Channel Supply Chain under Price- and Delivery Time-Sensitive Demand. J. Model. Manag. 2018, 13, 351–374. [Google Scholar] [CrossRef]
- Jamali, M.-B.; Rasti-Barzoki, M. A Game Theoretic Approach for Green and Non-Green Product Pricing in Chain-to-Chain Competitive Sustainable and Regular Dual-Channel Supply Chains. J. Clean. Prod. 2018, 170, 1029–1043. [Google Scholar] [CrossRef]
- Pu, X.; Sun, S.; Han, G. Differentiated-product Distribution in a dual-channel Supply Chain. Manag. Decis. Econ. 2019, 40, 363–373. [Google Scholar] [CrossRef]
- Batarfi, R.; Jaber, M.Y.; Glock, C.H. Pricing and Inventory Decisions in a Dual-Channel Supply Chain with Learning and Forgetting. Comput. Ind. Eng. 2019, 136, 397–420. [Google Scholar] [CrossRef]
- Ranjan, A.; Jha, J. Pricing and Coordination Strategies of a Dual-Channel Supply Chain Considering Green Quality and Sales Effort. J. Clean. Prod. 2019, 218, 409–424. [Google Scholar] [CrossRef]
- Wang, L.; Song, Q. Pricing Policies for Dual-Channel Supply Chain with Green Investment and Sales Effort under Uncertain Demand. Math. Comput. Simul. 2020, 171, 79–93. [Google Scholar] [CrossRef]
- Yang, D.; Xiao, T.; Huang, J. Dual-Channel Structure Choice of an Environmental Responsibility Supply Chain with Green Investment. J. Clean. Prod. 2019, 210, 134–145. [Google Scholar] [CrossRef]
- Lee, C.; Hsu, C.C.; Xu, X. Maximising manufacturer’s Profit in a Dual-Channel Supply Chain with Disruption Risk. Int. J. Serv. Oper. Manag. 2019, 33, 351. [Google Scholar] [CrossRef]
- Zhou, J.; Zhao, R.; Wang, W. Pricing Decision of a Manufacturer in a Dual-Channel Supply Chain with Asymmetric Information. Eur. J. Oper. Res. 2019, 278, 809–820. [Google Scholar] [CrossRef]
- Chen, H.; Dong, Z.; Li, G. Government Reward-Penalty Mechanism in Dual-Channel Closed-Loop Supply Chain. Sustainability 2020, 12, 8602. [Google Scholar] [CrossRef]
- Xideng, Z.; Xu, B.; Fei, X.; Yu, L. Research on Quality Decisions and Coordination with Reference Effect in Dual-Channel Supply Chain. Sustainability 2020, 12, 2296. [Google Scholar] [CrossRef] [Green Version]
- Rahmani, D.; Abadi, M.Q.H.; Hosseininezhad, S.J. Joint Decision on Product Greenness Strategies and Pricing in a Dual-Channel Supply Chain: A Robust Possibilistic Approach. J. Clean. Prod. 2020, 256, 120437. [Google Scholar] [CrossRef]
- Wang, J.; Jiang, H.; Yu, M. Pricing Decisions in a Dual-Channel Green Supply Chain with Product Customization. J. Clean. Prod. 2020, 247, 119101. [Google Scholar] [CrossRef]
- Li, S.; Li, M.; Zhou, N. Pricing and Coordination in a Dual-Channel Supply Chain with a Socially Responsible Manufacturer. Plos One 2020, 15, e0236099. [Google Scholar] [CrossRef]
- Zhang, M.; Bell, P. Price Fencing in the Practice of Revenue Management: An Overview and Taxonomy. J. Revenue Pricing Manag. 2010, 11, 146–159. [Google Scholar] [CrossRef]
- Liu, B.; Zhang, R.; Xiao, M. Joint Decision on Production and Pricing for Online Dual Channel Supply Chain System. Appl. Math. Model. 2010, 34, 4208–4218. [Google Scholar] [CrossRef]
- Cai, G.; Zhang, Z.G.; Zhang, M. Game Theoretical Perspectives on Dual-Channel Supply Chain Competition with Price Discounts and Pricing Schemes. Int. J. Prod. Econ. 2009, 117, 80–96. [Google Scholar] [CrossRef]
- Chen, J.; Zhang, H.; Sun, Y. Implementing Coordination Contracts in a Manufacturer Stackelberg Dual-Channel Supply Chain. Omega 2012, 40, 571–583. [Google Scholar] [CrossRef]
- Chen, J.; Liang, L.; Yao, D.-Q.; Sun, S. Price and Quality Decisions in Dual-Channel Supply Chains. Eur. J. Oper. Res. 2017, 259, 935–948. [Google Scholar] [CrossRef]
- Su, X. Intertemporal pricing with strategic customer behavior. Mgmt. Sci. 2007, 53, 726–741. [Google Scholar]
- Gupta, V.K.; Qu, T.; Tiwari, M.K. Multi-Period Price Optimization Problem for Omnichannel Retailers Accounting for Customer Heterogeneity. Int. J. Prod. Econ. 2019, 212, 155–167. [Google Scholar] [CrossRef]
- Raza, S.A. Optimal Fare Price Differentiation with Demand Leakage in Airline Industry. Int. J. Revenue Manag. 2015, 8, 99–129. [Google Scholar] [CrossRef]
- Raza, S.A. The Impact of Differentiation Price and Demand Leakage on a firm’s Profitability. J. Model. Manag. 2015, 10, 270–295. [Google Scholar] [CrossRef]
- Raza, S.A.; Rathinam, S. A Risk Tolerance Analysis for a Joint Price Differentiation and Inventory Decisions Problem with Demand Leakage Effect. Int. J. Prod. Econ. 2017, 183, 129–145. [Google Scholar] [CrossRef]
- Raza, S.A.; Rathinam, S.; Turiac, M.; Kerbache, L. An Integrated Revenue Management Framework for a firm’s Greening, Pricing and Inventory Decisions. Int. J. Prod. Econ. 2018, 195, 373–390. [Google Scholar] [CrossRef]
- Carter, C.R.; Jennings, M.M. The Role of Purchasing in Corporate Social Responsibility: A Structural Equation Analysis. J. Bus. Logist. 2004, 25, 145–186. [Google Scholar]
- Seuring, S.; Müller, M. From a Literature Review to a Conceptual Framework for Sustainable Supply Chain Management. J. Clean. Prod. 2008, 16, 1699–1710. [Google Scholar] [CrossRef]
- Feng, Y.; Zhu, Q.; Lai, K.-H. Corporate Social Responsibility for Supply Chain Management: A Literature Review and Bibliometric Analysis. J. Clean. Prod. 2017, 158, 296–307. [Google Scholar] [CrossRef]
- Modak, N.; Panda, S.; Mishra, R.; Sana, S. A Three-Layer Supply Chain Coordination in Socially Responsible Distribution System. Tékhne, 2016; 14, 75–87. [Google Scholar] [CrossRef]
- Modak, N.M.; Panda, S.; Sana, S.S. Pricing Policy and Coordination for a Distribution Channel with Manufacturer Suggested Retail Price. Int. J. Syst. Sci. Oper. Logist. 2015, 3, 92–101. [Google Scholar] [CrossRef]
- Modak, N.M.; Panda, S.; Sana, S.S. Pricing Policy and Coordination for a Two-Layer Supply Chain of Duopolistic Retailers and Socially Responsible Manufacturer. Int. J. Logist. Res. Appl. 2015, 19, 487–508. [Google Scholar] [CrossRef]
- Modak, N.M.; Panda, S.; Sana, S.S. Three-Echelon Supply Chain Coordination Considering Duopolistic Retailers with Perfect Quality Products. Int. J. Prod. Econ. 2016, 182, 564–578. [Google Scholar] [CrossRef]
- Panda, S.; Modak, N.M. Exploring the Effects of Social Responsibility on Coordination and Profit Division in a Supply Chain. J. Clean. Prod. 2016, 139, 25–40. [Google Scholar] [CrossRef]
- Panda, S.; Modak, N.M.; Pradhan, D. Corporate Social Responsibility, Channel Coordination and Profit Division in a Two-Echelon Supply Chain. Int. J. Manag. Sci. Eng. Manag. 2014, 11, 22–33. [Google Scholar] [CrossRef]
- Panda, S.; Modak, N.M.; Cárdenas-Barrón, L.E. Coordinating a Socially Responsible Closed-Loop Supply Chain with Product Recycling. Int. J. Prod. Econ. 2017, 188, 11–21. [Google Scholar] [CrossRef]
- Panda, S.; Modak, N.M.; Cárdenas-Barrón, L.E. Coordination and Benefit Sharing in a Three-Echelon Distribution Channel with Deteriorating Product. Comput. Ind. Eng. 2017, 113, 630–645. [Google Scholar] [CrossRef]
- Cruz, J.M.; Wakolbinger, T. Multiperiod Effects of Corporate Social Responsibility on Supply Chain Networks, Transaction Costs, Emissions, and Risk. Int. J. Prod. Econ. 2008, 116, 61–74. [Google Scholar] [CrossRef]
- Zhao, X.; Yin, R. Coordination of a Socially Responsible Two-Stage Supply Chain under Price-Dependent Random Demand. 4OR 2017, 16, 379–400. [Google Scholar] [CrossRef]
- Modak, N.M.; Sinha, S.; Panda, S.; Kazemi, N. Analyzing a Socially Responsible Closed-Loop Distribution Channel with Recycling Facility. SN Appl. Sci. 2019, 1, 1189. [Google Scholar] [CrossRef] [Green Version]
- Nematollahi, M.; Hosseini-Motlagh, S.-M.; Ignatius, J.; Goh, M.; Nia, M.S. Coordinating a Socially Responsible Pharmaceutical Supply Chain under Periodic Review Replenishment Policies. J. Clean. Prod. 2018, 172, 2876–2891. [Google Scholar] [CrossRef]
- Liu, B.; Ying, P.; Peng, L.; Wang, Y.; Tsai, S.-B.; Li, Y. Decision Models and Governance Mechanisms Considering Corporate Social Irresponsibility in Supply Chains. In Advances in Environmental Engineering and Green Technologies; IGI Global: Hershey, PA, USA, 2018; pp. 135–152. [Google Scholar] [CrossRef]
- Liu, Y.; Quan, B.-t.; Li, J.; Forrest, J.Y.-L. A supply chain coordination mechanism with cost sharing of corporate social responsibility. Sustainability 2018, 10, 1227. [Google Scholar]
- Kundu, S.; Chakrabarti, T. Joint Optimal Decisions on Pricing and Local Advertising Policy of a Socially Responsible Dual-Channel Supply Chain. Am. J. Math. Manag. Sci. 2017, 37, 117–143. [Google Scholar] [CrossRef]
- Guchhait, R.; Pareek, S.; Sarkar, B. Application of Distribution-Free Approach in Integrated and Dual-Channel Supply Chain Under Buyback Contract. In Encyclopedia of Organizational Knowledge, Administration, and Technology; IGI Global: Hershey, PA, USA, 2018; pp. 388–426. [Google Scholar] [CrossRef]
- Xu, J.; Yang, X.; Xiao, A.; Chen, L. Optimisation Strategy of Online Dual-Channel Supply Chain under Differentiated Products. Int. J. of Manuf. Technol. Manag. 2018, 32, 450–469. [Google Scholar]
- Lau, A.K.; Lee, P.K.; Cheng, T. An Empirical Taxonomy of Corporate Social Responsibility in China’s Manufacturing Industries. J. Clean. Prod. 2018, 188, 322–338. [Google Scholar] [CrossRef]
- Ortiz-Avram, D.; Domnanovich, J.; Kronenberg, C.; Scholz, M. Exploring the integration of corporate social responsibility into the strategies of small-and medium-sized enterprises: A systematic literature review. J. Clean. Prod. 2018, 201, 254–271. [Google Scholar]
- López-González, E.; Martínez-Ferrero, J.; Garcia-Meca, E. Corporate Social Responsibility in Family Firms: A Contingency Approach. J. Clean. Prod. 2019, 211, 1044–1064. [Google Scholar] [CrossRef]
- Liu, Y.; Quan, B.-T.; Xu, Q.; Forrest, B. Corporate Social Responsibility and Decision Analysis in a Supply Chain through Government Subsidy. J. Clean. Prod. 2019, 208, 436–447. [Google Scholar] [CrossRef]
- Yuan, K.; Wu, G.; Dong, H.; He, B.; Wang, D. Differential Pricing and Emission Reduction in Remanufacturing Supply Chains with Dual-Sale Channels under CCT-Mechanism. Sustainability 2020, 12, 8150. [Google Scholar]
- Cruz, J.M. Dynamics of Supply Chain Networks with Corporate Social Responsibility through Integrated Environmental Decision-Making. Eur. J. Oper. Res. 2008, 184, 1005–1031. [Google Scholar] [CrossRef]
- Cruz, J.M. The Impact of Corporate Social Responsibility in Supply Chain Management: Multicriteria Decision-Making Approach. Decis. Support Syst. 2009, 48, 224–236. [Google Scholar] [CrossRef]
- Cruz, J.M.; Matsypura, D. Supply Chain Networks with Corporate Social Responsibility through Integrated Environmental Decision-Making. Int. J. Prod. Res. 2008, 47, 621–648. [Google Scholar] [CrossRef]
- Ni, D.; Li, K.W.; Tang, X. Social Responsibility Allocation in Two-Echelon Supply Chains: Insights from Wholesale Price Contracts. Eur. J. Oper. Res. 2010, 207, 1269–1279. [Google Scholar] [CrossRef] [Green Version]
- Cruz, J.M. Modeling the Relationship of Globalized Supply Chains and Corporate Social Responsibility. J. Clean. Prod. 2013, 56, 73–85. [Google Scholar] [CrossRef]
- Cruz, J.M. Mitigating Global Supply Chain Risks through Corporate Social Responsibility. Int. J. Prod. Res. 2013, 51, 3995–4010. [Google Scholar] [CrossRef]
- Panda, S.; Modak, N.; Sana, S.; Basu, M. Pricing and Replenishment Policies in Dual-Channel Supply Chain under Continuous Unit Cost Decrease. Appl. Math. Comput. 2015, 256, 913–929. [Google Scholar] [CrossRef]
- Kong, J.; Yang, F.; Liu, T. Socially Responsible Supply Chains with Cost Learning Effects. Rairo Oper. Res. 2020, 54, 119–142. [Google Scholar] [CrossRef]
- Liu, Y.; Li, J.; Quan, B.-T.; Yang, J.-B. Decision Analysis and Coordination of Two-Stage Supply Chain Considering Cost Information Asymmetry of Corporate Social Responsibility. J. Clean. Prod. 2019, 228, 1073–1087. [Google Scholar] [CrossRef]
- Modak, N.M.; Kazemi, N.; Cárdenas-Barrón, L.E. Investigating Structure of a Two-Echelon Closed-Loop Supply Chain Using Social Work Donation as a Corporate Social Responsibility Practice. Int. J. Prod. Econ. 2019, 207, 19–33. [Google Scholar] [CrossRef]
- Phan, D.A.; Vo, T.L.H.; Lai, A.N.; Nguyen, T.L.A. Coordinating Contracts for VMI Systems under Manufacturer-CSR and Retailer-Marketing Efforts. Int. J. Prod. Econ. 2019, 211, 98–118. [Google Scholar] [CrossRef]
- Zhao, X.; Li, N.; Song, L. Coordination of a Socially Responsible Two-Stage Supply Chain Under Random Demand. Asia-Pac. J. Oper. Res. 2019; 36, 1–27. [Google Scholar] [CrossRef]
- Modak, N.M.; Kelle, P. Managing a Dual-Channel Supply Chain under Price and Delivery-Time Dependent Stochastic Demand. Eur. J. Oper. Res. 2019, 272, 147–161. [Google Scholar] [CrossRef]
- Lariviere, M.A.; Porteus, E.L. Selling to the Newsvendor: An Analysis of Price-Only Contracts. Manuf. Serv. Oper. Manag. 2001, 3, 293–305. [Google Scholar] [CrossRef]
- Gallego, G.; Moon, I. The Distribution Free Newsboy Problem: Review and Extensions. J. Oper. Res. Soc. 1993, 44, 825–834. [Google Scholar]
- Hu, J.; Xu, Y. Distribution Free Approach for Coordination of a Supply Chain with Consumer Return. Phys. Procedia 2012, 24, 1500–1506. [Google Scholar] [CrossRef] [Green Version]
- Raza, S.A. A Distribution Free Approach to Newsvendor Problem with Pricing. 4OR. 2014, 12, 335–358. [Google Scholar]
- Fu, Q.; Sim, C.-K.; Teo, C.-P. Profit Sharing Agreements in Decentralized Supply Chains: A Distributionally Robust Approach. Oper. Res. 2018, 66, 500–513. [Google Scholar] [CrossRef]
- Petruzzi, N.C.; Dada, M. Pricing and the Newsvendor Problem: A Review with Extensions. Oper. Res. 1999, 47, 183–194. [Google Scholar] [CrossRef] [Green Version]
- Bai, T.; Wu, M.; Zhu, S.X. Pricing and Ordering by a Loss Averse Newsvendor with Reference Dependence. Transp. Res. Part E Logist. Transp. Rev. 2019, 131, 343–365. [Google Scholar] [CrossRef]
- Xiao, H.; Xu, M.; Yang, H. Pricing Strategies for Shared Parking Management with Double Auction Approach: Differential Price vs. Uniform Price. Transp. Res. Part E Logist. Transp. Rev. 2020, 136, 101899. [Google Scholar] [CrossRef]
- Li, G.; Li, L.; Sun, J. Pricing and Service Effort Strategy in a Dual-Channel Supply Chain with Showrooming Effect. Transp. Res. Part E Logist. Transp. Rev. 2019, 126, 32–48. [Google Scholar] [CrossRef]
- Maihami, R.; Govindan, K.; Fattahi, M. The Inventory and Pricing Decisions in a Three-Echelon Supply Chain of Deteriorating Items under Probabilistic Environment. Transp. Res. Part E Logist. Transp. Rev. 2019, 131, 118–138. [Google Scholar] [CrossRef]
- Huang, S.; Fan, Z.-P.; Wang, N. Green Subsidy Modes and Pricing Strategy in a Capital-Constrained Supply Chain. Transp. Res. Part E Logist. Transp. Rev. 2020, 136, 101885. [Google Scholar] [CrossRef]
- Hong, Z.; Wang, H.; Yu, Y. Green Product Pricing with Non-Green Product Reference. Transp. Res. Part E Logist. Transp. Rev. 2018, 115, 1–15. [Google Scholar] [CrossRef]
- Chen, S.; Wang, X.; Wu, Y.; Zhou, F. Pricing Policies of a Dual-Channel Supply Chain Considering Channel Environmental Sustainability. Sustainability 2017, 9, 382. [Google Scholar] [CrossRef] [Green Version]
- Chen, F.Y.; Yan, H.; Yao, L. A newsvendor pricing game. IEEE Transactions on Systems, Man, and Cybernetics-Part. A: Systems and Humans 2004, 34, 450–456. [Google Scholar]
- Song, H.; Gao, X. Green Supply Chain Game Model and Analysis under Revenue-Sharing Contract. J. Clean. Prod. 2018, 170, 183–192. [Google Scholar] [CrossRef]
- Panda, S.; Modak, N.; Basu, M.; Goyal, S. Channel Coordination and Profit Distribution in a Social Responsible Three-Layer Supply Chain. Int. J. Prod. Econ. 2015, 168, 224–233. [Google Scholar] [CrossRef]
- Raza, S.A. An Integrated Approach to Price Differentiation and Inventory Decisions with Demand Leakage. Int. J. Prod. Econ. 2015, 164, 105–117. [Google Scholar]
Figure 1.
Dual-channel supply chain model with price differentiation and corporate social responsibility (CSR).
Figure 1.
Dual-channel supply chain model with price differentiation and corporate social responsibility (CSR).

Figure 2.
Impact of price differentiation and demand leakages on supply chain (SC) revenue.

Figure 3.
Impact of price differentiation on SC players (manufacturer and retailer) revenues.

Figure 4.
Impact of price differentiation on SC decisions.
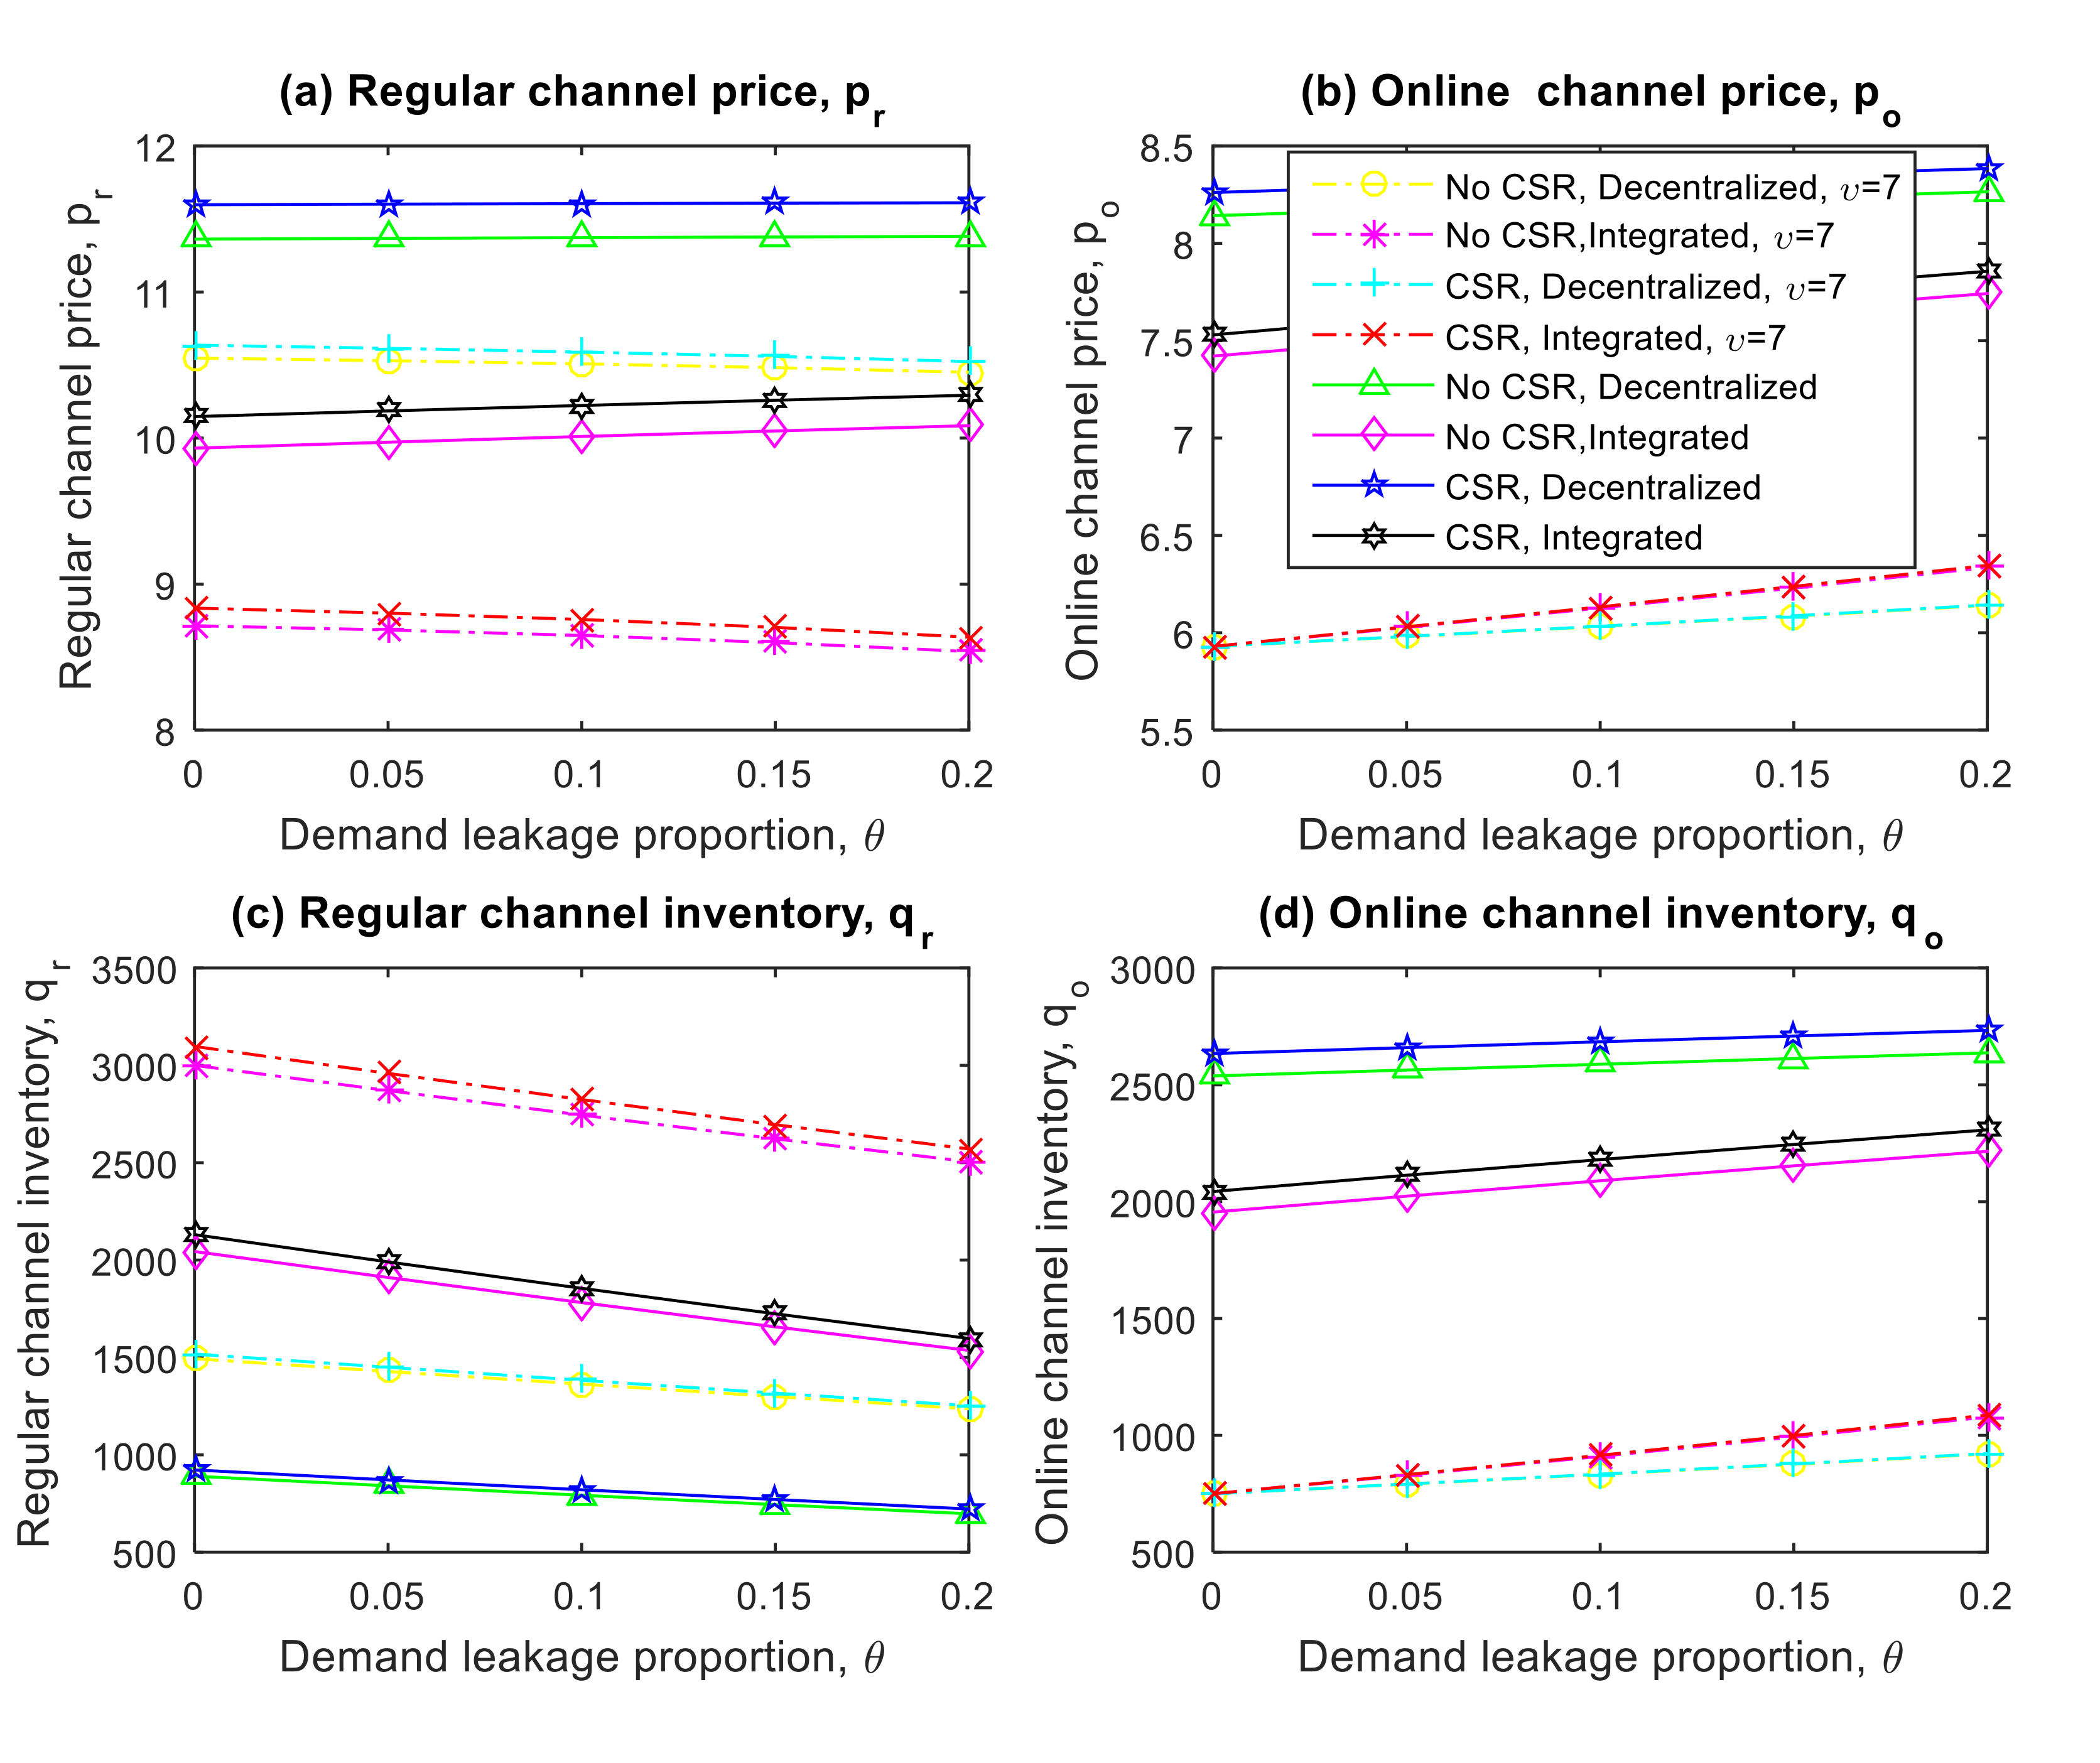
Table 1.
Contemporary literature review.
| Literature | SC Configuration (Closed-Loop, Network, Others) | SC Coordination Contracts (Revenue-Sharing, Cost-Sharing, Others) | Societal Consideration (Greening, Corporate Investment, Govt. Incentives, Others) | Market Demand Behavior (Deterministic, Stochastic, Uncertain) | SC Players Attitude (Risk-Less, Risk-Neutral, Risk-Averse) | Decisions (Pricing, Inventory, Others) |
|---|---|---|---|---|---|---|
| [85] | Channel selection in supply chain | None | Greening investment | Deterministic | Risk-less | Pricing |
| [71] | Multi-period network | None | CRS investment | Deterministic | Risk-less | Multi-criteria (Pricing, Quantity, CSR activities) |
| [86] | Multi-level supply chain network | None | CSR activities | Deterministic | Risk-less | Pricing, CSR activities |
| [87] | Supply chain network | None | Emission reduction | Deterministic | Risk-less | Pricing, CRS activities |
| [88] | Single product, Single channel | Wholesale price via subgames | CSR activities | Deterministic | Risk-less | Pricing, CRS activities |
| [89] | Multi-agent network | None | CSR activities | Uncertain (supply-side disruptions, social risks) | Risk-less | Pricing, CRS activities |
| [90] | Multi-level global supply chain network | None | CSR activities | Deterministic | Risk-less | Pricing, CSR investment |
| [3] | Dual-channel supply chain | Franchise-fee | Consumer-surplus | Deterministic | Risk-less | Quantity, replenishment cycles |
| [4] | Dual-channel, Three echelon | Quantity discount, Franchise fee | None | Deterministic | Risk-less | Quantity, replenishment cycles |
| [91] | Single product, Single channel | Discount | Consumer-surplus | Deterministic | Risk-less | Pricing |
| [64] | Multi-channel, Multi-echelon | Two-part tariff | Consumer-surplus | Deterministic | Risk-less | Pricing |
| [65] | Duopolistic retailers, Two-layer supply chain | Two-part tariff | Consumer-surplus | Deterministic | Risk-less | Pricing |
| [66] | Three-echelon supply chain | All unit quantity discount | None | Deterministic | Risk-less | Pricing |
| [63] | Three-layer supply chain | Revenue-sharing | Consumer-surplus | Deterministic | Risk-less | Pricing |
| [67] | Single product, Single channel | Profit division | Consumer-surplus | Deterministic | Risk-less | Pricing |
| [68] | Single product, Single channel | All unit quantity discount | Consumer-surplus | Deterministic | Risk-less | Pricing |
| [69] | Closed-loop supply chain | Revenue-sharing | Consumer-surplus | Deterministic | Risk-less | Pricing |
| [76] | Single channel, Multiple retailers | Cost-sharing | CSR investment, Consumer-surplus | Deterministic | Risk-less | Pricing |
| [23] | Single channel, Single product | Revenue-sharing | CSR activities | Stochastic | Risk-neutral | Pricing |
| [72] | Single product, Single channel | Profit-sharing | CSR activities | Stochastic | Risk-neutral | Pricing, CRS investment, Inventory |
| [92] | Two-period manufacturer-retailer supply chain | two-part tariff contracts | Cost learning effects | Deterministic | Risk-neutral | Pricing |
| [93] | Single product, Single channel | Transfer payment mechanism | CSR activities | Deterministic | Risk-neutral | Pricing, CSR effort |
| [83] | Single product, Single channel, Multiple retailers | Price | CSR activities, Govt. Subsidiary | Deterministic | Risk-neutral | Pricing, CSR investment, Govt. subsidiary |
| [94] | Single product, Single channel, Multiple retailers, Third party collectors | Profit-sharing | CRS investment | Deterministic | Risk-neutral | Pricing, CSR investment |
| [73] | Closed-loop | Revenue-sharing | CSR investment | Deterministic | Risk-neutral | Pricing |
| [95] | Closed-loop | Revenue-sharing | CSR investment | Deterministic | Risk-neutral | Pricing, CSR investment |
| [7] | Single channel, Market differentiation | None | Greening investment | Stochastic | Risk-neutral | Pricing, Greening effort, Inventory |
| [6] | Dual-channel, Market differentiation | Cost-sharing, Revenue-sharing | Greening investment | Deterministic | Risk-averse | Pricing, Greening effort |
| [96] | Single product, Single channel | Profit-sharing | CSR investment | Stochastic | Risk-neutral | Pricing, CSR (effort) investment, Inventory |
| [97] | Single product, Closed-loop | None | Carbon tax | Stochastic | Risk-neutral | Pricing, Carbon emission, Inventory |
| This paper | Dual-channel, Market differentiation | None | CSR investment | Stochastic | Risk-neutral | Pricing, CSR (effort) investment, Inventory |
Table 2.
Notations.
| Parameters | Description |
|---|---|
| Cost of manufacturing per unit | |
| Maximum perceived cumulative deterministic (riskless) demand (Market share), | |
| Price sensitivity, | |
| Coefficient of Corporate Social Responsibility (CSR) investment impact on demand, | |
| Cannibalization (demand leakage) proportion, | |
| Adjusted price-and CSR dependent deterministic demand in retail (regular) channel | |
| Adjusted price-and CSR dependent deterministic demand in online (direct) channel demand | |
| Mean of stochastic demand factor, , = online | |
| Standard deviation of stochastic demand factor, , , = online | |
| Probability distribution function of price-and CSR dependent stochastic demand in market segment , = online/direct | |
| Cumulative Probability distribution function of price-and CSR dependent stochastic demand in market segment , = online | |
| Price-and CSR dependent stochastic demand, | |
| Manufacturer’s revenue (payoff), | |
| Retailer (sellers)’s revenue (payoff), | |
| Supply chain (total) revenue (payoff), | |
| Decisions | |
| Manufacturer (m) | |
| Wholesale price per unit, | |
| Price per unit of standard product in direct (online) channel | |
| Differentiation price, | |
| Investment on CSR activities, | |
| Seller/retailer (s) | |
| Price per unit for a product in regular channel, | |
| Order quantity (inventory) for regular channel, | |
| Order quantity (inventory) for online channel, | |
| Scripts and Accents | |
| “ | Superscript for decentralized analysis, () |
| “ | Superscript for centralized analysis, () |
| “ | Accent used for a control decision, when price-and-CSR dependent demand is deterministic |
| “ | Accent used for a control decision, when price-and-CSR dependent demand is stochastic with partial information (unknown distribution) |
| Expected value of random variable, such that |
Table 3.
Impact of coefficient of corporate social responsibility, (centralized analysis).
| Decisions/Outcomes | Remarks/Conditions | |
|---|---|---|
| , if | ||
| , if | ||
| if , | ||
| if |
Table 4.
Impact of proportion of demand leakage, (centralized analysis).
| Decisions/Outcomes | Remarks/Conditions | |
|---|---|---|
| , | ||
| if , and | ||
| , if and | ||
| - | ||
| , if | ||
| if , |
Table 5.
Impact of coefficient of corporate social responsibility, (decentralized analysis).
| Decisions/Outcomes | Remarks/Conditions | |
|---|---|---|
| , if | ||
| , if | ||
| , if | ||
| if , | ||
| , if , | ||
| if , | ||
| if , |
Table 6.
Impact of proportion of demand leakage, (decentralized analysis).
| Decisions/Outcomes | Remarks/Conditions | |
|---|---|---|
| , if | ||
| , if , | ||
| , if , | ||
| if , | ||
| if, | ||
| , if and |
Table 7.
Deterministic demand.
| Decentralized Analysis | Centralized Analysis | |||||||||||||||
| 0 | 0 | 11.43 | 8.21 | 10.36 | 0.00 | 857.14 | 2571.43 | 918.37 | 12,857.10 | 13,775.50 | 10.00 | 7.50 | 0.00 | 2000.00 | 2000.00 | 15,000.00 |
| 2 | 0 | 11.44 | 8.22 | 10.36 | 18.42 | 858.37 | 2575.11 | 921.00 | 12,875.50 | 13,796.50 | 10.01 | 7.50 | 25.08 | 2003.34 | 2003.34 | 14,924.70 |
| 4 | 0 | 11.47 | 8.23 | 10.39 | 74.32 | 862.07 | 2586.21 | 928.95 | 12,931.00 | 13,860.00 | 10.03 | 7.52 | 101.35 | 2013.42 | 2013.42 | 14,695.30 |
| 6 | 0 | 11.51 | 8.26 | 10.43 | 169.64 | 868.31 | 2604.92 | 942.45 | 13,024.60 | 13,967.00 | 10.08 | 7.54 | 231.91 | 2030.46 | 2030.46 | 14,300.80 |
| 8 | 0 | 11.58 | 8.29 | 10.48 | 307.79 | 877.19 | 2631.58 | 961.83 | 13,157.90 | 14,119.70 | 10.14 | 7.57 | 422.22 | 2054.79 | 2054.79 | 13,722.10 |
| 10 | 0 | 11.67 | 8.33 | 10.56 | 493.83 | 888.89 | 2666.67 | 987.65 | 13,333.30 | 14,321.00 | 10.22 | 7.61 | 680.53 | 2086.96 | 2086.96 | 12,930.10 |
| 0 | 0.05 | 11.44 | 8.24 | 10.37 | 0.00 | 808.51 | 2595.74 | 860.12 | 12,766.00 | 13,626.10 | 10.04 | 7.58 | 0.00 | 1868.85 | 2065.57 | 14,754.10 |
| 2 | 0.05 | 11.45 | 8.25 | 10.38 | 18.16 | 809.66 | 2599.43 | 862.56 | 12,784.10 | 13,646.70 | 10.05 | 7.59 | 24.27 | 1871.92 | 2068.97 | 14,681.30 |
| 4 | 0.05 | 11.47 | 8.26 | 10.40 | 73.26 | 813.12 | 2610.56 | 869.96 | 12,838.80 | 13,708.80 | 10.07 | 7.60 | 98.03 | 1881.19 | 2079.21 | 14,459.40 |
| 6 | 0.05 | 11.52 | 8.29 | 10.44 | 167.21 | 818.97 | 2629.31 | 882.51 | 12,931.00 | 13,813.50 | 10.12 | 7.62 | 224.25 | 1896.84 | 2096.51 | 14,078.00 |
| 8 | 0.05 | 11.59 | 8.32 | 10.50 | 303.34 | 827.29 | 2656.02 | 900.53 | 13,062.40 | 13,962.90 | 10.18 | 7.65 | 408.12 | 1919.19 | 2121.21 | 13,519.00 |
| 10 | 0.05 | 11.67 | 8.36 | 10.57 | 486.59 | 838.24 | 2691.18 | 924.52 | 13,235.30 | 14,159.80 | 10.26 | 7.69 | 657.46 | 1948.72 | 2153.85 | 12,754.80 |
| 0 | 0.1 | 11.44 | 8.27 | 10.39 | 0.00 | 760.56 | 2619.72 | 803.41 | 12,676.10 | 13,479.50 | 10.08 | 7.66 | 0.00 | 1741.94 | 2129.03 | 14,516.10 |
| 2 | 0.1 | 11.45 | 8.28 | 10.39 | 17.90 | 761.64 | 2623.41 | 805.68 | 12,693.90 | 13,499.60 | 10.09 | 7.67 | 23.49 | 1744.75 | 2132.47 | 14,445.60 |
| 4 | 0.1 | 11.48 | 8.29 | 10.42 | 72.23 | 764.87 | 2634.56 | 812.54 | 12,747.90 | 13,560.40 | 10.11 | 7.68 | 94.87 | 1753.25 | 2142.86 | 14,230.90 |
| 6 | 0.1 | 11.53 | 8.32 | 10.46 | 164.84 | 770.33 | 2653.35 | 824.17 | 12,838.80 | 13,663.00 | 10.16 | 7.70 | 216.97 | 1767.59 | 2160.39 | 13,862.10 |
| 8 | 0.1 | 11.59 | 8.35 | 10.51 | 298.98 | 778.10 | 2680.12 | 840.88 | 12,968.30 | 13,809.20 | 10.22 | 7.73 | 394.72 | 1788.08 | 2185.43 | 13,321.80 |
| 10 | 0.1 | 11.68 | 8.39 | 10.58 | 479.51 | 788.32 | 2715.33 | 863.13 | 13,138.70 | 14,001.80 | 10.29 | 7.77 | 635.55 | 1815.13 | 2218.49 | 12,583.90 |
| 0 | 0.15 | 11.45 | 8.30 | 10.40 | 0.00 | 713.29 | 2643.36 | 748.20 | 12,587.40 | 13,335.60 | 10.12 | 7.74 | 0.00 | 1619.05 | 2190.48 | 14,285.70 |
| 2 | 0.15 | 11.46 | 8.31 | 10.41 | 17.65 | 714.29 | 2647.06 | 750.30 | 12,605.00 | 13,355.30 | 10.13 | 7.74 | 22.75 | 1621.62 | 2193.96 | 14,217.40 |
| 4 | 0.15 | 11.49 | 8.32 | 10.43 | 71.21 | 717.30 | 2658.23 | 756.65 | 12,658.20 | 13,414.90 | 10.15 | 7.76 | 91.87 | 1629.39 | 2204.47 | 14,009.50 |
| 6 | 0.15 | 11.53 | 8.35 | 10.47 | 162.51 | 722.38 | 2677.05 | 767.40 | 12,747.90 | 13,515.30 | 10.19 | 7.78 | 210.04 | 1642.51 | 2222.22 | 13,652.60 |
| 8 | 0.15 | 11.60 | 8.38 | 10.53 | 294.72 | 729.61 | 2703.86 | 782.85 | 12,875.50 | 13,658.40 | 10.25 | 7.81 | 381.97 | 1661.24 | 2247.56 | 13,130.10 |
| 10 | 0.15 | 11.68 | 8.42 | 10.60 | 472.59 | 739.13 | 2739.13 | 803.40 | 13,043.50 | 13,846.90 | 10.33 | 7.85 | 614.71 | 1685.95 | 2280.99 | 12,417.20 |
| 0 | 0.2 | 11.46 | 8.33 | 10.42 | 0.00 | 666.67 | 2666.67 | 694.44 | 12,500.00 | 13,194.40 | 10.16 | 7.81 | 0.00 | 1500.00 | 2250.00 | 14,062.50 |
| 2 | 0.2 | 11.47 | 8.34 | 10.42 | 17.41 | 667.59 | 2670.38 | 696.38 | 12,517.40 | 13,213.80 | 10.16 | 7.82 | 22.04 | 1502.35 | 2253.52 | 13,996.30 |
| 4 | 0.2 | 11.49 | 8.35 | 10.45 | 70.22 | 670.39 | 2681.56 | 702.23 | 12,569.80 | 13,272.10 | 10.19 | 7.83 | 89.00 | 1509.43 | 2264.15 | 13,794.90 |
| 6 | 0.2 | 11.54 | 8.38 | 10.49 | 160.23 | 675.11 | 2700.42 | 712.14 | 12,658.20 | 13,370.40 | 10.23 | 7.85 | 203.44 | 1521.39 | 2282.09 | 13,449.30 |
| 8 | 0.2 | 11.61 | 8.41 | 10.54 | 290.55 | 681.82 | 2727.27 | 726.37 | 12,784.10 | 13,510.50 | 10.29 | 7.88 | 369.82 | 1538.46 | 2307.69 | 12,943.80 |
| 10 | 0.2 | 11.69 | 8.45 | 10.61 | 465.81 | 690.65 | 2762.59 | 745.30 | 12,949.60 | 13,694.90 | 10.37 | 7.93 | 594.88 | 1560.98 | 2341.46 | 12,254.60 |
Table 8.
Stochastic demand (normal distribution).
| Decentralized Analysis | Centralized Analysis | |||||||||||||||
| 0 | 0 | 11.36 | 8.14 | 10.29 | 890.03 | 2538.17 | 0.00 | 597.62 | 12,162.00 | 12,759.60 | 9.93 | 7.42 | 2043.97 | 1955.45 | 0.00 | 14,317.10 |
| 2 | 0 | 11.37 | 8.15 | 10.30 | 891.28 | 2541.87 | 17.82 | 599.57 | 12,179.80 | 12,779.40 | 9.94 | 7.42 | 2047.30 | 1958.83 | 24.40 | 14,341.40 |
| 4 | 0 | 11.40 | 8.16 | 10.32 | 895.03 | 2553.04 | 71.91 | 605.49 | 12,233.50 | 12,839.00 | 9.96 | 7.44 | 2057.38 | 1969.06 | 98.58 | 14,415.00 |
| 6 | 0 | 11.44 | 8.18 | 10.36 | 901.35 | 2571.87 | 164.18 | 615.54 | 12,324.10 | 12,939.60 | 10.01 | 7.46 | 2074.39 | 1986.34 | 225.60 | 14,539.20 |
| 8 | 0 | 11.51 | 8.22 | 10.41 | 910.37 | 2598.68 | 297.94 | 630.00 | 12,453.10 | 13,083.10 | 10.07 | 7.49 | 2098.70 | 2011.02 | 410.83 | 14,716.80 |
| 10 | 0 | 11.60 | 8.26 | 10.49 | 922.23 | 2633.98 | 478.15 | 649.30 | 12,622.90 | 13,272.20 | 10.15 | 7.53 | 2130.84 | 2043.64 | 662.34 | 14,951.60 |
| 0 | 0.05 | 11.37 | 8.17 | 10.30 | 840.70 | 2563.39 | 0.00 | 535.65 | 12,067.80 | 12,603.40 | 9.97 | 7.51 | 1910.65 | 2023.67 | 0.00 | 14,063.40 |
| 2 | 0.05 | 11.38 | 8.18 | 10.31 | 841.87 | 2567.10 | 17.56 | 537.44 | 12,085.30 | 12,622.80 | 9.98 | 7.51 | 1913.72 | 2027.11 | 23.59 | 14,086.90 |
| 4 | 0.05 | 11.40 | 8.19 | 10.33 | 845.39 | 2578.29 | 70.87 | 542.81 | 12,138.30 | 12,681.10 | 10.00 | 7.52 | 1922.98 | 2037.48 | 95.29 | 14,158.10 |
| 6 | 0.05 | 11.45 | 8.22 | 10.37 | 851.33 | 2597.15 | 161.78 | 551.92 | 12,227.50 | 12,779.40 | 10.05 | 7.54 | 1938.64 | 2055.00 | 218.01 | 14,278.20 |
| 8 | 0.05 | 11.52 | 8.25 | 10.43 | 859.79 | 2624.01 | 293.53 | 565.01 | 12,354.60 | 12,919.60 | 10.11 | 7.57 | 1961.00 | 2080.02 | 396.84 | 14,449.70 |
| 10 | 0.05 | 11.60 | 8.29 | 10.50 | 870.92 | 2659.35 | 470.99 | 582.55 | 12,521.90 | 13,104.50 | 10.19 | 7.62 | 1990.53 | 2113.06 | 639.45 | 14,676.40 |
| 0 | 0.1 | 11.37 | 8.20 | 10.32 | 792.08 | 2588.25 | 0.00 | 475.33 | 11,974.90 | 12,450.20 | 10.01 | 7.59 | 1781.70 | 2089.62 | 0.00 | 13,818.00 |
| 2 | 0.1 | 11.38 | 8.21 | 10.32 | 793.17 | 2591.97 | 17.31 | 476.93 | 11,992.20 | 12,469.10 | 10.02 | 7.59 | 1784.52 | 2093.10 | 22.81 | 13,840.80 |
| 4 | 0.1 | 11.41 | 8.22 | 10.35 | 796.47 | 2603.17 | 69.84 | 481.81 | 12,044.30 | 12,526.20 | 10.04 | 7.60 | 1793.03 | 2103.60 | 92.16 | 13,909.60 |
| 6 | 0.1 | 11.45 | 8.25 | 10.39 | 802.03 | 2622.06 | 159.42 | 490.03 | 12,132.30 | 12,622.30 | 10.09 | 7.63 | 1807.40 | 2121.34 | 210.79 | 14,025.70 |
| 8 | 0.1 | 11.52 | 8.28 | 10.44 | 809.95 | 2648.95 | 289.22 | 501.80 | 12,257.50 | 12,759.30 | 10.14 | 7.66 | 1827.92 | 2146.66 | 383.55 | 14,191.60 |
| 10 | 0.1 | 11.61 | 8.32 | 10.51 | 820.37 | 2684.35 | 463.99 | 517.59 | 12,422.40 | 12,940.00 | 10.22 | 7.70 | 1855.02 | 2180.09 | 617.72 | 14,410.60 |
| 0 | 0.15 | 11.38 | 8.23 | 10.33 | 744.14 | 2612.75 | 0.00 | 416.62 | 11,883.30 | 12,299.90 | 10.05 | 7.67 | 1656.91 | 2153.41 | 0.00 | 13,580.60 |
| 2 | 0.15 | 11.39 | 8.24 | 10.34 | 745.16 | 2616.47 | 17.06 | 418.05 | 11,900.40 | 12,318.40 | 10.06 | 7.67 | 1659.49 | 2156.93 | 22.08 | 13,602.60 |
| 4 | 0.15 | 11.41 | 8.25 | 10.36 | 748.24 | 2627.69 | 68.84 | 422.38 | 11,951.80 | 12,374.10 | 10.08 | 7.68 | 1667.29 | 2167.55 | 89.18 | 13,669.20 |
| 6 | 0.15 | 11.46 | 8.28 | 10.40 | 753.43 | 2646.61 | 157.12 | 429.73 | 12,038.40 | 12,468.20 | 10.12 | 7.71 | 1680.45 | 2185.48 | 203.92 | 13,781.50 |
| 8 | 0.15 | 11.52 | 8.31 | 10.45 | 760.83 | 2673.54 | 285.01 | 440.31 | 12,161.90 | 12,602.20 | 10.18 | 7.74 | 1699.24 | 2211.07 | 370.91 | 13,942.00 |
| 10 | 0.15 | 11.61 | 8.35 | 10.52 | 770.56 | 2708.97 | 457.14 | 454.45 | 12,324.30 | 12,778.80 | 10.26 | 7.78 | 1724.04 | 2244.83 | 597.07 | 14,153.70 |
| 0 | 0.2 | 11.38 | 8.26 | 10.34 | 696.87 | 2636.91 | 0.00 | 359.47 | 11,793.00 | 12,152.50 | 10.09 | 7.74 | 1536.07 | 2215.15 | 0.00 | 13,350.60 |
| 2 | 0.2 | 11.39 | 8.27 | 10.35 | 697.82 | 2640.63 | 16.82 | 360.73 | 11,809.80 | 12,170.60 | 10.09 | 7.75 | 1538.43 | 2218.70 | 21.38 | 13,372.00 |
| 4 | 0.2 | 11.42 | 8.28 | 10.37 | 700.69 | 2651.87 | 67.86 | 364.58 | 11,860.50 | 12,225.10 | 10.12 | 7.76 | 1545.55 | 2229.42 | 86.33 | 13,436.40 |
| 6 | 0.2 | 11.46 | 8.31 | 10.41 | 705.53 | 2670.80 | 154.87 | 371.10 | 11,945.90 | 12,317.00 | 10.16 | 7.78 | 1557.58 | 2247.52 | 197.37 | 13,545.20 |
| 8 | 0.2 | 11.53 | 8.34 | 10.46 | 712.41 | 2697.77 | 280.88 | 380.49 | 12,067.60 | 12,448.10 | 10.22 | 7.81 | 1574.73 | 2273.35 | 358.88 | 13,700.40 |
| 10 | 0.2 | 11.61 | 8.38 | 10.54 | 721.47 | 2733.23 | 450.44 | 393.03 | 12,227.70 | 12,620.70 | 10.29 | 7.86 | 1597.37 | 2307.42 | 577.43 | 13,905.30 |
Table 9.
Stochastic demand (partial information/distribution-free).
| Decentralized Analysis | Centralized Analysis | |||||||||||||||
| 0 | 0 | 11.37 | 8.15 | 10.29 | 0.00 | 907.14 | 2571.43 | 403.64 | 12,500.00 | 12,903.60 | 9.94 | 7.44 | 0.00 | 2050.00 | 2000.00 | 14,128.10 |
| 2 | 0 | 11.36 | 8.16 | 10.30 | 17.89 | 916.81 | 2566.60 | 405.76 | 12,536.40 | 12,942.10 | 9.95 | 7.44 | 24.46 | 2053.30 | 2003.30 | 14,152.50 |
| 4 | 0 | 11.36 | 8.17 | 10.33 | 72.16 | 945.98 | 2552.01 | 411.11 | 12,646.50 | 13,057.60 | 9.97 | 7.45 | 98.83 | 2063.26 | 2013.26 | 14,226.30 |
| 6 | 0 | 11.35 | 8.19 | 10.36 | 164.73 | 995.15 | 2527.42 | 416.51 | 12,833.20 | 13,249.70 | 10.01 | 7.48 | 226.14 | 2080.08 | 2030.08 | 14,350.90 |
| 8 | 0 | 11.34 | 8.23 | 10.42 | 298.88 | 1065.20 | 2492.40 | 416.38 | 13,101.40 | 13,517.80 | 10.07 | 7.51 | 411.73 | 2104.11 | 2054.11 | 14,528.90 |
| 10 | 0 | 11.33 | 8.27 | 10.49 | 479.53 | 1157.41 | 2446.30 | 402.18 | 13,458.60 | 13,860.70 | 10.15 | 7.54 | 663.62 | 2135.87 | 2085.87 | 14,764.10 |
| 0 | 0.05 | 11.37 | 8.18 | 10.31 | 0.00 | 857.80 | 2596.10 | 343.19 | 12,406.80 | 12,750.00 | 9.98 | 7.52 | 0.00 | 1917.21 | 2066.39 | 13,876.10 |
| 2 | 0.05 | 11.37 | 8.19 | 10.32 | 17.63 | 866.91 | 2591.76 | 345.14 | 12,441.80 | 12,786.90 | 9.99 | 7.52 | 23.64 | 1920.24 | 2069.74 | 13,899.70 |
| 4 | 0.05 | 11.37 | 8.20 | 10.34 | 71.11 | 894.39 | 2578.65 | 350.02 | 12,547.60 | 12,897.60 | 10.01 | 7.54 | 95.51 | 1929.39 | 2079.85 | 13,971.00 |
| 6 | 0.05 | 11.36 | 8.22 | 10.38 | 162.30 | 940.72 | 2556.55 | 354.86 | 12,726.80 | 13,081.70 | 10.05 | 7.56 | 218.50 | 1944.84 | 2096.93 | 14,091.40 |
| 8 | 0.05 | 11.35 | 8.26 | 10.43 | 294.43 | 1006.71 | 2525.08 | 354.44 | 12,984.30 | 13,338.70 | 10.11 | 7.59 | 397.65 | 1966.90 | 2121.31 | 14,263.30 |
| 10 | 0.05 | 11.33 | 8.30 | 10.50 | 472.30 | 1093.55 | 2483.66 | 340.76 | 13,326.90 | 13,667.70 | 10.19 | 7.63 | 640.59 | 1996.05 | 2153.53 | 14,490.40 |
| 0 | 0.1 | 11.38 | 8.21 | 10.32 | 0.00 | 809.16 | 2620.42 | 284.35 | 12,315.00 | 12,599.30 | 10.02 | 7.60 | 0.00 | 1788.71 | 2130.65 | 13,632.20 |
| 2 | 0.1 | 11.37 | 8.22 | 10.33 | 17.37 | 817.71 | 2616.56 | 286.13 | 12,348.60 | 12,634.70 | 10.02 | 7.61 | 22.87 | 1791.49 | 2134.04 | 13,655.00 |
| 4 | 0.1 | 11.37 | 8.23 | 10.35 | 70.08 | 843.54 | 2604.91 | 290.56 | 12,450.10 | 12,740.60 | 10.05 | 7.62 | 92.36 | 1799.87 | 2144.29 | 13,723.90 |
| 6 | 0.1 | 11.36 | 8.25 | 10.39 | 159.93 | 887.06 | 2585.26 | 294.88 | 12,622.10 | 12,917.00 | 10.09 | 7.64 | 211.22 | 1814.03 | 2161.59 | 13,840.30 |
| 8 | 0.1 | 11.35 | 8.29 | 10.44 | 290.08 | 949.06 | 2557.29 | 294.18 | 12,869.10 | 13,163.30 | 10.15 | 7.67 | 384.26 | 1834.24 | 2186.29 | 14,006.50 |
| 10 | 0.1 | 11.34 | 8.33 | 10.52 | 465.24 | 1030.62 | 2520.47 | 281.02 | 13,197.60 | 13,478.70 | 10.23 | 7.71 | 618.71 | 1860.92 | 2218.91 | 14,225.90 |
| 0 | 0.15 | 11.38 | 8.24 | 10.33 | 0.00 | 761.19 | 2644.41 | 227.07 | 12,224.40 | 12,451.50 | 10.05 | 7.68 | 0.00 | 1664.29 | 2192.86 | 13,396.00 |
| 2 | 0.15 | 11.38 | 8.25 | 10.34 | 17.12 | 769.21 | 2641.02 | 228.69 | 12,256.60 | 12,485.30 | 10.06 | 7.68 | 22.13 | 1666.82 | 2196.29 | 13,418.10 |
| 4 | 0.15 | 11.37 | 8.26 | 10.36 | 69.06 | 793.40 | 2630.80 | 232.69 | 12,354.00 | 12,586.70 | 10.08 | 7.70 | 89.36 | 1674.49 | 2206.66 | 13,484.80 |
| 6 | 0.15 | 11.37 | 8.28 | 10.40 | 157.60 | 834.17 | 2613.56 | 236.50 | 12,519.00 | 12,755.50 | 10.13 | 7.72 | 204.30 | 1687.43 | 2224.17 | 13,597.40 |
| 8 | 0.15 | 11.36 | 8.32 | 10.46 | 285.82 | 892.23 | 2589.03 | 235.56 | 12,755.80 | 12,991.40 | 10.18 | 7.75 | 371.54 | 1705.90 | 2249.15 | 13,758.10 |
| 10 | 0.15 | 11.34 | 8.36 | 10.53 | 458.32 | 968.61 | 2556.75 | 222.93 | 13,070.60 | 13,293.50 | 10.26 | 7.79 | 597.92 | 1730.27 | 2282.13 | 13,970.20 |
| 0 | 0.2 | 11.38 | 8.27 | 10.35 | 0.00 | 713.89 | 2668.06 | 171.31 | 12,135.10 | 12,306.40 | 10.09 | 7.75 | 0.00 | 1543.75 | 2253.13 | 13,167.20 |
| 2 | 0.2 | 11.38 | 8.28 | 10.35 | 16.88 | 721.38 | 2665.13 | 172.77 | 12,166.00 | 12,338.70 | 10.10 | 7.76 | 21.42 | 1546.06 | 2256.60 | 13,188.60 |
| 4 | 0.2 | 11.38 | 8.29 | 10.38 | 68.07 | 743.96 | 2656.32 | 176.36 | 12,259.40 | 12,435.70 | 10.12 | 7.77 | 86.50 | 1553.05 | 2267.08 | 13,253.20 |
| 6 | 0.2 | 11.37 | 8.31 | 10.41 | 155.33 | 782.02 | 2641.47 | 179.69 | 12,417.50 | 12,597.20 | 10.16 | 7.79 | 197.71 | 1564.84 | 2284.76 | 13,362.20 |
| 8 | 0.2 | 11.36 | 8.35 | 10.47 | 281.66 | 836.22 | 2620.32 | 178.52 | 12,644.40 | 12,822.90 | 10.22 | 7.83 | 359.42 | 1581.67 | 2310.00 | 13,517.70 |
| 10 | 0.2 | 11.35 | 8.39 | 10.54 | 451.56 | 907.50 | 2592.50 | 166.42 | 12,945.80 | 13,112.20 | 10.29 | 7.87 | 578.15 | 1603.86 | 2343.29 | 13,722.80 |
Publisher’s Note: MDPI stays neutral with regard to jurisdictional claims in published maps and institutional affiliations. |
© 2020 by the author. Licensee MDPI, Basel, Switzerland. This article is an open access article distributed under the terms and conditions of the Creative Commons Attribution (CC BY) license (http://creativecommons.org/licenses/by/4.0/).
Share and Cite
MDPI and ACS Style
Raza, S.A. Price Differentiation and Inventory Decisions in a Socially Responsible Dual-Channel Supply Chain with Partial Information Stochastic Demand and Cannibalization. Sustainability 2020, 12, 9577. https://doi.org/10.3390/su12229577
AMA Style
Raza SA. Price Differentiation and Inventory Decisions in a Socially Responsible Dual-Channel Supply Chain with Partial Information Stochastic Demand and Cannibalization. Sustainability. 2020; 12(22):9577. https://doi.org/10.3390/su12229577
Chicago/Turabian StyleRaza, Syed Asif. 2020. "Price Differentiation and Inventory Decisions in a Socially Responsible Dual-Channel Supply Chain with Partial Information Stochastic Demand and Cannibalization" Sustainability 12, no. 22: 9577. https://doi.org/10.3390/su12229577
Note that from the first issue of 2016, this journal uses article numbers instead of page numbers. See further details here.