Life Cycle Assessment of an Electric Chiller Integrated with a Large District Cooling Plant


Department of Mechanical Engineering, Universiti Teknologi PETRONAS, Seri Iskandar, Perak 32610, Malaysia
*
Author to whom correspondence should be addressed.
Sustainability 2021, 13(1), 389; https://doi.org/10.3390/su13010389
Submission received: 17 October 2020
/
Revised: 17 December 2020
/
Accepted: 23 December 2020
/
Published: 4 January 2021
(This article belongs to the Collection Advanced Methodologies for Sustainability Assessment: Theory and Practice)
Abstract
:District cooling (DC) systems have recently proven to be more economically and environmentally viable as compared to conventional cooling techniques. In most DC setups, electric centrifugal chillers (ECCs) are installed to provide chilled water (CW) to charge the thermal energy storage (TES) tank or for direct CW supply to the DC network. The operation of these ECC systems consumes most of the electrical power supplied to the entire DC plant; this therefore strengthens the need to conduct a comprehensive environmental assessment in order to quantify the indirect ecological impact resulting from the energy consumed in the ECC system operation. In order to achieve this, a case study was conducted of four ECC systems with a use-life of 25 years installed in a large DC plant in Malaysia. A gate-to-gate life cycle assessment (LCA) methodology was adopted to analyze the environmental performance of the system setup. The result of the study year reveals that April and June account for the highest and lowest environmental impact, respectively. The influence of climatic temperature conditions on the monthly cooling and environmental load distribution was also observed from the results. Finally, in substantiating the study’s investigation, environmental performance based on the composition of two different electricity fuel mixes is discussed and compared. The results revealed a drastic decrease in environmental load as the ratio of non-renewable energy sources decreased in the composition of the mix, thereby reducing the contribution of the overall environmental impact of the ECC systems’ use phase.
1. Introduction
Heating, ventilation, and air conditioning (HVAC) systems account for a substantial amount of roughly 50% of electricity consumption in many regions around the world, especially in humid countries like Malaysia [1]. In Malaysia, central air conditioning (AC) systems with chiller plants are the primary energy consumer, using an estimated 57% of a building’s total energy when operational [2].
Currently, conventional on-site cooling units like split systems and chiller systems (either air or water-cooled) installed either on the basement or rooftops are commonly used to satisfy cooling load worldwide. At these end-user sites, cold energy is generated and distributed for air conditioning purposes [3]. In comparing these techniques with commercial district cooling (DC) systems, on-site air conditioning is 50% less efficient than a well-managed commercial DC and heating system, and a lot of methods have been developed by researchers over the past decades to optimize the operations of DC and heating systems [4,5].
The use of large thermal energy storage (TES) tanks integrated with DC systems, which are charged with chillers during off-peak periods, is an emerging technique that is being rapidly implemented in growing urban cities, especially those with very humid temperatures [6]. This centralized technique presents numerous advantages and improved value compared to standalone air conditioning units. Some of these advantages include reduced energy consumption, cumulative installation, and operation and maintenance cost; improved handling and maintenance; enhanced environmental conditions with fewer emissions; space management; guaranteed service reliability; and longer lifespan [3,4,7,8].
In a sustainable DC system, waste heat sources from industrial power equipment and electricity from the grid are used to drive the suction absorption chiller (SAC) and vapor compression chiller (VCC), respectively. Of the electricity supplied from the grid to the DC system, the VCC on its own consumes up to 40%, making it the most energy-consuming equipment in the DC system. In Malaysia, the electricity generation fuel mix primarily consists of fossil fuel, with less dependence on renewable energy sources like hydropower and solar energy. As Malaysia is one of the highest emitters of greenhouse gases (GHGs) in Southeast Asia, the Malaysian government has taken steps to introduce policies towards fuel diversification, considering the inclusion of better fuel alternatives and renewable sources of energy in the electricity mix. As described in the literature [9,10,11], the choice of electricity mix is critical in the nation’s quest to achieve a sustainable environment. The Prime Minister of Malaysia at the United Nations (UN) Summit in 2014 announced that the government is poised to establish a 40% reduction in CO2 emission of the amount reported in the Copenhagen Climate Change Convention 2009. This was in order to achieve a sustainable future by utilizing most of the country’s rich renewable energy resources to meet both current and projected energy demands.
Various qualitative and quantitative techniques have been developed and applied in the past few decades for assessing the environmental performance of energy systems like chillers, which utilize a massive amount of energy for their operation. Some of these commonly used quantitative or qualitative tools include simplified life cycle assessment (LCA) checklist, LCA, environmental benchmarking, and material, energy, and toxic emissions (MET) matrix. Amongst these, LCA stands out as the best quantitative analytic environmental tool for both renewable and non-renewable fossil-based systems [12,13]. Since the decisions of policymakers and consumers are now based on product sustainability evaluation, accurate data analysis of the product life cycle is necessary [14].
Some notable studies have conducted various forms of analysis to examine the environmental and LCA implications resulting from the usage of chillers and other air conditioning systems, as summarized below.
Saidur et al. [15] examined the energy consumption and emissions related to the operation of the chiller and other chiller plant components installed in a university powered by fossil fuel-generated electricity. They estimated the emissions and energy savings resulting from incorporating the chillers and motors with variable speed drives (VSDs). They reported that usage of VSDs in chiller plants resulted in a 60% speed reduction and a total of 2,426,769 kg of CO2 emission savings.
Catrini et al. [9] proposed a joint method based on thermo-economics and LCA for assessing the impact of energy systems on environmental profile. This method was used to evaluate a water-cooled scroll compression chiller for cooling a large office building. The authors simulated the operation of the chiller system on an IMST-ART simulator and compared various chiller configurations to their corresponding environmental gains. The authors reported that the use phase has the highest contribution to the ecological impact. They also stated that the choice of electricity generation mix (in this case, the Italian grid energy mix) used to power the chiller provided more significant tradeoffs between the exergo-environmental impacts.
L. Gu et al. [16] reported an LCA study on the design of HVAC systems using an integrated index covering the total environment in terms of resource consumption, energy consumption, and pollutant emission through a life cycle assessment of the building energy system. An economic evaluation and the life cycle environmental load (LCEL) of four cooling and heating systems were analyzed and compared, with the optimal options proposed. Based on the findings, the authors noted that the option of a gas-fired boiler and electrical water-cooled chiller for heating and cooling has the lowest LCEL and best economic performance.
K. Almutairi et al. [17] reported an LCA and economic study of a vapor compression system (VCS) installed in residential buildings in Saudi Arabia. The results revealed that the use phase accounts for the highest environmental impacts and that the type of primary fuel used to drive the plant influenced the extent of the evaluated impact. Results of economic analysis indicate using a more efficient air conditioner in apartments and traditional houses is not attractive to the customer. From the government point of view, installation and utilization of more efficient air conditioner systems is always beneficial from an economic and environmental perspective.
An LCA of air conditioners using alternative refrigerants was undertaken by Kazuta et al. [18] in order to quantify and compare environmental impact. The study involved two air conditioner units for residential use. The refrigerants used in this study included the HCFC22, HFC410A, and HFC32 models. The results of the study revealed that the effect of global warming is reduced to a certain extent by using a HFC410A refrigerant and is even further improved with a HFC32 refrigerant. It was therefore proved that the HFC32 model is a more environmentally friendly refrigerant as compared to the other refrigerants considered in the study.
S. Liu et al. [19] conducted an LCA study in order to analyze a chilled ceiling system installed in Singapore. The result of the research indicates that the use phase of the system accounts for most environmental burdens. The accumulated ecological impact of the use phase recorded a drastic decrease as cleaner sources of energy was introduced into the grid electricity mix.
Cascini et al. [20] conducted an LCA study on a commercial refrigerator system with alternative refrigerants and different user configurations. Life cycle impact assessment (LCIA) step is performed through the evaluation of the carbon footprint CF associated with each life cycle phase of both refrigerator and refrigerant blend. The study reported that energy consumption during the use phase resulted in the highest magnitude of CF in its life cycle, about 76% of the entire CF. In comparison, gas leakage contributed about 20.2% of the CO2 emissions. The authors, however, noted that the environmental impact of the manufacture and disposal phase of the refrigerator is negligible.
As observed, studies based on LCA on various HVAC systems are insufficiently available, especially in countries with tropical weather conditions that are hot and humid all year round like Malaysia. This study is inspired to address this gap and provide added assistance to policymakers, energy, and air conditioning experts to make an informed decision in selecting the appropriate air conditioning system designs and configuration geared at achieving a sustainable environment. In this research, a gate-to-gate (use phase) LCA methodology is applied to evaluate the electric centrifugal chillers (ECC) installed in a large DC plant in Malaysia, to assess the environmental impact as a result of the usage of energy in driving the ECC system. Unlike other studies, this research also presents a comprehensive environmental impact assessment report based on the monthly and annual energy usage as influenced by choice of the electricity generation fuel mix. Finally, the result of the ecological gains due to the use phase of the ECC system under an optimized electricity mix is discussed and compared to the present state.
2. Methodology
2.1. Introduction to Life Cycle Assessment
LCA is a systematic analytical tool used for environmental assessment of a products’ entire life cycle. LCA evaluates and weighs a product from the viewpoint of the environmental load and the impact of the burden on the ecosystem, human health, and natural resources [21]. LCA provides a uniquely defined concept in the form of a functional unit which enables for comparison between similar systems. In this study, the function provided is the capacity of chilled water produced by the chiller plant for district cooling. The integrated LCA approach is a chain of linear equations, mass and energy balances representing the compilation and analysis of various system inputs, outputs, and corresponding environmental impact throughout the process of the product life cycle.
LCA has a standardized methodology, as revealed in ISO 14040 [22] and 14044 [23], which are universally applied by researchers and practitioners. The general LCA methodology provided in the ISO 14040 series is characterized by a technically robust framework that considers every aspect of the product life cycle, including the system up and downstream. The framework provided includes four steps, namely; goal and scope, life cycle inventory analysis (LCI phase), life cycle impact assessment (LCIA), and life cycle interpretation as shown in Figure 1.
2.1.1. LCA Framework
A brief description of the LCA framework is given below.
Goal and Scope:
The goal addresses questions on the target audience and objective of conducting the assessment, while the scope defines the depth and breadth of the system boundary, also defining the functional unit, data sources, quality of data, method of impact assessment, among others.
Life Cycle Inventory Analysis (LCI):
The collection and analysis of system data necessary to fulfil the goal of the study are carried out in this phase. LCI generates a quantitative environmental load evaluation. This evaluation involves various inputs (e.g., material and energy) with its corresponding outputs (e.g., emissions and products) representing each unit process of the system. The LCI result is therefore derived by adding all the fractional input and output contributions of each unit process involved in the life cycle of the product.
Life Cycle Impact Assessment (LCIA):
At this phase, the environmental impact as a result of the weighted environmental load of the product is characterized [24]. LCI results are assigned to the environmental impact classification selected, and characterization is done by calculating the category indicators. Figure 2 shows the relationships between the various mandatory elements and their respective indicators in LCIA.
Life Cycle Interpretation:
In this last phase, environmental results are evaluated based on sensitivity, completeness, and consistency of the LCA of the product. A report is therefore drawn summarizing the various steps, conclusions, and recommendations made.
2.1.2. Summary of LCA Study Boundaries
Cradle-to-Grave:
This phase begins from the raw material extraction through the product use and disposal phase.
Cradle-to-Cradle:
This begins from the raw material extraction phase through the product use and disposal phase to the recycling phase of the product.
Cradle-to-Gate:
Starts from the raw material extraction phase to the factory gate.
Gate-to-Gate:
The analysis begins from a particular phase of the product’s life cycle to a determined stage in the product life cycle. This aspect of the LCA boundary was applied in this study.
2.2. Life Cycle Assessment of an Electric Chiller:
2.2.1. Goal and Scope Definition
The goal of this study is to quantify the environmental impact incurred from the lifespan operation of an ECC system integrated with a large DC plant in Malaysia, a country with a hot, humid weather condition, with a largely stable temperature. A gate-to-gate LCA methodology is adopted for this purpose. Conclusions in this study are intended to aid policymakers and plant designers in making an informed decision that would ensure environmental sustainability. Thus, the environmental contributions as a result of the energy used to power the chiller system throughout its use phase are evaluated. In weighing the environmental benefits, results derived from the LCA analysis are compared to other scenarios where a better-optimized fuel mix is incorporated into the nation’s grid electricity generation as proposed for the year 2030. The study was also conducted to evaluate the environmental impact contribution of the ECC system based on its monthly usage, so as to have a clearer understanding of the influence of climatic weather conditions on the air conditioning demand and its subsequent effect on the selected environmental categories.
System Description
The DC plant is installed with four ECC systems with an average coefficient of performance (COP) of 5.5 and two TES tanks with a total holding capacity of 50,000 RTh with a dimension of 24.5 m in diameter and 27.8 m in height. The ECC system uses the R134a refrigerant and supplies chilled water to the air handling unit at 5 °C and receives at 11 °C, while it supplies cooling water at 33 °C and receives at 28 °C to and from the cooling tower. In this study, the environmental impact as a result of the operation of 4 ECC systems installed in a large DC plant will be considered. The chiller system is designed to function on a full operating strategy where two ECC systems operate at full capacity during the off-peak period (10 p.m.–8 a.m.) to charge the TES tanks. The other two ECC systems are used as standby chillers to support the cooling load during breakdown or scheduled maintenance of the plant and in scenarios of high chilled water demand. A sample data illustrating a week operation of the four ECC systems is reported in Figure 3.
Functional Unit FU
The FU chosen in this study is an ECC chiller system used to supply chilled water for a DC network. The idea of FU helps provide the bases for comparison of these systems with other design alternatives in order to highlight possible and meaningful benefits. This study’s functional units referred to 1RTh of chilled water produced by the chillers and supplied to the district network for air conditioning purposes throughout its use phase of 25 years. In this study, the marginal electricity of the facility’s host country (Malaysia) is used to conduct the impact assessment. The base study result allows for comparison with more sustainable fuel mix options for grid electricity generation.
System Boundaries and Limitations
Based on the shortage of credible system data, the system boundary considered in this study covers the 25 years use phase of the life cycle of the ECC system, no other phase was considered in this study. Moreover, numerous LCA studies on energy systems [16,19,26,27] showed that the use phase had a more dominant environmental impact compared to other phases with overall influence sometimes considered negligible. The system boundary of this research is structured in such a way to quantify the amount of electricity consumed by the ECC systems in producing chilled water and the equivalent indirect emission incurred as a result of the combustion of fossil fuel in the electricity generation plant. Apart from the indirect emission incurred from fuel combustion in the generation plant, no other chemical emissions were considered in this study. Figure 5 shows the schematic of the system boundary of the chiller systems under investigation.
2.2.2. Life Cycle Inventory
Operation data of four ECC systems were acquired and used to define the characterization of the system unit in terms of estimating its environmental impact. Data used in building the LCI analysis were obtained from plant technicians, technical datasheets of the unit components, and literatures. The data included minute sensor readings of the four ECC systems in an entire year (January–December). The data revealed parameters like the chilled water temperatures and mass flowrates, chilled water suction and discharge pressure, coefficient of performance (COP), and refrigeration ton (RT) of chilled water generated per unit time. Analyzing the raw data, it is observed that the COP value of the ECC systems throughout its operation showed slight variation, with an average value of 5.5. This is as a result of the stable ambient temperature as experienced in the region. In addition, the ECC systems are installed with constant speed compressors which are used to drive the system to produce chilled water (CW) at full load capacity to charge the TES tank during off peak periods (10 p.m.–8 a.m.). Electrical power (EP) used to drive these systems are acquired directly from the grid electricity supply. Excel spreadsheet software is used to prepare, manage, and analyze the data as obtained in raw format from the plant technicians. The amount of electrical energy consumed per year is assumed to be the same throughout its lifespan.
Mathematical formulation to estimate the amount of EP used per hour by the chillers is given in Equation (1):
where,
- EP = electrical power demand (kWh),
- m = number of chiller,
- n = number of minutes,
- j = number of considered working chillers,
- CL = cooling load (RT),
- COP = coefficient of performance (-), and
- Converting RT to kW: 1 refrigeration ton equals to 3.5168525 kilowatts.
Malaysia is regarded as a maritime country which is located close to the equator, between 112°30′ E and 2°30′ N. The country experiences a tropical climatic condition, with a high temperature, humidity, and illumination. The temperature variation throughout the day ranges from 24–38 °C, with sunshine duration averaging 6 h. The lowest temperature is experienced during night-time [28]. Climatic data provided by the Malaysian Meteorological Department [28,29] is used to compare the monthly chilled water demand trend based on the average monthly temperature. The chart in Figure 6 shows the level of contribution in terms of chilled water production and electricity consumed by the individual ECC systems on a monthly basis.
Since the base study is in Malaysia, the eco-profile considered for the electricity used in running these ECCs is the Malaysia power generation mix (Tenaga Nasional Berhad). According to the Malaysia energy statistics handbook [30], the present fuel mix used in generating electricity in Malaysia contains 43.4% coal, 39% gas, 15.6% hydro, and 1.92% of others. The percentage of GHG emissions from the combustion of fossil fuel for a unit of electricity generation are presented in Table 1.
The mathematic formulation to estimate the environmental load (EL) based on the combustion of fossil fuel mix to generate electricity are given in Equation (2):
where,
- Exi,hr = gas emission per hour,
- xi = type of gas (CO2, SO2, NOx, CO etc.),
- yi = type of fuel,
- EMxi,yj = fuel emission per unit electricity,
- FMyi = percentage of fuel mix.
LCI analysis between the base and optimized electricity mix technologies is conducted and the results compared in order to quantify the environmental impact as a result of the choice of the fuel mix in electricity grid generation.
2.2.3. Life Cycle Impact Assessment
The goal of this study, as previously mentioned is to conduct a gate to gate LCA on ECC systems integrated with a DC plant. The main objective of this research is to estimate the monthly, annual, and use-life electricity usage and its equivalent environmental impact.
The LCIA categories chosen for this study in quantifying the energy-environmental impact of the FU are listed in Table 2. The characterization factors used for evaluating the non-renewable (fossil fuel) energy combustion and its emission was acquired from the ILCD 2011 impact assessment method [31,32]. Table 3 shows the characterization (equivalency) factor used in estimating environmental impact in this study.
3. Results and Discussion
In this section, the results of the LCI analysis are presented and discussed. The environmental impact as a result of the LCI analysis is also presented, in fulfilment of the outlined goals and objectives of this study.
3.1. LCI Result
The result of the monthly contribution of the individual ECC system in the production of chilled water supplied to the DC networks is reported in Figure 6. The result as analyzed indicates April and June as the months with the highest and lowest cooling demands, respectively. The average monthly temperature trend on the chart also proves the influence of climatic weather conditions on refrigeration demands. This clearly shows that as the earth keeps warming up, the demand for air conditioning will keep increasing. The percentage contribution made by the individual ECC system in satisfying the monthly and yearly cooling demands are revealed in Figure 6 and Figure 7, respectively. From the result, as represented, it can be observed that ECC A and B satisfied 79% of the yearly cooling load, while ECC C and D covered the rest 21%. This indicates that ECC A and B consumed a more significant amount of electricity compared to ECC C and D in their overall operation.
The result presented in Figure 8 shows the estimated monthly EP usage by the ECC systems in producing chilled water for the DC networks. As expected, the month of April and June consumed the highest and lowest amount of electrical energy respectively in the study year, which is proportional to the rate of their usage with time.
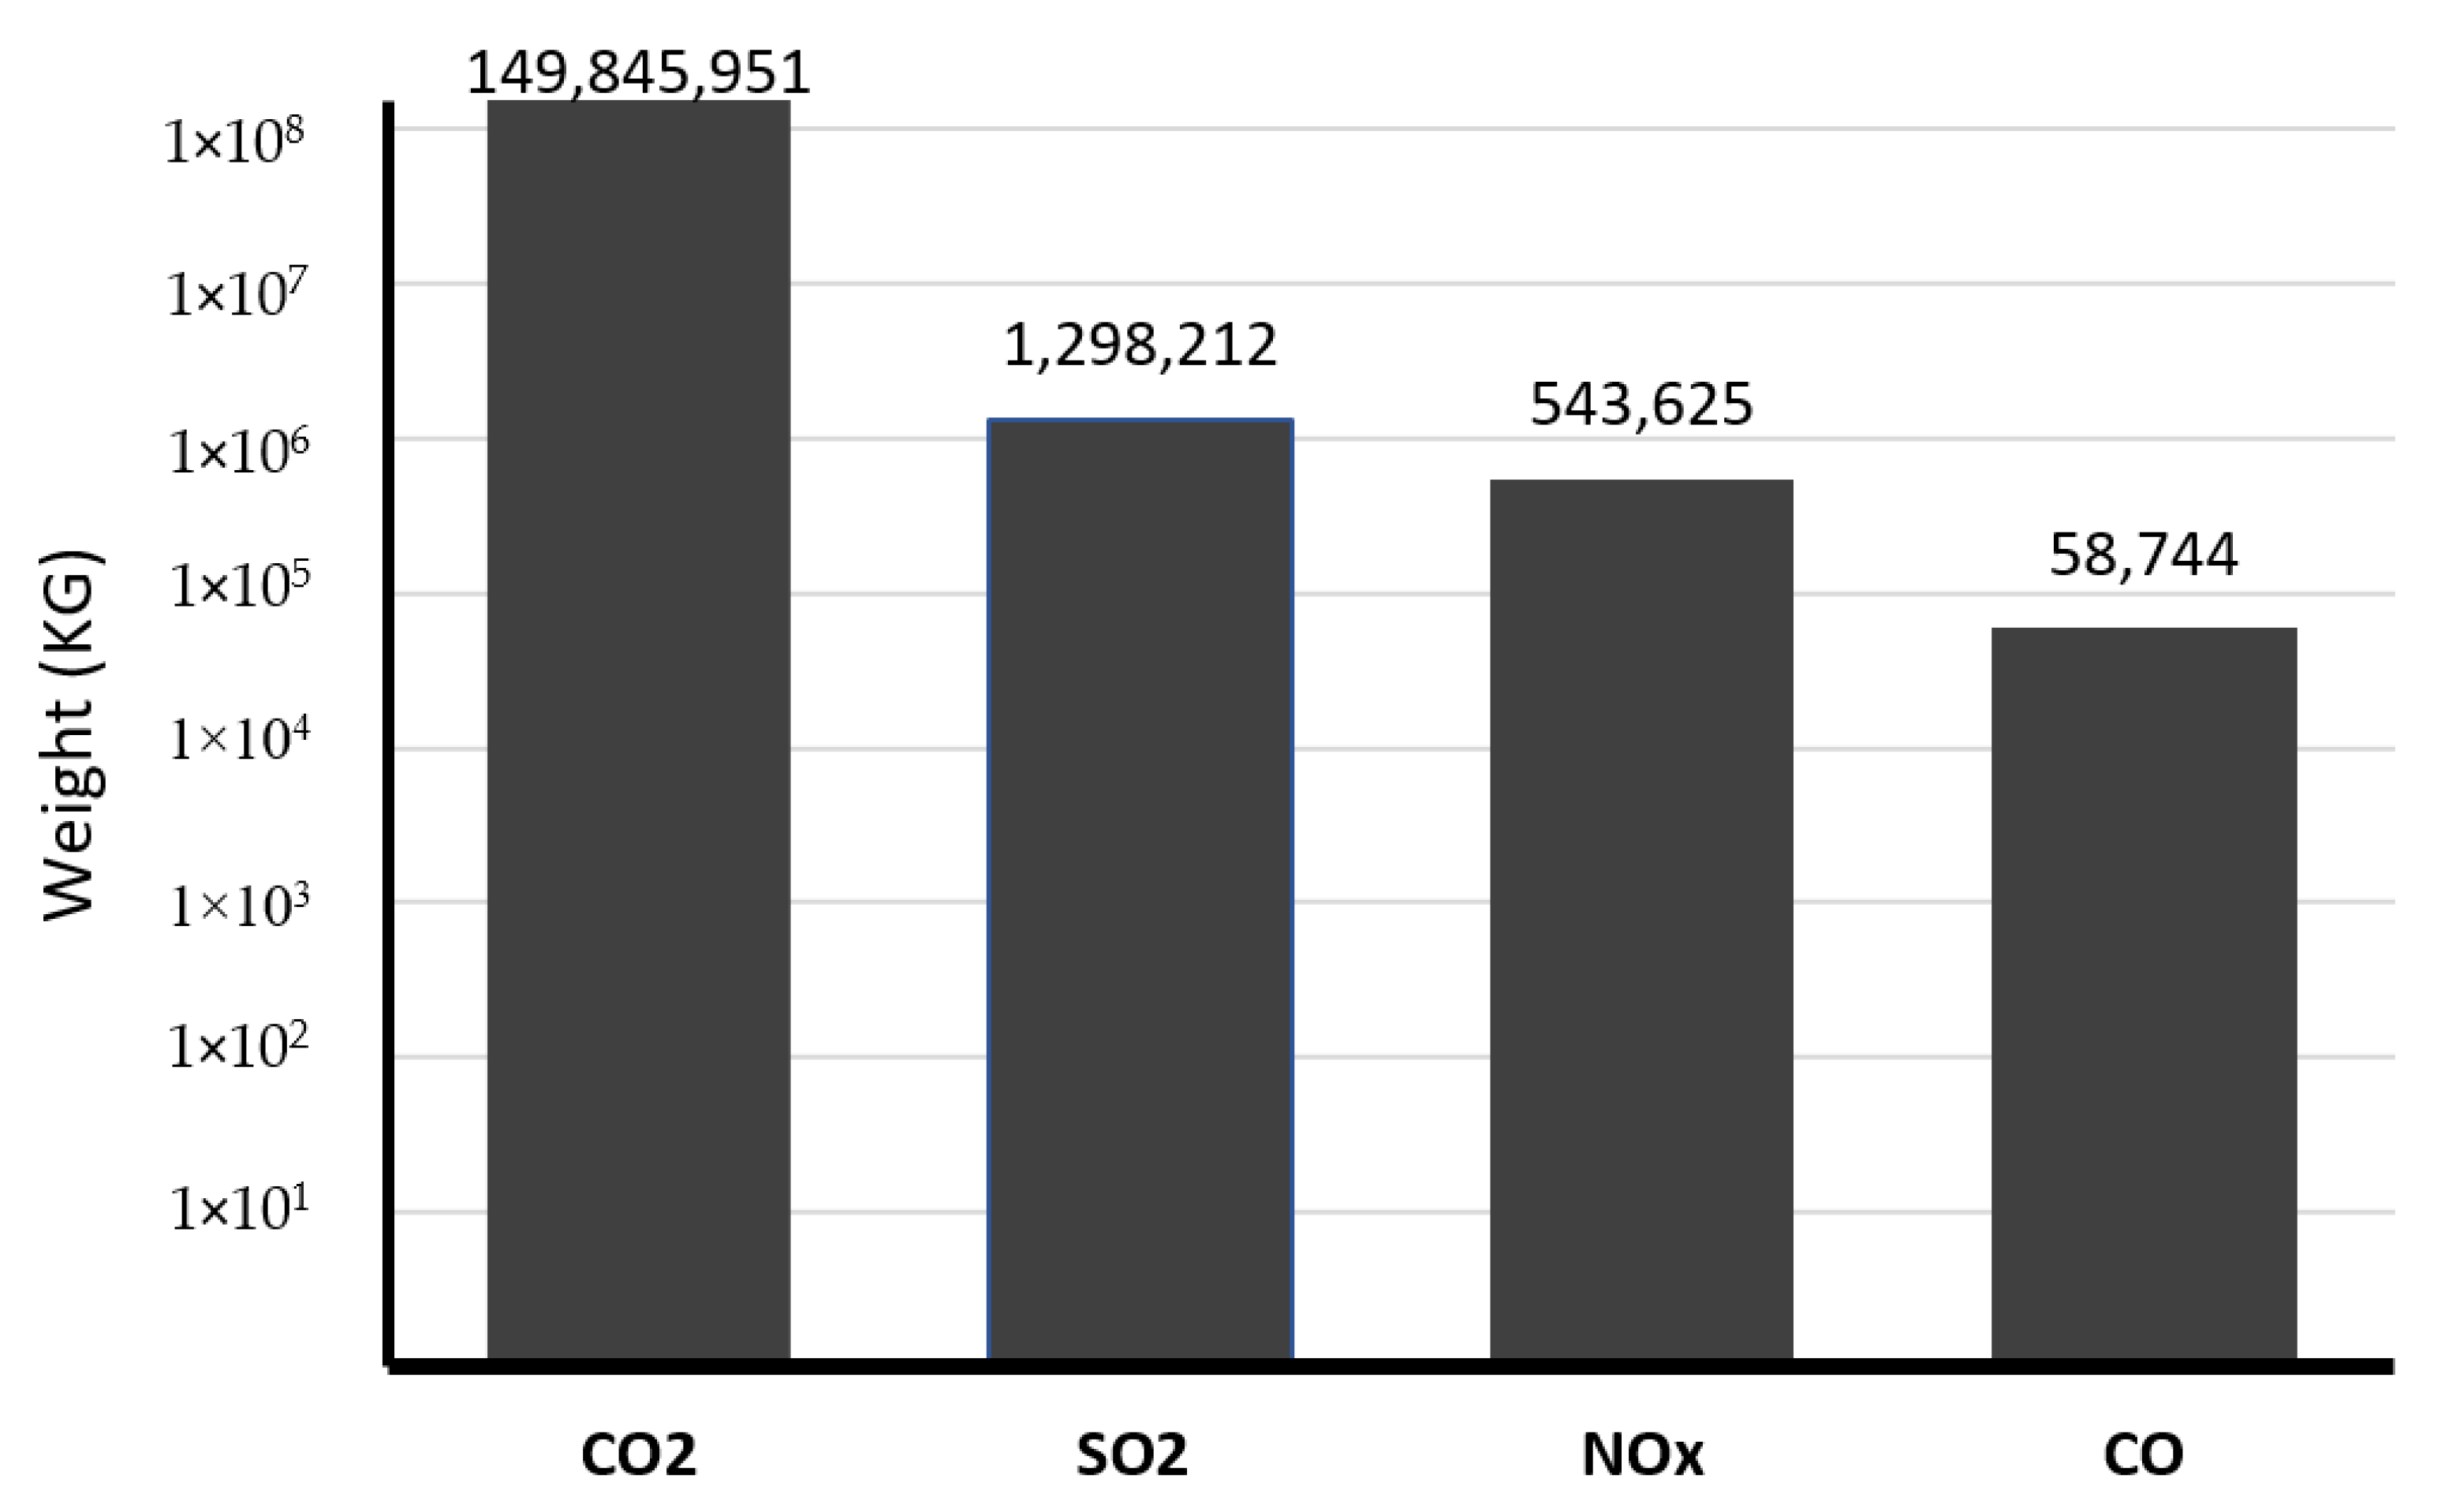
The LCI result of the use phase of the case study is shown in Figure 9. The Malaysia electricity fuel mix 2020, as previously stated, is used for this analysis.
3.2. LCIA Results of the ECC Systems
In understanding the dynamic trend of the environmental impact throughout the study year, the LCIA of the ECC systems year is reported. From the result, as shown in Figure 10, the month of June and July experienced the widest variation (difference of 52%) in terms of the analyzed impact as reported for both months. While April and June recorded the highest (10%) and lowest (5%) environmental impact per total annual impact. These are situations influenced mainly by the rate at which the chillers are used to produce chilled water for air conditioning purposes in the district network throughout the months. Results in Figure 6 and Figure 9 reveals the proportional relationship between ECC consumption of electricity from fossil-fueled generation plants and the indirect environmental load incurred, and this relationship is following findings in several pieces of literature [19,37,38,39]. In addition, the result shown in Figure 11 presents the entire LCIA result for the use phase of the ECC system.
3.3. Comparison with Different Electricity Mix
As reported in numerous literature, electricity consumption has the most significant influence on the environmental impact as compared to other impacting categories [19,37,38,39]. The electricity fuel mix used in this study’s analysis is the present 2020, and the proposed optimized electricity mix by 2030 in Malaysia by Rina et al. [40]. The percentage of the fuel mix as used in this study is presented in Table 4. In accordance to the record of natural gas production in 2005, production of sustainable amount of natural gas can only be retained for as long as 21 years from that time [41]. Meanwhile deposits of coal are available in substantial quantities in various regions in Malaysia, with Sarawak supplying about 83% of the country’s total reserve [41].
In a quest to fulfil the voluntary Paris agreement as rectified in 2016, where the Malaysian government pledged to reduce the CO2 emission further by 45% in 2030, as suppose by 35% agreed in 2005, a complete restructuring of the power generation sector is needed. Rina et al. [11,40] proposed an optimized least cost-effective and futuristic power generation mix technology to fulfil the Malaysia 2016 rectified Paris agreement by 2030. The least-cost optimized formulation fuel ratio is applied to the existing plant and then complimented with more percentage of renewable technologies sources like hydropower, photo-voltaic (PV), etc. Fuels like diesel oil, conventional and open gas turbines were retired entirely from the grid generation fuel mix before 2030.
The result comparing the LCI analysis of the considered fuel mixes is presented in Figure 12. As observed, a 30% average reduction was recorded across emissions, with CO2 recording the most decrease of 43% and SO2 with the least (22%). This result, therefore, signifies the influence of the choice of the electricity mix in quantifying the level of environmental emissions as it concerns reducing the ecological impact of the ECC systems’ operation phase.
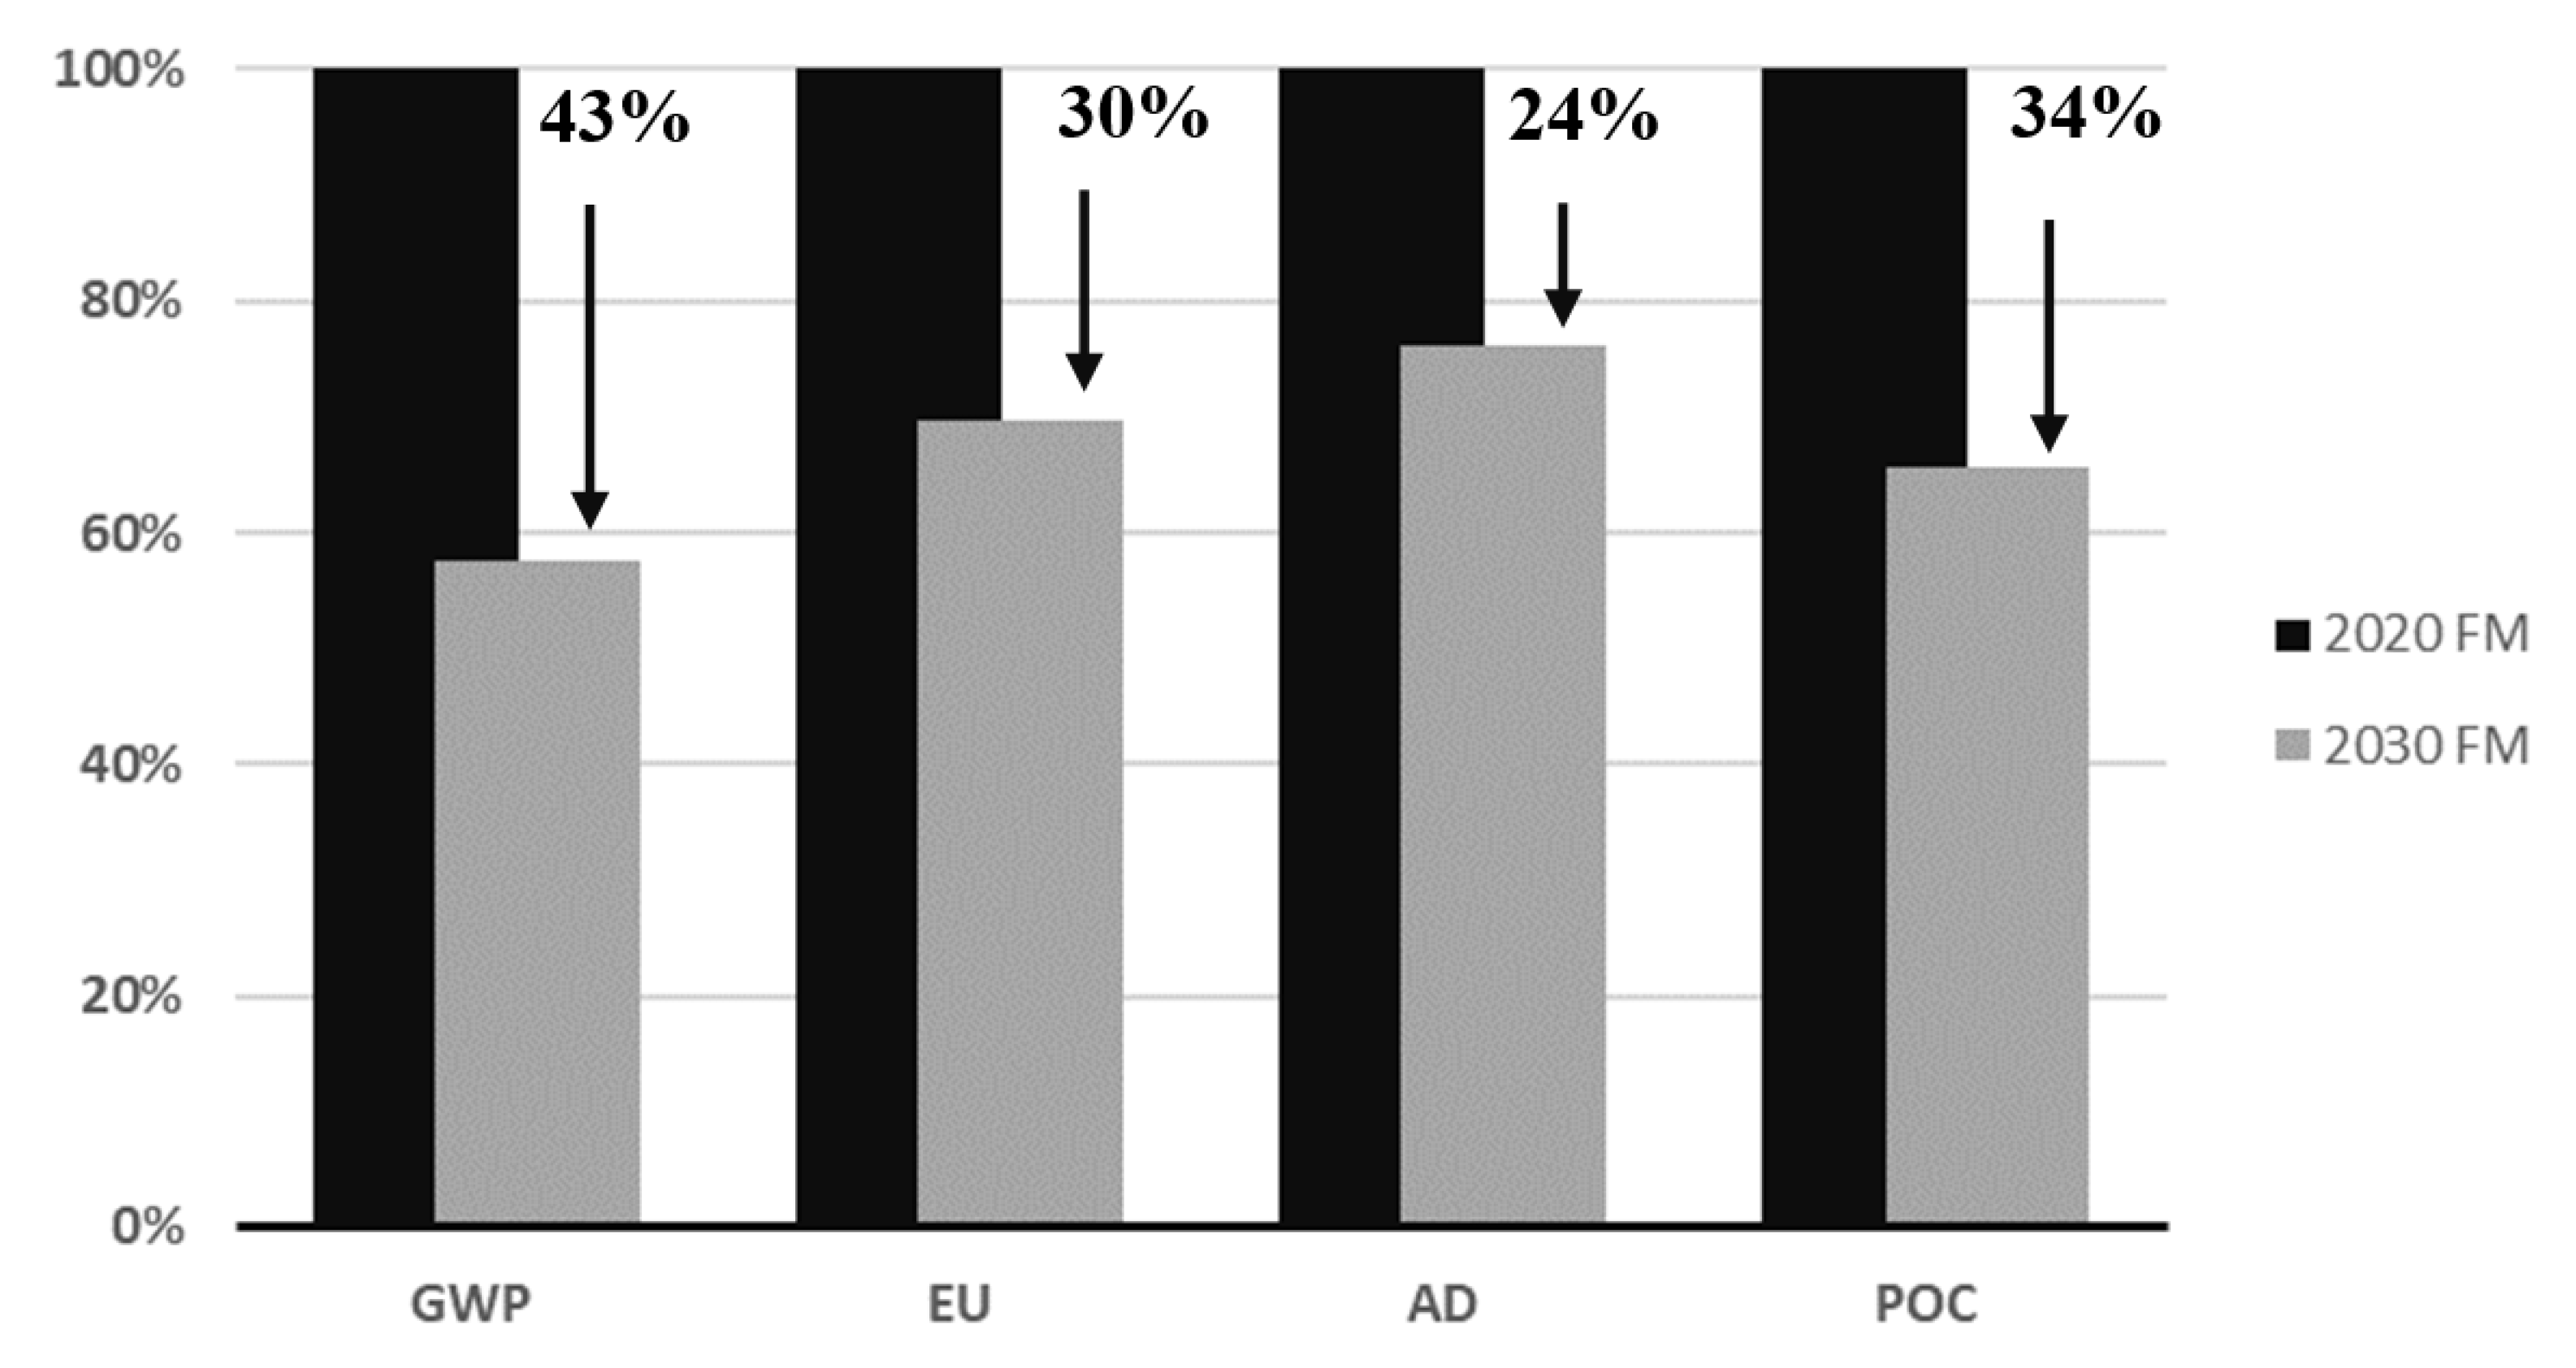
LCIA results quantifying the environmental gains in all selected environmental categories in both scenarios are presented and compared in Figure 13. As observed from the results, an average of 33% reduction is achieved across all selected environmental categories as a result of using the optimized electricity mix, with GWP recording the most decrease of 43% and AD with the least (24%).
The result signifies that an increase in the capacities of clean energy sources like hydropower plants and the respective reduction and retirement of coal and gas power technologies from the Malaysia grid electricity mix resulted in a drastic decrease in all considered environmental indicators.
4. Conclusions
In this research, a gate-to-gate LCA methodology is used to analyze the environmental impact of four ECC systems used to produce chilled water in a large DC plant installed in Malaysia. The result analysis throughout the study year reveals that April and June have the highest and lowest contribution to the overall environmental impact categories, which included GWP, EU, AD, and POC, respectively. As observed, the monthly rise and fall of the environmental burden are largely influenced by the country’s average climate temperature, with hotter months having higher cooling demands, this therefore implies that as the earth keeps heating, the demand for air conditioning increases.
Finally, the environmental impact of using two different compositions of electricity mix was compared in the research. The result reveals that as the presence of non-renewable energy sources (fossil fuel) reduces while increasing the ratio of clean energy sources in the grid’s electricity mix, the environmental performance tremendously improves, thereby reducing the overall contribution of the highly influential ECC systems’ use phase to the environmental load. Result of this finding which is performed in Malaysia is following other similar studies conducted in order parts of the world.
These study’s results, therefore, strengthen the need for energy policymakers, researchers, and designers in Malaysia and beyond to invest more in the use of cleaner energy sources, especially in providing air conditioning services. This action will go a long way in ensuring a more sustainable environment and indeed assist the country in achieving its 2016 voluntary Paris agreement as rectified.
As a recommendation, more LCA studies covering all life cycle phases with broader and justifiable datasets are encouraged to be carried out, especially in the field of HVAC. It is also advised for future studies to include other environmental impact categories not considered in this study, as this might prove very influential in making a robust environmental decision. Finally, life cycle cost analysis is also encouraged to be undertaken alongside the environmental assessments in order to have an economic side of view to every environmental decision made.
Author Contributions
C.C.H.: Writing—Original draft; Writing—Review and editing; Conceptualization; Data curation; Methodology; Investigation; Formal analysis; A.B.A.: Supervision; Funding acquisition; Visualization; M.A.A.M.: Project administration; Supervision; Methodology; Resources. All authors have read and agreed to the published version of the manuscript.
Funding
This research was funded by Universiti Teknologi Petronas.
Informed Consent Statement
Not applicable.
Data Availability Statement
The data analyzed in this study may be made available on request from the corresponding author. The raw operational data are not publicly available due to the Memorandum of Understanding between the plant management and the institution.
Acknowledgments
Authors wish to acknowledge Universiti Teknologi PETRONAS for support of this research.
Conflicts of Interest
The authors declare no conflict of interest. The funders had no role in the design of the study; in the collection, analyses, or interpretation of data; in the writing of the manuscript, or in the decision to publish the results.
Abbreviation
| Nomenclature | |
| AC | Air Condition |
| AD | Acidification |
| CF | Carbon Footprint |
| CL | Cooling Load |
| COP | Coefficient of Performance |
| CW | Chilled Water |
| DC | District Cooling |
| ECC | Electric Centrifugal Chiller |
| EL | Environmental Load |
| EP | Electric Power |
| EU | Eutrophication |
| FM | Fuel Mix |
| FU | Functional Unit |
| GHG | Greenhouse Gas |
| GWP | Global Warming Potentials |
| HVAC | Heat, Ventilation and Air Conditioning |
| ISO | International Standard Organization |
| LCA | Life Cycle Assessment |
| LCEL | Life Cycle Environmental Load |
| LCI | Life Cycle Inventory |
| LCIA | Life Cycle Impact Assessment |
| POC | Photochemical Oxidant Creation |
| RE | Renewable Energy |
| SAC | Suction Absorption Chiller |
| TES | Thermal Energy Storage |
| VCC | Vapor Centrifugal Chiller |
| VCS | Vapor Compression System |
References
- Rismanchi, B.; Saidur, R.; Masjuki, H.H.; Mahlia, T.M.I. Energetic, economic and environmental benefits of utilizing the ice thermal storage systems for office building applications. Energy Build. 2012, 50, 347–354. [Google Scholar] [CrossRef]
- Saidur, R. Energy consumption, energy savings, and emission analysis in Malaysian office buildings. Energy Policy 2009, 37, 4104–4113. [Google Scholar] [CrossRef]
- Dincer, I.; Zamfirescu, C. Sustainable Energy Systems and Applications; Springer Science & Business Media: Berlin/Heidelberg, Germany, 2011. [Google Scholar]
- Eveloy, V.; Ayou, D.S. Sustainable district cooling systems: Status, challenges, and future opportunities, with emphasis on cooling-dominated regions. Energies 2019, 12, 235. [Google Scholar] [CrossRef] [Green Version]
- Steer, K.; Wirth, A.; Halgamuge, S. Control period selection for improved operating performance in district heating networks. Energy Build. 2011, 43, 605–613. [Google Scholar] [CrossRef]
- Calderoni, M.; Dourlens-Qaranta, S.; Sreekumar, B.B.; Lennard, Z.; Rämä, M.; Klobut, K.; Wang, Z.; Duan, X.; Zhang, Y.; Nilsson, J. Sustainable District Cooling Guidelines. 2019. Available online: https://www.iea-dhc.org/fileadmin/documents/Annex_XII/2020_IEA_DHC_Sustainable_District_Cooling_Guidelines_new_design.pdf (accessed on 29 October 2020).
- Rezaie, B.; Rosen, M.A. District heating and cooling: Review of technology and potential enhancements. Appl. Energy 2012, 93, 2–10. [Google Scholar] [CrossRef]
- Association, I.D.E. District Cooling Best Practices Guide; IDEA: Westborough, MA, USA, 2008. [Google Scholar]
- Catrini, P.C.M.; Guarino, F.; Panno, D.; Piacentino, A. An integrated approach based on Life Cycle Assessment and Thermoeconomics: Application to a water-cooled chiller for an air conditioning plant. Energy 2018, 160, 72–86. [Google Scholar] [CrossRef]
- Mahlia, T. Emissions from electricity generation in Malaysia. Renew. Energy 2002, 27, 293–300. [Google Scholar] [CrossRef]
- Haiges, R.; Wang, Y.; Ghoshray, A.; Roskilly, A. Optimization of Malaysia’s power generation mix to meet the electricity demand by 2050. Energy Procedia 2017, 142, 2844–2851. [Google Scholar] [CrossRef]
- Lee, K.-M.; Inaba, A. Life Cycle Assessment: Best Practices of ISO 14040 Series; Center for Ecodesign and LCA (CEL), Ajou University, Asia-Pacific Economic Co-operation: Queenstown, Singapore, 2004. [Google Scholar]
- Santoyo-Castelazo, E.; Stamford, L.; Azapagic, A. Environmental implications of decarbonising electricity supply in large economies: The case of Mexico. Energy Convers. Manag. 2014, 85, 272–291. [Google Scholar] [CrossRef]
- Del Borghi, A. LCA and Communication: Environmental Product Declaration; Springer: Berlin/Heidelberg, Germany, 2013. [Google Scholar]
- Saidur, R.; Hasanuzzaman, M.; Mahlia, T.; Rahim, N.; Mohammed, H. Chillers energy consumption, energy savings and emission analysis in an institutional buildings. Energy 2011, 36, 5233–5238. [Google Scholar] [CrossRef]
- Gu, L.; Gu, D.; Lin, B.; Zhu, Y. Life cycle assessment for cooling and heating sources of building. In Proceedings of the 6th International Conference on Indoor Air Quality, Ventilation and Energy Conservation in Buildings: Sustainable Built Environment, Sendai, Japan, 28–31 October 2007; pp. 773–780. [Google Scholar]
- Almutairi, K.; Thoma, G.; Burek, J.; Algarni, S.; Nutter, D. Life cycle assessment and economic analysis of residential air conditioning in Saudi Arabia. Energy Build. 2015, 102, 370–379. [Google Scholar] [CrossRef]
- Yanagitani, K.; Kawahara, K. LCA study of air conditioners with an alternative refrigerant. Int. J. Life Cycle Assess. 2000, 5, 287–290. [Google Scholar] [CrossRef]
- Liu, S.; Schulz, U.W.; Sapar, M.H.; Qian, S. Evaluation of the environmental performance of the chilled ceiling system using life cycle assessment (LCA): A case study in Singapore. Build. Environ. 2016, 102, 207–216. [Google Scholar] [CrossRef]
- Cascini, A.; Bortolini, M.; Botti, L.; Gamberi, M.; Graziani, A.; Mora, C. Life Cycle Assessment of a commercial refrigeration system under different use configurations. In Proceedings of the 18th Summer School Francesco Turco 2013, Ancona, Italy, 11–13 September 2013; pp. 352–357. [Google Scholar]
- Canova, A.; Chicco, G.; Genon, G.; Mancarella, P. Emission characterization and evaluation of natural gas-fueled cogeneration microturbines and internal combustion engines. Energy Convers. Manag. 2008, 49, 2900–2909. [Google Scholar] [CrossRef]
- International Organization for Standardization. Environmental Management—Life Cycle Assessment—Principles and Framework; ISO 14040; ISO: Geneva, Switzerland, 2006. [Google Scholar]
- Ryding, S.-O. ISO 14042 Environmental management* Life cycle assessment* life cycle impact assessment. Int. J. Life Cycle Assess. 1999, 4, 307. [Google Scholar] [CrossRef]
- Huppes, G.; van Oers, L. Background Review of Existing Weighting Approaches in Life Cycle Impact Assessment (LCIA); European Union: Luxembourg, 2011. [Google Scholar]
- Abd Majid, M.A.; Muhammad, M.; Hampo, C.C.; Akmar, A.B. Analysis of a Thermal Energy Storage Tank in a Large District Cooling System: A Case Study. Processes 2020, 8, 1158. [Google Scholar] [CrossRef]
- Longo, S.; Palomba, V.; Beccali, M.; Cellura, M.; Vasta, S. Energy balance and life cycle assessment of small size residential solar heating and cooling systems equipped with adsorption chillers. Solar Energy 2017, 158, 543–558. [Google Scholar] [CrossRef]
- Finocchiaro, P.; Beccali, M.; Cellura, M.; Guarino, F.; Longo, S. Life cycle assessment of a compact desiccant evaporative cooling system: The case study of the “Freescoo”. Solar Energy Mater. Solar Cells 2016, 156, 83–91. [Google Scholar] [CrossRef]
- Malaysian Meteorological Department. General climate of Malaysia; 2008. Available online: http://www.met.gov.my/index.php?option=com.content&task=view&id=75&Itemid=1089 (accessed on 29 October 2020).
- Mukhtar, A.; Ng, K.; Yusoff, M. Passive thermal performance prediction and multi-objective optimization of naturally-ventilated underground shelter in Malaysia. Renew. Energy 2018, 123, 342–352. [Google Scholar] [CrossRef]
- Commission, E. Malaysia Energy Statistics Handbook 2017; Suruhanjaya Tenaga (Energy Commission): Putrajaya, Malaysia, 2018. [Google Scholar]
- Joint Research Centre, Institute for Environment and Sustainability. European Commission-Joint Research Centre-Institute for Environment and Sustainability: International Reference Life Cycle Data System (ILCD) Handbook-General Guide for Life Cycle Assessment-Detailed Guidance, 1st ed.; EUR 24708 EN-2010; Publications Office of the European Union: Luxembourg, 2010. [Google Scholar]
- Joint Research Centre, Institute for Environment and Sustainability. Characterisation Factors of the ILCD Recommended Life Cycle Impact Assessment Methods: Database and Supporting Information, 1st ed.; EUR 24708 EN-2010; Publications Office of the European Union: Luxembourg, 2012. [Google Scholar]
- Smithson, P.A. IPCC, 2001: Climate change 2001: The scientific basis. Contribution of Working Group 1 to the Third Assessment Report of the Intergovernmental Panel on Climate Change. Int. J. Climatol. 2002, 22, 1144. [Google Scholar] [CrossRef]
- Heijung, R. Environmental Life Cycle Assessment of Products Guide and Background. Natl. Reuse Waste Res. Programme CML 1992. Available online: https://ci.nii.ac.jp/naid/10005337600/en/ (accessed on 29 October 2020).
- Hauschild, M.; Wenzel, H. Book Reviews-Environmental assessment of products Volume I: Methodology, tools, and case studies in product development. Ecotoxicology 1999, 8, 59. [Google Scholar]
- Derwent, R.; Jenkin, M.; Saunders, S. Photochemical ozone creation potentials for a large number of reactive hydrocarbons under European conditions. Atmos. Environ. 1996, 30, 181–199. [Google Scholar] [CrossRef]
- Shah, V.P.; Debella, D.C.; Ries, R.J. Life cycle assessment of residential heating and cooling systems in four regions in the United States. Energy Build. 2008, 40, 503–513. [Google Scholar] [CrossRef]
- Blom, I.; Itard, L.; Meijer, A. LCA-based environmental assessment of the use and maintenance of heating and ventilation systems in Dutch dwellings. Build. Environ. 2010, 45, 2362–2372. [Google Scholar] [CrossRef]
- Heikkilä, K. Environmental Assessment of Air-conditioning Systems in Offices Building Services Engineering; Chalmers University of Technology: Göteborg, Sweden, 2003. [Google Scholar]
- Haiges, R.; Wang, Y.; Ghoshray, A.; Roskilly, A. Unconventional fuel pathways for decarbonizing the electrical power generation in Malaysia by 2050. Energy Procedia 2019, 158, 4238–4245. [Google Scholar] [CrossRef]
- Babatunde, K.A.; Said, F.F.; Nor, N.G.M.; Begum, R.A.; Mahmoud, M.A. Coherent or conflicting? Assessing natural gas subsidy and energy efficiency policy interactions amid CO2 emissions reduction in Malaysia electricity sector. J. Clean. Prod. 2021, 279, 123374. [Google Scholar] [CrossRef]
Figure 1.
Life Cycle Assessment LCA framework ISO 14040 [22].
Figure 1.
Life Cycle Assessment LCA framework ISO 14040 [22].

Figure 2.
Mandatory Life Cycle Impact Assessment LCIA elements and indicators.

Figure 3.
Sample data illustration of a week operation of the 4 Electric Centrifugal Chiller ECC systems.
Figure 3.
Sample data illustration of a week operation of the 4 Electric Centrifugal Chiller ECC systems.

Figure 4.
Configuration of the large District Cooling DC plant using block diagram [25].
Figure 4.
Configuration of the large District Cooling DC plant using block diagram [25].

Figure 5.
LCA system boundary of the ECC systems.

Figure 6.
Monthly cooling load, ECC contribution, and average climate temperature.

Figure 7.
Percentage contribution of the individual ECC system in the DC plant in the study year.

Figure 8.
Result of electrical power consumption by ECC systems.

Figure 9.
Result of the LCI analysis of the case study.

Figure 10.
Monthly LCIA result.

Figure 11.
LCAI results for the entire operation phase of the ECC systems.

Figure 12.
Result comparison of the LCI analysis of system use phase based on the electricity mix.

Figure 13.
Characterized impact of ECC systems per impact category in its use phase.


Table 1.
Green House Gas fossil fuel emission per unit generated electricity [10].
Table 1.
Green House Gas fossil fuel emission per unit generated electricity [10].
| Fuel | Emission (kg/kWh) | |||
|---|---|---|---|---|
| CO2 | SO2 | NOx | CO | |
| Coal | 1.18 | 0.0139 | 0.0052 | 0.0002 |
| Petroleum | 0.85 | 0.0164 | 0.0025 | 0.0002 |
| Gas | 0.53 | 0.0005 | 0.0009 | 0.0005 |
| Hydro | 0.00 | 0.0000 | 0.0000 | 0.0000 |
| Others (RE) | 0.00 | 0.0000 | 0.0000 | 0.0000 |
Table 2.
Life Cycle Impact Assessment LCIA chosen indicators and mandatory elements.
| LCI | Classification | Characterization |
|---|---|---|
| CO2 | Global Warming Potential GWP | CO2− eq |
| NOx | Eutrophication EU | PO43− eq |
| NOx, SOx | Acidification AD | SO2 eq |
| CO | Photochemical Oxidant Creation POC | C2H2− eq |
Table 3.
Characterization factor (equivalent) used in the research [12].
Publisher’s Note: MDPI stays neutral with regard to jurisdictional claims in published maps and institutional affiliations. |
© 2021 by the authors. Licensee MDPI, Basel, Switzerland. This article is an open access article distributed under the terms and conditions of the Creative Commons Attribution (CC BY) license (http://creativecommons.org/licenses/by/4.0/).
Share and Cite
MDPI and ACS Style
Hampo, C.C.; Akmar, A.B.; Majid, M.A.A. Life Cycle Assessment of an Electric Chiller Integrated with a Large District Cooling Plant. Sustainability 2021, 13, 389. https://doi.org/10.3390/su13010389
AMA Style
Hampo CC, Akmar AB, Majid MAA. Life Cycle Assessment of an Electric Chiller Integrated with a Large District Cooling Plant. Sustainability. 2021; 13(1):389. https://doi.org/10.3390/su13010389
Chicago/Turabian StyleHampo, Chima Cyril, Ainul Bt Akmar, and Mohd Amin Abd Majid. 2021. "Life Cycle Assessment of an Electric Chiller Integrated with a Large District Cooling Plant" Sustainability 13, no. 1: 389. https://doi.org/10.3390/su13010389
Note that from the first issue of 2016, this journal uses article numbers instead of page numbers. See further details here.