Article

Assessment of Groundwater Resources in Coastal Areas of Pakistan for Sustainable Water Quality Management Using Joint Geophysical and Geochemical Approach: A Case Study

1
Key Laboratory of Shale Gas and Geoengineering, Institute of Geology and Geophysics, Chinese Academy of Sciences, Beijing 100029, China
2
University of Chinese Academy of Sciences, Beijing 100049, China
3
Innovation Academy for Earth Science, Chinese Academy of Sciences, Beijing 100029, China
4
Archaeology Department, College of Tourism and Archeology, King Saud University, Riyadh 11451, Saudi Arabia
5
National Research Institute of Astronomy and Geophysics (NRIAG), Helwan, 11421 Cairo, Egypt
6
School of Civil and Resource Engineering, University of Sciences and Technology Beijing, Beijing 100083, China
7
Institute of Rock and Soil Mechanics, Chinese Academy of Sciences, Wuhan 430071, China
*
Authors to whom correspondence should be addressed.
Sustainability 2020, 12(22), 9730; https://doi.org/10.3390/su12229730
Submission received: 22 October 2020 / Revised: 15 November 2020 / Accepted: 18 November 2020 / Published: 21 November 2020
(This article belongs to the Special Issue Sustainable Water Quality Management in the Changing Environment)

Abstract

:
Delineation of fresh/saline groundwater is essential for sustainable water quality management, especially in the coastal areas all around the globe. Seawater intrusion causes substantial degradation in quality of freshwater resources in the coastal areas. The main reason for saltwater intrusion is the changing environment in terms of sea-level rise, climate change, and over-extraction of freshwater resources to meet the growing demands. In this study, an integrated approach of geophysical and geochemical methods was used to assess saltwater intrusion in the coastal areas of Bela Plain, Pakistan. The inverted electrical resistivity computed from 50 vertical electrical sounding (VES) constrained the subsurface into five layers and two aquifers through 3D imaging, such as silty clay and sandy clay containing saline water, and sand, sandy gravel, and gravel containing freshwater. However, the narrow range of resistivity values shows an overlap of saline/fresh groundwater. Such ambiguity in the resistivity interpretation was removed by Dar-Zarrouk (D-Z) parameters. D-Z parameters, namely transverse unit resistance (Tr), longitudinal unit conductance (Sc), and longitudinal resistivity (ρL) estimated from VES, marked a clear distinction between saline and fresh aquifers with a wide range of values. The geochemical method was performed using 20 water samples for the main cations (K+, Ca2+ Na+, and Mg2+), anions (SO42−, HCO3, Cl, and NO3), and other parameters (TDS, EC, and pH). Fresh/saline aquifers revealed by D-Z parameters are in good agreement with those delineated by physicochemical parameters and local hydrogeological conditions. This study delineates seawater intrusion of about 13–42 km from Sonmiani Bay in the Arabian Sea towards the inlands of Bela Plain. Therefore, it is expected that this investigation will be helpful in future planning for the management and exploitation of freshwater resources in the study area. Our study suggests that D-Z parameters can be used as the most inexpensive alternative to the traditional geotechnical and environmental tests for the demarcation of fresh/saline groundwater with a large coverage in any coastal or contaminated area under a homogeneous or heterogeneous setting.

1. Introduction

Due to their dense population, many coastal areas around the world have become a hub of economic activities, such as metropolitan development, tourism, trade, and food development [1,2]. The above factors have mainly caused the settlement of people in these areas, and hence, the demand for freshwater resources for different purposes, such as drinking, irrigation, industry, and consumption, has increased [3]. Compared with surface water sources, groundwater reserves are available in large quantity and high quality, and are hardly exaggerated by seasonal changes such as constant temperature, etc. [4,5,6]. For the above reasons, groundwater is a good substitute for surface water resources. Consequently, groundwater is being excessively exploited, and thus, the over-extraction of this precious resource has resulted in seawater intrusion in most of the coastal regions around the world [7,8,9,10].
In the coastal areas, a freshwater resource overlies a saltwater aquifer because seawater is denser than freshwater, and hence, brackish water is formed in the zone of contact between saltwater and freshwater [11]. A boundary between seawater and freshwater aquifers is not sharp, but is a steady alteration over a finite distance, and is recognized as brackish groundwater (aquifer of mixing) or a zone of diffusion [12]. Freshwater overlying the heavier saltwater serves to drive the fresh–saline groundwater boundary seawards, and therefore limits seawater penetration inland [13,14]. On the contrary, freshwater pressure on seawater decreases due to a relatively excessive extraction of freshwater, and as a result, seawater migrates farther inland [15,16,17]. Seawater intrusion reduces freshwater accessibility, and hence, degrades sustainable freshwater quality [18,19,20,21]. The intrusion of seawater into inland groundwater has become one of the most important ecological problems that influences sustainable groundwater resource management [22]. Generally, in the coastal areas, freshwater resources are found mainly landwards from the sea, whereas saline water occurs in the coastland towards the sea. The distance of the fresh–saline groundwater boundary from the sea is not constant, and it varies from one area to another depending on the environmental conditions that cause the increase in seawater intrusion. In some coastal areas, a fresh–saline interface was observed several km landwards. Therefore, the study of sustainable water quality management requires delineating saltwater intrusion, especially in the coastal aquifers, in order to avoid such global issues and to remediate the coastal regions efficiently for sustainable management of groundwater resources.
The investigated coastal area, Bela Plain, is situated in the south of Baluchistan Province (Pakistan). Groundwater resources in Bela Plain are the primary water resources in this area, however, their level of exploitation is continuously exceeding the aquifer potential and disturbing the normal equilibrium of the fresh–saline groundwater line, so seawater is laterally migrating several kilometers landwards. Many researchers have used electrical resistivity techniques for the delineation of the fresh/saline aquifer [23,24,25,26,27,28,29,30]. Geophysical techniques are cheaper, user-friendly, and non-invasive; are used as the best alternate to the expensive drilling exploration methods; and hence reduce the number of significant wells to assess in large areas [4]. Geophysical techniques, such as vertical electrical sounding (VES) or the 1D (one-dimensional) electrical resistivity survey, are widely used to assess saltwater intrusion because electrical resistivity shows large differences in values for seawater and freshwater [12]. Hence, the geoelectrical method is capable of delineating fresh/saline groundwater in terms of contrast in resistivity values. Electrical resistivity of water bearing rocks is mainly controlled by the distribution of water, the chemical composition, and the amount of water saturation [31]. The VES method has an advantage over other geophysical methods because of its wide range of resistivity values [12,32]. Electrical resistivity delineates freshwater with high values, while saltwater is revealed with low values. Generally, electrical resistivity tomography (ERT) is used to delineate the 2D/3D delineation of a fresh/saline aquifer along different profiles. However, ERT cannot cover large area as can VES. VES is generally called the 1D VES method, since it mostly assesses subsurface with 1D mapping. In this study, VES was used for the 3D mapping of the subsurface for the delineation of lithologies and aquifers. However, in case of similarities in lithologies, electrical resistivity values may show an overlap of fresh/saline aquifers. For example, resistivity values cannot clearly differentiate between freshwater containing mixed sand and clay, and saltwater with clay [5]. Such ambiguity in VES can be removed by computing Dar-Zarrouk (D-Z) parameters, namely longitudinal unit conductance, longitudinal resistivity, and transverse unit resistance, through different arrangements of thickness and resistivity. These parameters, obtained from VES measurements, can clearly delineate saline and fresh groundwater without any intermixing. D-Z parameters have been used in several studies for the demarcation of fresh/saline aquifers [4,5,12,32,33,34,35,36,37]. Since low resistivity values also rely on other factors, such as groundwater chemistry and subsurface geologic units, in some cases, geophysical data may not clearly delineate the lateral migration of seawater intrusion in different lithological materials of hydrogeological formation and chemical components or groundwater facies [38]. Therefore, in order to support and validate geophysical results for the demarcation of saline and fresh groundwater in the study area, VES data were integrated with hydrogeological information obtained from local boreholes and physicochemical analysis of water samples. Several studies have used an integrated approach of geophysical and physicochemical techniques to assess areas affected by the problem of seawater incursion [39,40,41,42,43,44]. However, only a few studies have used an integrated approach of D-Z parameters and the physicochemical method for the assessment of groundwater resources qualitatively [4,12]. In addition, these studies do not provide a clear insight (3D view) of the problem of intermixing in resistivity values due to similar lithologies that cause an overlap in the fresh/saline aquifer. Therefore, this innovative approach is very useful especially in areas that have highly intermixed lithologies and the water quality data of sampling wells are scarce due to high cost or other factors. Many coastal areas of Pakistan are facing the challenge of seawater intrusion; however, it may not be possible to conduct the traditional approaches in each area because of high cost. Previously, no such geophysical study was carried out in any of the coastal areas in Pakistan. Therefore, the application of such a non-invasive geophysical approach is essential not only in the coastal areas of Pakistan but also in other areas around the globe with similar challenges. Thus, this approach can assess any kind of aquifer system for the delineation of seawater intrusion with more confidence that other approaches may not evaluate.
This study, first interprets VES data to provide a 3D map of subsurface lithologies and the aquifer system of the entire area, then delineates the overlap of lithologies/aquifers (3D view), afterwards provides more confident solutions of D-Z parameters for the overlap problem and demarcates the fresh/saline aquifer with clear distinction, and finally validates the results with water sample analysis and suggests that this economical approach can replace the traditional expensive methods in any aquifer system around the world. The main objectives of the present study were to propose an innovative approach that is applicable in any environmental setting to demarcate saline and fresh groundwater by integrating geophysical data of 50 VES with data from 20 wells and hydrochemical analysis of groundwater samples (Figure 1a) for sustainable water quality management of the coastal aquifer resources under a changing environment such as over-exploitation of groundwater resources, sea-level rise, and climate change. The proposed approach is applicable in homogeneous as well as in heterogeneous aquifers to assess saltwater intrusion with over 90% confidence, and hence can reduce many costly wells and conventional laboratory test analysis to investigate large areas anywhere around the world.

2. Study Area and Hydrogeological Setting

The investigated site is located in Bela Plain of Lasbela District in South Baluchistan, Pakistan, with a latitude from 25° to 26.55° N and a longitude from 66° to 67° E. It covers an area of 3120 km2, and is bound by mountains from three sides (north, east, and west) and Sonmiani Bay in the Arabian Sea in the south (Figure 1a). It has a mean annual rainfall of 75–125 mm. Bela Plain is located in an arid region, where it has low recharge to groundwater and high evaporation. The main source of people’s income is irrigation, which depends on pumping wells, rainfall, and streams. However, groundwater is the major supply of water for agriculture and drinking purposes. Hence, over-exploitation of fresh groundwater resources is causing seawater intrusion in the study area. Most of the streams are intermittent. The only perennial stream is the Porali River to the southeast of Bela Plain. Generally, unconsolidated deposits created the local alluvial plain during the quaternary age. Its topography was formed as a result of erosion processes.
The surrounding mountains, which originate stream flows, are mostly composed of sedimentary rocks. In the foothills and piedmont areas near the mountains, the main sources of water supply are stream flows and precipitation. The stream flows originating from the Porali River recharge the groundwater in the north. However, groundwater recharge in other areas of Bela Plain mainly depends on rainfall. The Porali River irrigates an area of 4042 km2 in the Par and Mor ranges in the north at Sinchi Bent gauging station. The discharge rate of rivers and streams in Bela Plain are measured by the Water and Soils Investigation Division (WASID) [45]. About 119 million m3 is the total mean annual flow in the study area, which is mainly used for agriculture purposes [46]. The Kud River meets the Porali River at 15–19 km downflow from the Sinchi Bent gauging station. However, 101 million m3 is the mean annual flow rate at Mai Gondrani. Another non-perennial stream, Windar Nai, irrigates a land of 1733 km2 and directly falls into Sonmiani Bay in the south. Khantra Nai, another non-perennial stream, also flows into Bela Plain.
Several borehole tests (Figure 1) in the investigated area revealed the dominant lithologies, including gravel, a mixture of gravel and sand, sand, a mixture of sand and clay, clay, and silt. In the unconsolidated deposits of the piedmonts and alluvial fans, gravel forms the most extensive and permeable aquifer system of the study area containing freshwater resources. The aquifer system of the study area is formed by alluvial cover overlying the bedrock. However, the depth of the bedrock has not yet been revealed by any of the borehole tests drilled in the investigated area. Therefore, the total thickness of the aquifer is unknown. Generally, freshwater resources are contained by gravel, sandy gravel, and sand-type lithologies, whereas saline groundwater reserves are enclosed by silt, clay, and sandy clay-type lithologies. Most of the aquifers are unconfined except in southwest where semi-permeable beds of silt and clay make a confined aquifer system. The investigated area is a plain area (flat land), and its topography varies between 25–60 m.a.s.l (meters above sea level). The surface water flow and groundwater movement is generally from northeast to southwest towards the Sonmiani Bay in the Arabian Sea. This study is a part of the project by the Pakistan Water and Power Development Authority (WAPDA) for sustainable water quality management in the coastal areas of Pakistan. A graphical representation of seawater intrusion into fresh groundwater in the study area is shown in Figure 1b.

3. Materials and Methods

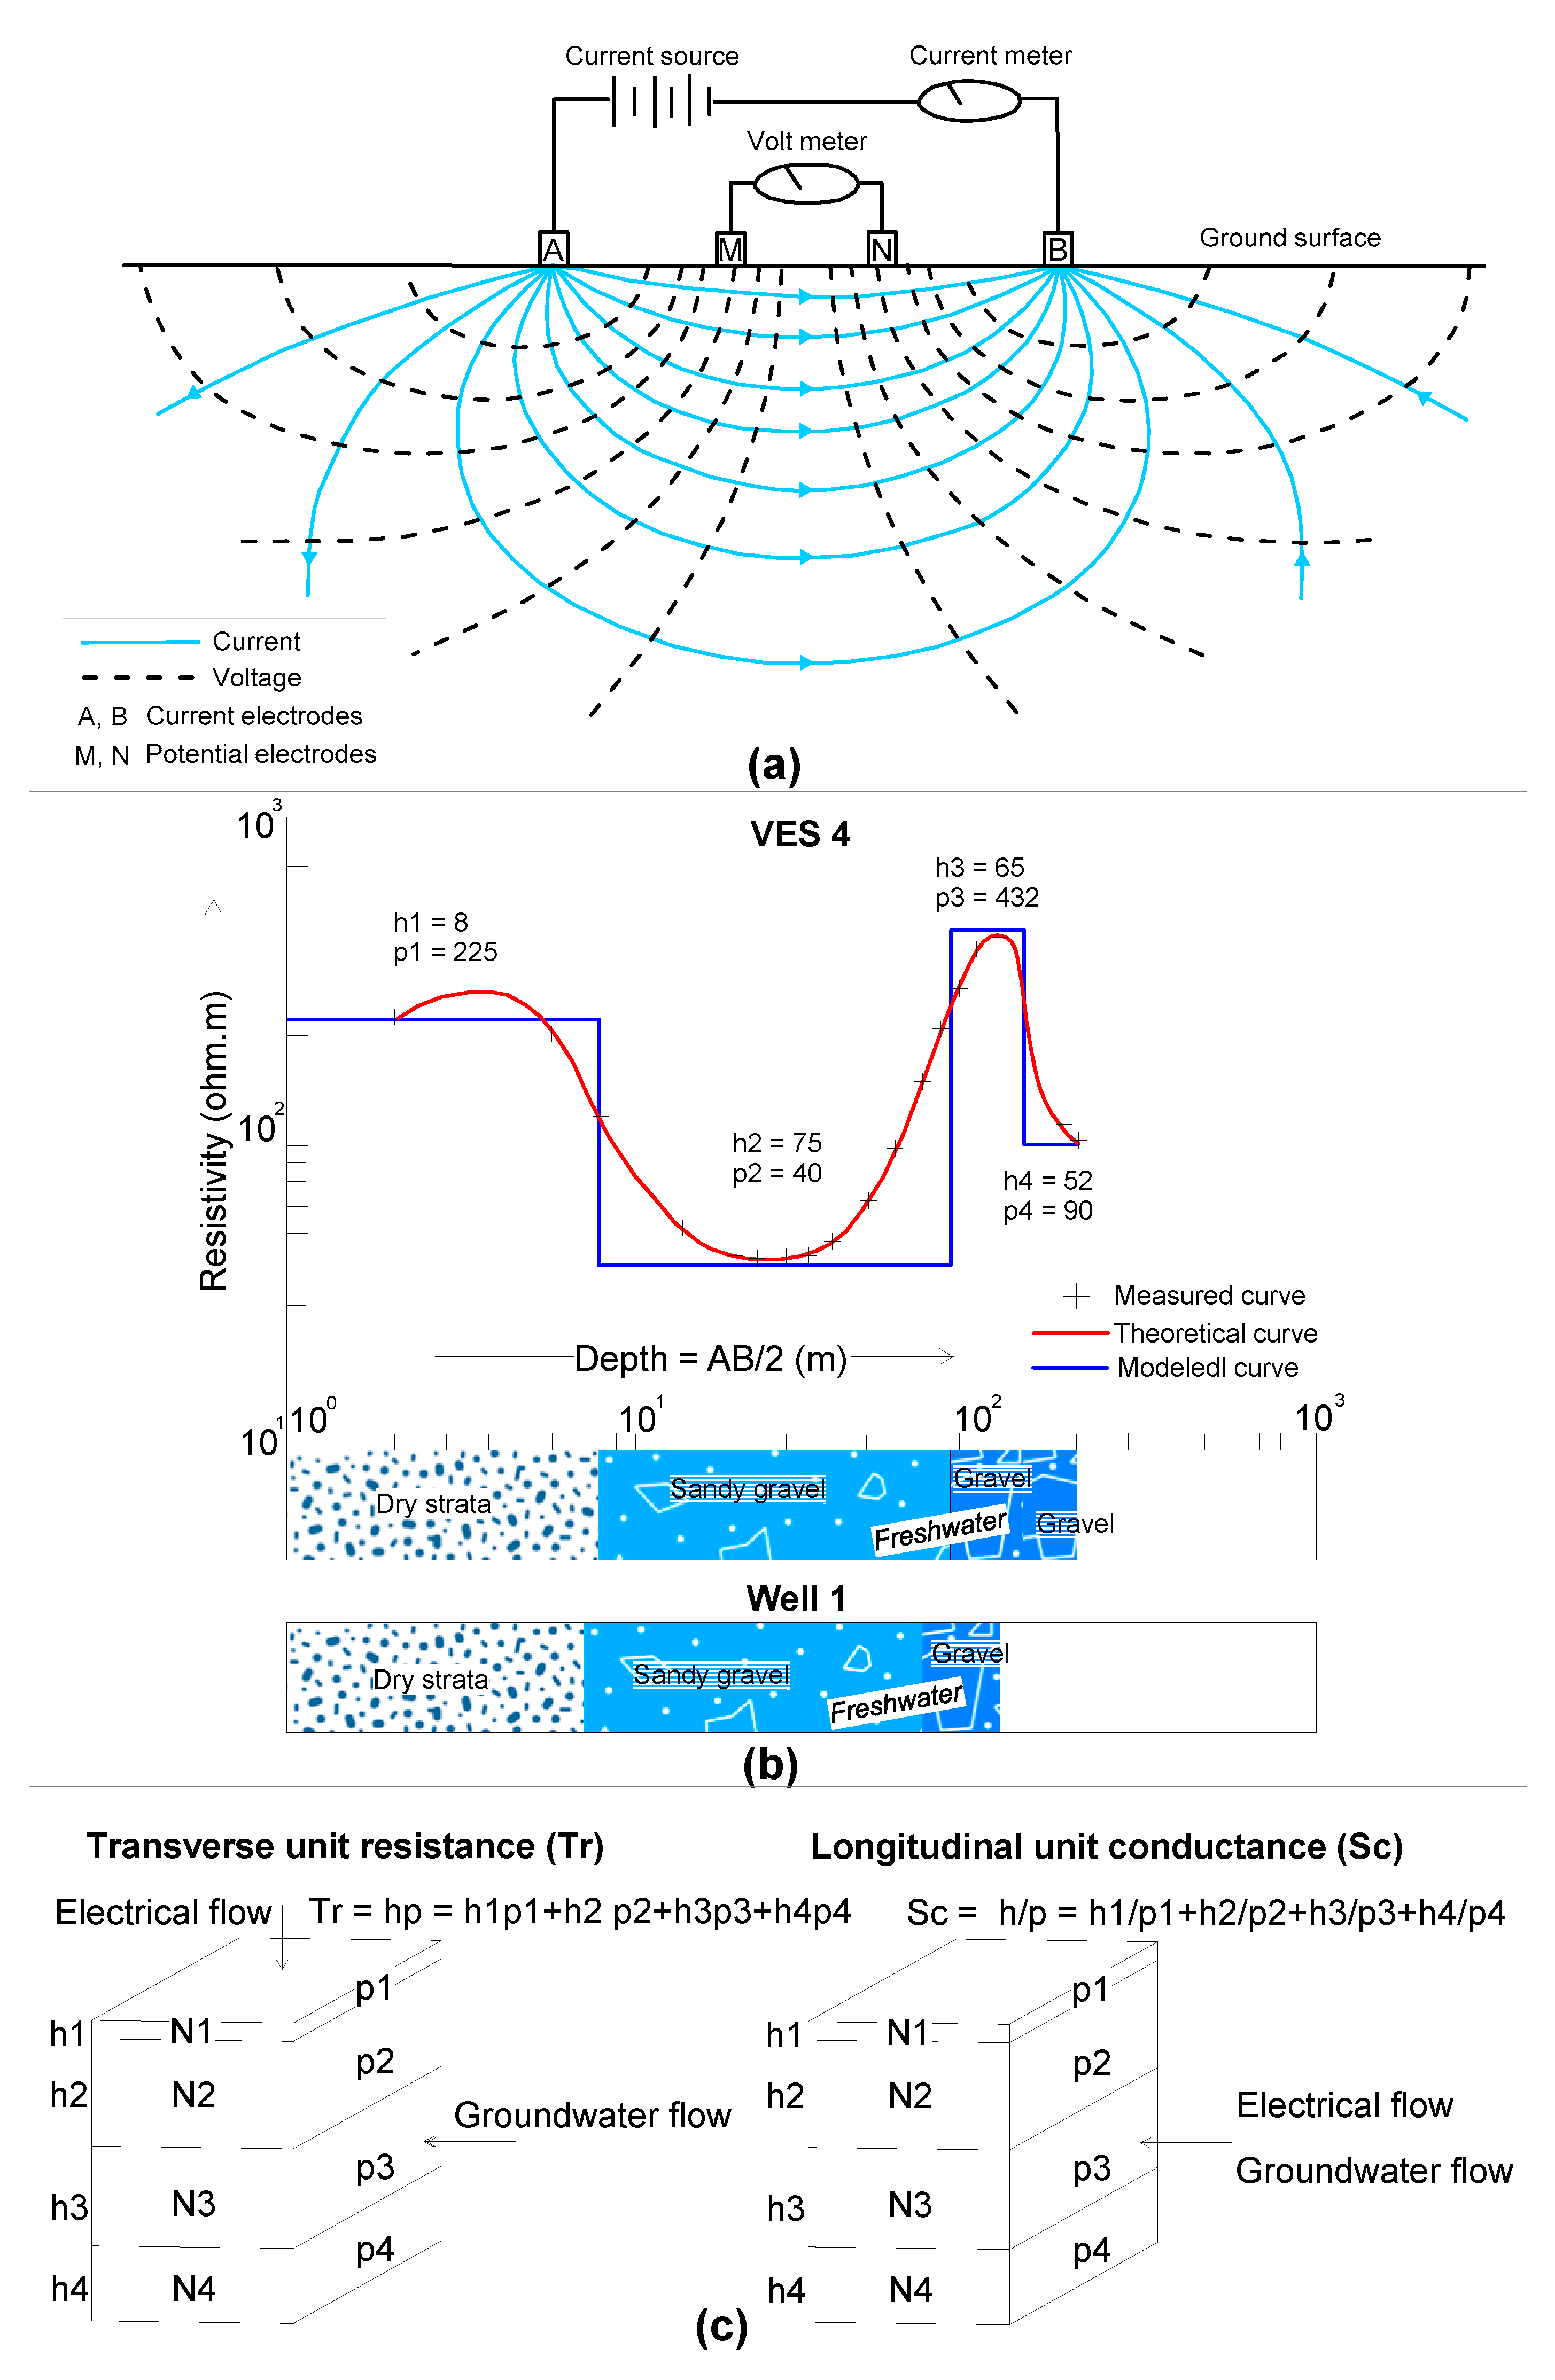
3.1. Dar-Zarrouk Parameters

Several methods are used to delineate the intrusion of saltwater into freshwater for sustainable water quality management. Vertical electrical sounding (VES) has been used in many investigations, and is globally known [41,47,48] since the electrical conductivity (EC) of a formation is mainly controlled by the specific conductivity of water in the pores, connectivity of the pores, and porosity [49]. Compared with other methods, geoelectrical survey is more useful to assess the intrusion of seawater into freshwater in the coastal areas because of the huge difference between EC values of freshwater and saltwater [29]. The surface VES method coupled with some borehole data can delineate the fresh/saline groundwater more accurately [50]. VES methods are widely used in hydrogeological investigations, since they are capable of incorporating their results with borehole and physicochemical data to generate more comprehensive models. These geophysical methods are more effective in such investigations mainly because of a useful correlation between the hydraulic and electrical properties of the subsurface saturated strata [50,51,52,53]. This study was carried out during the dry season (April and May) in order to delineate seawater intrusion more evidently.
The application of 1D geoelectrical methods such as vertical electrical sounding (VES) has been very successful for the evaluation of hydrogeological environments mainly because of the high contrast in electrical conductivity [41]. Delineation of saltwater intrusion into freshwater is conventionally the main purpose of geoelectrical measurements [54]. VES measurements are acquired by a system of four electrodes, i.e., two outer current electrodes are used to insert electric current into the subsurface, and two inner potential electrodes with small separation (i.e., equal or less than one fifth of current electrode spacing for reasonable vertical accuracy/resolution) are used to compute the potential difference (Figure 2a). Electrical resistivity measurements are performed using many types of standard configurations, namely Wenner, pole–dipole, Schlumberger, pole–pole, and pole–dipole. However, generally, VES is conducted using the Schlumberger or Wenner array. This survey was performed by Schlumberger configuration for 50 VES data points (Figure 1a) with half the current electrode spacing of AB/2 varying between 2–200 m. A resistivity meter (Syscal R1 Plusmodel, Iris, Orléans, France) was used to acquire electrical resistivity measurements. The apparent resistivity acquired in VES survey is given by [55]:
ρ a   = k ( Δ V I ) ,
where ρa is the apparent resistivity in Ωm, I is the electric current in amp, ΔV in volts is the potential difference, and k is the geometric factor that depends on the electrodes’ position. In order to obtain a subsurface model of discrete layers, apparent resistivity was inverted using IPI2WIN software version 3.1.2c developed by Moscow State University [56]. The inverted resistivity obtained from VES models is called true resistivity. The result of an interpreted VES model provides two fundamental parameters of the subsurface model, i.e., thickness (h) and electrical resistivity (ρ) (Figure 2b). In order to interpret the VES model, the VES results were correlated with hydrogeological and lithological data acquired from nearby boreholes [25]. In this study, the thickness and resistivity obtained from the inversion software were correlated with the local borehole information to constrain the model into six layers.
The VES models assess the subsurface formation into several lithologic layers, and provide useful information about groundwater salinity. However, VES models have some limitations, such as low resolution with depth, ambiguity, and equivalence problems [31]. VES models show low contrast in resistivity at large depths, and therefore cannot detect thin layers. For each sounding station, readings are acquired at different depths by successively increasing spacing between current electrodes until the voltage between potential electrodes is too small to measure. In the VES method, resistivity varies vertically (with depth) only but not horizontally, so the interpreted VES model is one-dimensional (1D). The critical (minimum, maximum, or any) depth of a geological layer is the depth at which the vertical resolution/accuracy is obtained with maximum signal strength at the ground depending on the local geological conditions. In VES, the resolution decreases with depth. Generally, VES using the Schlumberger array provides sufficient resolution of subsurface lithologies up to 200 m depth based on the geological setting [4,31]. To ensure sufficient vertical resolution of the subsurface formation, the investigation depth varies from 0.1 to 0.3 times the current electrode spacing. For instance, an investigation depth of 100–300 m is obtained for the current electrode spacing of 1000 m based on the local lithological setting. Generally, the Schlumberger array provides better vertical resolution and greater investigation depth than the Wenner array. This survey was carried out to assess the aquifer system up to a maximum depth of 200 m (from the ground level); however, groundwater occurs in alluvial cover overlying the bedrock below more than 200 m depth. In addition, resistivity values show intermixing for similar lithologies, such as clay and sandy clay or sandy clay and sand. [5]. In most cases, such similarities cause an overlap of fresh/saline aquifers. In order to remove such ambiguities or the intermixing of fresh and saline groundwater, Dar-Zarrouk parameters have been introduced in this study. D-Z parameters, namely longitudinal resistivity (ρL), longitudinal unit conductance (Sc), and transverse unit resistance (Tr), are computed through various arrangements of thickness and resistivity (Figure 2c) [12,33]. Tr, Sc, and ρL distinctly delineate fresh/saline groundwater without any overlapping. Based on well information and hydrogeological conditions of the investigated area, specific value ranges are given to Dar-Zarrouk parameters, and thus, these parameters assess the fresh/saline aquifers without any intermixing of their values [4,12]. D-Z parameters are estimated using the following equations [4,12,33]:
Tr   = ( h ) ( ρ ) ,
Sc   = ( h ρ ) ,
ρ L   = ( h Sc ) ,
where h and ρ are the thickness and resistivity of the saturated layers (aquifer), Sc is the longitudinal unit conductance in Siemens (mho), Tr is the transverse unit resistance estimated in Ωm2, and ρL is the longitudinal resistivity measured in Ωm.

3.2. Physicochemical Method

Physicochemical analysis was performed in a key laboratory of the Pakistan Council of Research in Water Resources (PCRWR). Based on the local hydrogeological setting, a total of 20 groundwater samples were taken from 20 monitoring wells/piezometers (i.e., one sample from a single well/piezometer) at a piezometer perforation/penetration depth of 75–125 m below the ground level, or 50–65 m.b.s.l. (meters below sea level). The water table depth (water level from ground surface) in the monitoring wells/piezometers varied between 0–18 m, and decreased from inland in the northeast towards the coast in the southeast. Groundwater samples 1–11 were taken from the aquifer associated with geological units of gravel, sandy gravel, and sand, whereas samples 12–20 were obtained from the aquifer of silt/clay and sandy clay-type lithology. The locations of the sampling wells are shown in Figure 1a. Geochemical analysis was done within one week after the sampling collection. In order to ensure collection of samples from the aquifer, groundwater was extracted for 6–12 min prior to sampling. The physicochemical study of chemical and physical parameters, such as cations, anions, electrical conductivity (EC), total dissolved solids (TDS), and pH, was carried out using portable meters in the field. Physicochemical parameters were measured using the standard methods of the APHA (American Public Health Association) [59]. Two poly-ethylene bottles of 500 mL were used to collect samples for the analysis of main cations, namely potassium (K+), calcium (Ca2+), sodium (Na+), and magnesium (Mg2+), and major anions such as nitrate (NO3), chloride (Cl), sulphates (SO42), and bicarbonates (HCO3). For cation analysis, nitric acid was added in one bottle in order to retain water acidity and to avoid precipitation reactions. Another bottle was used for anion analysis without using nitric acid. Concentrations of EC were obtained at 25 °C in units of microsiemens per centimeter (μS/cm). However, ionic concentrations of other groundwater parameters were acquired in units of milligrams per liter (mg/L). In order to ease physical/chemical processes and microorganism metabolism, all groundwater samples in the laboratory were kept at 4 °C. Ion chromatography (IC) (Dionex ICS-1100, Thermo Fisher Scientific, Waltham, MA, USA) with 0.01 mg/L detection limit was used to analyze major anions. However, for the analysis of main cations, the inductively coupled plasma optical emission spectrometry (ICPOES) (ICAP-6300, Thermo Fisher Scientific, Waltham, MA, USA) with detection limit less than 1 μg/L was used. ICPOES was performed with a mean analytical error of less than ±5%. The pH meter (Hanna Instrument Model 8519, Hanna Instruments, Padova, Italy) was used to test the pH of the water samples, whereas EC and TDS were analyzed using the EC meter (Hach-44600-00, HACH, Loveland, CO, USA) and TDS meter (TDS-4, Hm Digital, Los Angeles, CA, USA), respectively. The consistency of physicochemical parameters was tested by the ionic balance error through the relationship between total anions and cations for each sample. An acceptable ionic balance error of ±5% was found in the physicochemical analysis of all groundwater samples. Physicochemical parameters were assessed for the delineation of fresh/saline groundwater using the permissible limit of the PSQCA (Pakistan Standards and Quality Control Authority) and PCRWR (Pakistan Council of Research in Water Resources), obtained from the WHO (World Health Organization) [60]. Seawater intrusion was delineated by an increased content of major cations, anions, and other physicochemical parameters.

4. Results

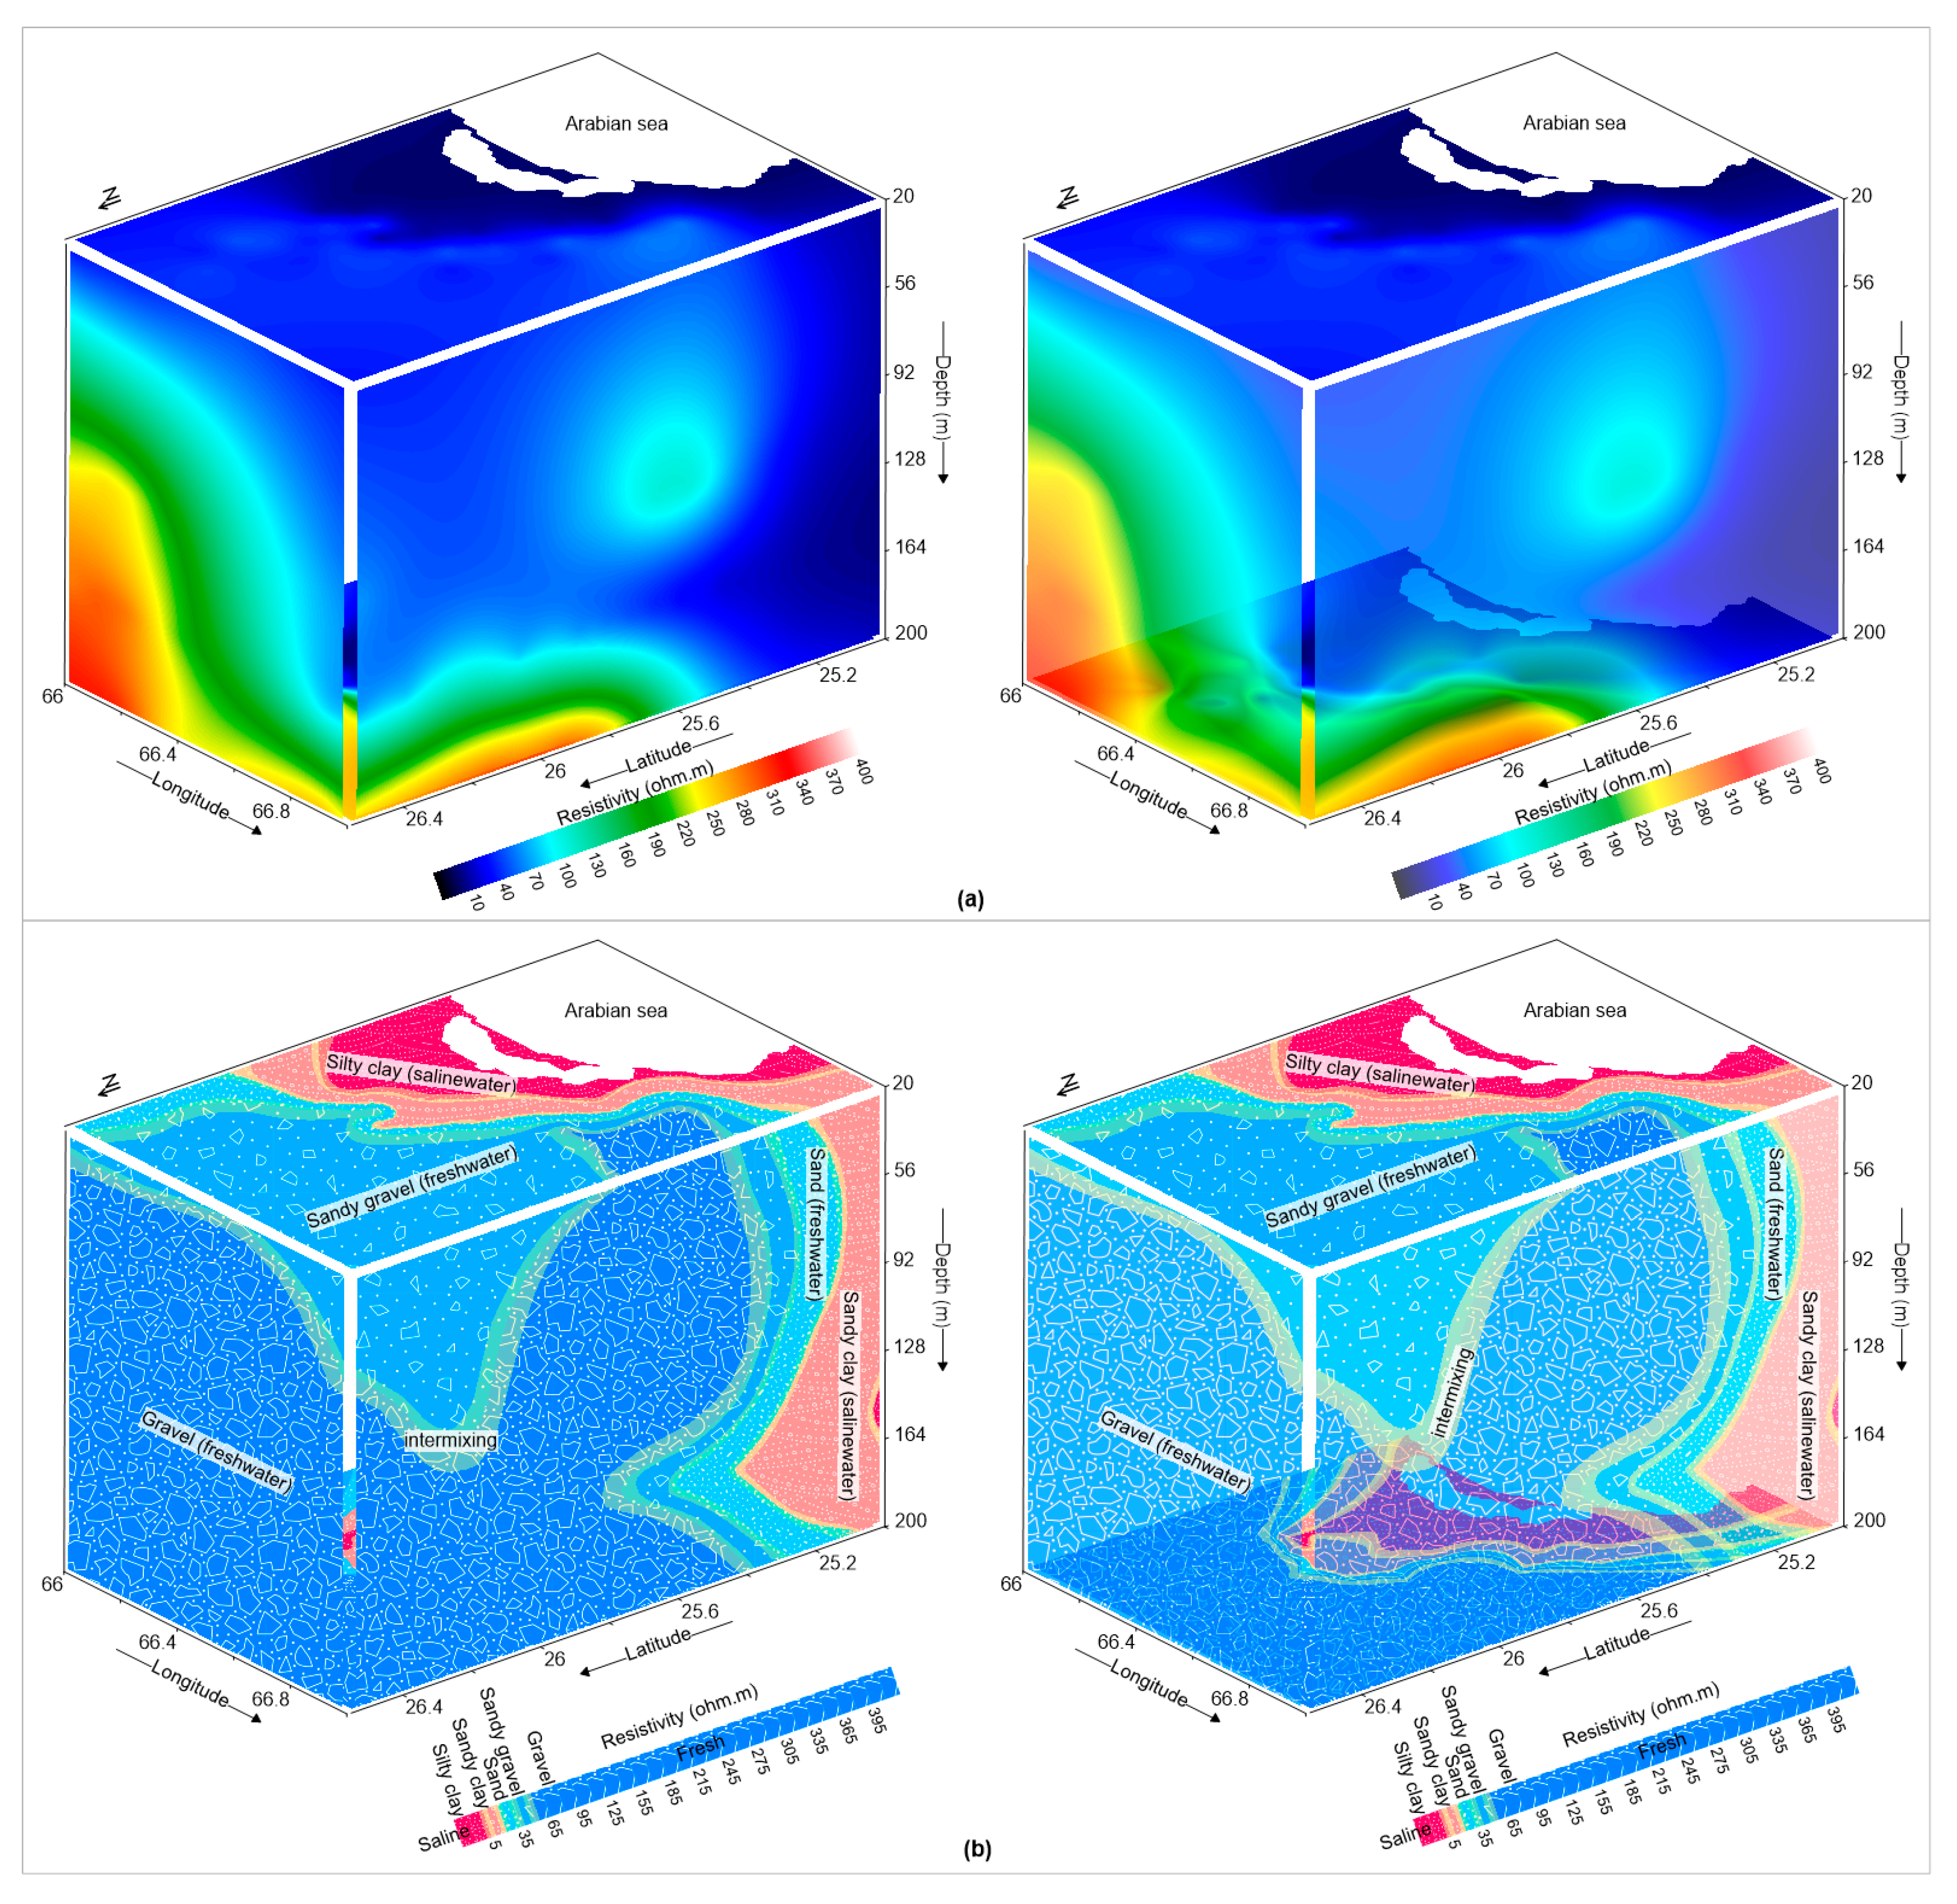
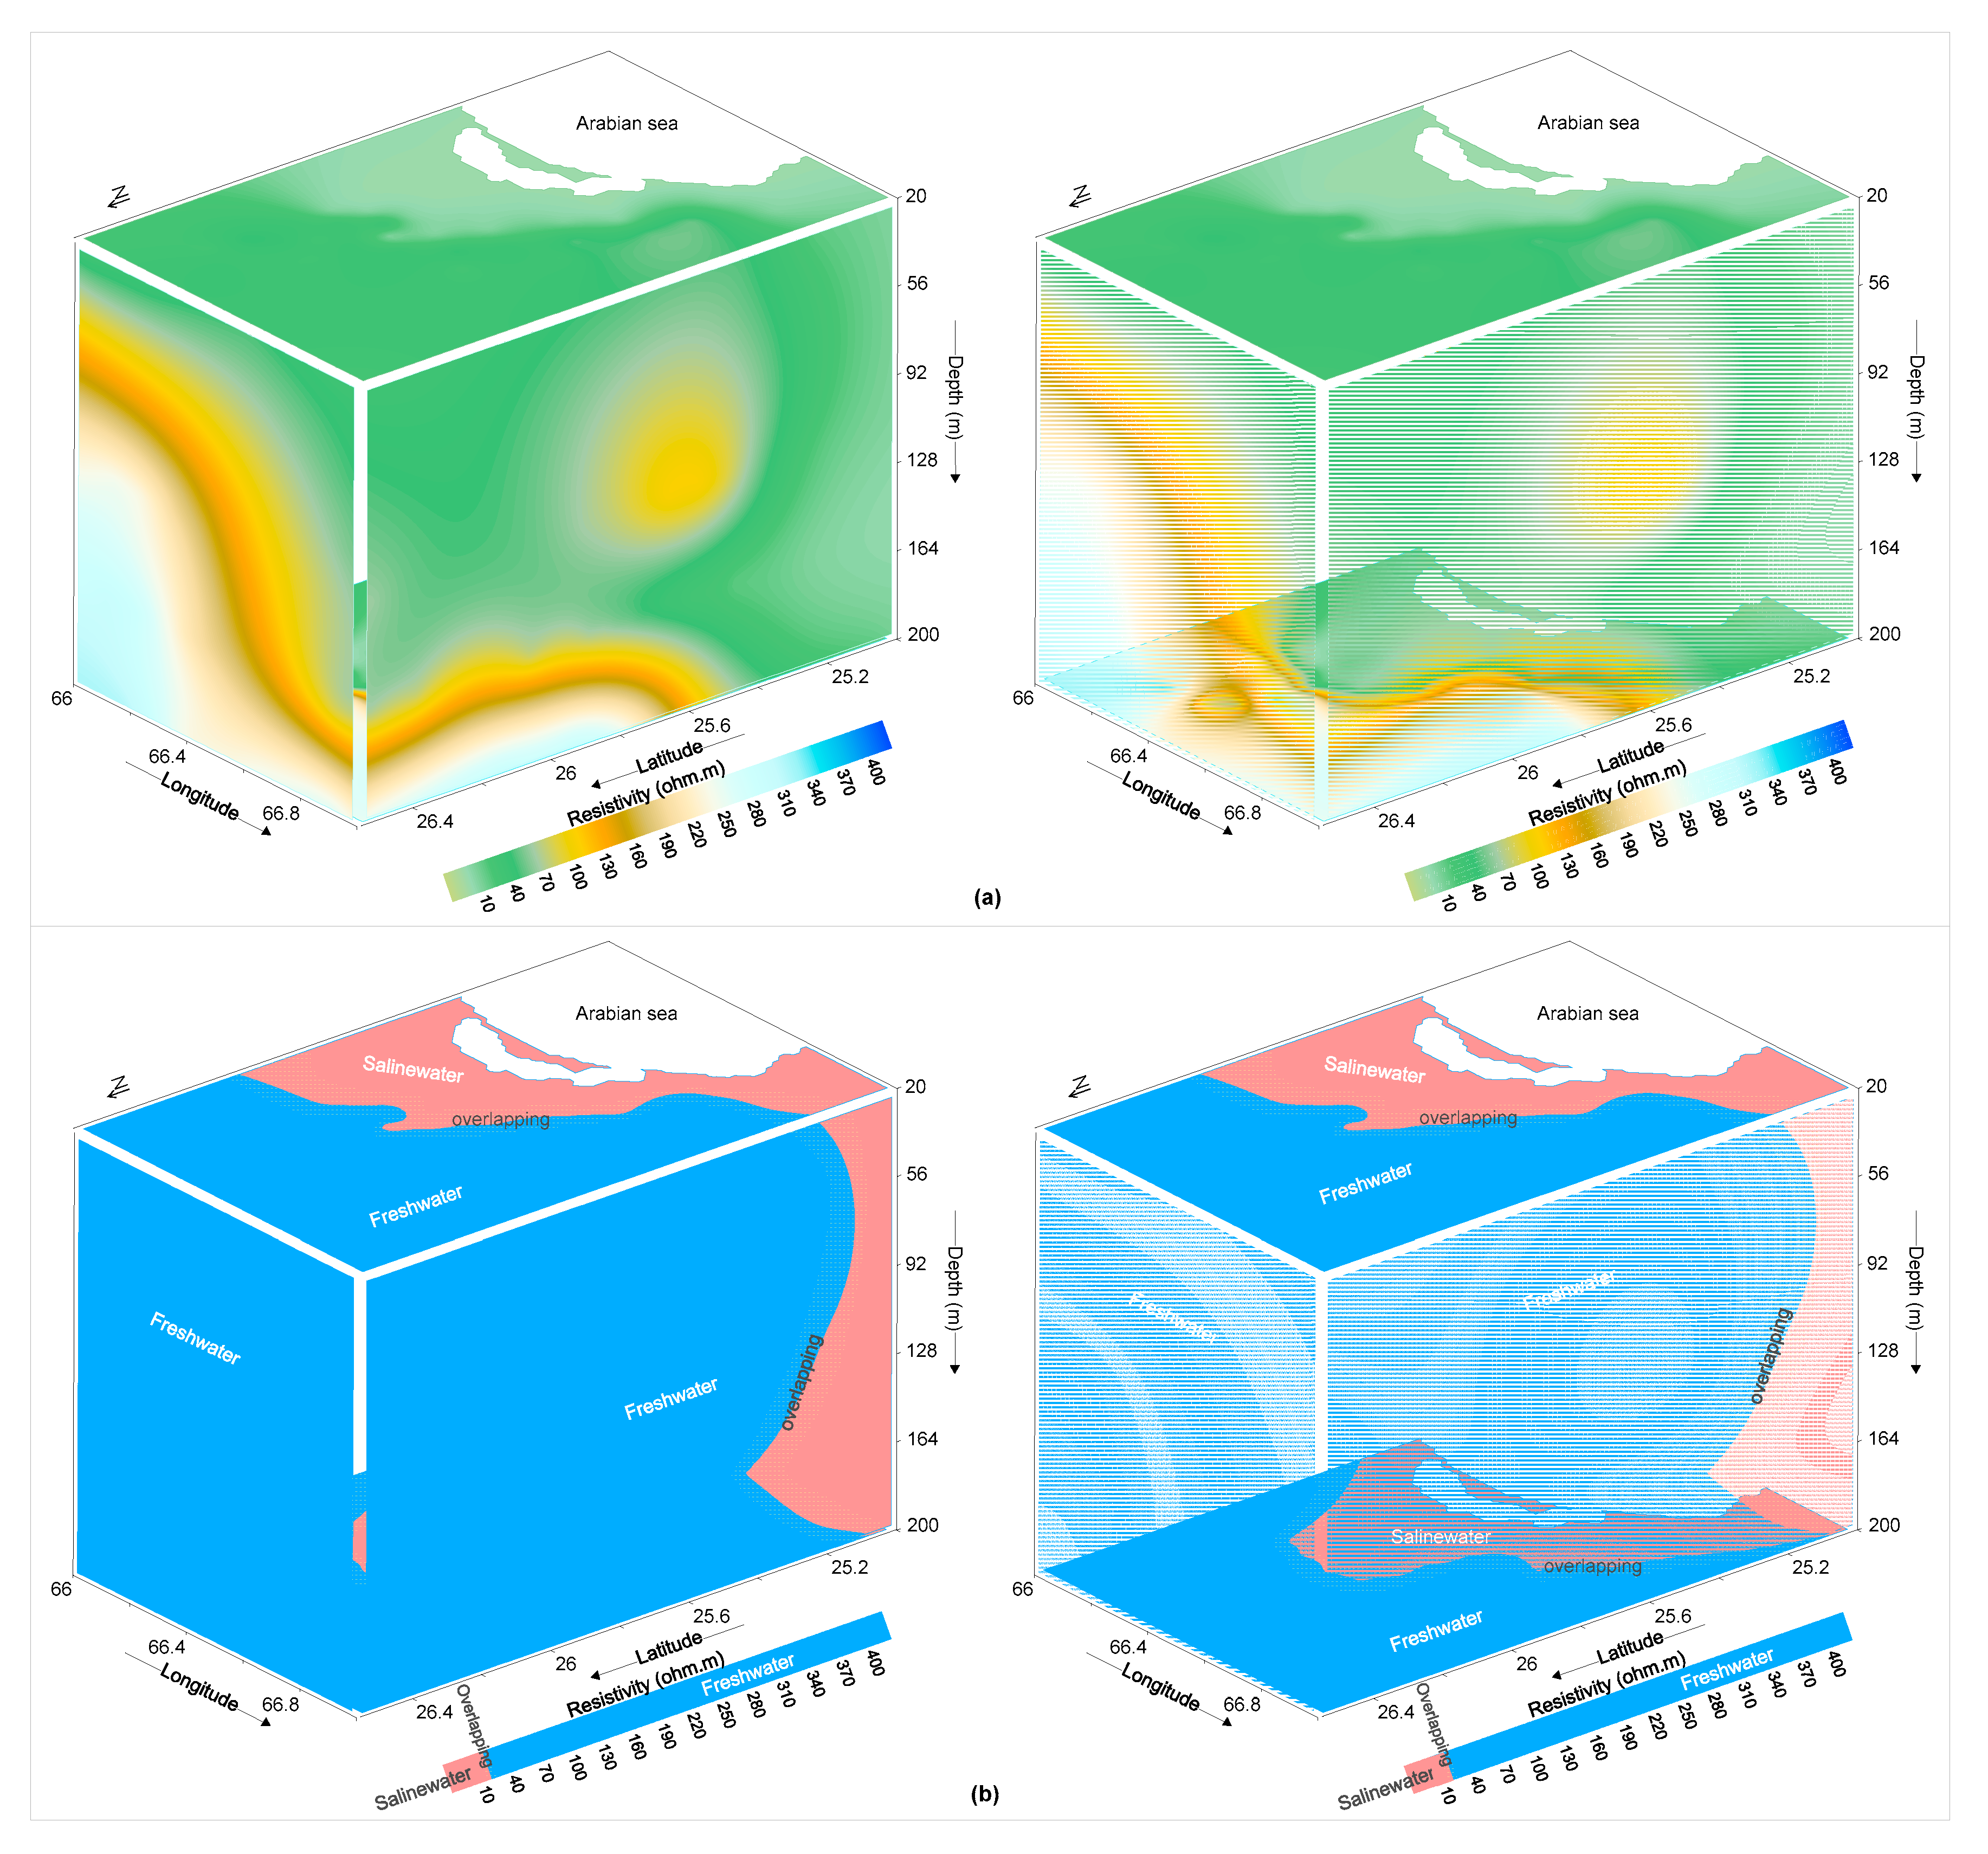
4.1. Interpretation of VES Models

The interpretation of the 50 VES was performed in two steps, i.e., theoretical analysis of the observed resistivity and the correlation between the formation resistivity and lithological logs for the delineation of subsurface lithologies and aquifers. The VES surveys can map the subsurface into a model of number of layers through the distribution of resistivity values [12]. Local characteristics of materials are significant for evaluating the subsurface lithologies [4]. The subsurface formation is mapped by the qualitative and quantitative correlation between inverted VES models and local hydrogeological information, given that the subsurface layers are interrelated with a specific value range of resistivity [5]. The calibration between inverted resistivity and borehole data is essential for reliable interpretation of the VES models in order to assess subsurface lithologies over a large area [61]. Under wet conditions, the resistivity of silt or clay is always less than that of sand or gravel, and similarly, gravel has higher resistivity than sand [12]. In this study, a correlation between lithological logs of 20 boreholes (1–20) and nearby VES models (4, 11, 17, 19–22, 24, 26–28, 30, 31, 33, 35, 37, 41, 42, 46, and 49) was performed to constrain the subsurface formation into six layers (Table 1). An example of such calibration between the lithological log of well 1 and nearby VES model 4 is shown in Figure 2b. Similarly, calibration between other well logs and VES models was performed to obtain a range of resistivity values for each layer applicable over the entire area. Clay was delineated along VES 30, 31, 33, 35, 37, 41, 42, 46, and 49 with a resistivity of 9 and 2, 7 and 0.8, 8, 2, 0.1, 0.4, 0.7, 0.7 and 0.1, and 0.2, respectively. Sandy clay was revealed along VES 21, 22, 24, 26, 28, 30, 31, 33, 35, 42, and 46 with a resistivity of 19, 22 and 8, 14, 25 and 10, 12, 10, 9, 8, 6, 5, and 7, respectively. Sand was evaluated along VES 2, 7, 20, 21, 22, 24, 26, and 28 with a resistivity of 35, 40, 30 and 21, 20, 25, 22, 38 and 22, and 29, respectively. Sandy gravel was delineated along VES 4, 11, 17, 19, 20, 22, 24, 26, 27, and 28 with a resistivity of 40, 51 and 41, 45, 55, 50 and 42, 35, 38, 40, 49, and 42, respectively. Last, gravel was interpreted along VES 4, 11, 17, 19, 20, 21, 26, and 27 with a resistivity of 90 and 432, 51, 320 and 64, 55 and 234, 58, 60 and 197, 110, and 87 and 260, respectively. Thus, based on the calibration between the well logs and nearby VES models, the first layer above water table was interpreted as topsoil cover or dry strata, having a resistivity of > 30 Ωm; the second layer below the water table was delineated as clay or silt, having a resistivity of < 10 Ωm; the third layer was revealed as sandy clay, having a resistivity of 5–25 Ωm; the fourth layer was interpreted with sand as the main lithology, having a resistivity of 20–40 Ωm; sandy gravel was delineated as the fifth prominent layer, having a resistivity of 35–55 Ωm; and the last layer was revealed as gravel, having a resistivity of >50 Ωm. Clay/silt and sandy clay contain saltwater, while sand, sandy gravel, and gravel have freshwater. 3D models of resistivity distribution and the interpreted lithologies for the investigation depth between 20–200 m are shown in Figure 3. Generally, lithologies change from clay to gravel farther inland in the northeast.
Electrical resistivity can change within a formation or from one formation to another, especially in the complex geological setting of the alluvial fans. In alluvial plains, resistivity varies with a small change in clay, sand, or gravel content. However, it creates ambiguity for the mixed lithologies such as clay and sandy clay or sandy clay and sand, and thus causes overlapping resistivity values [62]. There is overlap between the resistivity values for the lithologies, i.e., an intermixing of resistivity between 5–10 Ωm for clay and sandy clay, a resistivity between 20–25 Ωm for sandy clay and sand, a resistivity range of 35–40 Ωm for sand and sandy gravel, and a resistivity between 50–55 Ωm for sandy gravel and gravel (Table 1 and Figure 3). Based on the correlation between the VES models and local hydrogeological conditions, freshwater was delineated with a resistivity of greater than 20 Ωm and saline water was revealed to have a resistivity of less than 25 Ωm. A 3D map of the fresh/saline groundwater delineated by resistivity with an investigation depth between 20–200 m is shown in Figure 4. Thus, the intermixing of resistivity values between 20–25 Ωm causes an overlap of freshwater and saline water (Figure 4b). Therefore, a distinct limit between subsurface layers is not possible, since resistivity ranges show too small of a difference and cause overlap, especially in subsurface layers such as sandy clay with saline water and sand with freshwater. The geological composition of subsurface units is not always uniform, so these resistivity values are not unique. Resistivity can vary with minor changes in lithology or aquifer, which creates uncertainty in the results. With such ambiguity, VES alone cannot differentiate between freshwater and saline water. In such a situation, a more comprehensive technique such as D-Z parameters computed from VES models is required to delineate freshwater and saltwater without any overlap.

4.2. Analysis of Dar-Zarrouk Parameters

Applying the Dar-Zarrouk parameters, such as longitudinal resistivity (ρL), transverse resistance (Tr), and longitudinal conductance (Sc), provides useful solutions for the demarcation of saline and fresh groundwater [34,35]. These parameters offer plentiful solutions for VES interpretation, and thus provide better understanding about the delineation of saline and fresh groundwater [33]. D-Z parameters were first introduced by Maillet in 1947. D-Z parameters were estimated by different combinations of thickness and resistivity (Equations (2)–(4)) obtained from VES models. These parameters are highly significant in resistivity interpretation for the delineation of hydrogeological characteristics and groundwater conditions [12,35]. They remove the ambiguity produced in VES interpretation due to the intermixing of resistivity values that cause an overlap of lithologies and fresh/saline aquifers. Thus, these parameters delineate fresh and saline groundwater without any overlap.

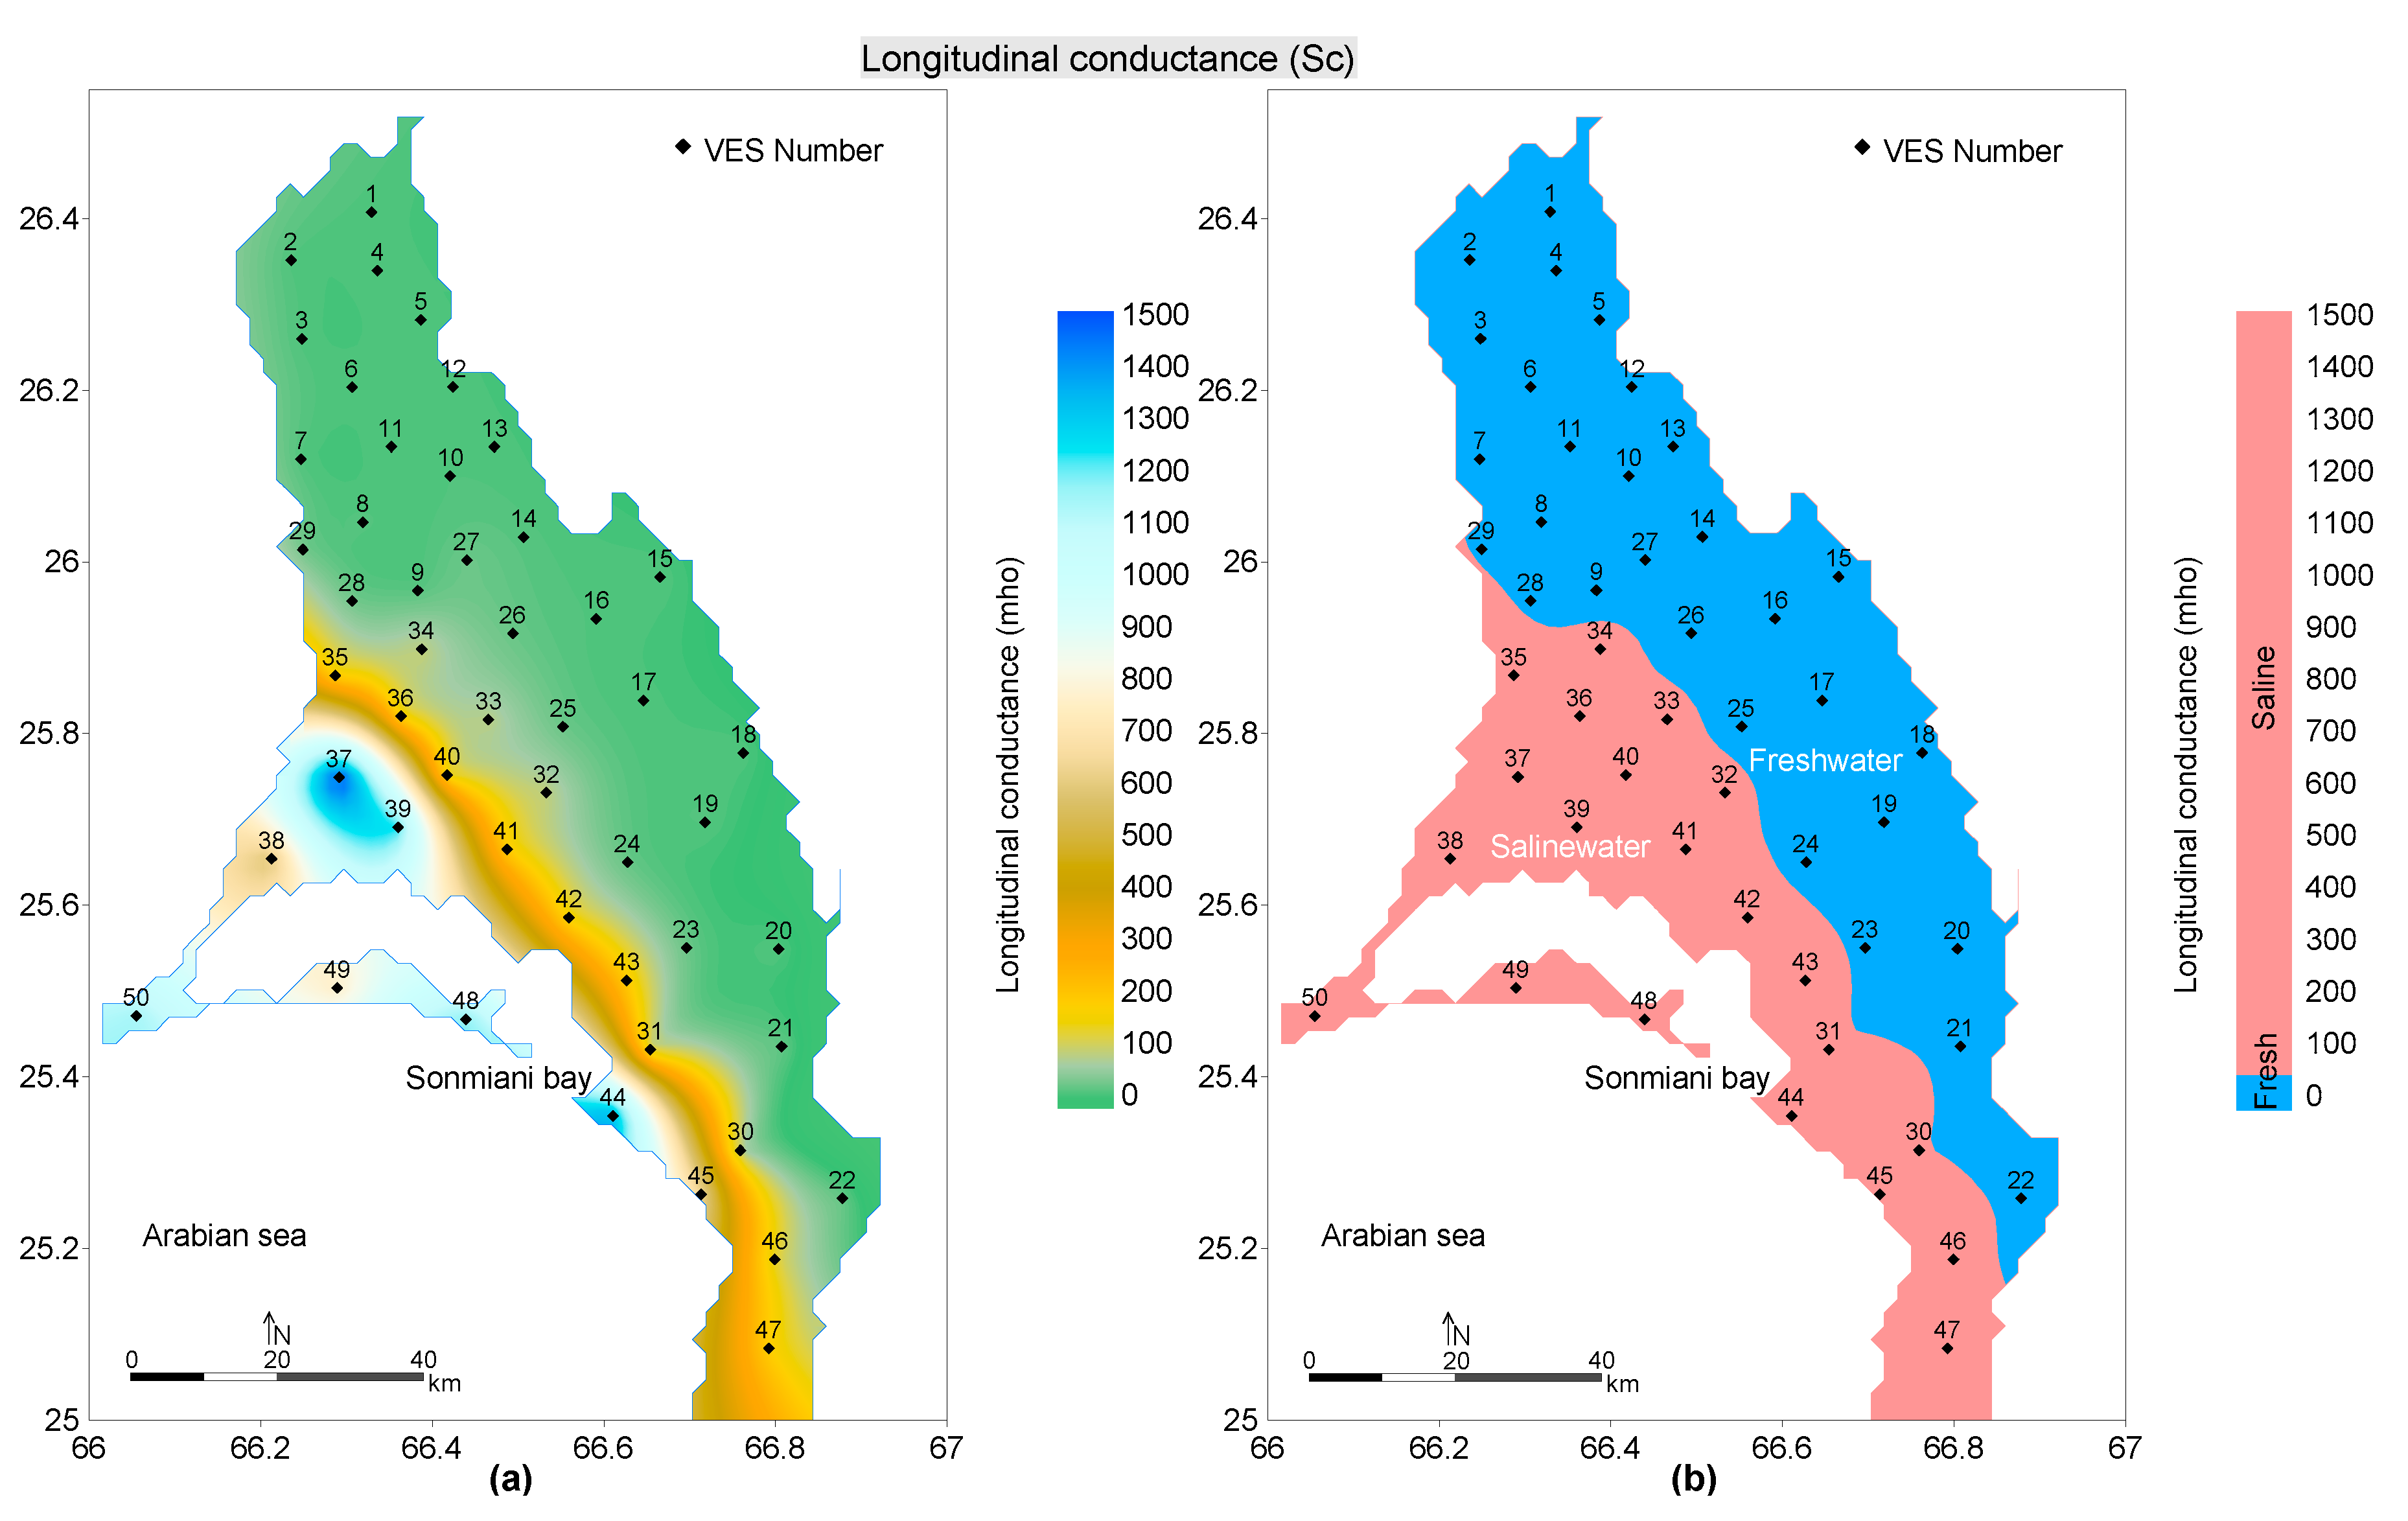
4.2.1. Longitudinal Conductance

The longitudinal conductance (Sc) was estimated for 50 VES data points up to 200 m depth of investigation. It varies from 2 mho to 1510 mho over the investigated area with low values in the northeast and high values in the southwest near the Arabian Sea (Figure 5a). Based on the hydrogeological conditions and borehole information of the study area, longitudinal conductance values were divided into a specific range for the delineation of freshwater and saline water (Table 2). Low values of longitudinal conductance reveals freshwater, whereas high values suggest saltwater. Longitudinal conductance is also useful for interpreting subsurface lithologies, and its high-to-low value generally interprets subsurface lithologies ranging from clay/silt to gravel/boulder. Based on the obtained range of longitudinal conductance values for the entire investigated area, freshwater was delineated with a longitudinal conductance of less than 40 mho, and saline water was revealed by a longitudinal conductance greater than 40 mho (Table 2). According to the observed range of longitudinal conductance values, freshwater was revealed by longitudinal conductance values of between 2–20.3 mho, and saline water was delineated with a longitudinal conductance ranging from 59 to 1510 mho (Table 2). Thus, a wide range of longitudinal conductance values, from 20.3 to 59 mho, was observed between freshwater and saline water, which suggests a clear differentiation between the two types of aquifers. The interpretation of longitudinal conductance suggests that saline water was demarcated with lithologies such as clay/silt and sandy clay, whereas freshwater was assessed by the lithologies including sand, sandy gravel, and gravel. Freshwater was interpreted for soundings 1–29, and saline water was evaluated for soundings 30–50 (Figure 5b). VES 37–39, 44, 45, and 48–50 show high values of longitudinal conductance, and thus suggest high salinity near the Arabian Sea. Seawater intrusion of about 13–42 km was observed from Sonmiani Bay (Arabian Sea) in the southwest farther inland (investigated area) towards the northeast.

4.2.2. Transverse Resistance

The transverse unit resistance (Tr) was computed using a total of 50 VES models for a maximum depth of 200 m. In the study area, transverse resistance values vary from 65 to 39,375 Ωm2 (Figure 6a). Transverse resistance values increase from the southwest (Sonmiani Bay) to the northeast (inland). High values of transverse resistance suggest freshwater, while low values reveal saline water. Based on local well information and hydrogeological conditions, a wide range of transverse resistance values was attained to demarcate fresh/saline groundwater (Table 2). Transverse resistance can successfully characterize subsurface lithologies without any overlap. Generally, low values of transverse resistance interpret clay/silt and sandy clay-type lithologies, whereas high values delineate lithologies such as sand, sandy gravel, and gravel. According to the obtained value range, transverse resistance delineated saline water with Tr of less than 2500 Ωm2, whereas freshwater was revealed with transverse resistance greater than 2500 Ωm2 (Table 2). Based on the observed value range of transverse resistance, a fresh aquifer was revealed by transverse resistance values from 3849 to 39,375 Ωm2, and a saline aquifer was delineated by transverse resistance ranging from 65 to 1711 Ωm2 (Table 2). Hence, a wide range of transverse resistance values, from 1711 to 3849 Ωm2, was obtained between saline water and freshwater, which reveals a clear separation between the two types of aquifers. The analysis of transverse resistance reveals that saline water was interpreted with lithologies such as clay/silt and sandy clay, whereas freshwater was delineated by lithologies such as sand, sandy gravel, and gravel. Transverse resistance delineated freshwater for soundings 1–29, and saline water for soundings 30–50 (Figure 6b). Thus, two distinct aquifers of fresh and saline groundwater were delineated by transverse resistance without any overlap (Figure 6b). Transverse resistance shows high values for soundings 1–20 in the northeast, which suggests a high quality of freshwater resources in these parts of the study area. The results of the transverse resistance suggest that a seawater intrusion of about 16–40 km is delineated from Sonmiani Bay in the Arabian Sea (southwest) farther inland from the study area towards the northeast. The results of Tr match with those of Sc for the delineation of the fresh/saline aquifer (Figure 5 and Figure 6).

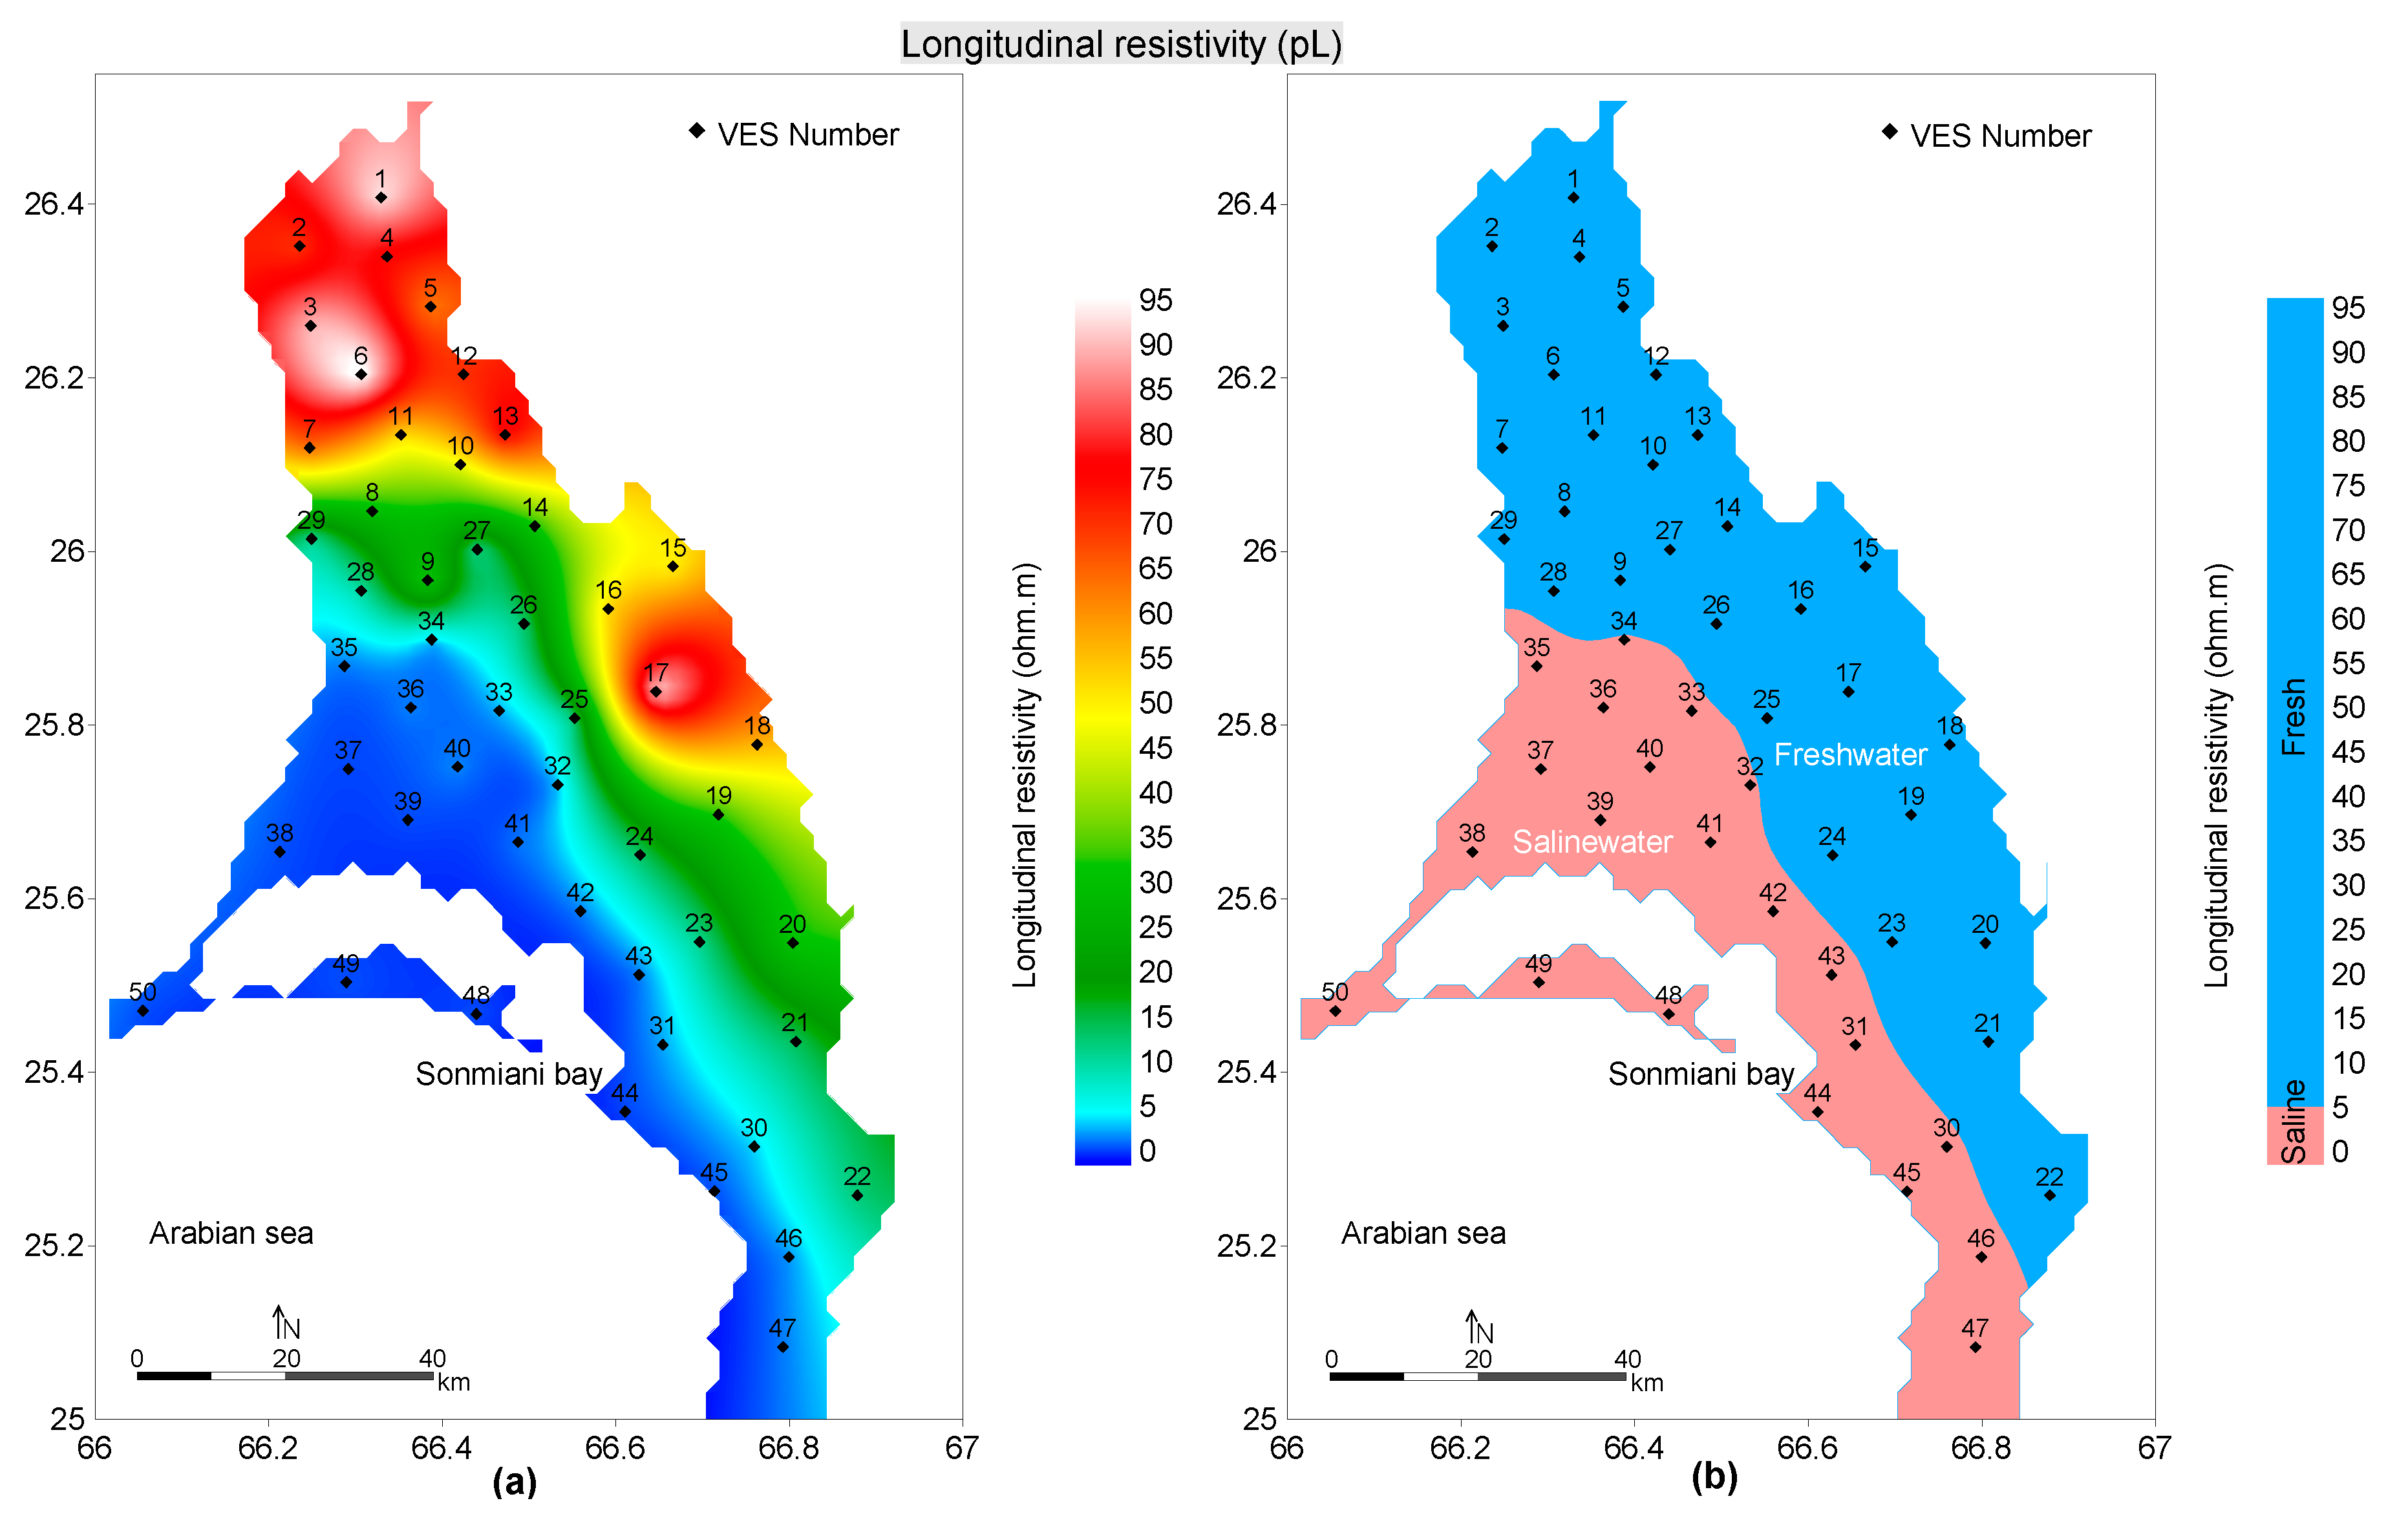
4.2.3. Longitudinal Resistivity

In this investigation, the longitudinal resistivity (ρL) was estimated for 50 VES in order to delineate seawater intrusion up to 200 m in depth. Longitudinal resistivity varies from 0.1 to 93.3 Ωm over the entire investigated area, showing high values in the northeast and low values in the southwest near Sonmiani Bay in the Arabian Sea (Figure 7a). On the basis of the hydrogeological setting and borehole information of the investigated area, longitudinal resistivity values were divided into a specific range for the demarcation of saline and fresh groundwater (Table 2). High values of longitudinal resistivity suggest freshwater, while low values delineate saltwater. Longitudinal resistivity is also helpful for characterizing subsurface lithologies. High values reveal sand and gravel-type lithologies, whereas low values indicate clay/silt. On the basis of the obtained range (overall range) of longitudinal resistivity values, saline water was delineated by a longitudinal resistivity of less than 5 Ωm, and freshwater was revealed with a longitudinal resistivity of greater than 5 Ωm (Table 2). According to the observed range of longitudinal resistivity values, freshwater was exposed by longitudinal resistivity values between 9.4–93.3 Ωm, and saline water was delineated with a longitudinal resistivity ranging from 0.1–3.2 Ωm (Table 2). Thus, a wide range of longitudinal resistivity values, from 3.3 to 9.4 Ωm, was acquired between freshwater and saline water, which suggests a clear separation between the two aquifers. VES 1 to 20 show high values of longitudinal resistivity, and thus suggest high quality of fresh groundwater in the northeast. The interpreted aquifers of longitudinal resistivity suggest that saline water was demarcated by lithologies such as clay/silt and sandy clay, while freshwater was assessed with lithologies such as sand, sandy gravel, and gravel. Freshwater was delineated for soundings 1–29, and saline water was evaluated for soundings 30–50 (Figure 7b). The interpreted map of longitudinal resistivity in Figure 7b gives a clear distinction between saline and fresh aquifers. A seawater intrusion of about 15–40 km was revealed to trend from Sonmiani Bay (Arabian Sea) in the southwest farther inland (investigated area) towards the northeast.
The results of the longitudinal resistivity, transverse unit resistance, and longitudinal conductance show good matching for the demarcation of saline and fresh groundwater (Figure 5, Figure 6 and Figure 7). The integrated results of the D-Z parameters delineate a seawater intrusion of about 13–42 km from Sonmiani Bay in the Arabian Sea farther inlands towards the Bela Plain. Thus, the Dar-Zarrouk parameters remove the ambiguities produced in VES interpretation, and delineate fresh/saline aquifers with clear distinction without any overlap.

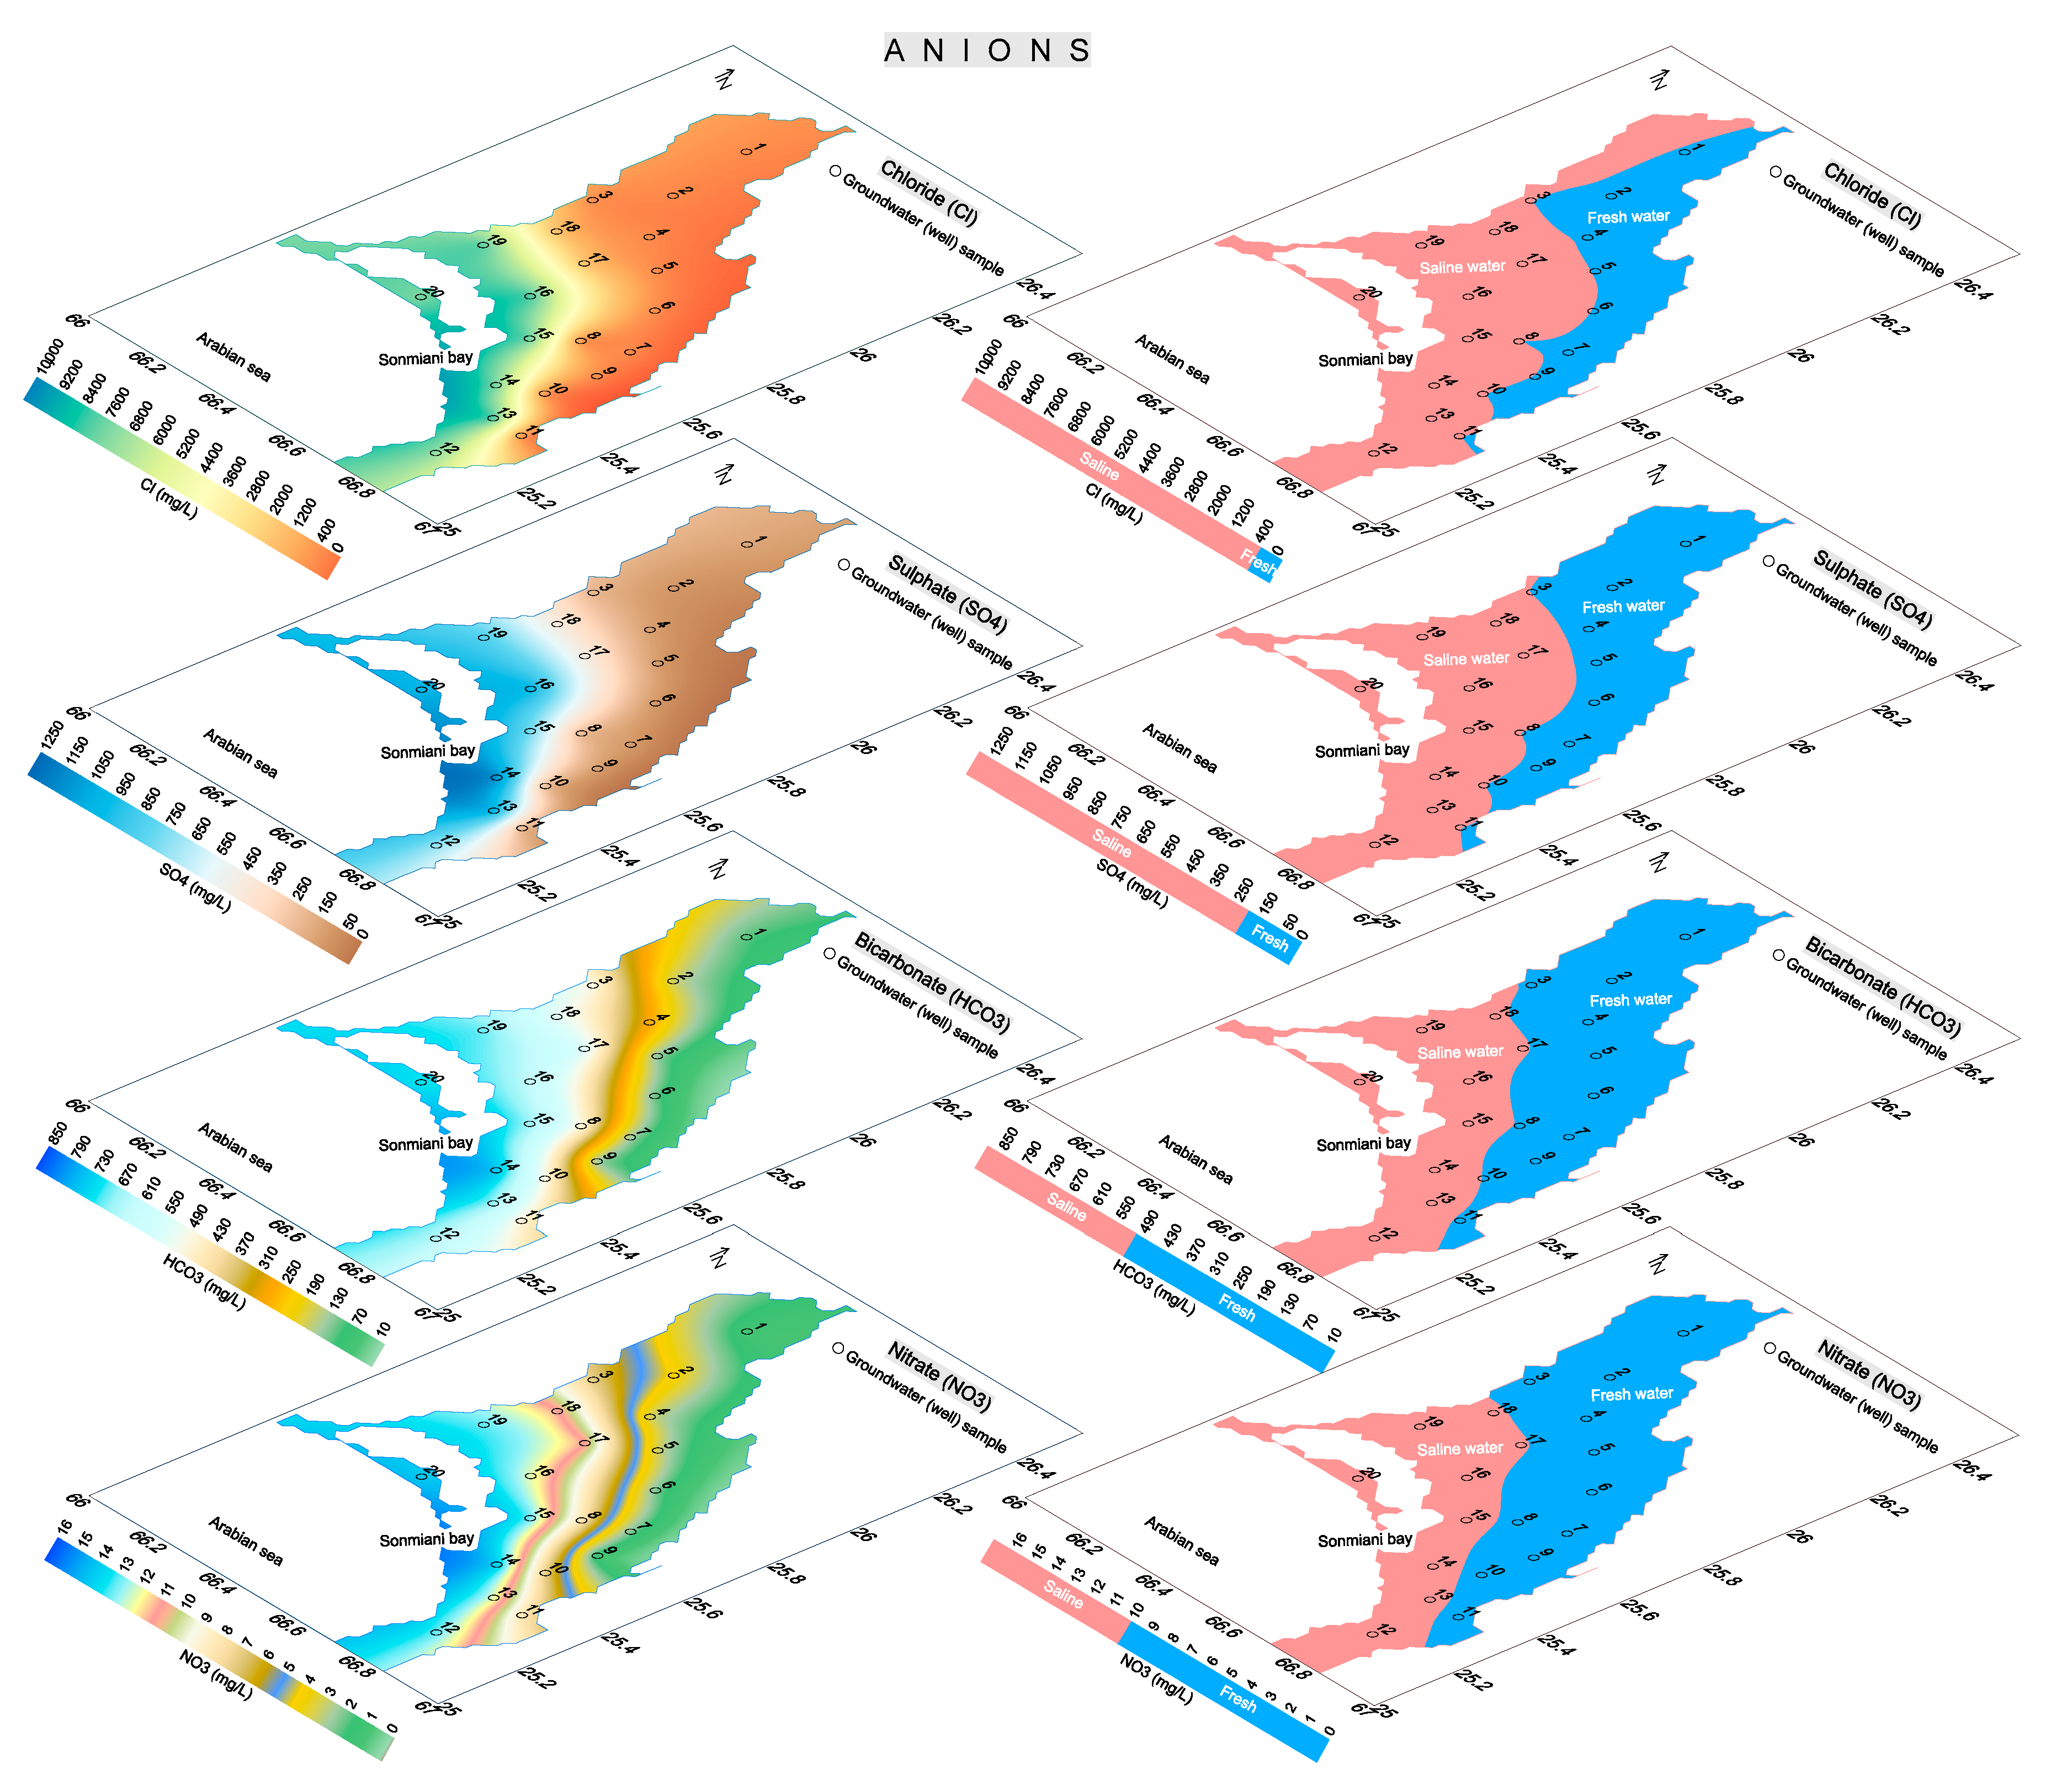
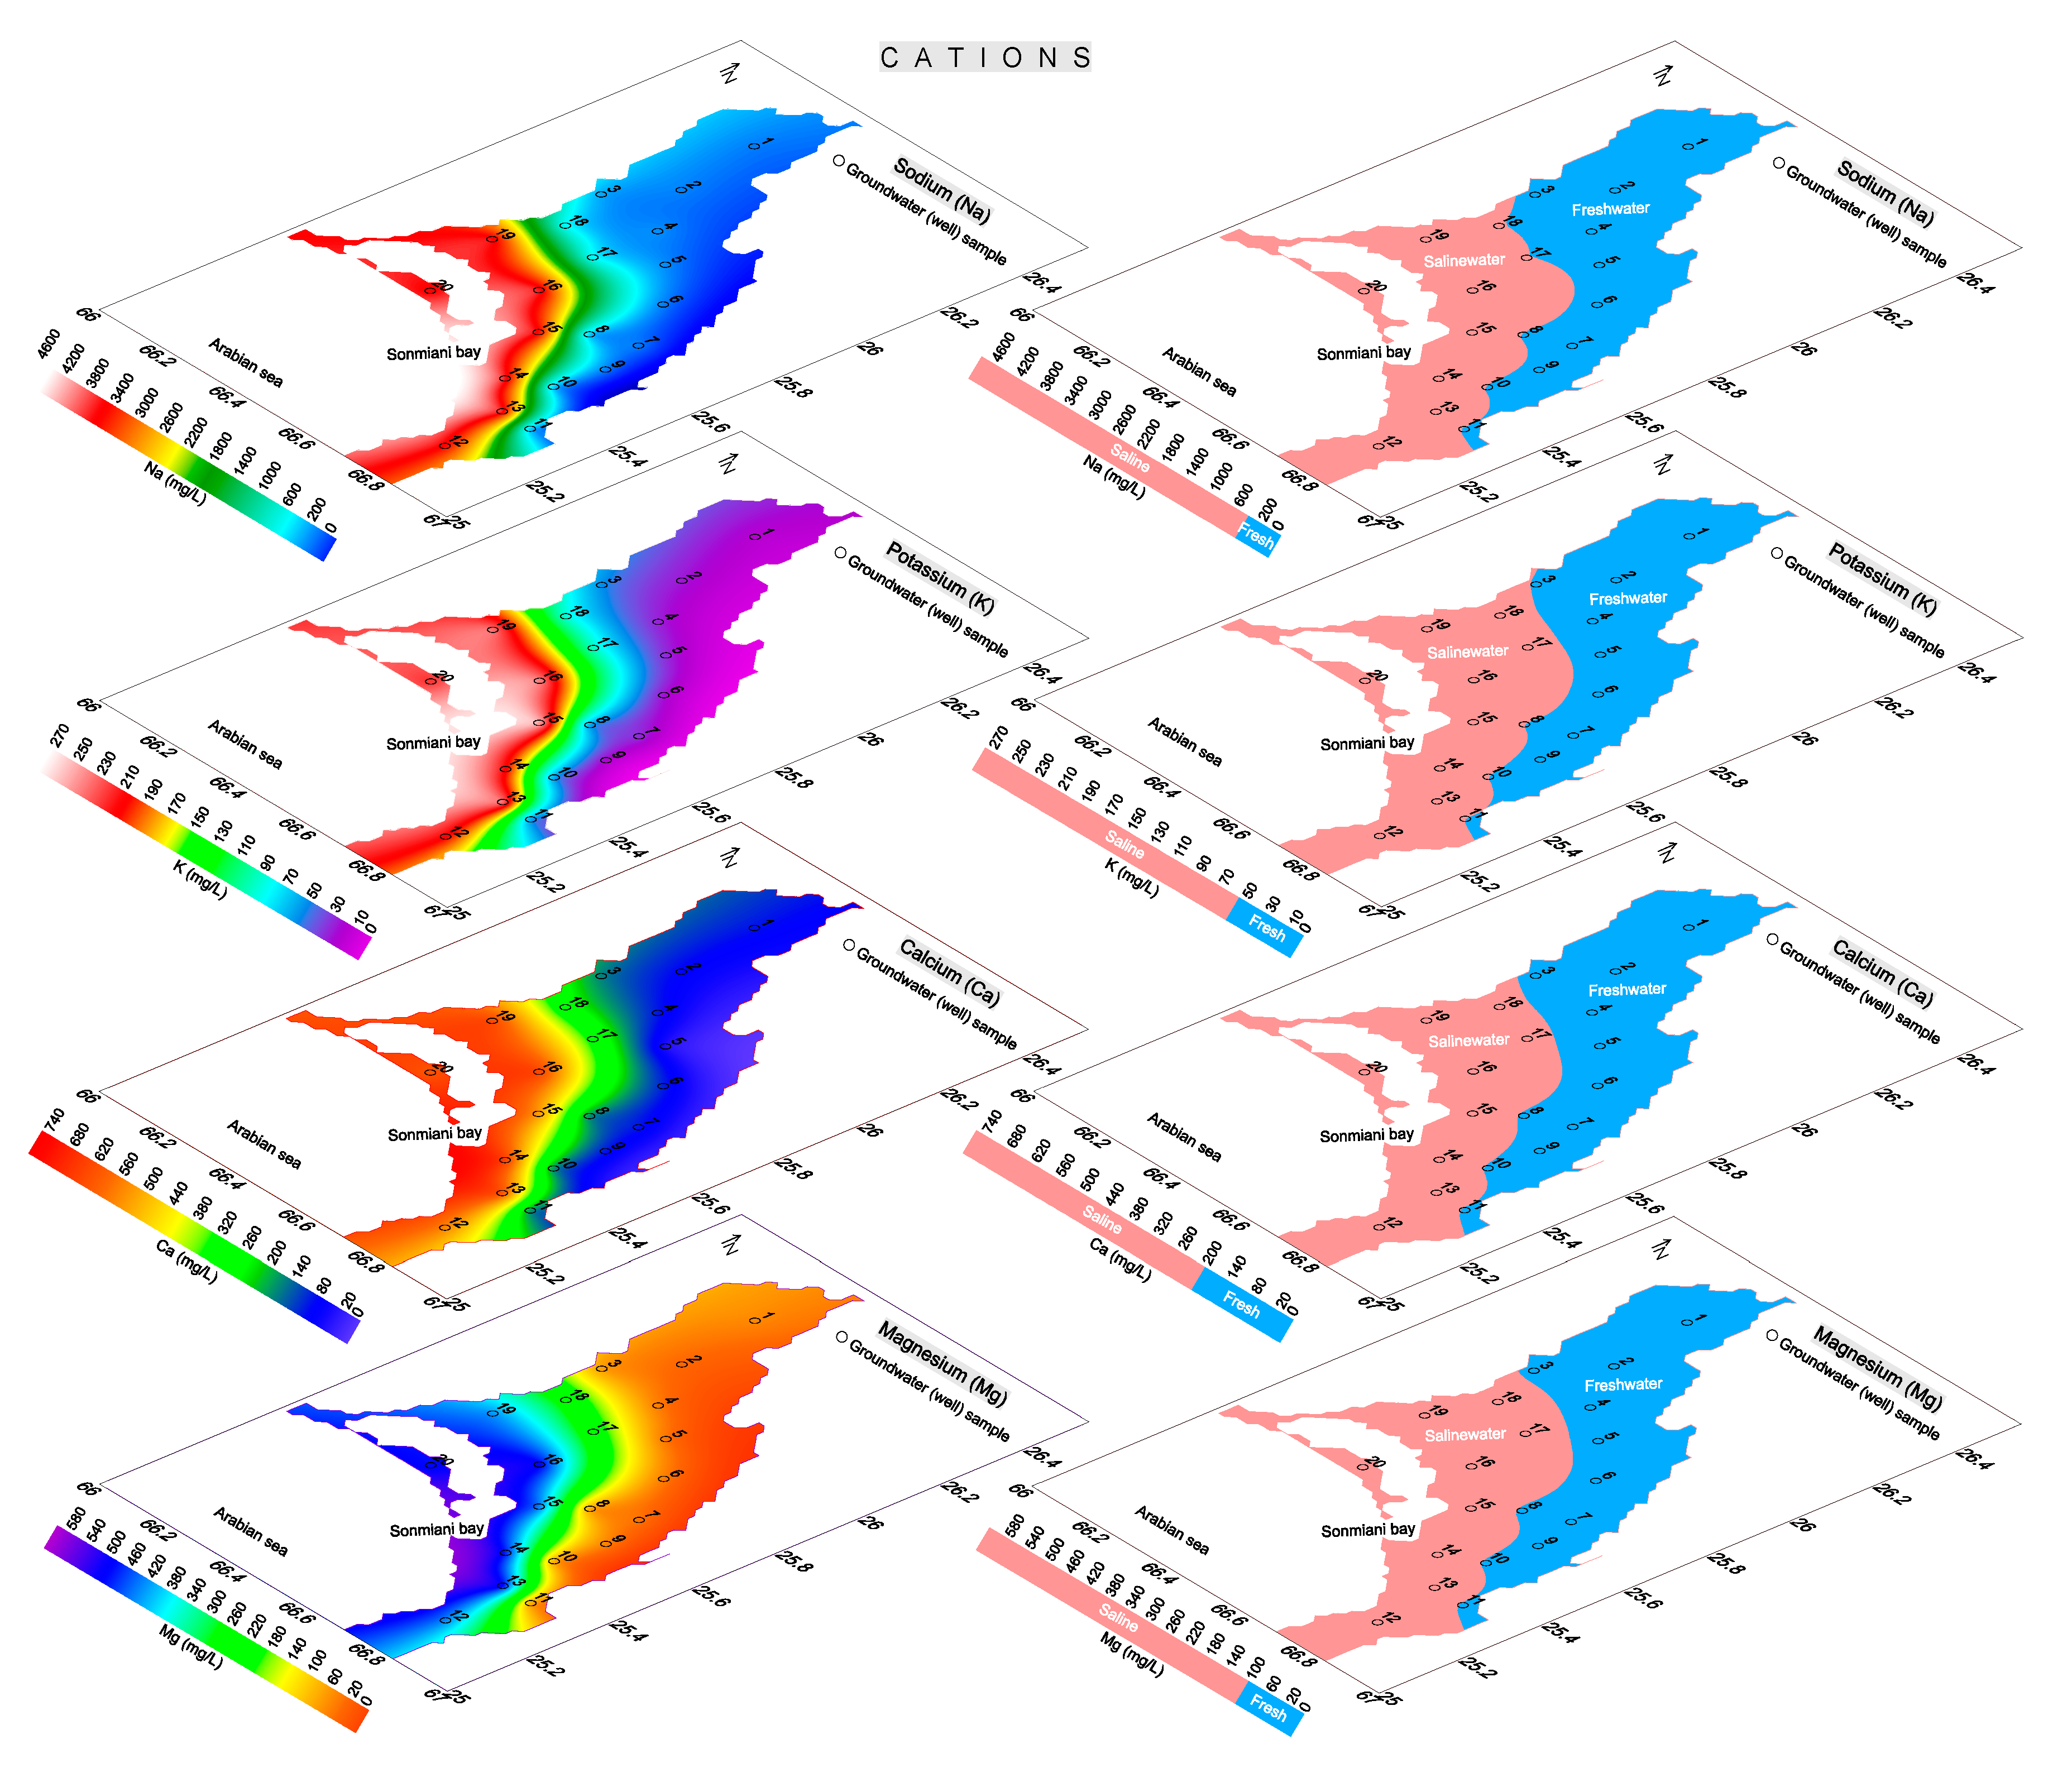
4.2.4. Analysis of Physicochemical Parameters

A physicochemical study was conducted for 20 samples collected from different places in the investigated site. A physicochemical analysis of these samples was performed using the permissible range of groundwater quality parameters suggested by the PSQCA (Pakistan Standards and Quality Control Authority) and PCRWR (Pakistan Council of Research in Water Resources). Table 3 provides a statistical study of the physicochemical parameters in terms of maximum, minimum, standard deviation, median, mean, and PSQCA/PCRWR range of the parameters. Samples that remained within the permissible range of the PSQCA/PCRWR were delineated as fresh groundwater samples, whereas the samples that exceeded the permissible limit were interpreted as saline groundwater samples. Groundwater quality analysis was performed for main anions, namely chloride (Cl), nitrate (NO3), bicarbonates (HCO3), and sulphates (SO42); major cations, including calcium (Ca2+), potassium (K+), magnesium (Mg2+), and sodium (Na+); and parameters such as pH, total dissolved solids (TDS), and electrical conductivity (EC) (Table 3). The main objective of the physicochemical analysis was to confirm the saline and fresh aquifers delineated by the D-Z parameters of the non-invasive VES method.
Based on the physicochemical analysis of the main cations, the map of fresh and saline aquifers is given in Figure 8, which suggests that 11 groundwater samples (1–11) delineate freshwater whereas 9 samples (from 12 to 20) reveal a saline aquifer (Figure 8). Using the suggested ranges of the PSQCA/PCRWR, sodium (>400 mg/L), potassium (>55 mg/L), calcium (>200 mg/L) and magnesium (>100 mg/L) delineated saline water for samples 12–20, whereas these parameters delineated freshwater for samples 1–11 with their values lying within the permissible ranges. Similarly, major anions such as chloride, sulphates, bicarbonates, and nitrate exceeded the permissible range (i.e., 250, 200, 500, and 10 mg/L, respectively) for samples 12–20 and thus reveal a saline aquifer, while samples 1–11 remain within the acceptable range of the PSQCA/PCRWR for these anions, which suggests freshwater (Figure 9). Other water quality parameters, namely pH, EC, and TDS, exceeded the permissible limit (8.5, 1500 μS/cm, and 1000 mg/L, respectively) for samples 12–20, and suggest saline water quality for these samples; however, samples 1–11 were found to be within the acceptable range for these parameters, and hence delineate freshwater. The physicochemical analysis performed for the main anions, cations, EC, TDS, and pH suggest that groundwater samples 1–11 delineate freshwater since they do not exceed the permissible range of the PSQCA/PCRWR, and samples 12–20, which exceed the acceptable range, delineate saline water (Figure 8, Figure 9 and Figure 10).

5. Discussion

The demarcation of saline and fresh groundwater is essential for the management of sustainable freshwater reserves. In the case of coastal aquifers, the intrusion of seawater into freshwater is a more challenging problem. Changes in the environment such as global warming, sea-level rise, and over-exploitation of freshwater resources are causing seawater intrusion. At present, seawater intrusion into coastal freshwater resources is a global issue. Several studies provide assessment of fresh/saline groundwater; however, most of those studies use laboratory tests. Such tests are expensive, time consuming, and do not provide coverage of large areas. However, the application of geophysical techniques is cheaper, non-invasive, and user friendly. Geophysical methods, especially vertical electrical sounding (VES) approaches, are widely used to delineate fresh/saline aquifers. VES can constrain the subsurface into several layers with specific resistivity values, and demarcate fresh/saline aquifers associated with the subsurface lithologies. In this study, VES provides 3D mapping of fresh/saline aquifers (Figure 4). However, in similar lithologies (i.e., clay, sandy clay, sand, sandy gravel, and gravel) of the study area, the intermixing of resistivity values caused an overlap of fresh and saline aquifers. The use of Dar-Zarrouk parameters provides more relievable solution to the problem of overlapping aquifers. Dar-Zarrouk parameters, namely longitudinal resistivity (ρL), transverse resistance (Tr), and longitudinal conductance (Sc) computed from VES models, can delineate fresh/saline aquifers with a wide range of values based on the local hydrogeological settings and lithological log information. However, the use of D-Z parameters is not common in groundwater studies, especially for the assessment of water quality. These studies provide the assessment of groundwater quality mostly in aquifer systems of distinct layers. In addition, most of these studies do not propose an integrated approach of D-Z parameters and other methods such as the geochemical method. Therefore, a comprehensive approach such as D-Z parameters is essential, which can provide solutions to the challenges in groundwater studies for the delineation of fresh/saline aquifers in any hydrogeological setting.
In this study, D-Z parameters provide 1D mapping of fresh/saline aquifers related to highly intermixed lithologies, which cannot be assessed by resistivity interpretation of VES. The results suggest that the fresh/saline aquifers revealed by D-Z parameters (longitudinal resistivity, transverse resistance, and longitudinal conductance) of the VES method match with those delineated by physicochemical parameters (i.e., sodium, potassium, calcium, magnesium, chloride, sulphates, bicarbonates, nitrate, electrical conductivity, total dissolved solids, and pH) (Figure 5, Figure 6, Figure 7, Figure 8, Figure 9 and Figure 10). A comparison (matching) of fresh/saline aquifers delineated by the geochemical method of 20 groundwater samples and the D-Z parameters of the selected VES near the water samples is shown in Table 4. The comparison suggests that the selected VES of the D-Z parameters delineates the same aquifer (fresh or saline) as revealed by the water samples of physicochemical parameters. However, near the fresh-saline interface, freshwater samples 3, 8, 10, and 11 may not be clearly shown in a freshwater map of parameters such as EC, TDS, and Cl. One reason is the very high-value range of such parameters for seawater (i.e., 1500–24,000 μS/cm for EC) as compared to the low values for freshwater (i.e., < 1500 μS/cm for EC). Another reason is that near the fresh–saline interface, the values of such parameters are close to the permissible range. For instance, in EC mapping of a fresh/saline aquifer, EC varies between 1402–17,654 μS/cm from freshwater sample 11 to saline water sample 13. Therefore, the fresh–saline interface is shown almost on sample 11 (Figure 10). However, for the physicochemical analysis, groundwater samples were obtained at a maximum depth of 125 m, whereas the D-Z parameters were estimated for a maximum 200 m depth. Thus, the D-Z parameters provide deeper insight of fresh/saline aquifers than geochemical analysis. Along VES 21–26, 9, and 28, the thickness of the overlying fresh aquifer was about 140 m, so this part was included in freshwater zones (Figure 5, Figure 6 and Figure 7). Similarly, around VES 30–35, 42, 43, and 46, the thickness of the underlying saline water was about 140 m, so this part was included in the saline water zone (Figure 5, Figure 6 and Figure 7). However, only fresh aquifers occurred around VES 1–20, 27, and 29 in the northeast, and similarly only saline aquifer occurred around VES 36–41, 44, 45, and 47–50 towards the Arabian Sea in the southwest (Figure 5, Figure 6 and Figure 7). However, in the case of groundwater samples taken at 120 m depth, physicochemical analysis delineated the same fresh/saline aquifer as revealed by the D-Z parameters at that depth (120 m). Therefore, the integration of both methods shows good matching for the delineation of fresh/saline aquifers (Table 4). The fresh/saline water interface is defined based on depth-integrated parameters, so it eventually leads to 1D interface definition. The results suggest that the application of D-Z parameters computed from the non-invasive VES method can be used as the best alternate to the expensive laboratory tests for the assessment of groundwater quality. Hence, D-Z parameters can assess the groundwater resources for sustainable water quality management in any hydrogeological environment.

6. Conclusions

In this investigation, 50 VES models were calibrated with data from 20 boreholes to assess fresh/saline aquifers related to the subsurface lithologies. This calibration constrained the subsurface into similar lithologies, such as clay/silt having a resistivity of <10 Ωm with saline water, sandy clay having a resistivity of between 5–25 Ωm with saline water, sand having a resistivity of 20–40 Ωm with freshwater, sandy gravel having a resistivity of 35–55 Ωm with freshwater, and gravel having a resistivity of >50 Ωm with freshwater. Overlapping resistivities was found for similar lithologies, such as 5–10 Ωm for clay–sandy clay, 20–25 Ωm for sandy clay–sand, 35–40 for sand–sandy gravel, and 50–55 Ωm for sandy gravel–gravel. The intermixing of subsurface lithologies, such as sandy clay (containing saline water) and sand (containing freshwater) causes the overlap of fresh/saline aquifers. D-Z parameters were computed from VES to remove the above ambiguity.
Freshwater was delineated with a longitudinal conductance of less than 40 mho, a transverse unit resistance greater than 2500 Ωm2, and a longitudinal resistivity greater than 5 Ωm. Saline water was revealed by a longitudinal conductance greater than 40 mho, transverse unit resistance less than 2500 Ωm2, and longitudinal resistivity less than 5 Ωm. The observed values of D-Z parameters delineated freshwater with Sc between 2–20.3 mho, Tr from 3849–39375 Ωm2, and ρL between 9.4–93.3 Ωm; and saline water with Sc between 59–1510 mho, Tr from 65–1711 Ωm2, and ρL between 0.1–3.2 Ωm. Hence, a wide range of values of Dar-Zarrouk parameters delineated fresh/saline aquifers with more confident solutions without any overlapping. The interface between fresh and saline aquifers is defined based on the depth of the integrated parameters, which eventually leads to 1D interface definition. These parameters delineated seawater intrusion of about 13–42 km from Sonmiani Bay of Arabian Sea inland towards the Bela Plain. Saline and fresh groundwater zones revealed by the D-Z parameters were validated by physicochemical parameters.
This work provides three of the most important findings (innovations). First, in the case of a subsurface with distinct lithologies, VES can be used to delineate subsurface lithologies and fresh/saline aquifers with a 3D view. Second, in the case of intermixing subsurface lithologies, D-Z parameters computed from VES can demarcate fresh/saline aquifer without any overlapping. Last, the D-Z parameter approach is proposed as the best (inexpensive) alternative to replace expensive laboratory test analysis to assess groundwater resources for sustainable water quality management in any environment with a homogeneous or heterogeneous setting.

Author Contributions

Conceptualization, M.H.; methodology, M.H. and Y.S.; software, M.H.; validation, M.H., Y.S., and M.M.; formal analysis, M.H. and Y.S.; investigation, M.H., Y.S., M.M., W.J., M.K., and Q.G.; resources, M.H. and Y.S.; data curation, M.H., Y.S., M.M., and W.J.; writing—original draft preparation, M.H., Y.S., and M.K.; writing—review and editing, M.H., Y.S., and M.M.; visualization, M.H.; supervision, M.H. and Y.S.; project administration, M.H. and Y.S.; funding acquisition, M.H., Y.S., and M.M. All authors have read and agreed to the published version of the manuscript.

Funding

This research was funded by the Chinese Academy of Sciences for Post-Doctoral fellowship (No. 2020PD01), the National Basic Research Program of China (No. 2014CB046901), the Chinese National Scientific Foundation Committee (NSFC) (No. 41772320), the National Science and Technology Basic Resources Investigation Project (No. 2018FY100503), the Second Tibetan Plateau Scientific Expedition and Research Program (STEP) (No. 2019QZKK0904), and the Research Supporting Project number (RSP-2020/89), King Saud University, Riyadh, Saudi Arabia.

Acknowledgments

The authors wish to acknowledge support received from IGG’s International Fellowship Initiative (IIFI) for Post-doctorate; Key Laboratory of Shale Gas and Geoengineering, Institute of Geology and Geophysics, Chinese Academy of Sciences, Beijing, China; the Pakistan Council of Research in Water Resources, Islamabad Pakistan (PCRWR); and the Water and Power Development Authority, Pakistan (WAPDA). The authors would like to thank the Research Supporting Project number (RSP-2020/89), King Saud University, Riyadh, Saudi Arabia, and the Second Tibetan Plateau Scientific Expedition and Research Program (STEP) (No. 2019QZKK0904) for funding this work.

Conflicts of Interest

The authors declare no conflict of interest.

References

  1. Barlow, P.M.; Reichard, E.G. Saltwater intrusion in coastal regions of North America. Hydrogeol. J. 2010, 18, 247–260. [Google Scholar] [CrossRef]
  2. Gopalakrishnan, T.; Hasan, M.K.; Haque, A.; Jayasinghe, S.L.; Kumar, L. Sustainability of coastal agriculture under climate change. Sustainability 2019, 11, 7200. [Google Scholar] [CrossRef] [Green Version]
  3. Cardona, A.; Carrillo-Rivera, J.J.; Huizar-A’lvarez, R.; Graniel-castro, E. Salinization in coastal aquifers of arid zones: An example from Santo Domingo, Baja California Sur, Mexico. Environ. Geol. 2004, 45, 350–366. [Google Scholar] [CrossRef]
  4. Hasan, M.; Shang, Y.; Akhter, G.; Jin, W.J. Delineation of contaminated aquifers using integrated geophysical methods in Northeast Punjab, Pakistan. Environ. Monit. Assess. 2019, 192, 12. [Google Scholar] [CrossRef]
  5. Hasan, M.; Shang, Y.; Akhter, G.; Jin, W. Delineation of saline-water intrusion using surface geoelectrical method in Jahanian Area, Pakistan. Water 2018, 10, 1548. [Google Scholar] [CrossRef] [Green Version]
  6. Gopalakrishnan, T.; Kumar, L.; Mikunthan, T. Assessment of spatial and temporal trend of groundwater salinity in Jaffna Peninsula and its link to paddy land abandonment. Sustainability 2020, 12, 3681. [Google Scholar] [CrossRef]
  7. Mas-Pla, J.; Ghiglieri, G.; Uras, G. Seawater intrusion and coastal groundwater resources management. Examples from two mediterranean regions: Catalonia and Sardinia. Contrib. Sci. 2014, 10, 171–184. [Google Scholar]
  8. Shi, L.; Jiao, J.J. Seawater intrusion and coastal aquifer management in China: A review. Environ. Earth Sci. 2014, 72, 2811–2819. [Google Scholar] [CrossRef]
  9. Morgan, L.K.; Werner, A.D. A national inventory of seawater intrusion vulnerability for Australia. J. Hydrol. Reg. Stud. 2015, 4, 686–698. [Google Scholar] [CrossRef] [Green Version]
  10. Chen, D.; Elhadj, A.; Xu, H.; Xu, X.; Qiao, Z. A Study on the Relationship between land use change and water quality of the mitidja watershed in Algeria based on GIS and RS. Sustainability 2020, 12, 3510. [Google Scholar] [CrossRef]
  11. Bear, J. Conceptual and mathematical modeling. In Seawater Intrusion in Coastal Aquifers; Springer: Dordrecht, The Netherlands, 1999; pp. 127–161. [Google Scholar]
  12. Hasan, M.; Shang, Y.; Akhter, G.; Jin, W. Application of VES and ERT for delineation of fresh-saline interface in alluvial aquifers of Lower Bari Doab, Pakistan. J. Appl. Geophys. 2019, 164, 200–213. [Google Scholar] [CrossRef]
  13. Jalali, M. Salinization of groundwater in arid and semi-arid zones: An example from Tajarak, western Iran. Environ. Geol. 2007, 52, 1133–1149. [Google Scholar] [CrossRef]
  14. Adepelumi, A.A.; Ako, B.D.; Ajayi, T.R.; Afolabi, O.; Omotoso, E.J. Delineation of saltwater intrusion into the freshwater aquifer of Lekki Peninsula, Lagos, Nigeria. Environ. Geol. 2009, 56, 927–933. [Google Scholar] [CrossRef]
  15. Carol, E.; Kruse, E.; Mas-Pla, J. Hydrochemical and isotopical evidence of ground water salinization processes on the coastal plain of Samborombón Bay, Argentina. J. Hydrol. 2009, 365, 335–345. [Google Scholar] [CrossRef]
  16. Shammas, M.I.; Jacks, G. Seawater intrusion in the Salalah plain aquifer, Oman. Environ. Geol. 2007, 53, 575–587. [Google Scholar] [CrossRef]
  17. Khublaryan, M.G.; Frolov, A.P.; Yushmanov, I.O. Seawater intrusion into coastal aquifers. Water Resour. 2008, 35, 274–286. [Google Scholar] [CrossRef]
  18. Essink, G.H.P.O. Improving fresh groundwater supply-problems and solutions. Ocean Coast. Manag. 2001, 44, 429–449. [Google Scholar] [CrossRef]
  19. Werner, A.D.; Bakker, M.; Post, V.E.A.; Vandenbohede, A.; Lu, C.; Ataie-Ashtiani, B.; Simmons, C.T.; Barry, D.A. Seawater intrusion processes, investigation and management: Recent advances and future challenges. Adv. Water. Resour. 2013, 51, 3–26. [Google Scholar] [CrossRef]
  20. Zhu, S.; Zhou, Z.; Guo, Q.; Ma, J. A Study on the cause of layered seawater intrusion in the daqing river estuary of Liaodong Bay, China. Sustainability 2020, 12, 2842. [Google Scholar] [CrossRef] [Green Version]
  21. Ros, S.E.M.; Zuurbier, K.G. The impact of integrated aquifer storage and recovery and Brackish Water Reverse Osmosis (ASRRO) on a coastal groundwater system. Water 2017, 9, 273. [Google Scholar] [CrossRef]
  22. Leghouchi, E.; Laib, E.; Guerbet, M. Evaluation of chromium contamination in water, sediment and vegetation caused by the tannery of Jijel (Algeria): A case study. Environ. Monit. Assess. 2009, 153, 111–117. [Google Scholar] [CrossRef] [PubMed]
  23. Ebraheem, A.A.M.; Senosy, M.M.; Dahab, K.A. Geoelectrical and hydrogeochemical studies for delineating groundwater contamination due to salt-water intrusion in the northern part of the Nile delta, Egypt. Ground Water 1997, 35, 216–222. [Google Scholar] [CrossRef]
  24. Hopkins, D.G.; Richardson, J.L. Detecting a salinity plume in an unconfined sandy aquifer and assessing secondary soil salinization using electromagnetic induction techniques, North Dakota, USA. Hydrogeol. J. 1999, 7, 380–392. [Google Scholar] [CrossRef]
  25. Edet, A.E.; Okereke, C.S. A regional study of saltwater intrusion in southeastern Nigeria based on the analysis of geoelectrical and hydrochemical data. Environ. Geol. 2001, 40, 1278–1289. [Google Scholar]
  26. Lee, S.; Kim, K.; Ko, I.; Hwang, H. Geochemical and geophysical monitoring of saline water intrusion in Korean paddy fields. Environ. Geochem. Health 2002, 24, 277–291. [Google Scholar] [CrossRef]
  27. Wilson, S.R.; Ingham, M.; McConchie, J.A. The applicability of earth resistivity methods for saline interface definition. J. Hydrol. 2006, 316, 301–312. [Google Scholar] [CrossRef]
  28. Bataynch, A.T. Use of electrical resistivity methods for detecting subsurface fresh and saline water and delineating their interfacial configuration: A case study of the eastern Dead Sea coastal aquifers, Jordan. Hydrogeol. J. 2006, 14, 1277–1283. [Google Scholar] [CrossRef]
  29. Sherif, M.; El Mahmoudi, A.; Graamoon, H.; Kacimov, A.; Akram, S.; Ebraheem, A.; Shetty, A. Geoelectrical and hydrogeochemical studies for delineating seawater intrusion in the outlet of Wadi Ham, UAE. Environ. Geol. 2006, 49, 536–551. [Google Scholar] [CrossRef]
  30. Hasan, M.; Shang, Y.; Akhter, G.; Khan, M. Geophysical Investigation of Fresh-Saline Water Interface: A Case Study from South Punjab, Pakistan. Groundwater 2017, 55, 841–856. [Google Scholar] [CrossRef]
  31. Loke, M.H.; Acworth, I.; Dahlin, T. A comparison of smooth and blocky inversion method in 2D electrical tomography surveys. Explor. Geophys. 2003, 34, 182–187. [Google Scholar] [CrossRef]
  32. Singh, U.K.; Das, R.K.; Hodlur, G.K. Significance of Dar-Zarrouk parameters in the exploration of quality affected coastal aquifer systems. Environ. Geol. 2004, 45, 696–702. [Google Scholar] [CrossRef]
  33. Henriet, J.P. Direct application of the Dar-Zarrouk parameters in ground water surveys. Geophys. Prospect 1976, 24, 344–353. [Google Scholar] [CrossRef]
  34. Singh, K.P. Nonlinear estimation of aquifer parameters from surficial resistivity measurements. Hydrol. Earth Syst. Sci. Discuss. 2005, 2, 917–938. [Google Scholar] [CrossRef] [Green Version]
  35. Batayneh, A.T. The estimation and significance of Dar-Zarrouk parameters in the exploration of quality affecting the Gulf of Aqaba coastal aquifer systems. J. Coast. Conserv. 2013, 17, 623–635. [Google Scholar] [CrossRef]
  36. Nwankwo, C.; Nwosu, L.; Emujakporue, G. Determination of Dar Zarouk parameters for the assessment of groundwater resources potential: Case study of Imo State, south eastern Nigeria. J. Econ. Sustain. Dev. 2011, 2, 57–71. [Google Scholar]
  37. Yasala, S.; Olivera, H.; Raja, A.S.; Muthurajb, D.; Chandrasekara, N. Estimation of conductance anomalies in subsurface through Dar- Zarrouk parameters by resistivity inversion method. Int. J. Phys. Math. Sci. 2012, 3, 140–151. [Google Scholar]
  38. Zohdy, A.R. The auxiliary point method of electrical sounding interpretation, and its relationship to the Dar Zarrouk parameters. Geophysics 1965, 30, 644–660. [Google Scholar] [CrossRef]
  39. Agoubi, B.; Kharroubi, A.; Abichou, T.; Abida, H. Hydrochemical and geoelectrical investigation of Marine Jeffara aquifer, southeastern Tunisia. Appl. Water Sci. 2013, 3, 415–429. [Google Scholar] [CrossRef]
  40. Kouzana, L.; Benassi, R.; Ben Mammou, A.; Sfar Felfoul, M. Geophysical and hydrochemical study of the seawater intrusion in Mediterranean semiarid zones, case of the Korba coastal aquifer (Cap-Bon, Tunisia). J. Afr. Earth Sci. 2010, 58, 242–254. [Google Scholar] [CrossRef]
  41. Cimino, A.; Cosentino, C.; Oieni, A.; Tranchina, L. A Geophysical and geochemical approach for seawater intrusion assessment in the Acquedolci coastal aquifer (Northern Sicily). Environ. Geol. 2008, 55, 1473–1482. [Google Scholar] [CrossRef]
  42. Kazakis, N.; Pavlou, A.; Vargemezis, G.; Voudouris, K.S.; Soulios, G.; Pliakas, F.; Tsokas, G. Seawater intrusion mapping using electrical resistivity tomography and hydrochemical data. An application in the coastal area of eastern Thermaikos Gulf, Greece. Sci. Total Environ. 2016, 543, 373–387. [Google Scholar] [CrossRef] [PubMed]
  43. Fadili, A.; Najib, S.; Mehdi, K.; Riss, J.; Malaurent, P.; Makan, A. Geoelectrical and hydrochemical study for the assessment of seawater intrusion evolution in coastal aquifers of Oualidia, Morocco. J. Appl. Geophys. 2017, 146, 178–187. [Google Scholar] [CrossRef]
  44. Najib, S.; Fadili, A.; Mehdi, K.; Riss, J.; Makan, A. Contribution of hydrochemical and geoelectrical approaches to investigate salinization process and seawater intrusion in the coastal aquifers of Chaouia. Morocco. J. Contam. Hydrol. 2017, 198, 24–36. [Google Scholar] [CrossRef]
  45. Water and Power Development Authority, Pakistan (WAPDA). Annual Report of River and Climatological Data of Pakistan, River Discharge, Sediment and Quality Data; Prepared by Surface Water Hydrology Project; WAPDA: Lahore, Pakistan, 1973.
  46. Water and Power Development Authority, Pakistan (WAPDA). Annual Reports 1988–89; WAPDA: Lahore, Pakistan, 1989; pp. 21–98.
  47. George, N.J.; Ibanga, J.I.; Ubom, A.I. Geoelectrohydrogeological indices of evidence of ingress of saline water into freshwater in parts of coastal aquifers of Ikot Abasi, southern Nigeria. J. Afr. Earth Sci. 2015, 109, 37–46. [Google Scholar] [CrossRef]
  48. Samouëlian, A.; Cousin, I.; Tabbagh, A.; Bruand, A.; Richard, G. Electrical resistivity survey in soil science: A review. Soil Tillage Res. 2005, 83, 173–193. [Google Scholar] [CrossRef] [Green Version]
  49. Telford, W.M.; Geldart, L.P.; Sheriff, R.E. Applied Geophysics; Cambridge University Press: Cambridge, UK, 1990; p. 770. [Google Scholar]
  50. Zarroca, M.; Bach, J.; Linares, R.; Pellicer, X.M. Electrical methods (VES and ERT) for identifying, mapping and monitoring different saline domains in a coastal plain region (Alt Emporda, Northern Spain). J. Hydrol. 2011, 409, 407–422. [Google Scholar] [CrossRef]
  51. Stewart, M.T. Evaluation of electromagnetic methods for rapid mapping of salt-water interfaces in coastal waters. Ground Water 1982, 20, 538–545. [Google Scholar] [CrossRef]
  52. Fitterman, D.V.; Stewart, M.T. Transient electromagnetic sounding for groundwater. Geophysics 1986, 51, 995–1005. [Google Scholar] [CrossRef]
  53. Duque, C.; Calvache, M.L.; Pedrera, A.; Rosales, W.M.; Chicano, M.L. Combined time domain electromagnetic soundings and gravimetry to determine marine intrusion in a detrital coastal aquifer (Southern Spain). J. Hydrol. 2008, 348, 536–547. [Google Scholar] [CrossRef]
  54. Bakker, T.W.; Jungerius, P.D.; Klijn, J.A. Dunes of the European Coasts: Geohydrology, Hydrology, Soils. Catena Suppl 1990, 18, 109–119. [Google Scholar]
  55. Batte, A.G.; Muwanga, A.; Sigrist, W.P. Evaluating the Use of Vertical Electrical Sounding As A Groundwater Exploration Technique To Improve On The Certainty Of Borehole Yield In Kamuli District (Eastern Uganda). Afr. J. Sci. Technol. (AJST) Sci. Eng. Ser. 2008, 9, 72–85. [Google Scholar]
  56. IpI2Winv.2.1Usersguide. Computer Software User Guide Catalog; Moscow State University, Geological Faculty, Department of Geophysics and GEOSCAN-M Ltd: Moscow, Russia, 2001; p. 25.
  57. Todd, D.K.; Mays, L.W. Groundwater Hydrology; John Wiley & Sons: Hoboken, NJ, USA, 2004. [Google Scholar]
  58. Kelly, W.E.; Reiter, P.F. Influence of anisotropy on relation between electrical and hydraulic properties. J. Hydrol. 1984, 74, 311–321. [Google Scholar] [CrossRef]
  59. APHA (American Public Health Association). Standard Methods for the Examination of Water and Wastewater; American Public Health Association: Washington, DC, USA, 2000. [Google Scholar]
  60. WHO (World Health Organization). Guidelines for Drinking-Water Quality. Recommendations Incorporating 1ST and 2nd Addenda, 3rd ed.; World Health Organization: Geneva, Switzerland, 2008; Volume 1. [Google Scholar]
  61. Batayneh, A.T. Hydrogeophysical investigation of groundwater potential in the southern Amman District, central Jordan. Arab J. Sci. Eng. 2011, 36, 89–96. [Google Scholar] [CrossRef]
  62. Zhdanov, M.; Keller, G. The Geoelectrical Methods in Geophysical Exploration. In Methods in Geochemistry and Geophysics; Zhdanov, M., Wannamaker, P.E., Eds.; Elsevier: Amsterdam, The Netherlands, 1994; p. 408. [Google Scholar]
Figure 1. (a) Location of vertical electrical soundings (VES) and water samples in the study area and (b) a schematic diagram showing seawater intrusion in the investigated area.
Sustainability 12 09730 g001
Figure 2. (a) Schematic diagram for the measurement of resistivity in the field [57], (b) construction of the subsurface model for VES 4 using IPI2WIN software and calibration between the interpreted VES model 4 and the lithological log of well 1 and (c) estimation of longitudinal unit conductance (Sc) and transverse unit resistance (Tr) for the same VES model [58].
Sustainability 12 09730 g002
Figure 3. (a) 3D distribution of the formation resistivity computed from 50 VES models for a depth between 20–200 m and (b) construction of the 3D interpreted model for the same depth and VES of (a) after the correlation between the VES models and borehole data.
Sustainability 12 09730 g003
Figure 4. (a) 3D view of inverted resistivity for an investigation depth up to 200 m and (b) 3D demarcation of saline and fresh groundwater based on (a) and local hydrogeological information.
Sustainability 12 09730 g004
Figure 5. (a) Distribution of longitudinal conductance in the investigated area and (b) interpretation of longitudinal conductance for the demarcation of the fresh–saline groundwater boundary.
Sustainability 12 09730 g005
Figure 6. (a) Distribution of transverse resistance in the investigated area and (b) interpretation of transverse resistance for the demarcation of the fresh–saline groundwater boundary.
Sustainability 12 09730 g006
Figure 7. (a) Distribution of longitudinal resistivity in the investigated area and (b) interpretation of the longitudinal resistivity for the demarcation of the fresh–saline groundwater boundary.
Sustainability 12 09730 g007
Figure 8. Demarcation of saline and fresh groundwater using main cations such as Na, K, Ca, and Mg in the investigated area.
Sustainability 12 09730 g008
Figure 9. Demarcation of saline and fresh groundwater using main anions such as Cl, SO4, HCO3, and NO3 in the investigated area.
Sustainability 12 09730 g009
Figure 10. Demarcation of saline and fresh groundwater using groundwater parameters such as pH, TDS, and EC in the investigated area.
Sustainability 12 09730 g010
Table 1. Calibration between the lithological logs and the resistivity in the investigated area.
Subsurface Resistivity (Ωm)Water TableLithology TypeWater Type
>30AboveTopsoil coverDry strata
<10BelowClay or siltSaline water
5–25BelowSandy claySaline water
20–40BelowSandFreshwater
35–55BelowSandy gravelFreshwater
>50BelowGravelFreshwater
Table 2. Estimation of the Dar-Zarrouk parameters for the study of freshwater and saline water in the study area.
Dar-Zarrouk ParametersWater TypeObtained RangeObserved Range
Longitudinal unit conductance (SC)Freshwater<40 mho2–20.3 mho
Saline water>40 mho59–1510 mho
Transverse unit resistance (Tr)Freshwater>2500 Ωm23849–39,375 Ωm2
Saline water<2500 Ωm265–1711 Ωm2
Longitudinal resistivity (ρL)Freshwater>5 Ωm9.4–93.3 Ωm
Saline water<5 Ωm0.1–3.2 Ωm
Table 3. Physicochemical study of 20 groundwater samples using the permissible range of the PSQCA/PCRWR for the assessment of groundwater quality in the investigated area.
Physicochemical
Parameters
UnitsMinimumMaximumMeanMedianS.DSuggested Range of PSQCA/PCRWR
for Aquifers
FreshSaline
CationsNa+(mg/L)28365513471611679<400>400
K+(mg/L)152531065094<55>55
Ca2+(mg/L)30650299154240<200>200
Mg2+(mg/L)2149520854201<100>100
AnionsCl(mg/L)130812229592433605<250>250
SO42−(mg/L)851144441190384<200>200
HCO3(mg/L)95756437487239<500>500
NO3(mg/L)114885<10>10
Other
Parameters
EC(μS/cm)45019232714414118203<1500>1500
TDS(mg/L)3111327149299745659<1000>1000
pH-7.19.58.38.20.9<8.5>8.5
Table 4. Comparison between physicochemical parameters (20 groundwater samples) and Dar-Zarrouk parameters (20 VES near sampling wells) for the delineation of fresh and saline aquifers in the investigated area.
Physicochemical ParametersDar-Zarrouk ParametersMatchingPhysicochemical ParametersDar-Zarrouk ParametersMatching
Sample NumberAquifer
Type
VES
Number
Aquifer TypeYes/NoSample NumberAquifer
Type
VES
Number
Aquifer TypeYes/No
1Fresh4FreshYes11Fresh22FreshYes
2Fresh11FreshYes12Saline46SalineYes
3Fresh28FreshYes13Saline30SalineYes
4Fresh27FreshYes14Saline31SalineYes
5Fresh26FreshYes15Saline42SalineYes
6Fresh17FreshYes16Saline41SalineYes
7Fresh19FreshYes17Saline33SalineYes
8Fresh24FreshYes18Saline35SalineYes
9Fresh20FreshYes19Saline37SalineYes
10Fresh21FreshYes20Saline49SalineYes
Publisher’s Note: MDPI stays neutral with regard to jurisdictional claims in published maps and institutional affiliations.

