Impact of Residential Building Layouts on Microclimate in a High Temperature and High Humidity Region


1
College of Horticulture and Forestry Sciences, Huazhong Agricultural University, Wuhan 430070, China
2
State Key Laboratory of Subtropical Building Science, South China University of Technology, Guangzhou 510640, China
3
Key Laboratory of Urban Agriculture in Central China, Ministry of Agriculture and Rural Affairs, Wuhan 430070, China
*
Author to whom correspondence should be addressed.
Sustainability 2020, 12(3), 1046; https://doi.org/10.3390/su12031046
Submission received: 15 December 2019
/
Revised: 10 January 2020
/
Accepted: 29 January 2020
/
Published: 2 February 2020
(This article belongs to the Collection Adaptive Cities: Urban Planning and Design Contribution for Achieving Climate Resilient Cities)
Abstract
:Microclimatic condition is a fundamental indicator for evaluating outdoor space livability and vitality. Research has shown that poorly designed building layouts can lead to discomfort; however, the mechanisms influencing outdoor microclimate based on residential building layout are unclear for high temperature and high humidity regions. This study explores the relationship between residential building layouts and the outdoor wind and thermal environment at the pedestrian level in Wuhan, a city renowned for high temperatures and high humidity. Six typical residential building layouts were simulated, using the ENVI-met numerical model, to determine the spatial distribution of wind speed and air temperature. The Universal Thermal Climate Index was adopted as a comprehensive index with which to assess spatial and diurnal variations in microclimates surrounding each building layout. Results showed that parallel building layouts formed a ventilation corridor that increased wind speeds by approximately 0.3 m/s. A staggered building layout, in line with the prevailing wind direction, facilitated airflow in the ventilation corridor and further increased wind speeds. Windward buildings blocked high-temperature airflows and reduced air temperatures by approximately 1 ℃ in parallel layouts, and 1.4 ℃ in enclosed layouts. However, the cooling effect of windward buildings on high-temperature airflow was weaker than the warming effect caused by the wind shadow effect and direct sunlight. Additionally, the performance of the thermal comfort of the enclosed type layout was significantly better, for most of the day, than the parallel type layout.
1. Introduction
Residential areas are the basic unit, and a fundamental component, of urban space. As the concentration of residents living increases, so too does the need for a high-quality microclimatic environment. Researchers have suggested that natural ventilation and a comfortable thermal environment in outdoor spaces can greatly improve the livability and vitality of residential areas [1,2,3]. Furthermore, improving outdoor microclimates can effectively reduce building energy consumption in residential areas [4,5]. Consequently, improving the quality of microclimates in residential areas is a focus for researchers and residential planning.
Previous studies have shown that the layout of buildings without rational planning has caused discomfort. Yang et al. [6] empirically compared parallel and enclosed building layouts and found that the thermal environment of the parallel layout was poor because lower building density resulted in higher solar exposure. Furthermore, the enclosed layout should avoid a negative impact on site ventilation. However, this study only targeted a real residential area case. To study the commonness of microclimate characteristics in residential areas, some studies have constructed a residential area model composed of simple building blocks. For example, Hong et al. [7] performed a numerical simulation based on the simple layout formed by setting up the building orientation and spacing. They found that when the wind direction was perpendicular to a linear building orientation, most of the wind was blocked and a low wind velocity area occurred at the back of the building. Berkovic et al. [8] compared the thermal comfort of three enclosed courtyards with different aspect ratios and concluded that the 2:1 courtyard, with its main axis pointing N–S, had the smallest amount of shade and was therefore the most uncomfortable layout. However, it is difficult for the general study of microclimate based on simple building blocks to reflect the characteristics of residential building layout and its outdoor microclimate in different climate regions. In addition, few studies focus on the diurnal dynamic characteristics of thermal comfort in residential areas, especially in high temperature and high humidity regions. Thus, a systematic study on the relationship between residential building layout and microclimates in high temperature and high humidity regions is necessary.
The city of Wuhan in China has a long history of climate problems arising from urban development [9]. The threat of high temperature in urban areas caused the government and decision-makers to regulate the construction of human settlements [10]. In 2017, the Large Cities Climate Leadership Group signed a cooperation agreement with Wuhan, proposing to support the city in becoming a national climate adaptability pilot city [11]. Subsequently, Wuhan issued an action plan for peak carbon emissions, emphasizing the construction of low-carbon buildings as the strategy with which to implement a climate-adaptive city [12]. Therefore, a quantitative study on the microclimates of residential building layouts can provide scientific support for local government and decision makers in terms of managing climate problems.
The objectives of this study are to: (1) extract the typical residential building layout cases in a high temperature and high humidity region; (2) construct reliable numerical simulation models based on the typical residential building layouts; (3) compare the advantages and disadvantages of microclimate in different typical residential building layouts; and (4) propose measures to improve microclimates in a high temperature and high humidity region. Hopefully, our findings will provide insights into the relationship between typical residential building layouts and microclimate factors in high temperature and high humidity regions and provide a scientific reference for residential planning in these regions.
2. Methods
2.1. Study Area
Wuhan is located in Central China (30°35′N, 114°17′E) and is one of the largest metropolitan cities in China, with an area of some 8500 km2 and a population of over 10 million. It has a subtropical monsoon climate, with high temperature and high humidity in summer. The mean temperature of the hottest month of July is between 25 ℃ and 30 ℃, about 2 ℃ higher than other places of the same latitude in the world, and the relative humidity is above 75% [13]. During the midsummer of 2000–2005, Wuhan recorded five severe high temperature events, where the daily average mortality rate was 50.7% higher than usual [14,15].
Following the acceleration of urban development in recent years, airflow in the street canyon in downtown Wuhan has been seriously restricted by compact building blocks, creating low permeability areas [16]. The thermal field in Wuhan has increased significantly, and the high temperature area has been expanding while the thermal environment has been deteriorating [17]. Between 2005 and 2017, the value of the completed residential building area was consistently high (Figure 1), indicating that the city’s residential areas are still expanding and diversified urban residential areas are a likely future occurrence.
2.2. Methods
2.2.1. Construction of Simulation Models
Numerical models that ignore the influence of the model boundary tend to exaggerate the wind conditions and cause inaccuracies in the thermal environment [19]. To alleviate this exaggeration, many studies use a surrounding environment model to act as a buffer zone around the research area [20]. In this paper, we added a block around the study area and a model of 3 × 3 building group blocks was used for the simulation, as shown in Figure 2a. The surrounding blocks (SB) were configured in the same parallel building layout. The area of the each block was 180 × 175 m and the model in the study area represented the main residential area layouts in Wuhan (Figure 2b). Parallel type building layouts included aligned parallel layout, east–west staggered layout, north–south staggered layout, parallel layout with central open space. Enclosed type layouts included enclosed layout and enclosed layout with central open space. The widths (D) of the four streets (ST) which divide the blocks were set as 20 m and the model orientation was north–south. The length (L) of each residential building was 40 m and the width (W) was 12 m. Sub-high-rise buildings are typical and common in China; therefore, building height was set at 33 m (11 floors). Considering fire protection, sunshine conditions, and economical land use, the longitudinal (L1) and lateral (L2) spacings were set at 32 and 16 m, respectively.
2.2.2. Microclimate Simulation by ENVI-met
In this study, ENVI-met software was used to simulate the microclimate processes of the urban residential area model. The ENVI-met is a three-dimensional computational dynamics model that can simulate the interaction between architectural physics and the surrounding microclimate, including wind circulation, solar access and energy exchange [21]. In recent years, it has been widely used in microclimate simulations of geometric texture in urban areas [22,23,24]. Previous studies have compared the simulated values with field measured data and wind tunnel tests to validate the reliability of ENVI-met in high temperature and high humidity regions in summer [25,26,27]. Their results indicated that the model could reliably and accurately calculate the dynamics of urban climate and investigate the interactions between climatological conditions and local environment design.
The ENVI-met model is composed of a 1D boundary condition initialization model and a 3D computational area model (Figure 3). We used the forced boundary condition for turbulence, temperature and humidity in this paper, which means that the kinetic energy of the logarithmic wind profile and its dissipation rate, as well as the hourly temperature and humidity, were directly copied to the inflow boundary of the 3D main model after the initial discretization in the 1D model. The geometric settings of the model are listed in Table 1. The simulation area was covered by the mesh of a 179 × 179 grid, with a horizontal resolution of 2 m. It should be noted that the equidistant grid was used in the vertical direction and the bottom grid was divided into five sub-grids to improve the simulation accuracy at ground level. The vertical range of the simulation area was at least twice the height of the highest building in the area, considering the stability of the simulation. Therefore, there were 29 grids in the vertical direction with a size of 3 m (0.6 m for bottom grid). The meteorological data used in the ENVI-met configuration file were representative of a typical summer day in Wuhan. The simulation start time was 06:00 local time on 21 July 2018 and the duration was 42 h. The first 18 h of the simulation were discarded to allow for model spin-up. Results were calculated at a height of 1.5 m above the ground, reflecting the height of a standing person.
2.2.3. Assessment of Results
Figure 4 shows a flow chart describing the methodology for assessing simulation results. Wind and air temperature were selected to assess model microclimate characteristics in terms of the overall model and its spatial distribution. The following indicators were used in this study: average wind speed (AU), wind speed standard deviation (Su), average temperature (Ata), and air temperature standard deviation (STa). Standard deviation was used as a measure of spatial variability; the larger the standard deviation, the more heterogeneous the spatial distribution of the variable. Furthermore, wind speed spatial variability is likely to cause turbulence [28]. The Universal Thermal Climate Index (UTCI) was considered as thermal index to assess the microclimate from the perspective of human thermal comfort, and assessment was conducted in terms of spatial distribution and diurnal variation from 9:00–17:00 h. The UTCI was developed by COST (Cooperation in Science and Technology) Action730 and established in 2011. It is based on the Fiala multi-node human physiology and thermal comfort model and integrates the adaptive clothing model. It is also considered to be equivalent to the air temperature, which would elicit the same physiological reaction that the dynamic response of the physiological model predicted [29]. The UTCI can adequately represent various climates, weather and locations, while other indices can only adequately express bioclimatic conditions in specific situations [30]. The threshold value ranges from above 46 ℃ to below −40 ℃, and is categorized into ten categories of thermal stresses, ranging from ‘extreme cold stress’ to ‘extreme heat stress’ (Table 2). In this paper, the measurements of an average person (male, 1.75 m tall, 35 years old, 75 kg, 164.49 W for overall metabolic rate, and 0.9 clo for clothing resistance) were used for the UTCI calculation, and other meteorological parameters were obtained from the simulation.
3. Results
3.1. Wind Field Characteristics
Figure 5 shows the overall wind speed characteristics of the six simulation cases described in Figure 2b. Wind speed standard deviation was lower in parallel type layouts compared to enclosed type layouts (except in Case 3), indicating that the distribution of wind speed was relatively more uniform in parallel type layouts. The wind blocking demonstrated in Case 6 was markedly higher compared to other cases, resulting in the lowest overall wind speed (1.1 m/s) and highest standard deviation (0.61 m/s). Conversely, Case 4 showed the highest wind speed (1.4 m/s) and lowest wind speed standard deviation (0.48 m/s). Wind speeds in Cases 2 and 3 were 1.31 and 1.28 m/s, respectively, and the standard deviations were 0.49 and 0.52 m/s, respectively.
Table 3 shows the relative frequencies of the area experienced by different wind speed classifications in the site at pedestrian level according to a method based on surveys of pedestrian-level natural ventilations in Hong Kong [31]. Conditions are considered comfortable when the wind speed exceeds 1 m/s. Good pedestrian level wind speeds were the most common, followed by satisfactory, low, poor, and stagnant. Case 4 (63.2%) had the largest area with good wind environment characteristics, followed by Case 1 (61.9%). Cases 2, 3, and 5 were similar, with approximately 50% of the domain having good wind characteristics, while less than 40% of the Case 6 domain demonstrated good wind characteristics. The area of stagnant wind environment in Case 6 is the largest (11.04%), while that in Case 4 is the smallest (1.35%). Figure 6 illustrates the spatial distribution of pedestrian level wind speed. Case 4 had the best wind environment because the building layout did not markedly impact air flow, and the central space was conducive to smooth wind circulation. Conversely, there was no central square area in Case 1, and the side-by-side buildings formed a ventilation corridor, increasing airflow from east to west and accelerating wind speeds by approximately 0.3 m/s compared to the surrounding area. In Case 2, the east–west staggered building layout generated an open space on the eastern edge of the model domain. This channeled the wind into the canyon formed by the second and third rows of buildings, thus accelerating wind speeds by approximately 0.4 m/s compared to the surrounding area. However, this layout prevented airflow from entering the corridors formed by the first and second, and third and fourth building rows. Consequently, the spatial distribution of wind speeds in Case 2 was relatively high. The comfort area in Case 3 was 4.22% less than that of Case 2. The north–south staggered buildings in this layout prevented the wind from entering the interior of the site and caused wind shading. The L-shaped buildings in Case 5 prevented the wind from entering the site, decreasing the extent of good wind characteristics, particularly between the second and third building rows. Case 6 had the worst wind environment, with 11% of the domain characterized by stagnant conditions. Although this layout has a central space, the longitudinal spacing of windward buildings was narrow, blocking airflow to the central space and causing wind speeds to fall below 0.5 m/s.
3.2. Temperature Field Characteristics
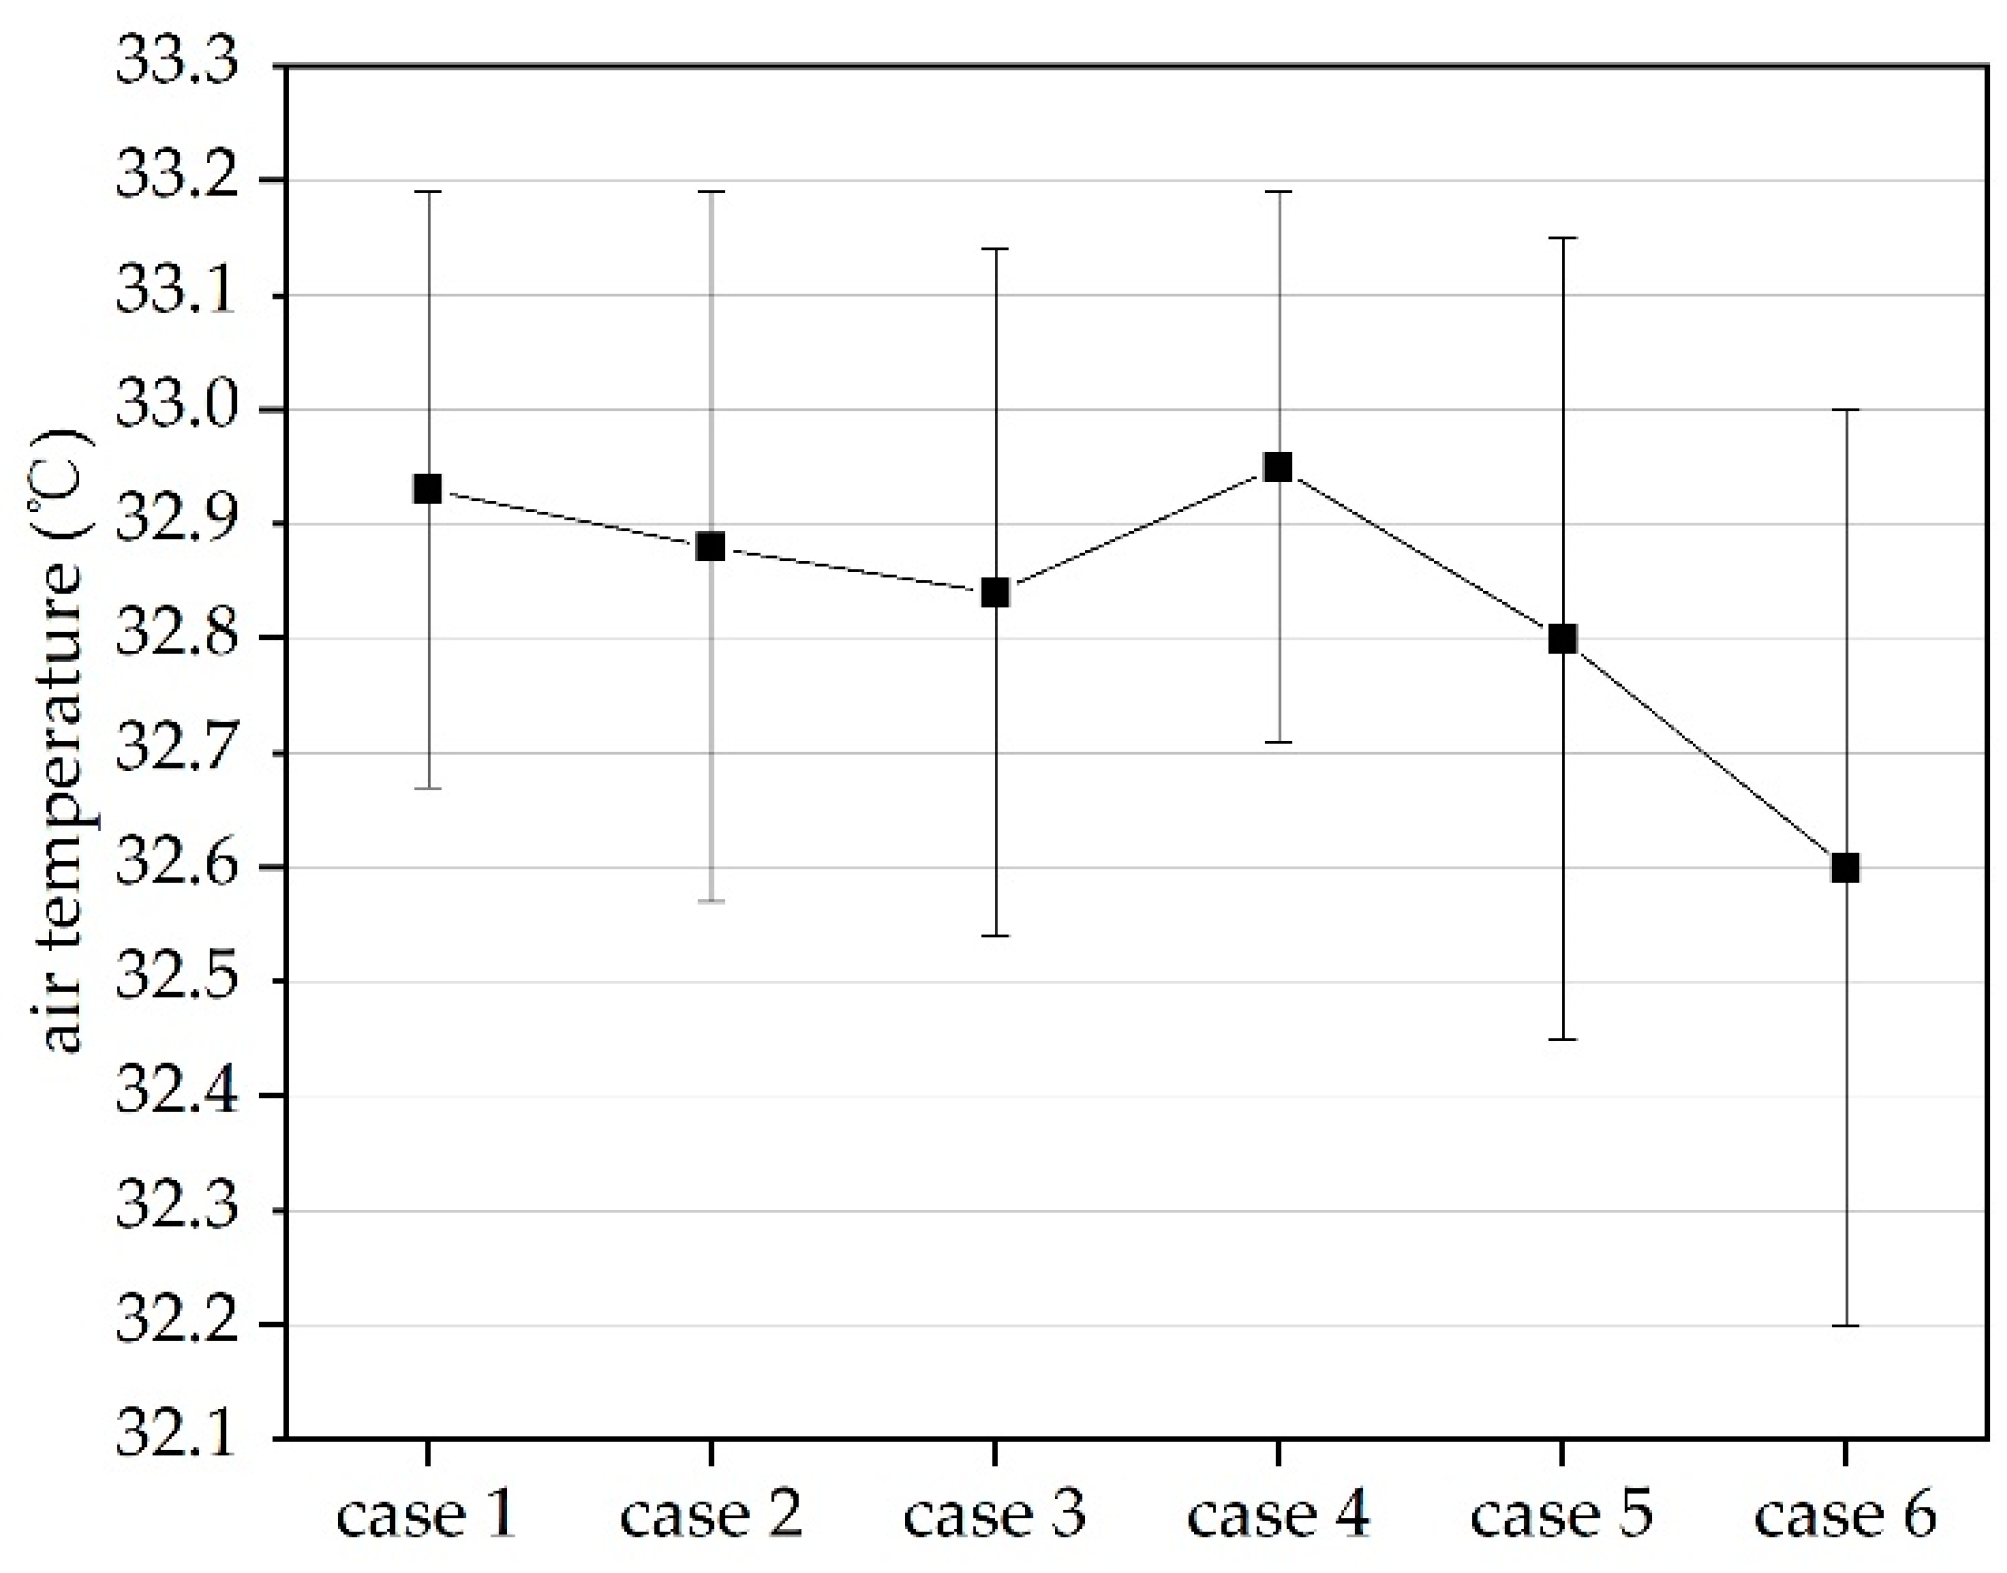
Figure 7 shows the mean and standard deviations of air temperature. Standard deviations ranged from 0.2 to 0.4 ℃, indicating that temperatures in all cases were fairly uniform. Average air temperatures ranged from 32.6 to 33.0 ℃. Air temperatures (standard deviations) in parallel type layouts were higher (lower) than enclosed type layouts.
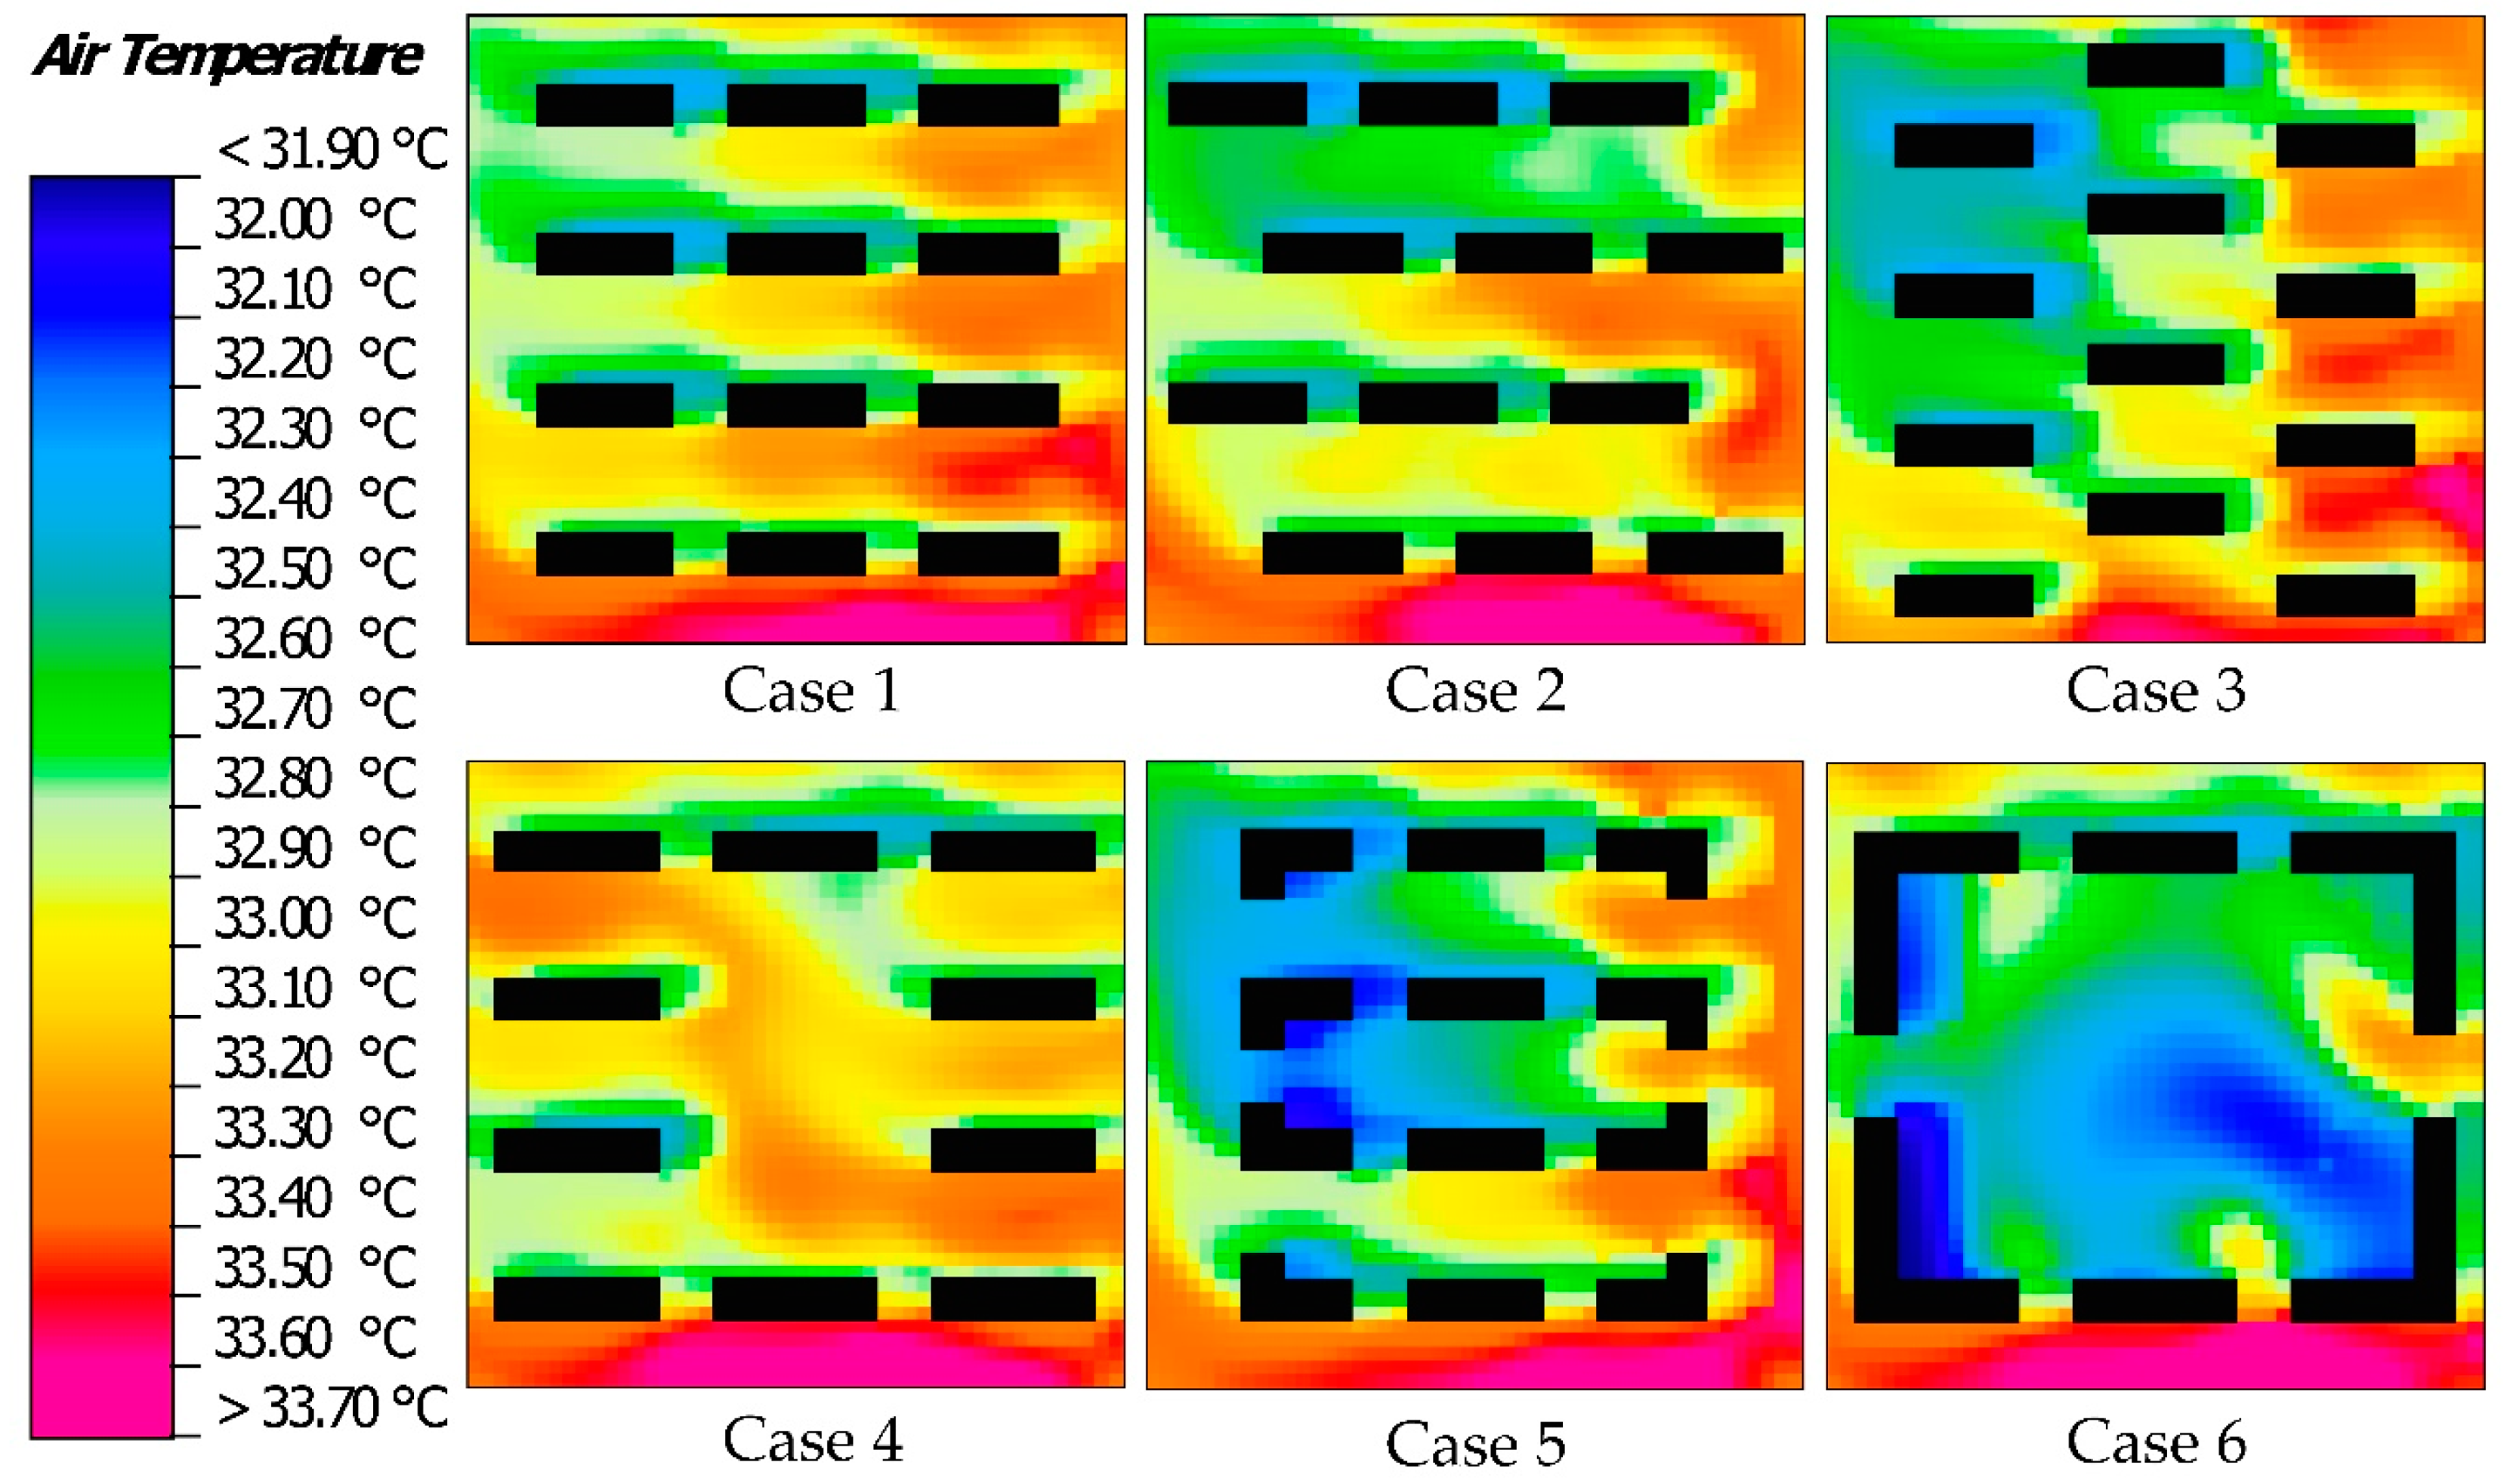
Table 4 shows the thermal spatial differences in relative frequencies of the area, occupied according to air temperature classifications. The low temperature areas of Case 5 and Case 6 were significantly larger than that of the parallel type layout, accounting for 27.26% and 42% respectively. In the parallel type layout, the low temperature area of Case 3 was the largest (5.38%) and Case 4 was the smallest (1.46%). For the medium temperature area, the parallel layout was above 55% and the enclosed layout was above 40%. For the high temperature area, the areas of Case 4 and Case 1 were the largest, above 40%, Case 2, Case 3 and Case 5 were about 30%, and Case 6 was the smallest, at 17.64%. The air temperature spatial distribution is related to wind direction and solar radiation. Figure 8 illustrates the spatial distribution of air temperature at the pedestrian level. The northern sides of buildings had lower temperature compared to the southern sides, due to shading. In Case 1, the northwestern air temperature was approximately 1 ℃ lower than the southeast because windward buildings in the southeast blocked high-temperature airflow. However, the high-temperature airflow moved relatively unimpeded through the domain in Case 4, increasing the overall temperature and ensuring a uniform spatial distribution. Low temperatures in Case 2 were mainly distributed in the north, and to the east for Case 3, and attributed to the wind speed distribution. The temperature in the northwest of Case 5 was approximately 0.4 ℃ lower compared to Cases 2 and 3, due to the L-shaped buildings blocking high-temperature airflow. Similarly, windward buildings blocked the airflow in Case 6, resulting in a low air temperature in the southeast. Temperature differences in this case were as high as 1.8 ℃.
3.3. Thermal Comfort Characteristics
Figure 9 shows the mean and standard deviation of UTCI. In terms of UTCI average value, the overall average value of the enclosed type layout is better than the parallel type layout. In the parallel type layout, Case 3 performed the best in terms of thermal comfort and Case 4 performed the worst. The standard deviation is about 2 ℃, and the enclosed type is as high as 2.2 ℃, which indicated that the temperature distribution of UTCI was uneven, especially in the enclosed type layout.
Figure 10 illustrates the spatial distribution of pedestrian level UTCI at 15:00. Generally, UTCI was the lowest in the shaded areas on the northeastern side of buildings; however, these regions still experienced strong heat stress (below 37 ℃). The maximum temperature difference in all cases was approximately 8 ℃. Furthermore, UTCI values were much higher than the air temperatures, indicating very strong heat stress under the influence of solar radiation, although the air temperature was not very high. The maximum UTCI occurred on the east side of the model domain due to wind shading effects and relatively high air temperatures. However, buildings at this location also produced the corner effect, resulting in a UTCI decrease of approximately 1 ℃ relative to the surrounding area. Case 4 had better ventilation conditions, hence the spatial distribution of UTCI was more uniform than other cases. Although the central open space in Case 6 was directly exposed to solar radiation without any shelter, the UTCI here was lower than the surrounding area. We attributed this UTCI change to high wind speeds and relatively low air temperatures in the central space. The L-shaped building in Case 5 produced more shadow area, lowering the average UTCI. However, this layout resulted in a relatively more severe internal thermal environment, especially between the second and third building rows.
3.4. Diurnal Variation Characteristics of Thermal Comfort
Figure 11 shows the UTCI variance of the six cases between 09:00 and 17:00 h. UTCI peaked at 15:00 h (at 14:00 for Case 5) and declined rapidly after 16:00. From 9:00–17:00, UTCI ranged from 38 to 43 ℃ for the different cases, and all cases suffered from very strong heat stress. There was no significant difference in UTCI between cases from 11:00–13:00; however, the difference reached approximately 0.4 ℃ at 15:00, and was the largest at 09:00 and after 16:00, exceeding 0.6 ℃. With the exception of 11:00–13:00, Cases 5 and 6 had the lowest UTCI, followed by Case 3. After 17:00, Case 3 had the lowest UTCI.
Figure 12 shows the relative frequencies of the area occupied by different UTCI thermal stress categories at 9:00, 12:00, 15:00 and 17:00 h. The relative frequency of strong thermal stress and moderate thermal stress in the enclosed type layout of Case 5 at 9:00 was as high as 52.2% and, in Case 6, 92.7%. This stress level was significantly higher than that of the parallel type layout. In the parallel type layout, the very strong thermal stress of Case 3 was the lowest, at 71.1%, while that of Case 1 was the highest, at 80.5%. At 12:00 h, the coverage area of very strong thermal stress in all Cases is more than 95%, and the difference between cases was very small. At 15:00 h, the site suffered strong thermal stress and very strong thermal stress, in which the very strong thermal stress was > 80% in the enclosed type layout and > 90% in the parallel type layout. The difference between cases was smaller than that at 9:00 h. At 17:00 h, the relative frequencies of very strong thermal stress in the enclosed type layout decreased, compared with at 15:00 h. The relative frequencies of strong thermal stress increased, and moderate thermal stress appeared in the enclosed type layout. Case 3 had the best thermal comfort condition, with 37.8% of strong thermal stress. The enclosed layout of Case 5 and Case 6, with a sum of strong thermal stress and moderate thermal stress of 35.7% and 34.5% respectively, had more severe thermal stresses than parallel layouts except for Case 3. The thermal comfort of Case 4 was the worst, where the very strong thermal strong was as high as 76.0%.
4. Discussion
4.1. Effects of Building Layout on Microclimate
Our findings confirm the prior findings that the wind corridor formed by the parallel type layouts is beneficial to air flow, creating a good wind environment at pedestrian level [32]. Open spaces in residential areas are also conducive to air flow. The staggered arrangement, in accordance with the prevailing wind direction, would facilitate airflow into the ventilation corridor, increasing the wind speed by approximately 0.4 m/s. Air flow is encouraged in high temperature and high humidity regions because of its effect on reducing thermal stress. Conversely, increased airflow in cold regions will lead to discomfort; hence, building layouts should aim to avoid such situations [22,33]. Notwithstanding, the windward buildings produce a large area of wind shadow area, increasing thermal stress. These buildings also block high-temperature airflow in the midafternoon, reducing the overall air temperature; a finding that is consistent with the previous study in semi-arid regions [24]. The blocking of high-temperature airflow by parallel type building layouts reduced the temperature by approximately 1 ℃, and enclosed type building layouts reduced temperatures by up to 1.4 ℃. However, from the perspective of UTCI, the cooling effect of windward buildings on high-temperature airflow was weaker than the warming effect caused by wind shadow. Furthermore, the main reason for the great difference in thermal comfort in the site is that UTCI is most affected by solar radiation and building shadow can effectively improve thermal comfort [34,35,36]. For most of the day, the L-shaped buildings in the enclosed type building layout provided relatively more shading during summer. On the whole, the microclimate performance of the enclosed type layout was better than that of the parallel type layout, but the north–south staggered layout also performed well sometimes.
4.2. Building Layout Optimization Strategy
Due to the extreme summer climate of Wuhan, passive residential design is insufficient to ensure outdoor thermal comfort. However, we present some strategies to extend the time available for outdoor activities and improve the frequency of use of outdoor spaces. For example, it is difficult for airflow to reach the back building row in an east–west staggered building layout. Airflow usually enters from the side; hence, utilizing the narrow pipe effect and building arrangements to form a ventilation corridor, while avoiding structures that shield the ventilation corridor, should be a focal point. Residential areas with a north–south staggered layout commonly experience a poor wind environment due to the sheltering effect of the middle row of buildings. Therefore, it is necessary to conduct a wind environment analysis for this layout during residential area planning to strictly control building width and spacing. For building layouts with open spaces in the center, the internal thermal environment should be considered. For example, barriers should be minimized to enhance air flow and methods of mitigating thermal stresses caused by solar radiation should be considered, including landscaping, alternate building and ground materials, and other technologies. Although layouts comprised of L-shaped buildings provided more shade, they also limit airflow; hence, it is necessary to carefully manage ventilation on the sides of these buildings. This could be achieved by shortening the side length of L-shaped buildings, increasing the longitudinal distance of the building or improving the ventilation on the bottom layer of the building. In addition to the wind and thermal environment, other microclimate factors, such as air quality, should also be considered in the building layout. Excessive wind speed needs to be vigilantly monitored, especially for buildings close to the street, which may cause secondary dust.
4.3. Further Study
Residential areas are frequently characterized by mixed building layouts; however, we only considered parallel and enclosed building layouts in this study. Furthermore, the difference in climatic conditions in different seasons may produce different results, and vegetation and waterbodies in residential areas can also impact the outdoor microclimate and this paper did not consider the impact of these factors. Subsequent research will focus on incorporating vegetation and waterbodies into the numerical model and simulating diverse building layouts in different seasons.
5. Conclusions
We used ENVI-met to simulate the wind and thermal characteristics of six typical residential building layouts in Wuhan, China. Our results showed that parallel building layouts formed a ventilation corridor which was conducive to airflow. Staggered building layouts can enhance the narrow pipe effect in the ventilation corridor; however, improper staggered layouts may also block airflow. Although windward buildings block high-temperature airflows, this cooling effect was weaker than the warming effects of the wind shadow and direct sunlight. The enclosed building layouts also obstructed air circulation; however, they provided more shade which improved the thermal environment. On the whole, the microclimate performance of the enclosed type layout was better than that of the parallel type layout, and the north–south staggered layout also performed well sometimes. Based on the results, we proposed strategies to enhance the layout of residential areas. In residential area planning, the length, spacing and shape of the building should be reasonably allocated. By properly staggering the building, creating open space and constructing ventilation corridor, wind speed amplification using narrow pipe and corner effects can be skillfully employed to improve the wind and thermal environment.
Author Contributions
Conceptualization, C.W.; methodology, Y.J. and C.W.; software, Y.J.; validation, C.W., Y.J. and M.T.; formal analysis, Y.J.; investigation, Y.J.; writing—original draft preparation, Y.J.; writing—review and editing, C.W. and M.T.; funding acquisition, C.W. All authors have read and agreed to the published version of the manuscript.
Funding
This research was funded by National Natural Science Foundation of China, grant number 31670705 & 31770748; Fundamental Research Funds for the Central Universities, grant number 2662017JC037; State Key Laboratory of Subtropical Building Science, grant number 2017ZB06.
Conflicts of Interest
The authors declare no conflict of interest.
References
- Yang, Y.; Zhang, X.; Lu, X.; Hu, J.; Pan, X.; Zhu, Q.; Su, W. Effects of Building Design Elements on Residential Thermal Environment. Sustainability 2017, 10, 57. [Google Scholar] [CrossRef] [Green Version]
- Gao, Y.; Yao, R.; Li, B.; Turkbeyler, E.; Luo, Q.; Short, A. Field studies on the effect of built forms on urban wind environments. Renew. Energ. 2012, 46, 148–154. [Google Scholar] [CrossRef]
- Zhao, Q.; Sailor, D.J.; Wentz, E.A. Impact of tree locations and arrangements on outdoor microclimates and human thermal comfort in an urban residential environment. Urban For. Urban Green. 2018, 32, 81–91. [Google Scholar]
- Chan, A.L.S. Effect of adjacent shading on the thermal performance of residential buildings in a subtropical region. Appl. Energ. 2012, 92, 516–522. [Google Scholar] [CrossRef]
- Akbari, H.; Taha, H. The impact of trees and white surfaces on residential heating and cooling energy use in four Canadian cities. Energy 1992, 17, 141–149. [Google Scholar] [CrossRef]
- Yang, F.; Lau, S.S.Y.; Qian, F. Urban design to lower summertime outdoor temperatures: An empirical study on high-rise housing in Shanghai. Build. Environ. 2011, 46, 769–785. [Google Scholar] [CrossRef]
- Hong, B.; Lin, B. Numerical studies of the outdoor wind environment and thermal comfort at pedestrian level in housing blocks with different building layout patterns and trees arrangement. Renew. Energ. 2015, 73, 18–27. [Google Scholar] [CrossRef]
- Berkovic, S.; Yezioro, A.; Bitan, A. Study of thermal comfort in courtyards in a hot arid climate. Sol. Energ. 2012, 86, 1173–1186. [Google Scholar] [CrossRef]
- Chen, Z.H.; Wang, H.J.; Ren, G. Asymmetrical Change of Urban Heat Island Intensity in Wuhan, China. Adv. Clim. Chang. Res. 2007, 3, 282–286. [Google Scholar]
- Pan, J.; Zhao, X.; Chen, Z.; Wang, J. Provincial Climate Change Program: Hubei Case Study and Its Policy Implications. Adv. Climate Chang. Res. 2008, 4, 309–314. [Google Scholar]
- The Second C40 Urban Sustainable Development forum Held in Wuhan. Available online: http://www.hubei.gov.cn/xxbs/bmbs/sfgw1/201709/t20170925_1067458.shtml (accessed on 25 September 2017).
- Wuhan Peak Carbon Emissions Action Plan (2017–2022); Wuhan Municipal People’s Government: Wuhan, China, 2018.
- Yu, J.; Yang, C.; Tian, L. Low-energy envelope design of residential building in hot summer and cold winter zone in China. Energ. Build. 2008, 40, 1536–1546. [Google Scholar] [CrossRef]
- He, Y. Climatic Characteristics, Causes and Prediction of Mid-Summer High-Temperature in Wuhan. Meteorol. Sci. Tech. 2007, 35, 809–813. [Google Scholar]
- Yang, H.Q.; Chen, Z.H.; Xie, S.; Dian-Xiu, Y.E.; Gong, J. Quantitative assessment of impact of extreme high temperature in summer on excess mortality in Wuhan. J. Meteorol. Environ. 2013, 29, 140–143. [Google Scholar]
- Yuan, C.; Ren, C.; Ng, E. GIS-based surface roughness evaluation in the urban planning system to improve the wind environment – A study in Wuhan, China. Urban Clim. 2014, 10, 585–593. [Google Scholar] [CrossRef]
- Yu-qing, Y.I.; Teng-fei, L.; Wei-li, J.; Jian-wei, P.; Hui-chan, L.I.U.; Sai-guang, L. Characteristics and Evolution of the Summer Heat Island Effect in Wuhan City Group. Resour. Environ. Yangtze Basin 2015, 24, 1279–1285. [Google Scholar]
- Wuhan Municipal Bureau of Statistics. Wuhan Statistical Yearbook; China Statistics Press: Beijing, China, 2006–2018.
- Yu-jing, W. Study on Applicability of CFD Method in Wind Circumstance Simulation of Urban Space in Beijing. Master’s Thesis, Tsinghua University, Beijing, China, 2012. [Google Scholar]
- You, W.; Gao, Z.; Chen, Z.; Ding, W. Improving residential wind environments by understanding the relationship between building arrangements and outdoor regional ventilation. Atmosphere 2017, 8, 102. [Google Scholar] [CrossRef] [Green Version]
- Bruse, M.; Fleer, H. Simulating surface–plant–air interactions inside urban environments with a three dimensional numerical model. Environ. Model. Software 1998, 13, 373–384. [Google Scholar] [CrossRef]
- Jin, H.; Liu, Z.; Jin, Y.; Kang, J.; Liu, J. The Effects of Residential Area Building Layout on Outdoor Wind Environment at the Pedestrian Level in Severe Cold Regions of China. Sustainability 2017, 9, 2310. [Google Scholar] [CrossRef] [Green Version]
- Ketterer, C.; Matzarakis, A. Human-biometeorological assessment of heat stress reduction by replanning measures in Stuttgart, Germany. Landsc. Urban Plann. 2014, 122, 78–88. [Google Scholar] [CrossRef]
- Middel, A.; Häb, K.; Brazel, A.J.; Martin, C.A.; Guhathakurta, S. Impact of urban form and design on mid-afternoon microclimate in Phoenix Local Climate Zones. Landsc. Urban Plann. 2014, 122, 16–28. [Google Scholar] [CrossRef]
- Zhang, L.; Zhan, Q.; Lan, Y. Effects of the tree distribution and species on outdoor environment conditions in a hot summer and cold winter zone: A case study in Wuhan residential quarters. Build. Environ. 2018, 130, 27–39. [Google Scholar] [CrossRef]
- Kong, F.; Sun, C.; Liu, F.; Yin, H.; Jiang, F.; Pu, Y.; Cavan, G.; Skelhorn, C.; Middel, A.; Dronova, I. Energy saving potential of fragmented green spaces due to their temperature regulating ecosystem services in the summer. Appl. Energ. 2016, 183, 1428–1440. [Google Scholar] [CrossRef]
- Chen, L.; Ng, E. Simulation of the effect of downtown greenery on thermal comfort in subtropical climate using PET index: A case study in Hong Kong. Architect. Sci. Review 2013, 56, 297–305. [Google Scholar] [CrossRef]
- Bailey, B.H.; McDonald, S.L.; Bernadett, D.W.; Markus, M.J.; Elsholz, K.V. Wind Resource Assessment Handbook: Fundamentals for Conducting a Successful Monitoring Program; AWS Scientific: New York, NY, USA, 1997. [Google Scholar]
- Broede, P.; Blazejczyk, K.; Fiala, D.; Havenith, G.; Holmer, I.; Jendritzky, G.; Kuklane, K.; Kampmann, B. The Universal Thermal Climate Index UTCI Compared to Ergonomics Standards for Assessing the Thermal Environment. Ind. Health 2013, 51, 16–24. [Google Scholar] [CrossRef] [Green Version]
- Blazejczyk, K.; Epstein, Y.; Jendritzky, G.; Staiger, H.; Tinz, B. Comparison of UTCI to selected thermal indices. I. J. Biometeorol. 2012, 56, 515–535. [Google Scholar] [CrossRef] [Green Version]
- Yuan, C.; Ng, E. Building porosity for better urban ventilation in high-density cities – A computational parametric study. Build. Environ. 2012, 50, 176–189. [Google Scholar] [CrossRef]
- Moonen, P.; Dorer, V.; Carmeliet, J. Evaluation of the ventilation potential of courtyards and urban street canyons using RANS and LES. J.Wind Eng. Ind. Aerodyn. 2011, 99, 414–423. [Google Scholar] [CrossRef]
- Lu, M.; Hou, T.; Fu, J.; Wei, Y. The Effects of Microclimate Parameters on Outdoor Thermal Sensation in Severe Cold Cities. Sustainability 2019, 11, 1572. [Google Scholar] [CrossRef] [Green Version]
- Zheng, Y.; Yin, J.; Wu, R.; Ye, D. Applicability of Universal Thermal Climate Index to Thermal Comfort Forecast. J. Appl. Meteorol. Sci. 2010, 21, 709–715. [Google Scholar]
- Park, S.; Tuller, S.E.; Jo, M. Application of Universal Thermal Climate Index (UTCI) for microclimatic analysis in urban thermal environments. Landsc. Urban Plann. 2014, 125, 146–155. [Google Scholar] [CrossRef]
- Bröde, P.; Krüger, E.; Rossi, F.; Fiala, D. Predicting urban outdoor thermal comfort by the Universal Thermal Climate Index UTCI-a case study in Southern Brazil. I. J. Biometeorol. 2011, 56, 471–480. [Google Scholar] [CrossRef] [PubMed]
Figure 1.
Total floor space of residential building completed in Wuhan from 2005 to 2017. Source [18].
Figure 1.
Total floor space of residential building completed in Wuhan from 2005 to 2017. Source [18].

Figure 2.
Construction of the simulation: (a) residential building model schematic and (b) six typical residential building layout cases in Wuhan; (1) aligned parallel layout, (2) east–west staggered layout, (3) north–south staggered layout, (4) parallel layout with central open space, (5) enclosed layout, and (6) enclosed layout with central open space.

Figure 3.
ENVI-met model architecture.

Figure 4.
Flow chart describing the methodology for assessing simulation results.
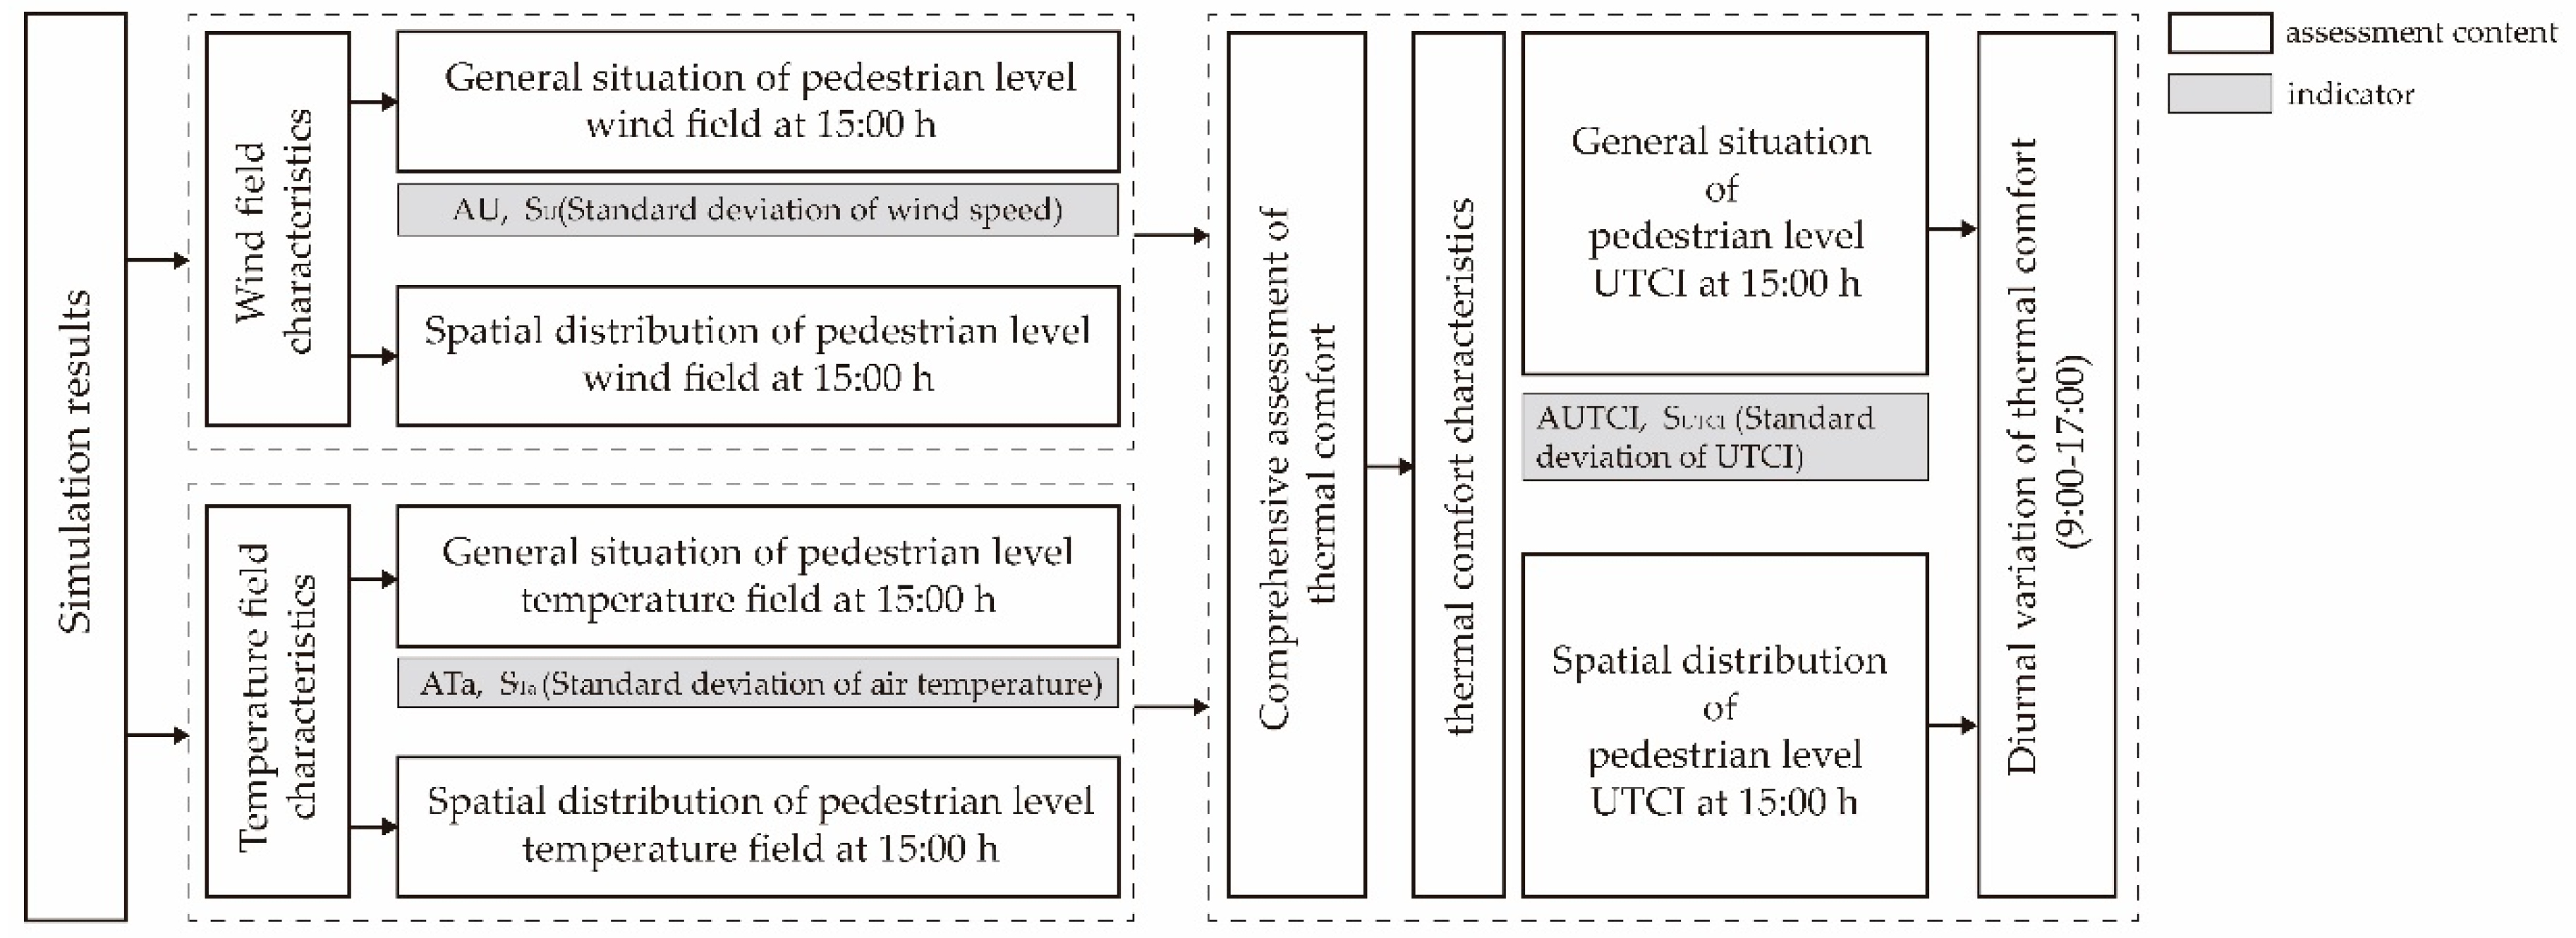
Figure 5.
Mean (black squares) and standard deviation (bars) of pedestrian level (1.5 m) wind speed at 15:00 h.
Figure 5.
Mean (black squares) and standard deviation (bars) of pedestrian level (1.5 m) wind speed at 15:00 h.
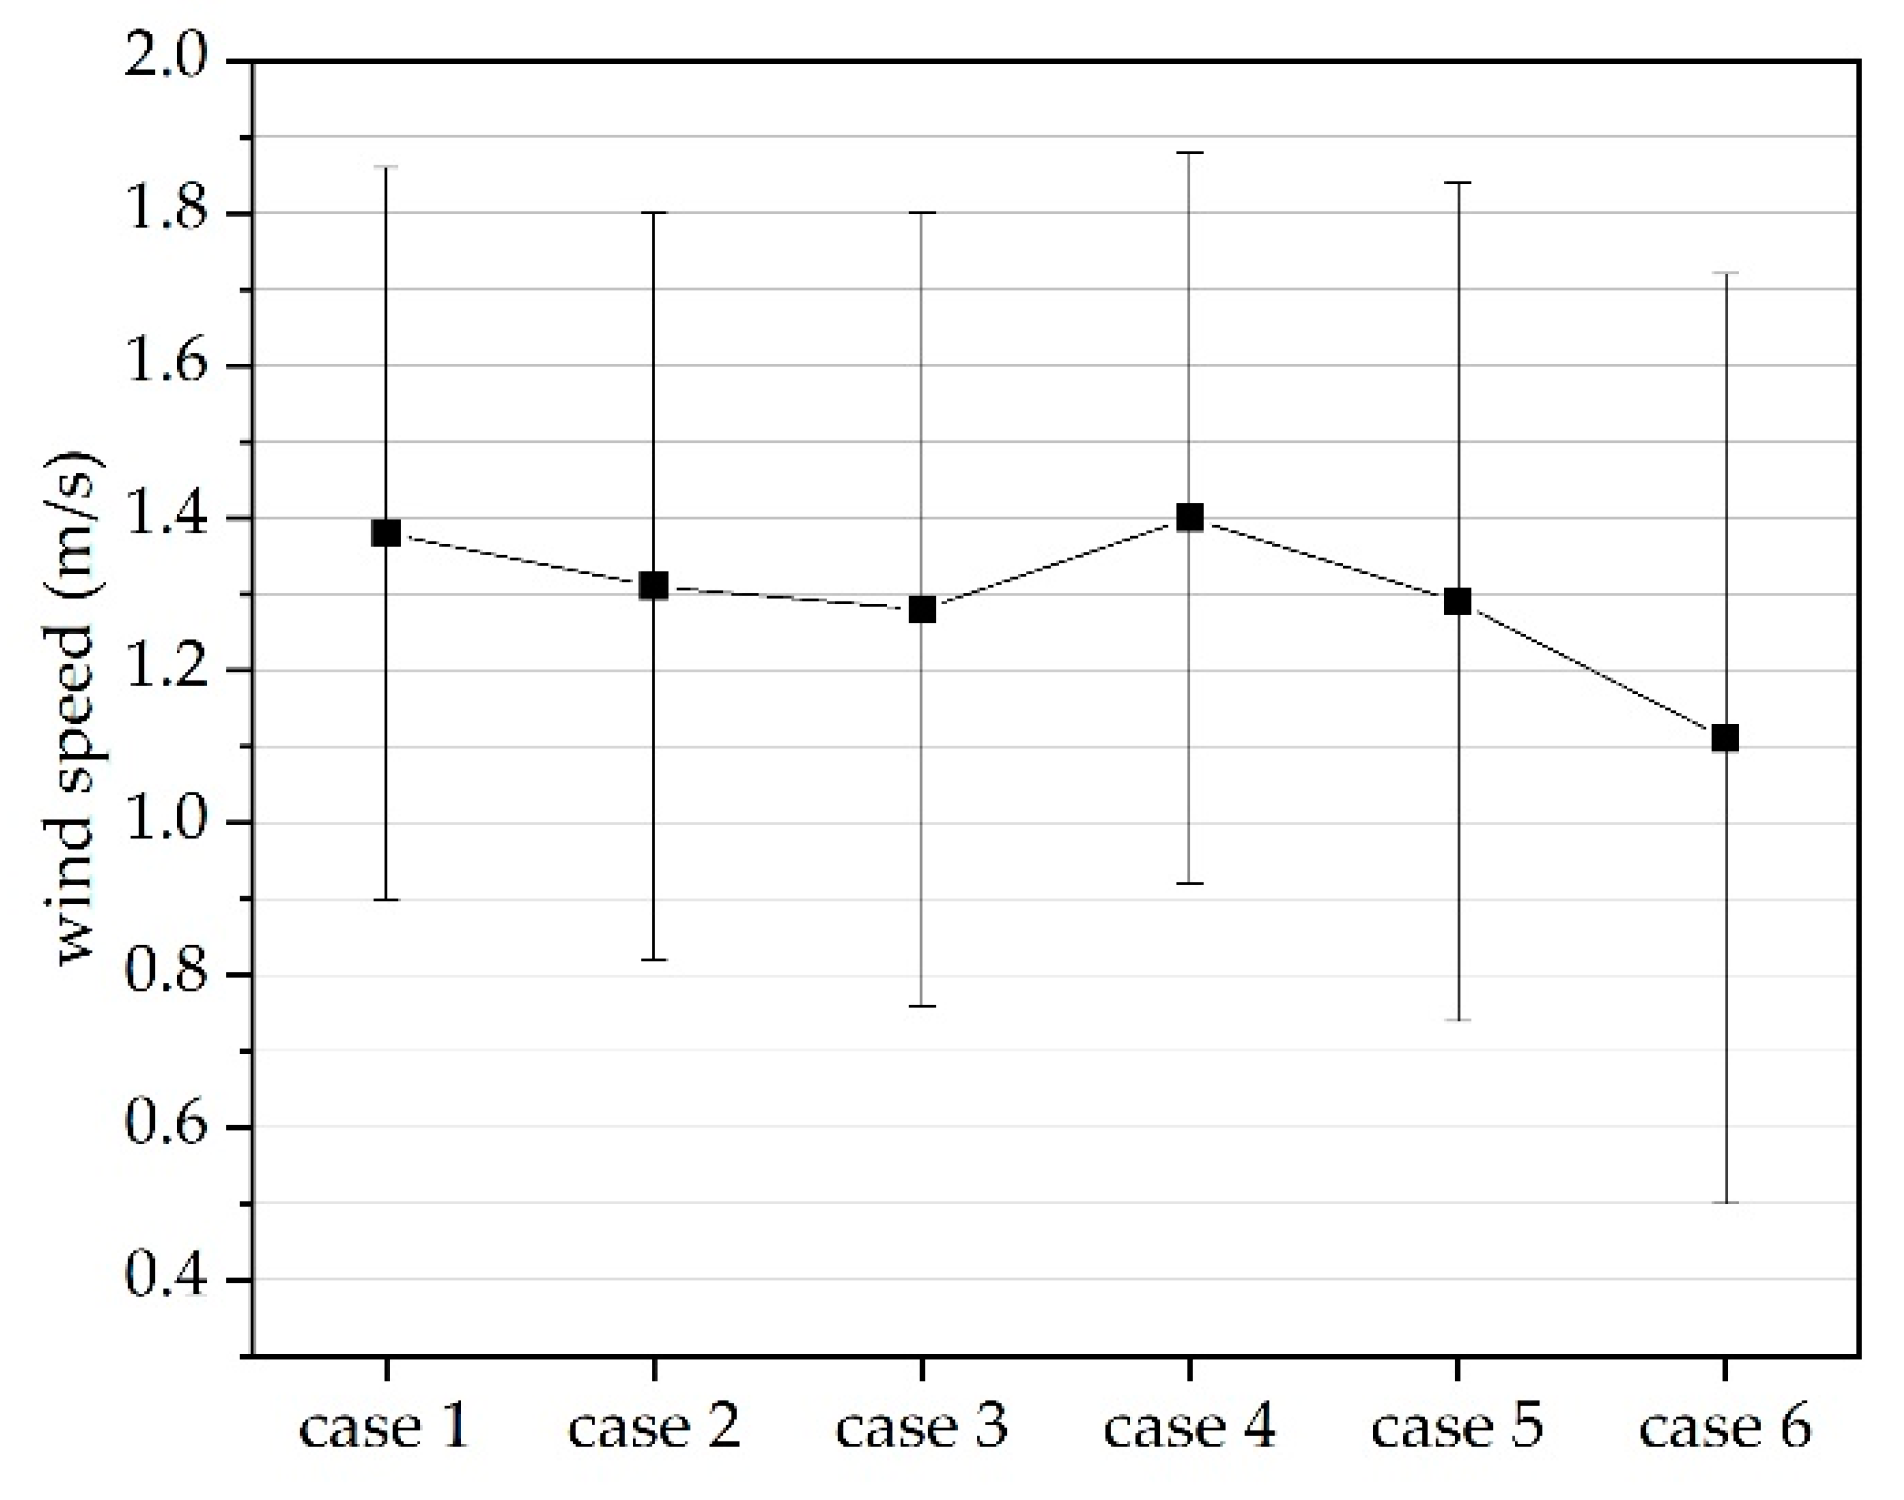
Figure 6.
Spatial distribution of pedestrian level wind speed at 15:00 h.

Figure 7.
Mean (black squares) and standard deviation (bars) of pedestrian level (1.5 m) air temperature at 15:00 h.
Figure 7.
Mean (black squares) and standard deviation (bars) of pedestrian level (1.5 m) air temperature at 15:00 h.

Figure 8.
Spatial distribution of pedestrian level air temperature at 15:00 h.

Figure 9.
Mean (black squares) and standard deviation (bars) of pedestrian level (1.5 m) UTCI at 15:00 h.
Figure 9.
Mean (black squares) and standard deviation (bars) of pedestrian level (1.5 m) UTCI at 15:00 h.

Figure 10.
Spatial distribution of pedestrian level Universal Thermal Climate Index (UTCI) at 15:00 h.
Figure 10.
Spatial distribution of pedestrian level Universal Thermal Climate Index (UTCI) at 15:00 h.
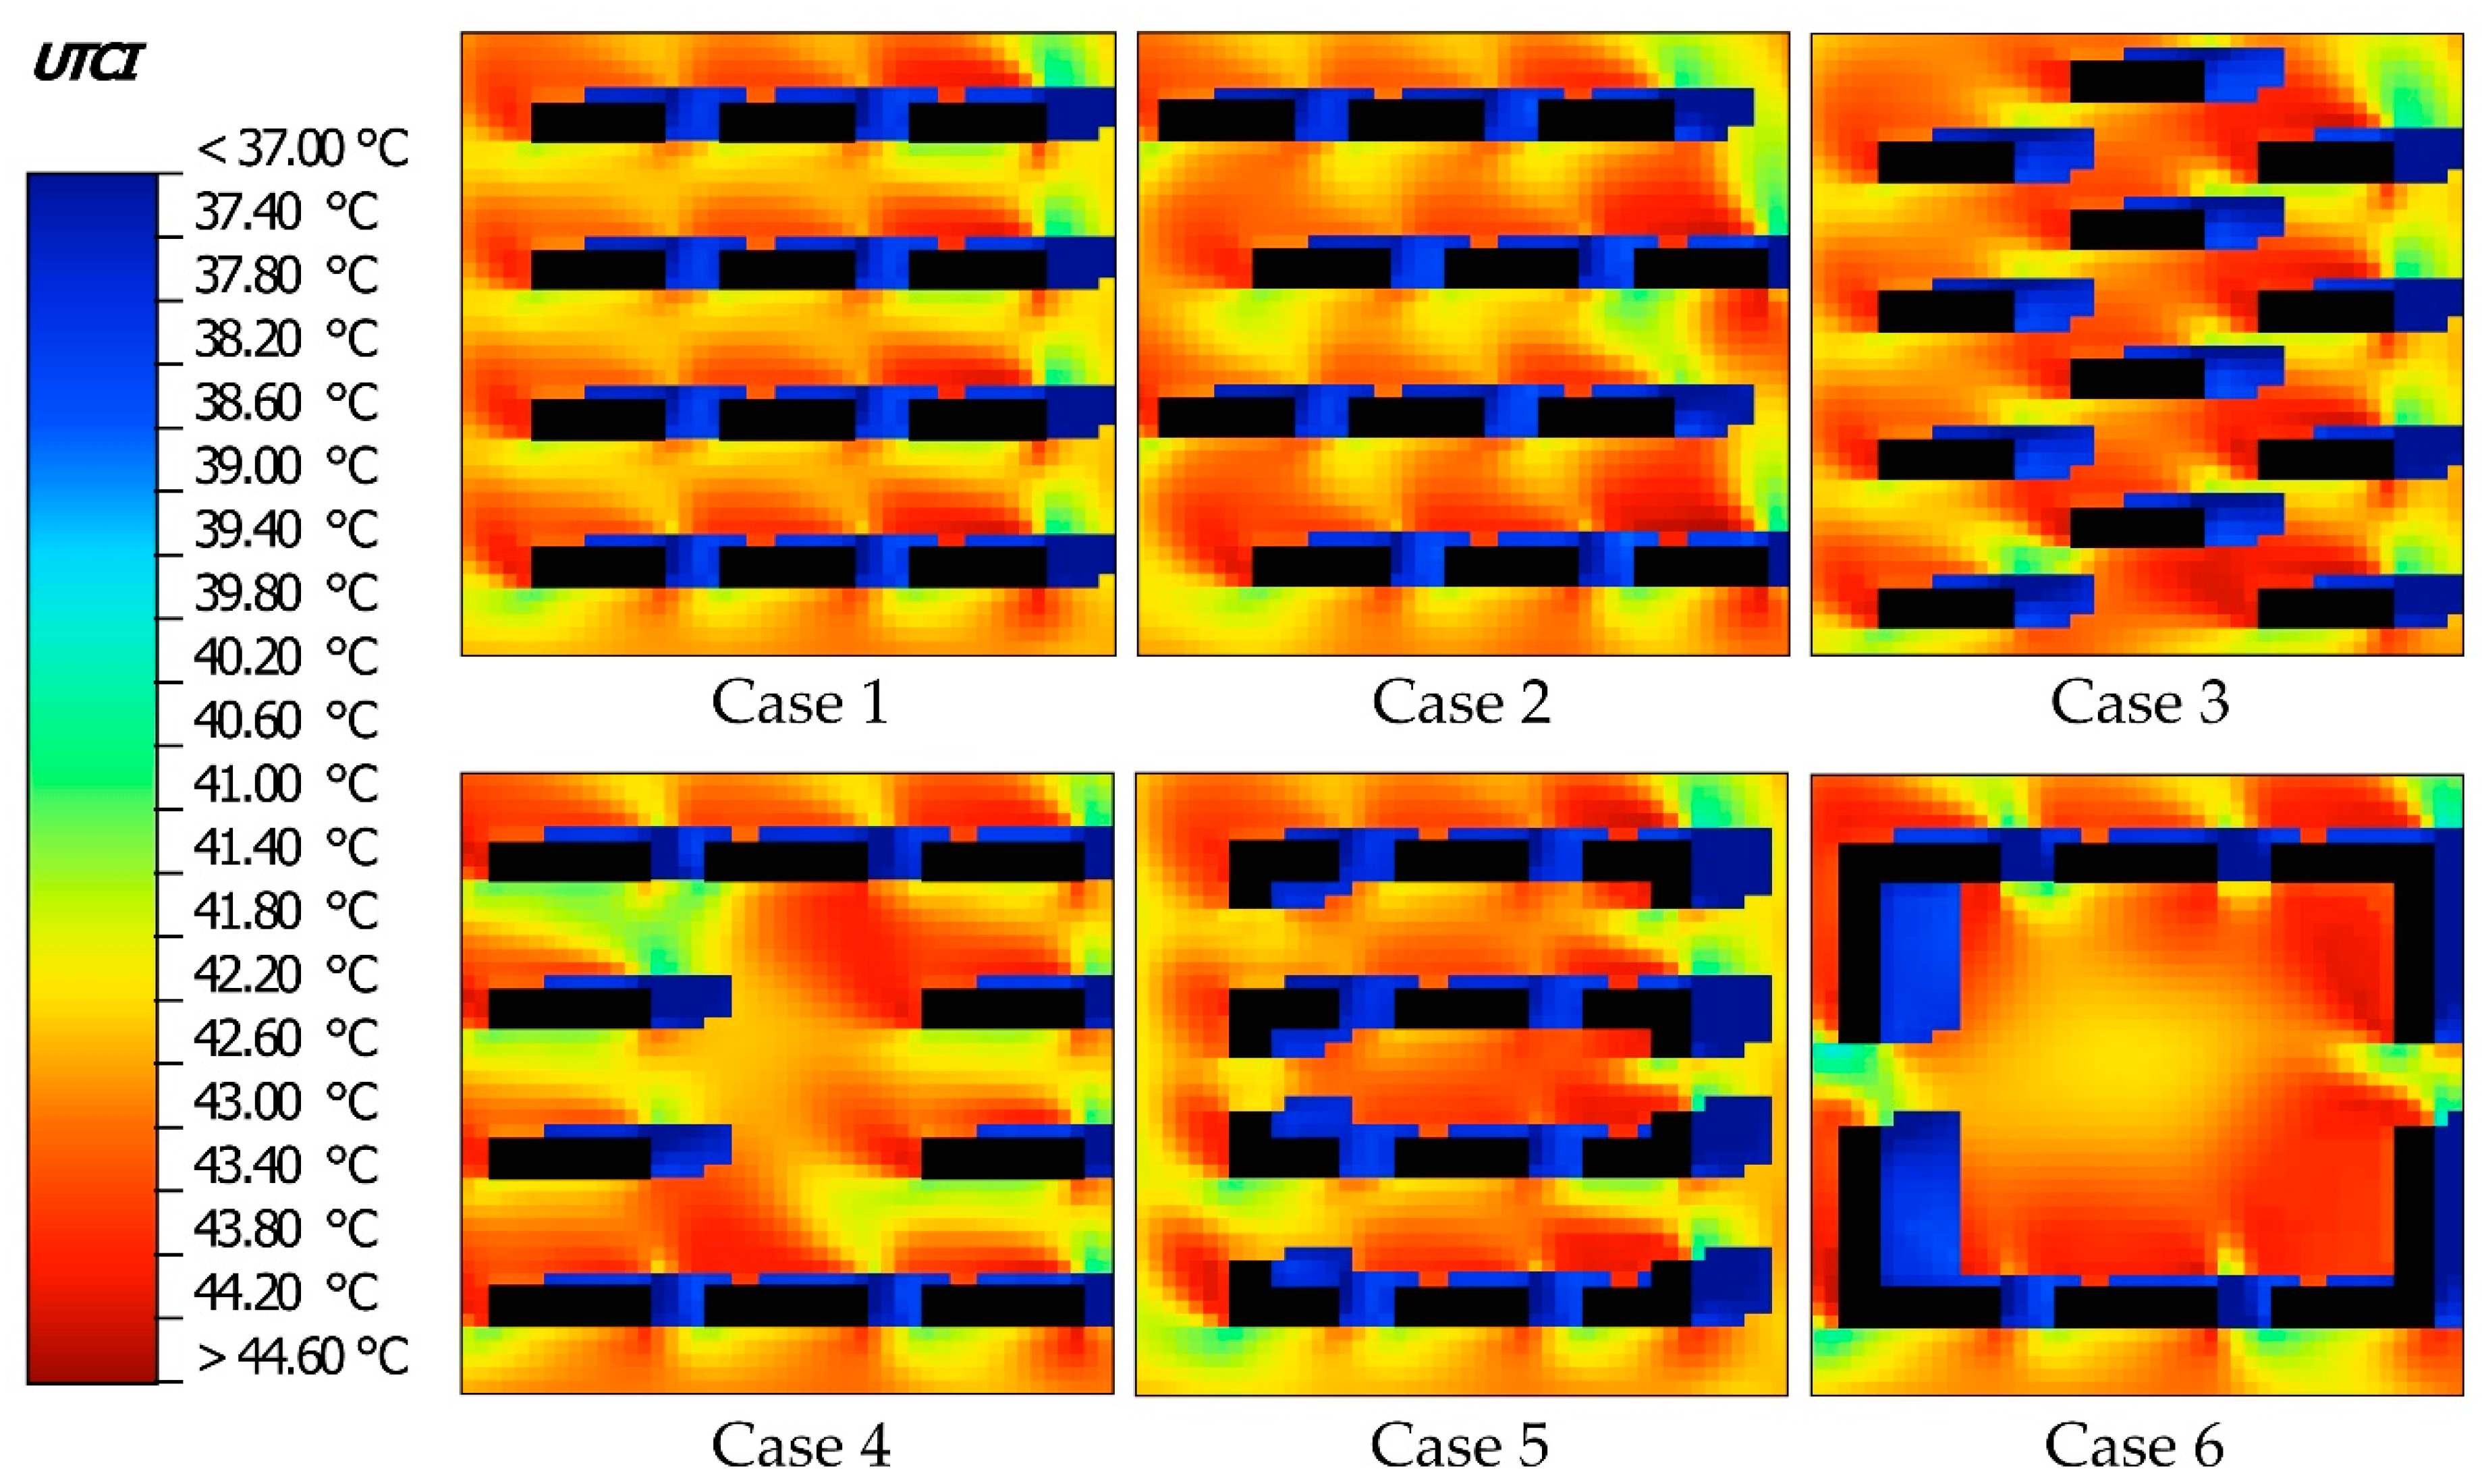
Figure 11.
Diurnal variation of pedestrian level Universal Thermal Climate Index (UTCI).

Figure 12.
The relative frequencies of the area occupied by different UTCI thermal stress categories in the site at 9:00 h (a), 12:00 h (b), 15:00 h (c) and 17:00 h (d). Thermal stress category is described in Table 2.
Figure 12.
The relative frequencies of the area occupied by different UTCI thermal stress categories in the site at 9:00 h (a), 12:00 h (b), 15:00 h (c) and 17:00 h (d). Thermal stress category is described in Table 2.


Table 1.
Configuration data used in the ENVI-met simulation.
| Model domain | Size of grid cells (∆x, ∆y, ∆z) | 4, 4, 3 (0.6 for the bottom grid) |
| Number of grid cells (∆x, ∆y, ∆z) | 179, 179, 29 | |
| Timing | Start simulation at day (DD.MM.YYYY) | 21.07.2018 |
| Start simulation at time (HH:MM:SS) | 06:00:00 | |
| Total simulation at time (h) | 42 | |
| LBC types | LBC for T and q | Forced |
| LBC for TKE | Forced | |
| Meteorological data | Wind speed measured at 10 m (m/s) | 2.2 |
| Wind direction | 135° (southeast) | |
| Roughness length at measurement site | 0.1 | |
| Initial temperature of atmosphere (K) | 301.51 | |
| Specific humidity at model top (2500 m, g/kg) | 7 | |
| Relative humidity in 2 m height (%) | 88 |
Table 2.
Universal Thermal Climate Index (UTCI) thermal stress category and its corresponding equivalent temperature. Source [29].
Table 2.
Universal Thermal Climate Index (UTCI) thermal stress category and its corresponding equivalent temperature. Source [29].
| UTCI (℃) Range | Stress Category |
|---|---|
| Above +46 | Extreme heat stress |
| +38 to +46 | Very strong heat stress |
| +32 to +38 | Strong heat stress |
| +26 to +32 | Moderate heat stress |
| +9 to +26 | No thermal stress |
| +9 to 0 | Slight clod stress |
| 0 to −13 | Moderate clod stress |
| −13 to −27 | Strong clod stress |
| −27 to −40 | Very strong clod stress |
| Below −40 | Extreme clod stress |
Table 3.
Summary of the relative frequencies of the area occupied by different wind speed classifications in the site at pedestrian level at 15:00 h.
Table 3.
Summary of the relative frequencies of the area occupied by different wind speed classifications in the site at pedestrian level at 15:00 h.
| Wind Speed Characteristics | Wind Speed (m/s) | Relative Frequency (%) | |||||
|---|---|---|---|---|---|---|---|
| Case 1 | Case 2 | Case 3 | Case 4 | Case 5 | Case 6 | ||
| Stagnant | u < 0.3 | 2.65 | 2.71 | 3.46 | 1.35 | 4.27 | 11.04 |
| Poor | 0.6 > u ≥ 0.3 | 3.73 | 4.71 | 6.01 | 5.41 | 6.44 | 13.15 |
| Low | 1.0 > u ≥ 0.6 | 16.77 | 18.89 | 21.05 | 14.94 | 20.51 | 16.94 |
| Satisfactory | 1.3 > u ≥ 1.0 | 14.94 | 23.05 | 22.40 | 15.10 | 19.59 | 22.29 |
| Good | u ≥ 1.3 | 61.90 | 50.65 | 47.08 | 63.20 | 49.19 | 36.58 |
Table 4.
Summary of relative frequencies of the area occupied by different air temperature classifications in the site at pedestrian level at 15:00 h.
Table 4.
Summary of relative frequencies of the area occupied by different air temperature classifications in the site at pedestrian level at 15:00 h.
| Air Temperature Characteristics | Air Temperature (℃) | Relative Frequency (%) | |||||
|---|---|---|---|---|---|---|---|
| Case 1 | Case 2 | Case 3 | Case 4 | Case 5 | Case 6 | ||
| High temperature area | Ta ≥ 33 | 40.02 | 31.22 | 29.25 | 40.50 | 31.87 | 17.64 |
| Medium temperature area | 33 > Ta ≥ 32.5 | 57.81 | 62.12 | 55.36 | 58.04 | 40.87 | 40.35 |
| Low temperature area | Ta < 32.5 | 3.75 | 6.66 | 15.38 | 1.46 | 27.26 | 42.00 |
© 2020 by the authors. Licensee MDPI, Basel, Switzerland. This article is an open access article distributed under the terms and conditions of the Creative Commons Attribution (CC BY) license (http://creativecommons.org/licenses/by/4.0/).
Share and Cite
MDPI and ACS Style
Jiang, Y.; Wu, C.; Teng, M. Impact of Residential Building Layouts on Microclimate in a High Temperature and High Humidity Region. Sustainability 2020, 12, 1046. https://doi.org/10.3390/su12031046
AMA Style
Jiang Y, Wu C, Teng M. Impact of Residential Building Layouts on Microclimate in a High Temperature and High Humidity Region. Sustainability. 2020; 12(3):1046. https://doi.org/10.3390/su12031046
Chicago/Turabian StyleJiang, Yingjie, Changguang Wu, and Mingjun Teng. 2020. "Impact of Residential Building Layouts on Microclimate in a High Temperature and High Humidity Region" Sustainability 12, no. 3: 1046. https://doi.org/10.3390/su12031046
Note that from the first issue of 2016, this journal uses article numbers instead of page numbers. See further details here.