Flood Resilient and Sustainable Urban Regeneration Using the Example of an Industrial Compound Conversion in Seoul, South Korea


Department of Architecture, Sungkyunkwan University, Suwon 440-746, Korea
*
Author to whom correspondence should be addressed.
Sustainability 2020, 12(3), 918; https://doi.org/10.3390/su12030918
Submission received: 11 December 2019
/
Revised: 31 December 2019
/
Accepted: 20 January 2020
/
Published: 27 January 2020
(This article belongs to the Collection Adaptive Cities: Urban Planning and Design Contribution for Achieving Climate Resilient Cities)
Abstract
:The objective of this study was to illustrate the urban flood resilience and sustainability improvement potential by integration of decentralized water management systems in sustainable urban regeneration projects. This paper discusses sustainable and resilient urban regeneration potentials using the example of an industrial compound (ICs) conversion in Seoul, South Korea. Urban flood vulnerability has been a concern globally due to land use changes, limited capacity of existing stormwater management infrastructures and the effects of climate change. Due to their comparably low building density, ICs can effectively contribute to the separation and decentralized retention and infiltration of stormwater. However, no sustainable and resilient conversion examples of ICs have been realized in Seoul so far. After identification of a representative IC, its exemplary sustainable conversion with implementation of decentralized water management infrastructures were designed. The rainwater collection, retention and infiltration system was dimensioned in order to create a stormwater discharge-free property. The qualitative and quantitative analysis of the improvement potentials before and after the conversion unveiled that this conversion contributes also to the improvement of the neighborhoods’ sustainability, spatial quality and resilience to disasters. The research results are transferable to other urban ICs and are a good practice example for sustainable and resilient regeneration of existing urban districts.
1. Introduction
1.1. Flooding from Stormwater Runoff and Water Sensitive Conversion Potential of Industrial Compounds in Seoul
Flooding from storm water runoff due to extreme precipitation events has been a historical problem in Seoul, South Korea [1]. Flooding caused by extreme precipitation events have been documented since the 12th century in the oldest historical document in Korea [2]. The average annual precipitation in Seoul is 1200–1600 mm and is the highest compared to other areas in the Korean area on the same latitude [3]. Most of the annual precipitation in Korea occurs in summer, during the rainy period between mid-June and early September [2,4]. In Seoul, approximately 30% of annual rainfall occurs during the rainy period [3]. Permanent seasonal rain events in Korea can last from a few days to several weeks, including extreme precipitation and severe rainstorms [2]. A severe rainstorm refers to rainfall of more than 30 mm per hour or 80 mm per day, or when approximately 10% of annual precipitation is concentrated on one day [5]. Monitoring of flooding events in Seoul during the period 1987 to 2017 identified the location of specific flood-prone areas in Seoul. Figure 1a represents a map with the location of flooded areas in the years 1987, 1990, 1998, 2001, 2010 and 2011. [1,6].
Seoul consists of 25 districts (Korean: Gu) and 424 administrational neighborhoods (Korean: Dong). Since the 1980s, eight neighborhoods in six Gus in Seoul have been flooded more than four times and are therefore classified as flood-prone areas. Flood occurs mainly in the lower areas of Seoul due to the specific mountainous topography and limited capacity of drainage systems [1,8]. In addition to the classification of existing flood-prone areas, flood vulnerable areas have also been identified in Seoul. Areas have been assigned to five classes of flood vulnerability, based on existing and potential future flooding risks, local climate, flood sensitivity and flood adaptability (Figure 1b) [7].
The existing centralized drainage infrastructures in Seoul are meant for increased drainage and retention volume capacities in mixed sewer systems, which is the major sewage system applied in Seoul [1,9]. Of the drained areas, 93.7% are equipped with mixed systems, leaving only 6.3% of the areas equipped with separate sewer systems [9]. Flood prevention systems in Seoul are mainly based on structural infrastructures, such as mixed sewage overflow retention basins, micro dams for stormwater runoff retention in streams and rainwater pumping stations in lower areas for the discharge of accumulating storm water surplus to streams [1]. However, the existing drainage and retention infrastructures are not enough to cope with flooding caused by precipitation events that are becoming increasingly extreme. Accordingly, more holistic, sustainable and resilient approaches for urban stormwater management are required. Such approaches are based on a paradigm shift in urban water management and urban planning, and focus is on the minimization of flooding risks and the creation of sustainable urban water cycles [6,10].
In this study, the water sensitive conversion potential of industrial compounds (ICs) in Seoul is discussed, with an aim of improving Seoul’s urban resilience by integrating decentralized water management systems with sustainable and resilient urban regeneration. The majority of modern ICs in Korea were built in the second half of the 20th century. ICs played an important role in the socioeconomic growth of Korea from the 1960s until the 1980s [11]. Light industry ICs in Seoul were located in urbanized areas close to residential or/and commercial areas [11,12,13]. Since the late 1980s, the main industrial activities in Seoul have changed from light and heavy industries to information industries. Therefore, the majority of ICs were demolished and replaced with different kinds of new urban developments. The remaining ICs were often abandoned and left vacant due to the lack of recognition of their potential values [14,15].
The first concept for the designation of industrial heritages was developed in Korea in the early 2000s. In 2002, the Registered Cultural Heritage (RCH) system was introduced after revision of the Cultural Heritage Protection Act [16]. The RCH system was founded to conserve and utilize modern historical and cultural heritages including industrial heritages [11,13,14]. However, only a limited number of buildings have been designated as RCHs in Seoul. To protect the modern heritages in Seoul that had been not registered as RCHs, the City of Seoul introduced the Seoul Future Heritage (SFH) selection program in 2013 [17]. However, the SFH system does not provide an official guideline of how registered heritages should be utilized or conserved.
To increase the designation of ICs to industrial heritages in Korea, including RCHs and SFHs, urban regeneration approaches have been addressed in various Korean studies [15,18,19]. Accordingly, industrial heritages have high conversion potential from an urban regeneration perspective and according to the following two characteristics.
- (i)
- The spatial characteristics of industrial heritages: Industrial heritages generally have comparably low building densities, low site occupancy ratios and low floor area ratios. Accordingly, ICs feature large open spaces between low-rise buildings, which contrasts with the generally high-density built up areas in Seoul with limited spaces for new construction.
- (ii)
- The characteristics of industrial heritages: Industrial heritages that are closely located to residential, commercial or mixed-use areas have potential to provide various social, economic and ecological programs and infrastructure functions for the neighborhood. By integration with existing urban infrastructures [20], the sustainability and resilience of the surrounding neighborhoods can be increased.
However, no resilience and only few sustainability aspects and cultural aspects have been addressed in past IC renovation and conversion projects in Seoul. The aim of this research is to foster sustainable and resilient urban regeneration in Seoul by an exemplary IC conversion. Due to the absence of existing IC conversion projects, this study used one design proposal for the exemplary resilient and sustainable conversion of an IC with integration of decentralized water management systems. The resilience to disasters concerns primarily flooding by extreme precipitation events, droughts and heat. Practically proven approaches, methods, tools and strategies were applied in the exemplary IC’s spatial planning and conversion design process. The evaluation of the conversion design was based on qualitative and quantitative analysis. Architectural design, environmental socio-cultural and water management aspects were addressed. However, economic aspects were beyond the scope of this research.
1.2. Study Area
Predicting potential risks and damage of natural disasters such as floods and drought is an important step to introduce countermeasures and to cope with potential disasters. However, disaster risk prediction is challenging due to the complexity of their causes [1,7]. The prediction, reduction of disaster risks and recovering from the resulting damage are among the biggest challenges in the new urban agenda [1,7,21]. Urban resilience has been emerging as an important concept to cope with disasters in urban areas. In 2015, urban resilience was in two of the 17 sustainable development goals (SDGs) defined by the United Nations (UN) [21]. Urban resilience was assigned as one of the main goals to Goal 9 and Goal 11, and the sub-goals of Goal 1 and Goal 13. Goal 9, “Build resilient infrastructure, promote inclusive and sustainable industrialization and foster innovation” aims for development of sustainable and resilient infrastructure for human well-being and economic development. Goal 11, “Make cities and human settlements inclusive, safe, resilient and sustainable” aims for increasing the resilience of settlements to disasters and adaptation to climate change by 2020 [9]. Therefore, the integration of urban resilience and sustainability issues in urban planning and design processes is essential for urban development.
2. Materials and Methods
2.1. Sustainable Urban Regeneration Frameworks for the Renovation of the examplary Industrial Compound
The selection of the exemplary IC in Mullae-Dong was based on qualitative and quantitative analysis of Seoul regarding flood vulnerability (such as flood prone areas and flood vulnerable areas). A representative IC in Seoul was selected based on the following spatial and locational characteristics: the IC must located in an industrial district of the city and must be registered as a “Seoul future heritage area” [22]. Furthermore, the IC must be in a high flood vulnerability zone (see Section 3.2.1) and mixed-use land function. The proposed conversion strategies are transferable to other ICs in Seoul and therefore contribute to Seoul’s urban resilience and sustainability conversion processes.
The exemplary IC case study analysis was executed on different levels, from district, over neighborhood, to the building level. The district level analysis included the analysis of existing natural and anthropogenic basic conditions, such as existing urban water cycle, related infrastructure and data, local climate data, topography, land uses, permeability of the grounds, groundwater levels, and population density. The neighborhood level analysis of the exemplary case study included more detailed information on urban infrastructure such as land use, building age, existing water management infrastructures, topography, and storm water runoff analysis by data and onsite observation. The building level data and onsite analysis included the design, construction and conditions of the existing buildings.
The degree of conservation and utilization of existing buildings was determined by applying Korean industrial heritage conservation and utilization criteria in the analysis process of the existing buildings [13,14,15]. The same criteria were used to decide the kind and degree of building renovations and new building constructions. The integration of specific aspects related to sustainable architecture, water, vegetation, material, infrastructure, as well as specific technologies and building services engineering systems was based on the analysis of good practice examples of integrated sustainable holistic design projects.
The decentralized water management systems integrated in the conversion design were based on the new and innovative approaches for the reconstruction of the natural water and nutrient cycle. Rainfall on the IC is managed onsite, including the harvesting, retention, infiltration storage and utilization of rainwater [23,24,25,26]. Wastewater and organic waste produced in the converted IC design is managed and recycled onsite with decentralized technologies and systems. The system includes the application of membrane bio reactors for water purification and Terra Preta technology for the management of organic wastes [24,27,28]. Recycled water and organics are also reused onsite for urban farming. The design of the water and sanitation system was based on estimated water consumption on the converted IC and the resulting wastewater and organic waste flows. The specific volumes, technology and system capacities were estimated and calculated with proven tools and criteria [29,30,31]. The quantification of drinking water and service water consumption and potential onsite drinking water and service water production capacities were executed based on our own estimations and data published in scientific publications [31]. The quantification of urban farming water consumption was done through literature and case study reviews [26,27,32].
2.2. Stormwater Simulation Methods
In addition to the development of reuse strategies for wastewater and rainwater, the rainwater management system was designed to manage the total rainfall on the converted IC onsite and prevent stormwater discharge from the property in case of extreme precipitation events. The required retention volumes and areas for infiltration of rainwater for the recharge of groundwater were calculated using the program STORM XXL [29]. Required data for the calculations were climate data, the sizes, the retention, drainage properties and capacities of stormwater drainage surfaces. The retention and infiltration systems, soil properties and the available freeboard are also required.
The objective of the stormwater management simulations was to quantify the effectiveness of the exemplary IC’s decentralized stormwater management system for the following indicators: (i) number of storm water overflow events and discharge of surplus stormwater from the IC property to the nearby Dorim-cheon stream via the municipal mixed sewage system, and (ii), determination of stormwater retention and infiltration volumes with decentralized stormwater management systems integrated on the exemplary IC property.
To illustrate the effectiveness of the proposed sustainable conversion system, the retention, infiltration, discharge, and overflow events were all quantified for the exemplary IC (i) before and (ii) after renovation. Historical and statistical data of storm events collected from different rain stations located within the urban context of Seoul were used for the simulations with STORM XXL.
3. Results
3.1. Selection of Exemplary Case Study IC
Three industry types characterizing three districts in Seoul were identified. Steel manufacture ICs are mainly in Mullae-Dong, Yeongdeungpo-Gu. Shoe manufacture ICs are in Seongsu-Dong, Seongdong-Gu. Light industry ICs are in Garibong-Dong, Guro-Gu [12]. Comparison of the main characteristics of the three districts was done as shown in Table 1. All three districts have high flood vulnerability [8].
To facilitate the integration of decentralized water management systems and integration of various programs, supporting the local community, an IC with a common average size and spatial configuration was selected as exemplary IC for the conversion design in the framework of this research. This exemplary IC is located in 92, 1 Ga, Mullae-Dong, Yeongdeungpo-Gu, Seoul and consists of multiple buildings surrounding an open courtyard accessible from one road via an open space between the buildings (see Section 3.2.2. Neighborhood Level). This IC consists of one to two story buildings. The ground floor areas have the biggest portion of the total floor area and were most frequently used together with the courtyard, e.g., for access, storage, manufacture and transportation purposes. The IC buildings were built before 1988 and therefore meet the required basic condition to be considered as modern cultural heritage [11].
3.2. Case study Analysis
3.2.1. District Level
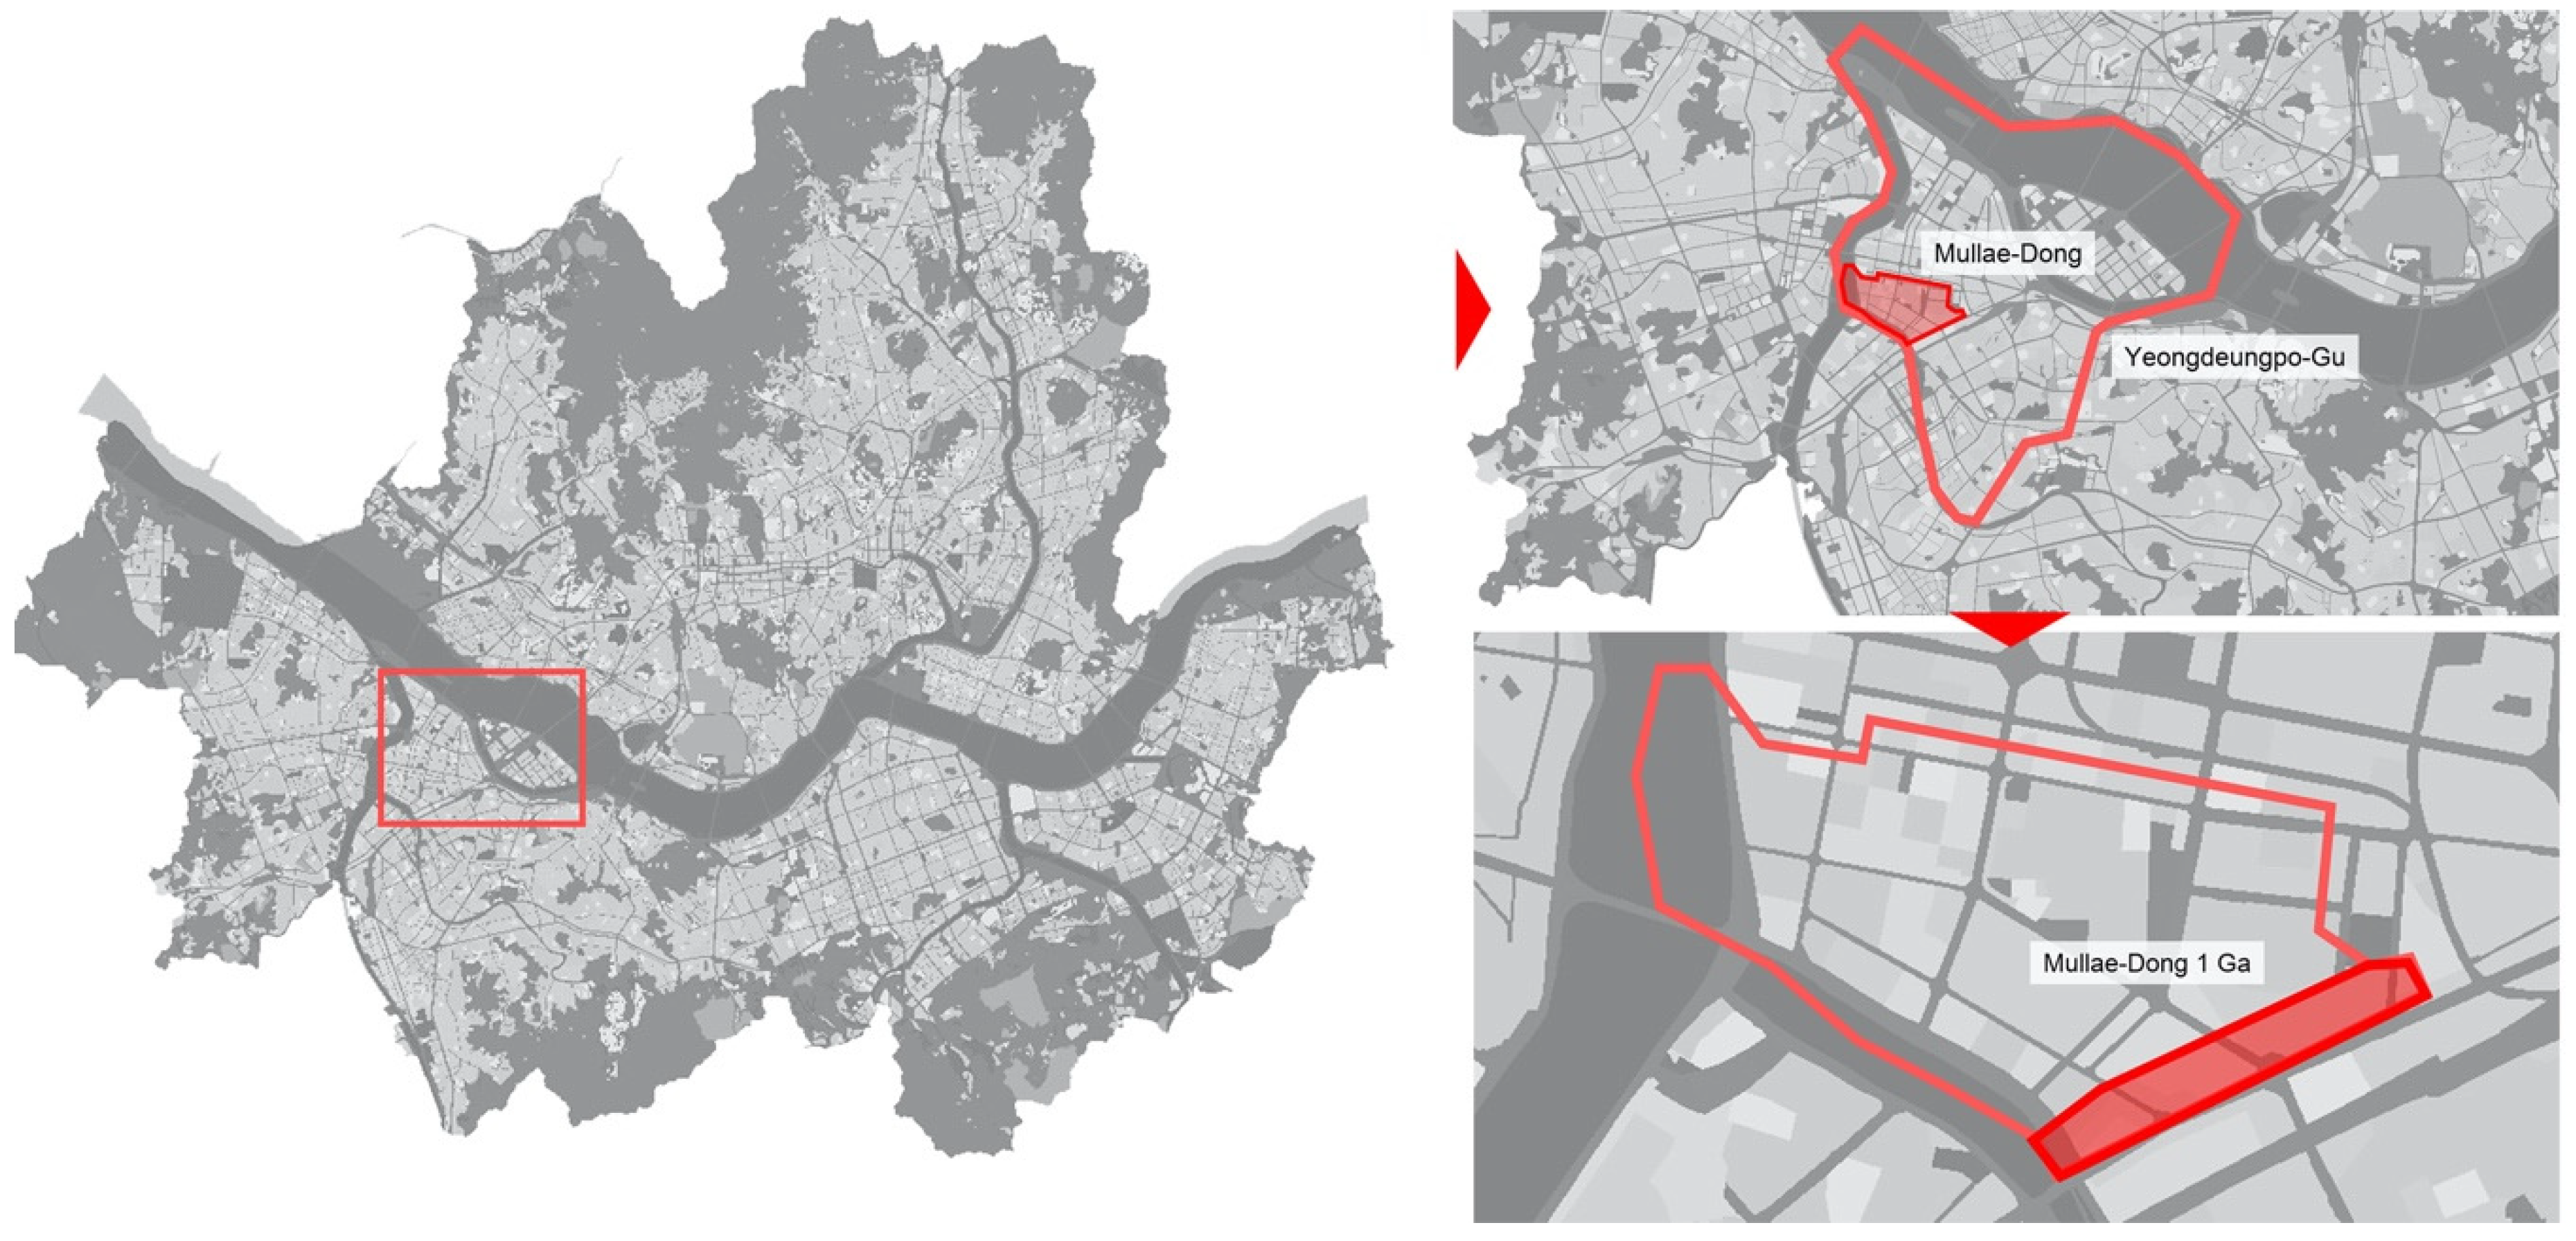
Mullae-Dong is one of 18 neighborhoods in Yeongdeungpo-Gu, Seoul (Figure 2). The total area of Mullae-Dong is 1.49 km2 with a population of 31,618 inhabitants. The population density of the neighborhood is 21,362 per km2 [33], which is approximately 31% higher than the average population density of 16,364 km2 in Seoul [34].
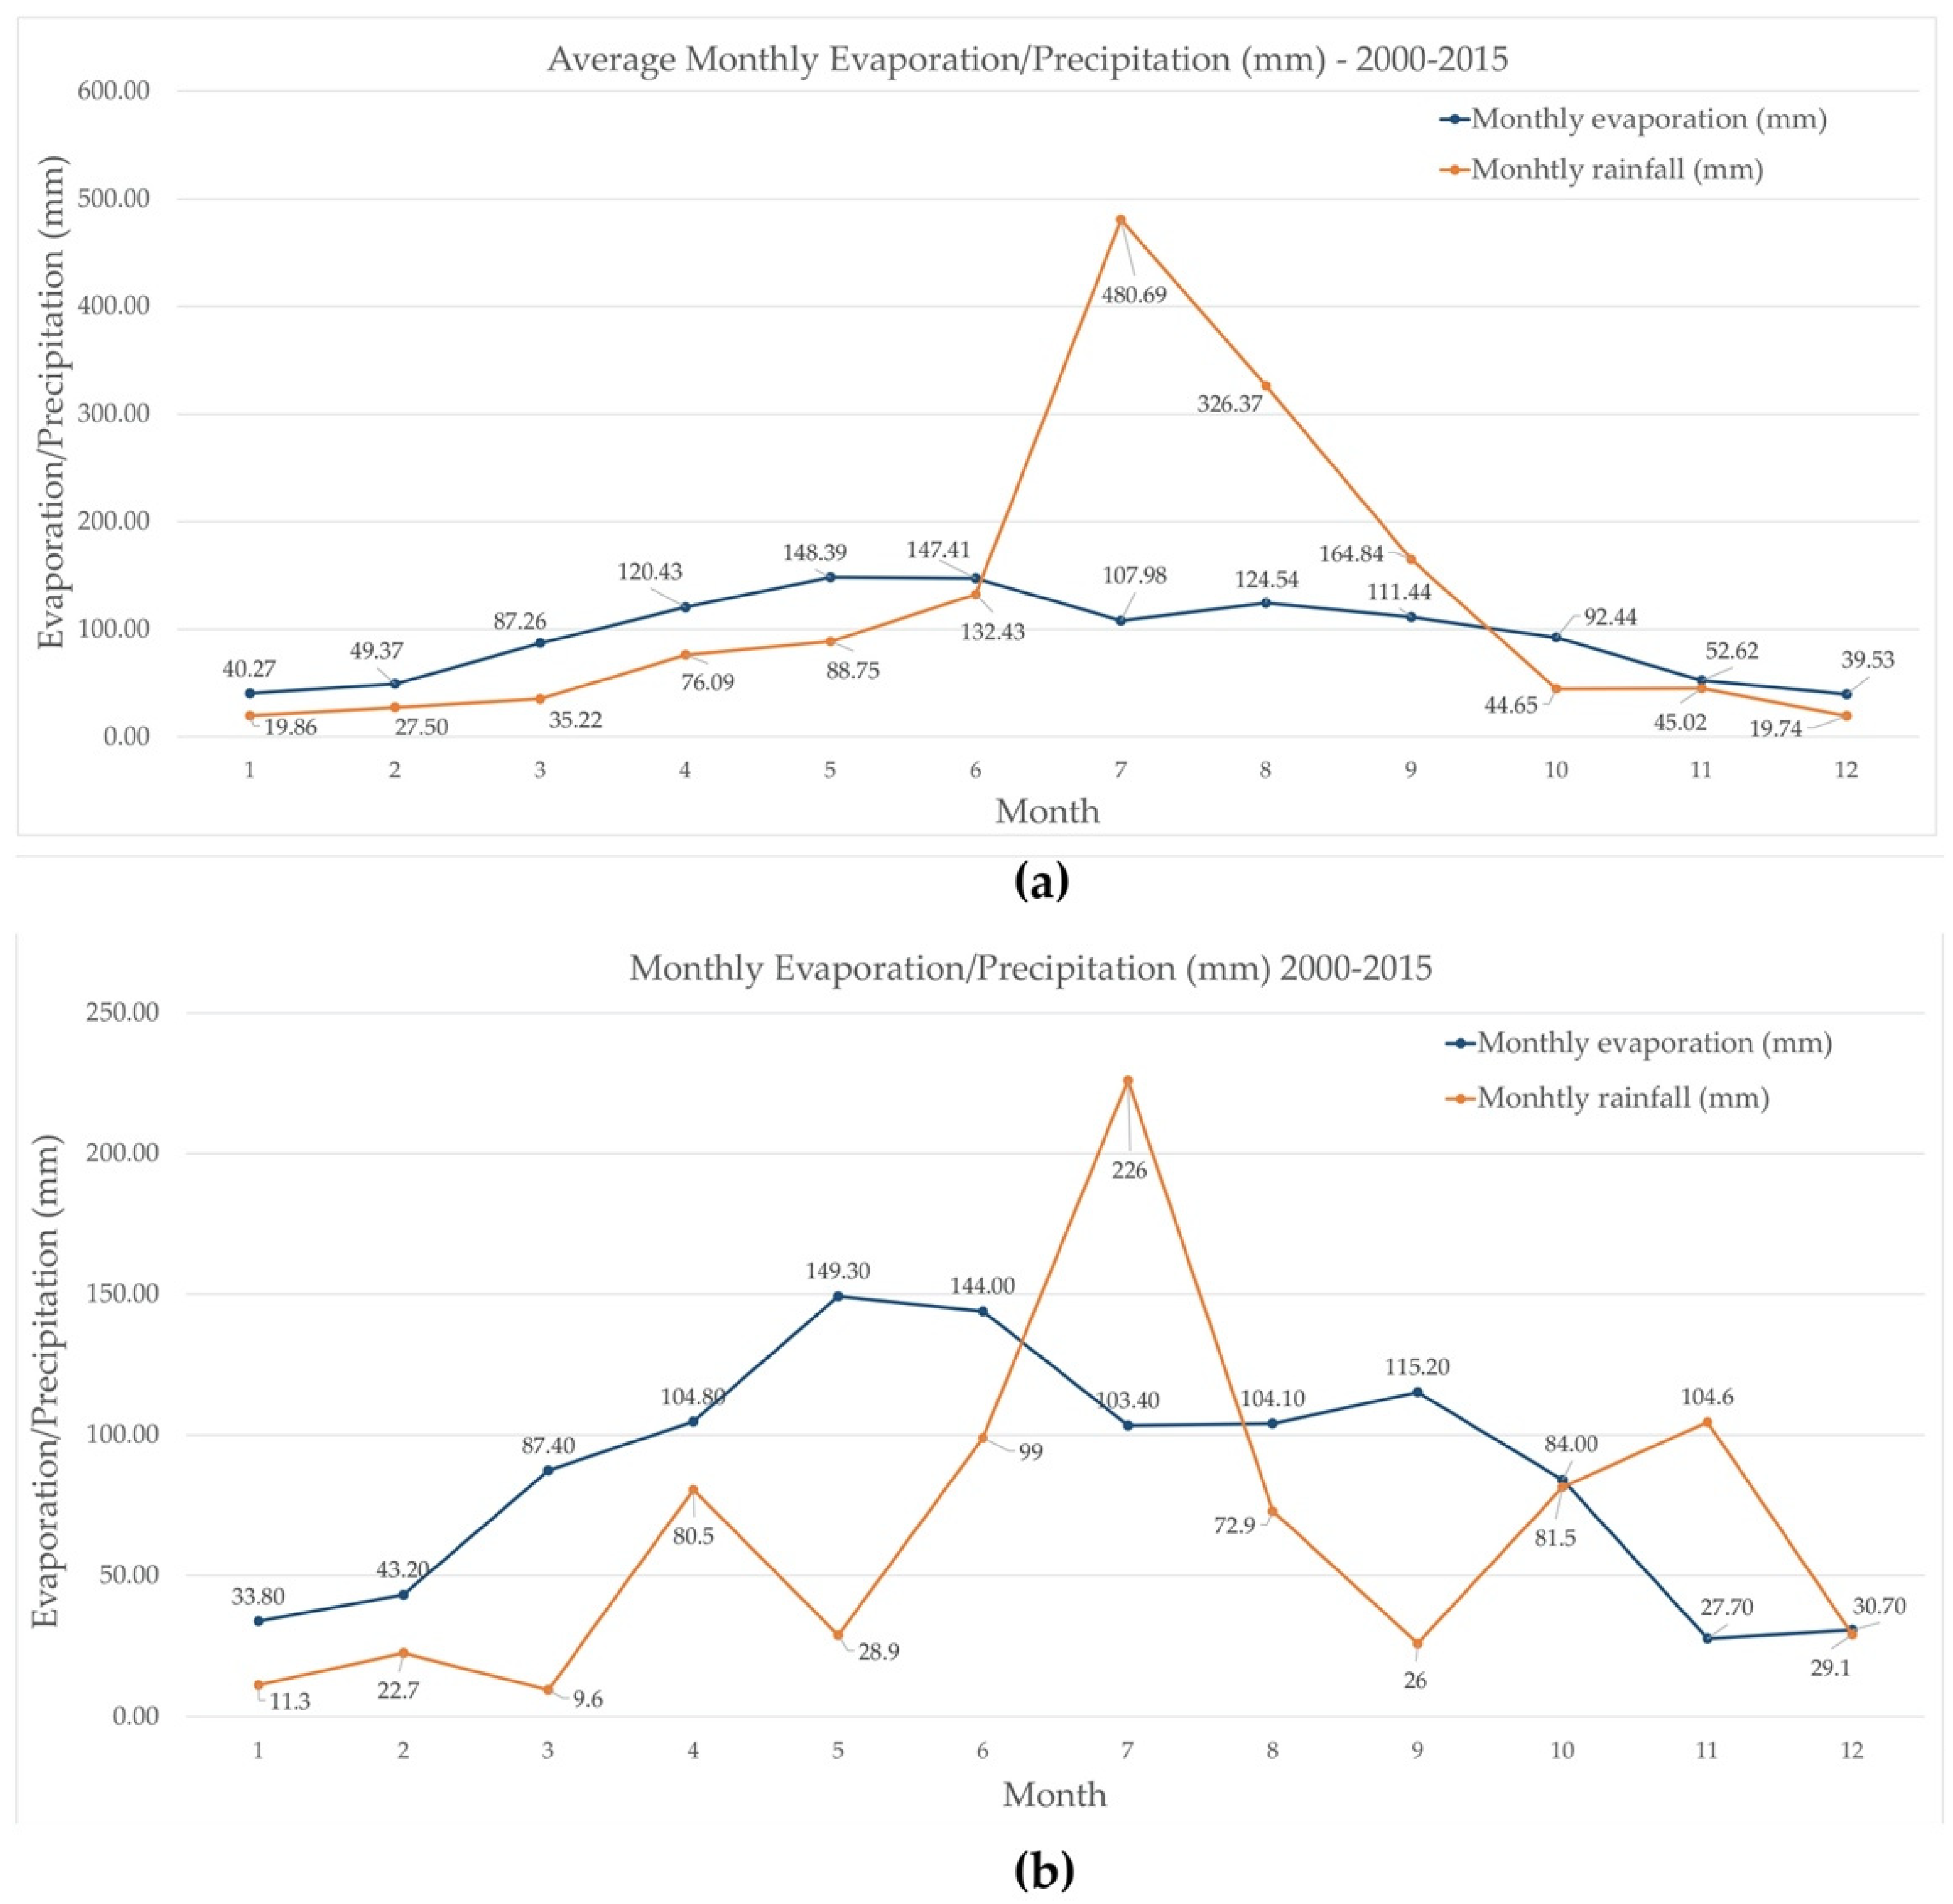
The connection rate to the public drinking water supply network in Mullae-Dong 1 Ga is 100%. In 2016, the average amount of drinking water supply per person a day was 344 liters (hence defined as “l” units). This amount has increased by 28 l since 2011. Wastewater and stormwater from 99.18% of Mullae-Dong 1 Ga’s total area are collected and drained via mixed sewers. In 2015, separated sewers for the collection of wastewater and stormwater were installed for 0.82% of the total area [33]. The rainfall data used were those of Seoul, because no data for district level were available. The rainfall in Seoul exceeds the potential evaporation during summer months in wet years, such as in 2010 (2043.5 mm/a), and on average in the period from 2000 to 2015 (1548.3 mm/a on average—Figure 3a). The balance was positive and results in freshwater surplus. During dry years (Figure 3b), such as in 2015 (792.1 mm/a), the potential evaporation exceeded the rainfall in almost all months of the year and freshwater surplus was consistently reduced during the summer months. Accordingly, the balance was negative and resulted in freshwater demand. The differences in rainfall and the balance with potential evaporation in wet and dry years and the yearly average illustrate the challenges for sustainable water management and the provision of resilience against drought and flooding [35].
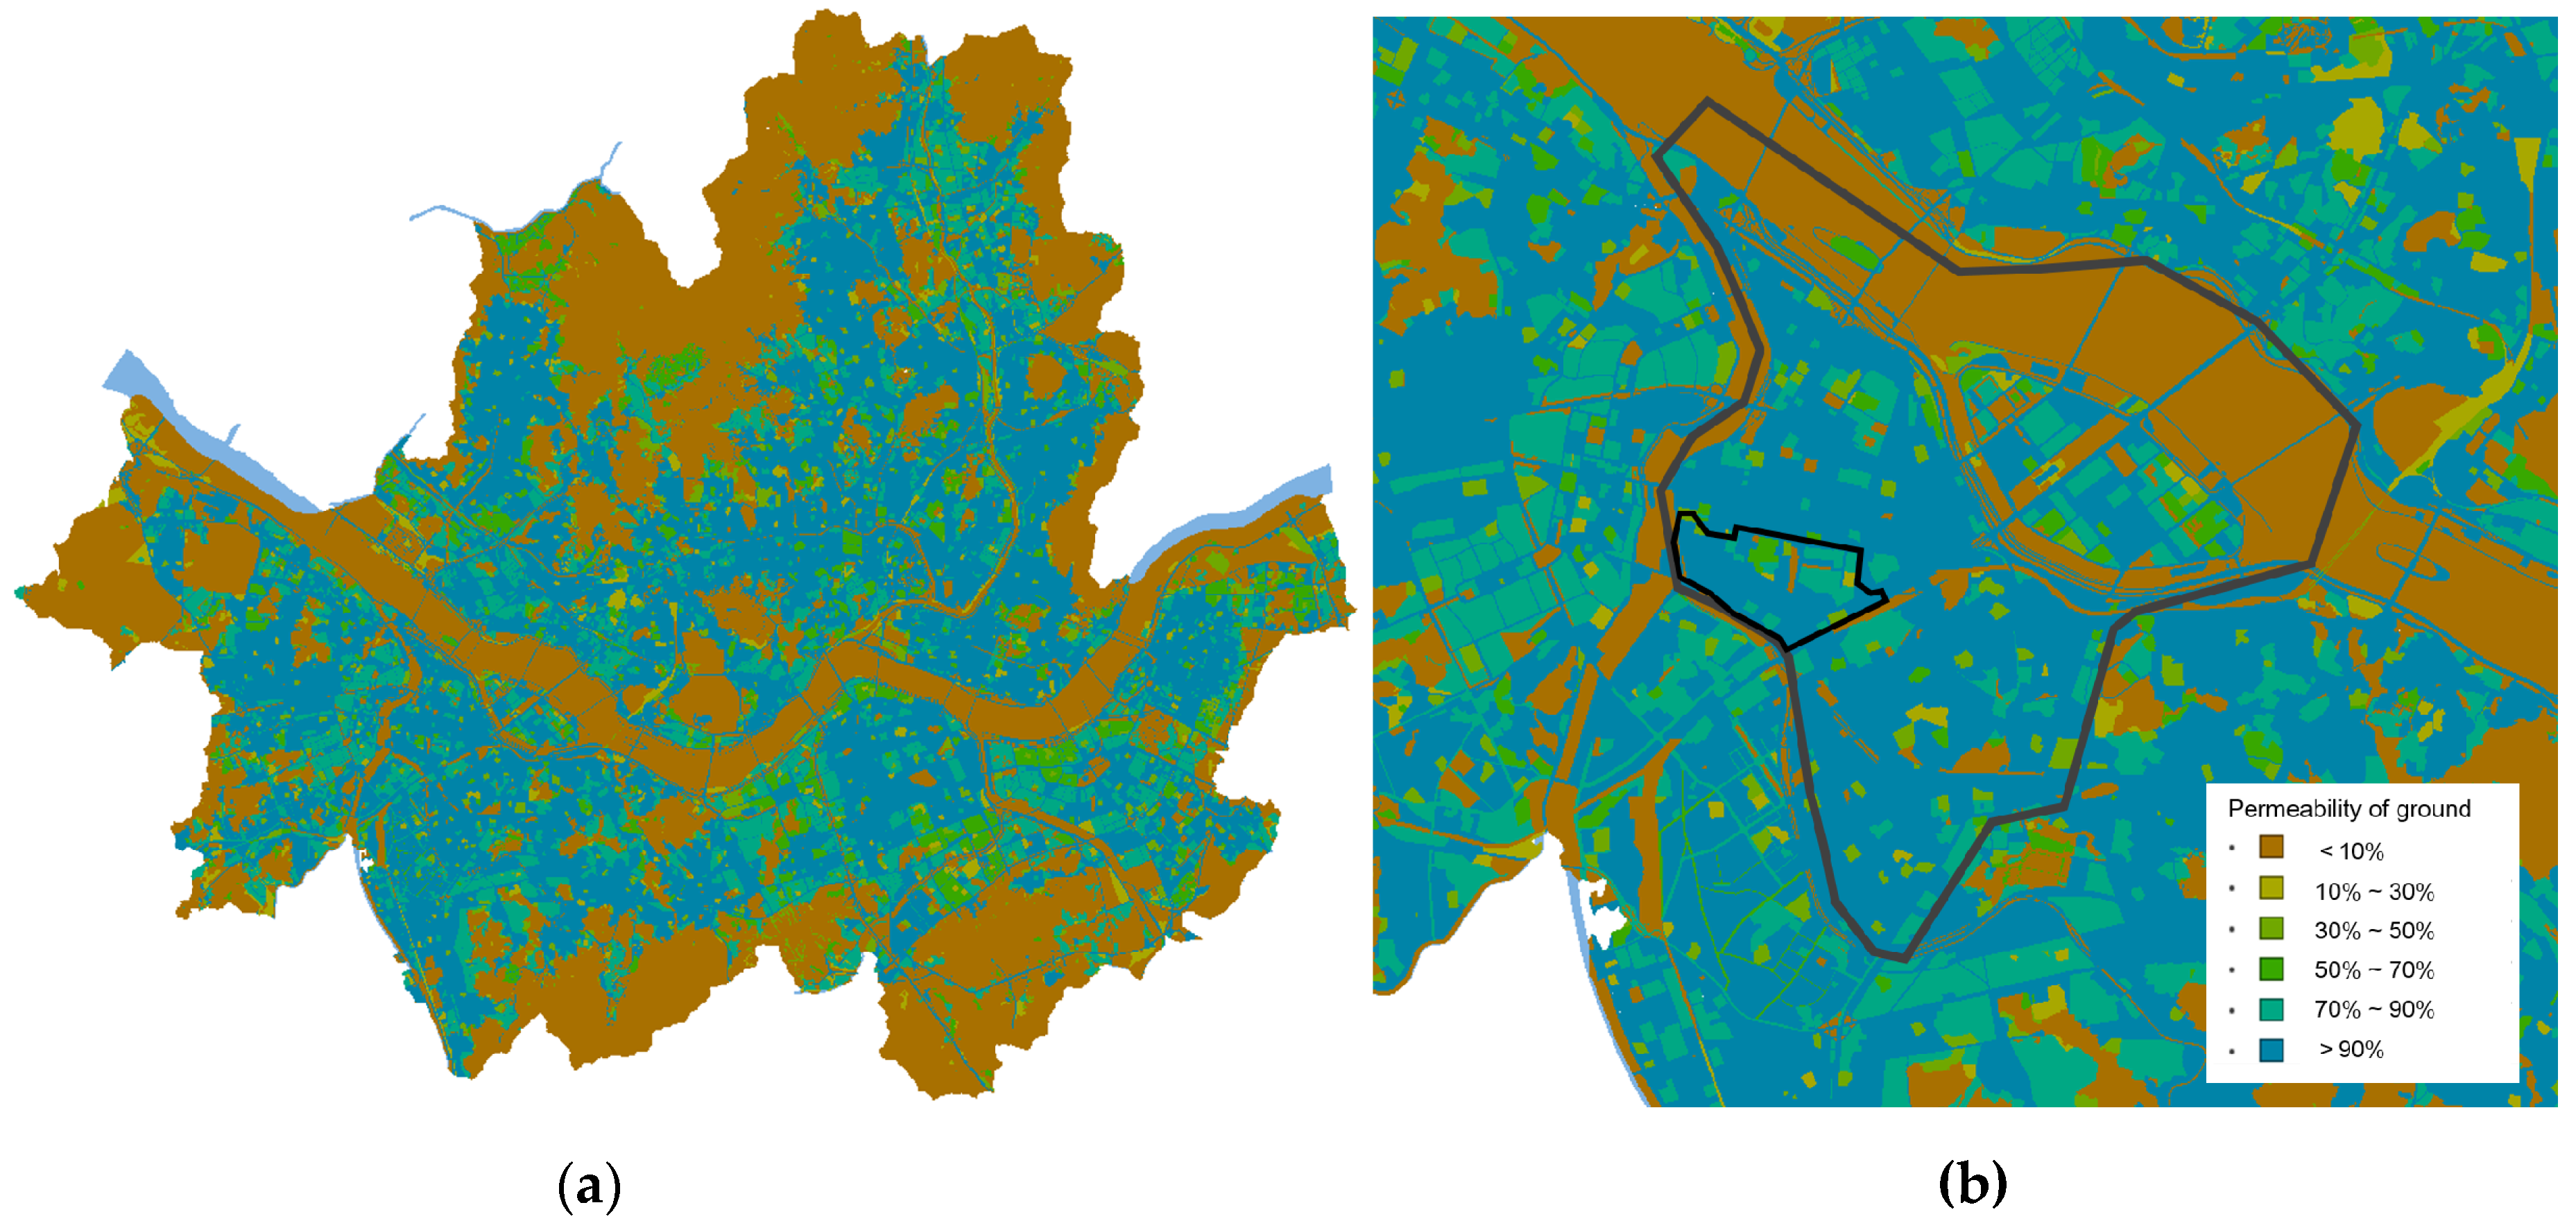
In 2015, 49.31% of areas in Seoul had ground surface area with a permeability of less than 30% [36]. In contrast, non-permeable areas in Seoul had only a portion of 7.8% in 1962 [37]. Figure 4 illustrates the permeability of ground surface areas in Seoul (a) and Mullae-Dong in Yeongdeungpo-Gu (b). Except one water body, most of Mullae-Dong’s surface areas are more than 90% non-permeable. Therefore, the rainwater infiltration and groundwater recharge rate is significantly reduced while storm water runoff, resulting flood and resulting damage risks are increased [37].
3.2.2. Neighborhood Level
The exemplary IC is located at Mullae-Dong 1 Ga on the southeastern boarder of the Mullae-Dong district. Dorim stream in the west and a tributary in the south border the district and serve as receiving waters from the districts mixed sewage pumping stations during flood events (Figure 5). A watertight separation wall to adjacent train tracks defines the southeastern boarder of Mullae-Dong 1 Ga.
Urban development in Mullae-Dong started in 1940, when a large-scale residential complex was built for workers of the Yeongdeungpo Industrial Complex. In the 1980s, the first small steel manufacturing industries moved from downtown Seoul to Mullae-Dong due to the relatively cheap rents in this district, and this increased the establishment of steel manufacturing industries in this district [22]. From approximately 2008, artists also started to move to Mullae-Dong from other parts of Seoul, due to the comparably cheap rents in the district. As a result, the so-called Mullae artist village emerged within the steel manufacturing district. The diverse programs of living, working, arts, and craft create a unique atmosphere in the district. However, the amount of green open recreational space in the district got very limited. Other than Dorim-cheon Riverside Park in the west and the Mullae Geunlin Park, no other parks or public open green spaces were available in Mullae-Dong. Since this district hadn’t been redeveloped, the existing buildings were generally built before 1988. Furthermore, many illegal or undocumented buildings and building extensions could be identified. In contrast, redeveloped areas with relatively new residential and commercial buildings characterize the surrounding districts.
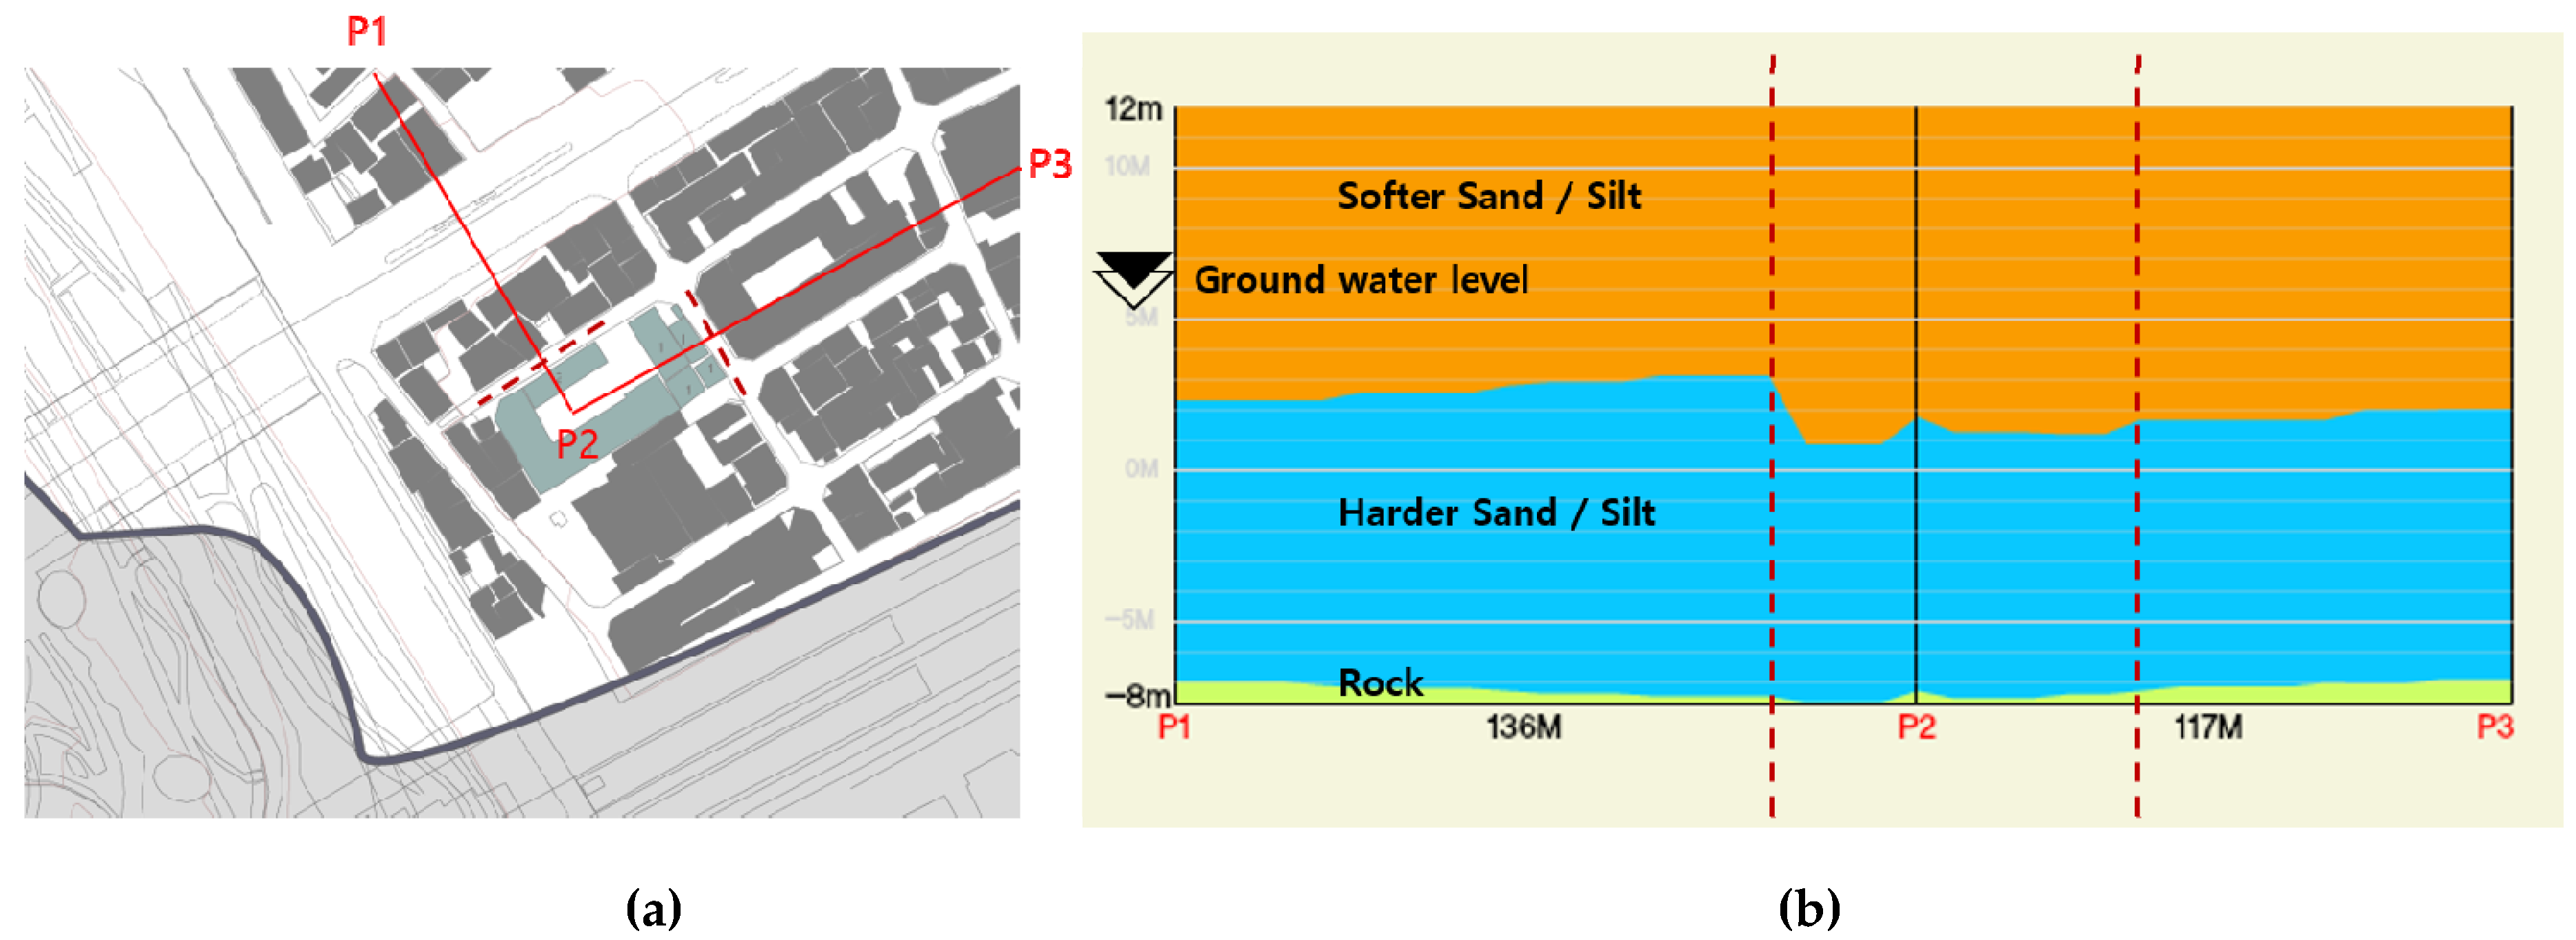
The district is located in the plain tract of Dorim-cheon. Therefore, the topography of the district, neighborhood and the exemplary IC is characterized by minimum height differences. The ground level heights of the built-up areas in the district are between 8 m and 12 m above sea level. On the exemplary IC site and the direct neighborhood, the topography with a height of 12 m above sea level is almost flat. The ground level height of the adjacent Riverside Park is approximately 2 m above sea level. The ground consists of sand or silt with different densities. The upper layer is located between approximately 1 to 12 m above sea level and consists of soft sand or silt. Harder sand or silt is located on heights between −7 to 1 m above sea level. Below a depth of −7m below sea level, the ground consists of rocky layers with low water permeability. The ground water level seasonally fluctuates between 5.2 and 6 m above sea level and accordingly 6 and 6.8 m below the ground surface level [39] of the exemplary IC site (Figure 6). Therefore, the freeboard between the ground water level and the ground surface level of the site is between 6 and 6.8 m.
An important aspect of the existing stormwater and sewage infrastructure in the neighborhood of the exemplary IC is its location under the flood levels of the receiving streams. Accordingly, mixed sewage and stormwater needs to be pumped into the receiving waters in the case of flood events. There are two purported rainwater pumping stations nearby the site. In fact, these stations are mixed sewage pumping stations that discharge mixed sewage directly into the receiving waters if the capacity of the mixed sewage drainage and treatment system is exceeded. Pumping station A and B are approximately 1 and 0.45 km away from the exemplary IC’s site, respectively. The pumping stations discharge mixed sewage from sewage systems to streams during heavy precipitation events when the capacity of the sewage systems is exceeded. Therefore, locations close to such pumping stations are confronted with high mixed sewage backflow and overflow risks in cases of extreme precipitation events. A site plan of the exemplary IC and its direct neighborhood indicates the location of existing water infrastructures including the location of fire hydrants, mixed sewage manholes, water supply manholes, and storm water gutters (Figure 7). The natural slope in the neighborhood of the exemplary IC directs the storm water runoff in a southeastern direction. The stormwater flow is blocked by man-made structures such as the separation walls between the built-up areas and the train tracks along the southeastern district border (Figure 7c).
3.2.3. Building Level
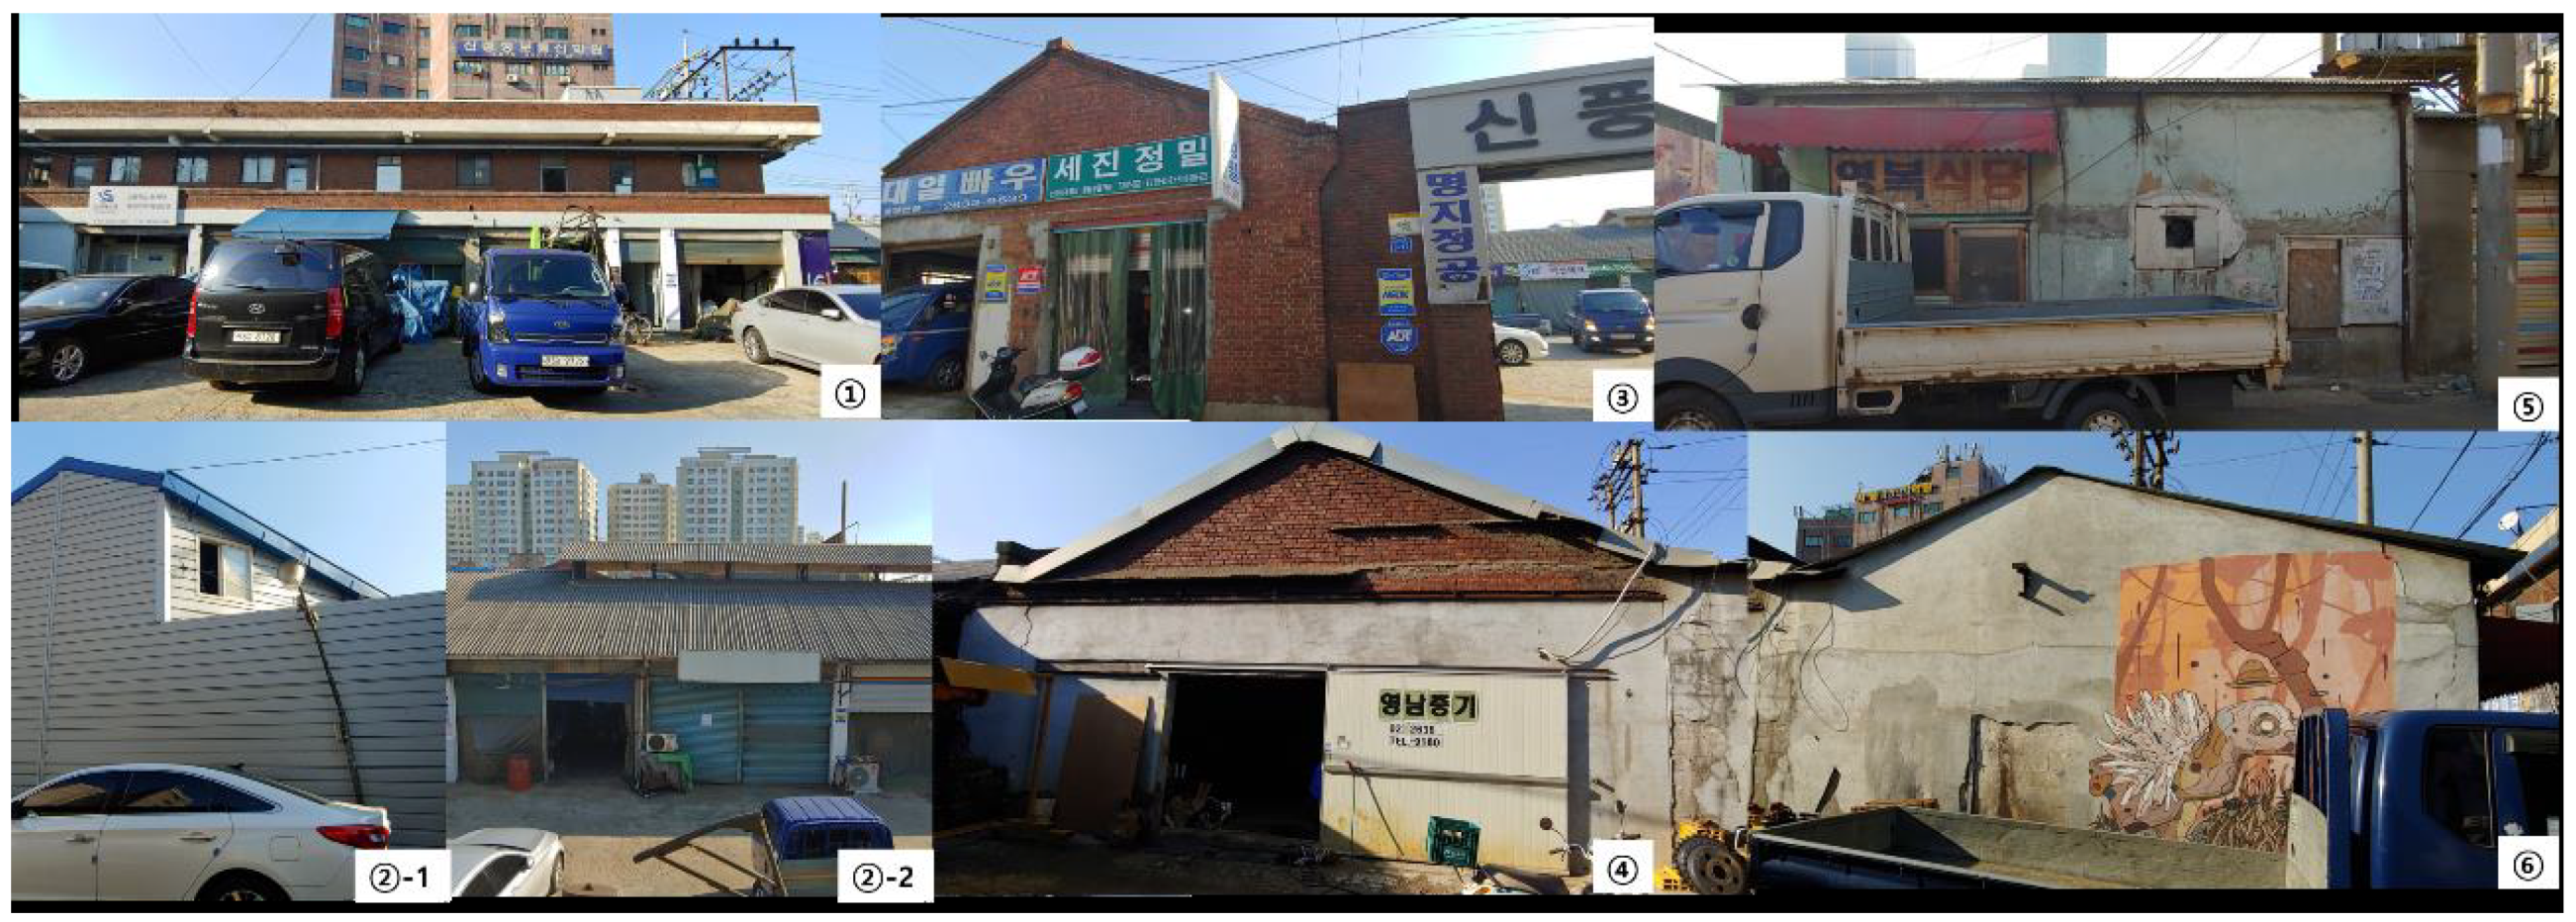
The analysis of the specific conditions of envelopes, structures, as well as the number of floors and current building uses created the basic conditions for the exemplary ICs redevelopment strategy and decision-making regarding the renovation or the demolishment of existing buildings and the construction of new buildings. The exemplary IC consists of 6 existing buildings (buildings 1 to 6 in Figure 8) that are located around an open courtyard. The IC is located at 92, 1 Ga, Mullae-Dong, Yeongdeungpo-Gu, Seoul. The total property area is 2200 m2 with an existing site occupancy ratio of 0.6. The existing buildings were built in various periods between 1970 and the 1990s. The conditions of the buildings are very poor, except building 1, which was in a relatively good condition. Therefore, the decision made was to keep building 1 and renovate it, but demolish buildings 2, 3, 4, 5 and 6 due to their poor condition. The façades and roofs were damaged, on the outside as well as on the inside. Partly, the existing structures had roofs consisting of single steel plates and without proper construction. Building structures and interiors were directly exposed to outside weather conditions such as rainfall, humidity, wind, and temperature fluctuations for a long period. The existing buildings consisted of structural brick walls combined with steel reinforced concrete columns or walls. A part of building 2 was replaced and extended with steel sandwich panel structures without any openings to the adjacent road (2-1 in Figure 9). The ground floors of all buildings (2 to 6) were connected barrier free directly to the outside (2-2 in Figure 9) due to the characteristics of small-scale steel manufacturing workshops. Steel products were manufactured in the courtyard as well as in the indoor ground floor areas of the buildings. Accordingly, the ground floors and the courtyard had close spatial and functional connection. The ground floor levels of the existing buildings had semi-open characteristics. The conditions of the existing façades and structures of buildings 1 to 6 were as illustrated in Figure 9.
The main specifications of existing buildings on the IC property were the building footprints in square meters, the building construction quality (including abilities for renovation based on the utilization guidelines of industrial heritages in Korea [14,16]), main structural elements, number of floors, and current building use (Table 2).
3.3. Conversion Design Proposals
3.3.1. Design Aims
The exemplary ICs conversion design concept was developed based on an integrated planning and design process to achieve the following specific objectives:
- Increasing urban resilience by adaptation to the effects of climate change and potential disasters caused by flooding, drought and heat.
- Closing the urban water and nutrient cycles at property level:
- ○
- Protection of underground and surface water bodies’ quality and quantity.
- ○
- Retention of all rainwater and storm water on the property.
- ○
- Maximization of rainwater and recycled wastewater utilization.
- ○
- Reduction of drinking water consumption and direct water footprint by efficient and effective water use and savings.
- ○
- Integration of urban farming in the local water and nutrient cycle management.
- Creating public awareness and participation by visible integration of water and nutrient management and urban farming system in the design of indoors and outdoors.
- Increasing energy independency by energy efficient building design and renewable energy production using building integrated photovoltaics (BIPV).
To achieve the above specific objectives with the conversion design of the exemplary IC, the spatial and program related planning and building design was based on the following two main strategies: (i) integration of technical and nature oriented systems for rainwater retention, infiltration, wastewater and nutrient recycling, urban agriculture and renewable energy production, (ii) creation of synergies for increased resilience, sustainability and livability through integration of new building programs, decentralized systems for water and resource management, as well as participation and education of citizens.
3.3.2. Renovation Design Overview
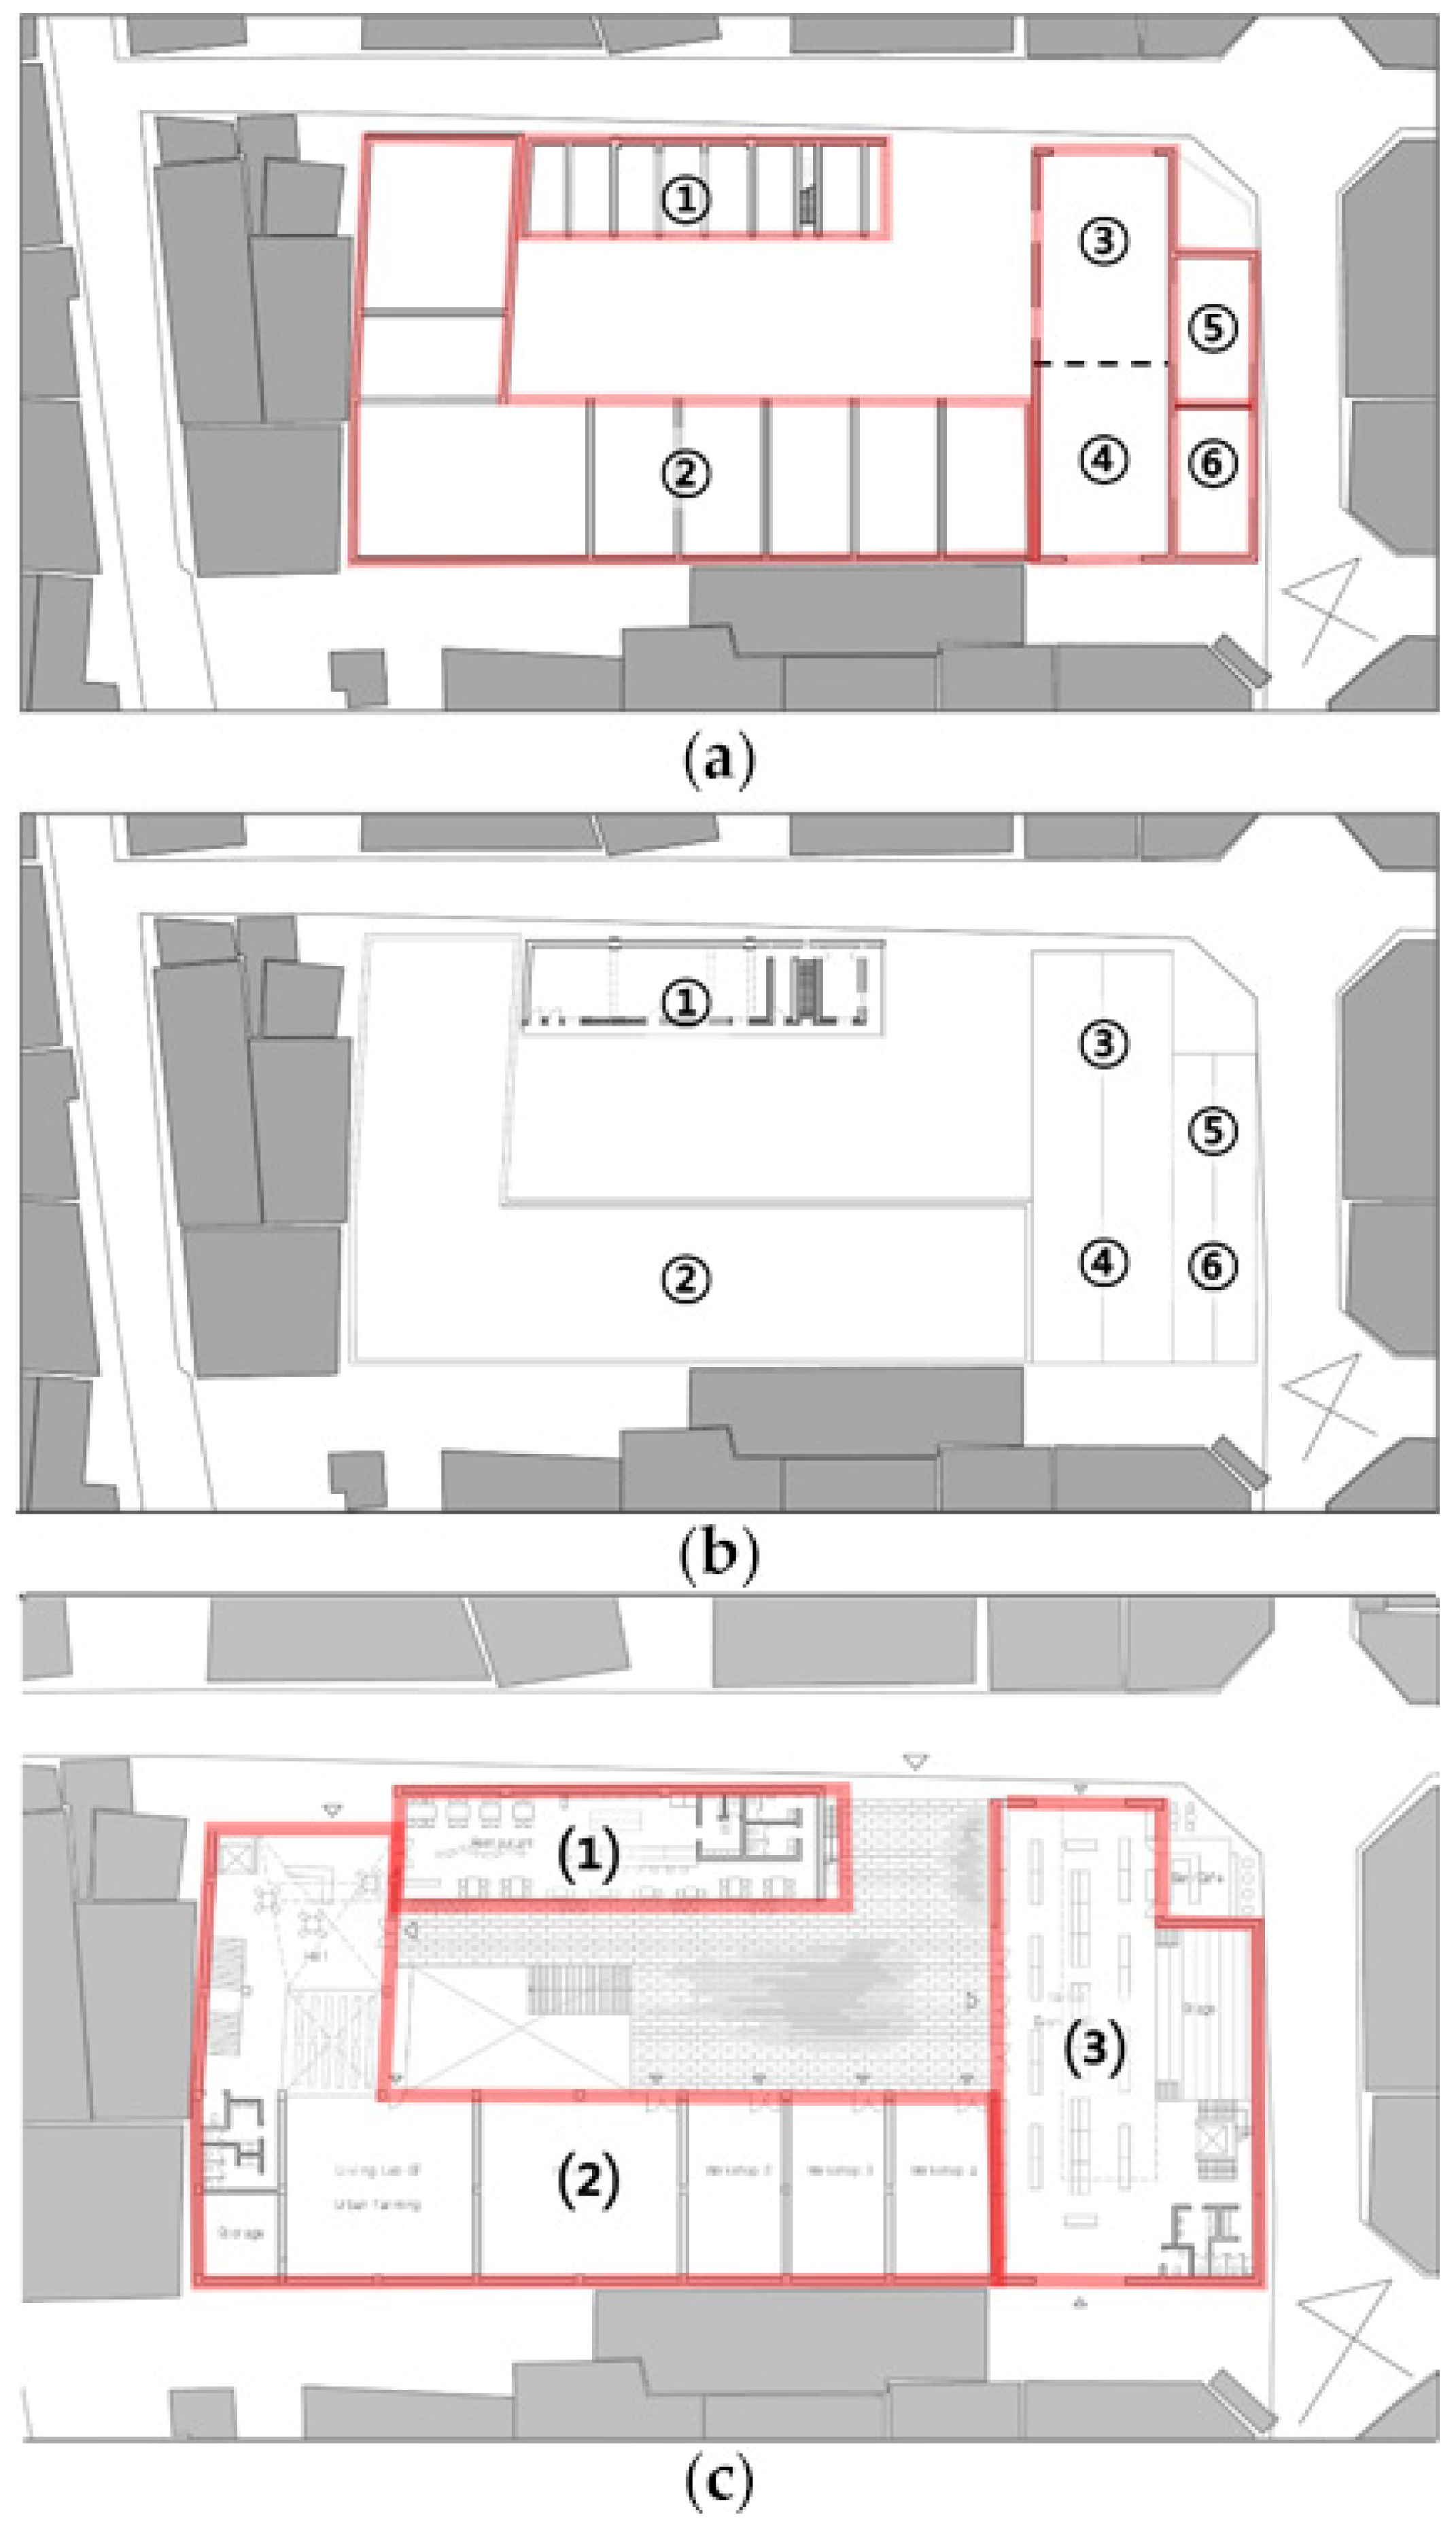
Figure 10 shows the ground floor plan and first floor plan of the existing buildings with an overview of the ground floor of the renovated buildings within the complex.
The range and level of renovation of the different buildings vary based the state of maintenance of each construction and the functional requirements of the new design. The original representative architectonic characteristics of the buildings were considered during the renovation planning process. The façades of building 1 were conserved and only structural weaknesses and damage in the building envelope were repaired. The renovation of building 1 was planned in order to preserve the original architectural features and characteristics. Due to the poor conditions of the structures and the building envelopes, the single-story buildings 2 to 6 were demolished and replaced by new multi-story constructions with an aim of conserving the original footprint area and increasing of usable floor area without additional sealing of ground. Table 3 presents an overview of the building programs included in the renovated building 1 and new buildings 2 to 6 of the converted exemplary IC.
With respect to spatial renovation, the interior staircase located in building 1 was removed to increase user accessibility and enhance functional flexibility of the spaces. Additional internal structures, either supported by the existing load bearing walls or included within the building indoor space through an autonomous structural system, were introduced in the new buildings.
The functional renovation plan included a restaurant (indoor net floor area: 175m2) located on the ground floor of building 1, replacing the existing separated workshops. The main reception and guest area of the restaurant can be extended outdoors in the courtyard. The extension of the guest area increases the available space and creates an open area that can be used for various activities. Open office rooms were located on the 1st floor of building 1. The open terrace serving as access to the offices on the southeast façade of building 1 was maintained and expanded. The horizontal rooftop area of building 1 was renovated and assigned to exterior café terrace use (net floor area: 192 m2). The café located on the terrace can be directly accessed from the ground floor via the renovated existing external staircase. For barrier free access and in case of emergency, the terrace café is also connected to the ground floor via an elevator and a second stairway that was included in the new construction of building 2.
The newly designed building 2 has a building footprint area of 790 m2, which is 26 m2 smaller than the existing building footprint of 816 m2. It consists of three stories: (i) underground floor (B1), (ii) ground floor (GF) and (iii) first floor (F1). A glasshouse has been put on the rooftop area of the first floor, enclosing a rooftop farming area of 710 m2. The pitched roof surface of the glasshouse will be covered with building integrated photovoltaic (BIPV) panels. Workshops and a living lab dedicated to sustainable water management and treatment technologies will be on the ground floor of the southern section of building 2. Access is provided from the ground floor via the IC courtyard.
Various activities, such as an extension of the living lab for sustainable water management and treatment technologies and a seminar hall for multiple events, will be carried out in the basement of the new buildings. The main construction of the new building 2 consists of steel beams and reinforced concrete slabs, in order to refer to steel manufacturing, the characteristic of the original IC building uses.
The new building 3 covers the footprints of the demolished 3, 4, 5 and 6 (475 m2) and has been designed for multifunctional use, improved occupancy and utilization as public space. It consists of a basement floor (B1) that is connected to the B1 level of the new building 2, and a second gallery floor is connected via a central staircase to the first floor (Figure 11). The ground floor area can be used for various activities and programs, such as markets, exhibitions, concerts, discussions and other performances. Technical and storage rooms will be on B1 level. A bar, bistro and café will be on the 1st floor gallery. The structural brick wall and pitched roof construction were based on the brick façades and pitched roofs of the demolished original buildings. Extensive roof light openings will be covered with semitransparent BIPV glazing for optimized daylighting, control of solar heat gains and renewable electricity production.
On the northeastern corner of the new building 3’s ground floor, a small café has been designed to create a welcoming atmosphere and provide the reuse of the existing area as a pocket park. In the southwestern corner of the IC courtyard, a sunken area on B1 has been designed. The IC courtyard ground floor level is connected via a staircase with the underground floor of building 2. The sunken area facilitates the daylighting of the connected building 2’s north-oriented B1 living lab areas. Figure 11 represents the B1, GF, 1F, 2F and rooftop plans and isometric view of renovated ICs.
The overall water and resource flow in the integrated decentralized infrastructure systems are discussed in the following section.
3.3.3. Decentralized Water Infrastructure and Quantification of Water Supply Demand
Rainwater is collected from the rooftops of buildings 1 and 2. The runoff is purified with filters and stored in tanks, with a total capacity of 50 m3, which are located on the B1 level of building 2. The stored rainwater is utilized as service water for adiabatic cooling and dehumidification [33] during the summer and for air humidification during the winter. Traffic and courtyard areas on ground floor levels and the roof and facades of the new building 3 were designed for optimized retention of rainwater.
The drinking water supply system is based on the existing centralized public supply system. Drinking water is supplied to different places in the buildings, such as labs, workshops, kitchens, market and washbasins in toilets. Collected rainwater could be purified further to drinking water quality and used for substitution of centralized supplied drinking water.
The wastewater system consists of separated collection systems for blackwater from flush toilets, which is separated in liquid and solid phases, and greywater, e.g., from washbasins and cleaning.
The collected greywater is treated in a membrane bio reactor (MBR), purified and collected for reuse as service water for non-drinking purpose. During the treatment, greywater passes through three separate water tanks: pre-treatment tank (i), aeration/MBR tank (ii) and treated water tank (iii). Sludge is created in the first two steps. The sludge is collected, dehydrated and added to the Terra Preta soil production process [24]. The heat from treated greywater is extracted for hot water production by means of a heat pump (Figure 12). The integration of water cycles and technical heating and cooling technologies for building indoor comfort improves the building’s energy demand by reducing energy demands for heat water production. Treated grey water is used as service water in the buildings and distributed by a second water supply system for non-drinking purposes. Service water applications include flushing of toilets, cleaning and irrigation of plants in urban farming and landscape design.
To maximize the reuse of wastewater and achieve higher degrees of resilience and sustainability of the water and resource cycles, an integrated system of treatment and reuse of blackwater, urine and organic waste at property level was designed. The system is based on Terra Preta Sanitation technology (TPS) and facilitates the reuse of liquid and solid nutrients as organic matter in local agriculture and horticulture [41]. Urine is collected separately from 12 waterless urinals that have been installed in the buildings. The collected urine can be directly used partly in the urban farming as a liquid fertilizer. The remaining urine is mixed with dry organic matter, effective microorganisms (EM) and charcoal powder, then undergoes lactic acid fermentation and composting processes to be used in Terra Preta (Portuguese: black soil) production. The proportion and amount of urine used depends on the amount of organic waste used for Terra Preta production. The blackwater from the 31 water saving flush toilets that are installed in the buildings is separated into liquid and solid phases. The nutrient rich liquid phase is purified in a membrane bio reactor (MBR) and is used as a microbiological safe liquid fertilizer for urban farming. The separated dry phase from toilets is collected in a storage and pre-fermentation tank where it is mixed with charcoal powder and EM and undergoes an odorless lactic acid fermentation process. Dehydrated surplus sludge from MBR systems and organic wastes from urban farming and the kitchen are also collected and mixed with charcoal powder and EM. After the fermentation processes, the different solids are mixed in specific proportions and pass through a vermicomposting process without significant nutrient losses. The final product is Terra Preta, a nutrient rich black organic soil [28]. The Terra Preta is used in urban farming and horticulture on building, property and neighborhood levels.
The integration of energy and technical systems is also addressed in this decentralized water and resource recycling system. Semi-transparent PV panels installed on the glasshouse rooftop of building 2 and on the roof of building 3 generate electrical energy. Surplus electricity from PV panels that is not directly consumed at the property level is stored in batteries and used as source of power when the local demand exceeds the production capacity. Surplus electricity is fed into the public grid to supply electricity to the neighborhood. Electricity is used in the building for lighting, water treatment systems, ventilation systems, heat pumps for cooling, heating and hot water supply, and other electric appliances.
The capacity of the grey water treatment system and the storage capacity for the service water were estimated based on the number of building users. In Table 4, the predicted number of visitors and workers in the converted IC property are listed. It was assumed that 100 people work in the IC per day. The estimated number of visitors per day ranges between 570 and 670. The maximum number of visitors is the number estimated to be utilizing the facilities in the converted IC during the warm seasons of the year, from April to September. Increased numbers of indoor and outdoor events and activities, such as a market and seminars, could be held on the same day. The minimum number of visitors per day was assumed to be 270, on days when no events would take place, e.g., during the week in the cold season of the year, from November to February.
Therefore, the average number of building users per day was assumed to be 400. As discussed in Section 3.2.1, the average drinking water supply per person a day in Yeongdeungpo-Gu was 344 L. However, this data includes also non-domestic water demand such as industrial, agriculture and commercial water uses. Accordingly, data for domestic water use in Seoul [31] was used to calculate the water demand for different applications in the converted IC. Since the data from the literature is based on domestic water use, it had to be converted to the non-domestic water uses of the converted IC. Building users were considered to be mainly short-term visitors or workers. It was assumed that the water use per building user and day is 50% of the domestic water use. The average water demand calculation of the IC is therefore based on 400 people with a consumption of 104 L water per day. The resulting average water consumption in the converted IC is accordingly 41,600 L/day and 1734 water L per hour.
The resulting wastewater will be collected on site. The treatment system will operate during the day using the electricity generated by the PV generators. During summer, the water treatment system can be operated for approximately 14 h per day. During the winter, the system can be operated only for 10 h. Therefore, the wastewater treatment tanks should have a minimum capacity of 24,276 L. Considering the wastewater demand during the peak season as well as maintenance and potential malfunctions, the storage volumes for the untreated raw water and for the purified service water were doubled, i.e., the wastewater treatment system was designed with a daily capacity of 50,000 L.
3.4. Decentralized Stormwater Management Concept and Simulation Parameters
The main strategies for the decentralized management of stormwater on the converted IC site are (i) stormwater collection, storage and use, as discussed before in Section 3.3.3; and (ii) retention and infiltration of surplus stormwater. The main retention and infiltration elements of the converted IC are underground concrete tanks with highly water permeable bottoms that facilitate the percolation of collected and retained stormwater into the ground. These infiltration facilities have been located under the basement foundation plates of the newly constructed buildings 2 and 3 (Figure 13). The retention and infiltration tanks have a net storage height of 2.45 m and were designed to ensure they have no effect on the building foundations.
Surplus rainwater from the roof surfaces of buildings 1 and 2 that is not collected for use will be drained into the retention tanks. The roof and walls of building 3 were designed for water retention and with a substrate layer of approximately 10 cm. The retained water will improve the evaporation ratio of the converted IC. In addition, the traffic and courtyard areas were designed to be water permeable so as to improve the overall rainwater retention, infiltration and evaporation ratio (Figure 13). Therefore, the courtyard landscaping also includes small infiltration ditches (Figure 13).
The collection of stormwater from roofs and impermeable courtyard and traffic areas will be executed through a drainage system. The overflow from permeable surfaces will also be directed to the drainage system that is connected to the stormwater retention and infiltration system. The underground retention and infiltration facilities and the decentralized water treatment and recycling system are equipped with overflows that will be connected to the public sewer system. The overflow is only installed for emergency purposes because the decentralized wastewater and stormwater management systems in the converted IC are dimensioned to avoid overflows.
The stormwater overflow volume, the number of overflow events, and the stormwater direct outflow to the stream (via the public sewer), as well as the evaporated, retained and infiltrated stormwater for the existing and the converted IC in relation to the total gross precipitation and stormwater volume were all designed using STORM XXL. The simulation was executed for a period of five years, referencing statistical rain data from a local rain measurement station in Seoul ranging from 01.01.2009 to 31.12.2014. The results were as illustrated in Table 5.
The simulation results show that the retention and infiltration systems under the newly constructed buildings 2 and 3 could completely prevent the occurrence of overflow events in the complex. The retention and infiltration of collected stormwater in the ground can effectively prevent the runoff and potential flooding and pollution of the public sewage system and the receiving surface water bodies.
Furthermore, the evaporation rate of the converted IC has been increased in comparison to the existing IC. The presence of permeable pavements and infiltration ditches in the courtyard and urban horticulture and agriculture contribute significantly to higher potential evaporation and evapotranspiration rates and the related improvement of the local microclimate. The increased retention and infiltration of stormwater contributes to the effective prevention of flooding and the recharge of groundwater.
4. Discussion of Stormwater Retention and Infiltration Potentials
The STORM stormwater management simulation results for the converted IC supported the research thesis, which stated that decentralized stormwater management solutions can effectively avoid the discharge of stormwater from the property and even during extreme precipitation events. The implementation of permeable pavements and the construction of retention facilities under the basement of buildings can be implemented without limiting the uses of the converted IC buildings. Furthermore, the construction of underground retention and infiltration facilities can be combined with the building foundation constructions. Accordingly, the ground surface dimensions of the underground retention and infiltration facilities were based on the outside wall positions of buildings 2 and 3’s basements. The volume was determined by multiplication of the total surface area with an overflow height of 2.45 m.
A more economical approach, based on the minimization of the monetary cost for the construction of the decentralized stormwater management facilities, would require the determination of the minimum required total infiltration area and retention volume for optimization of groundwater recharge ratio and complete prevention of overflow and discharge events from the property. Accordingly, an analysis of the linear decrease of storm overflow events based on the progressive increase of the cumulative retention volume and infiltration area, considering the same parameters for the sealed and unsealed surfaces of the compound, was executed. The analysis was produced through iterated simulations calculating the number of outflow events on the basis of increasing retention surfaces with an unchanged retention volume depth of 2.45 m. The simulation results illustrate an inverse proportion between the dimensions of the retention and infiltration surfaces positioned below the basement slabs of the newly constructed buildings and the amount of outflow from the infiltration volumes to the sewage system (Figure 14a) and from the sewage system to the stream (Figure 14b).
The simulation analysis illustrates that an overall volume of approximately 1088 m3, corresponding to three retention/infiltration volumes with respective length and width square dimensions of 11 × 11 m, 15 × 15 m and 12 × 12 m, a slope of 30% and a depth of 2.45 m, would be sufficient to completely avoid stormwater overflows of the retention and infiltration facilities to the public sewage. The volume of 1088 m3 corresponds to only 39.30% of the maximum retention volume of 2767.77 m3 that was considered underneath the basement slabs of the newly constructed buildings and evaluated for the stormwater simulation of the converted IC in Section 3.4. Additionally, the calculation of the percentage of stormwater overflow from the sewage system to the stream (Figure 15) further confirmed a constant reduction of approximately 10% of stormwater overflow volume per meter of swale surface dimensions increase.
According to the presented research, design and the rainwater management simulation results for the exemplary IC conversion, decentralized stormwater management measures in the converted IC could also be used for the retention of stormwater from neighboring areas. Approximately 40% of the realizable retention volume would be sufficient for the realization of a stormwater discharge free IC, and 60% would be available for the retention and infiltration of stormwater from neighboring areas.
The research results in terms of stormwater overflow reduction through infiltration support published research results on the simulation and advantages of decentralized water management systems. In particular, this research confirms and expands previous research on the retention of stormwater and the reduction of peak stormwater runoff using decentralized systems. Stormwater peak runoff reduction in Kuala Lumpur, Malaysia, using low impact development systems (LID) consisting of vegetated swale and rain garden could only be reduced by up to 19% (for rainfall of between 70 and 90 mm) and up to 27% (for rainfall of up to 70 mm) [42].
Results confirm that un-sealing and expansion of permeable topsoil in urban zones can contribute to the reduction of stormwater runoff and the resulting flooding events. Furthermore, this research provided extended scope compared with previously published investigations. The progressive overflow and runoff reduction of stormwater was analyzed based on the variable dimensioning of a modular decentralized rainwater management system. The result was a flexible dimensioning system that can be adapted to specific city contexts with different natural and anthropogenic basic conditions, such as climate, soil and groundwater properties, the proportions and properties of built-up areas, and free spaces. This research included the provision of architectural and technical principles and a modular adaptable system for the integration of decentralized water, sanitation and stormwater management systems for the improvement of urban sustainability and water resilience.
The results of this research illustrate that decentralized stormwater management systems can effectively contribute to the climate resilience and sustainability of centralized water management systems. Therefore, the results contribute to the clarification of questions regarding the opportunities and challenges caused by the coexistence of decentralized and centralized urban water management systems discussed in recent literature [43,44].
The technical solutions for the improvement of water use efficiency at property and district levels implemented in this research improve the resilience of centralized water supply systems and available renewable water resources. The integration of environmentally sound technologies for separated drainage, collection, retention and infiltration of stormwater contributes to a proper function of the connected, centralized urban drainage and wastewater management system. At building and property levels, the decentralized systems facilitate the closing of the urban water cycle and the creation of synergies. Separated sewage and nutrient streams can be treated and reused according to their properties, for drinking water, service water and irrigation of horticulture and agriculture.
Further beneficial effects to the neighboring communities are related to sustainable wastewater and community-based organic waste management and urban agriculture. However, the investigation of community-based project management and organization of citizens for the operation of programs and facilities which were integrated in this converted IC were not addressed and are beyond the scope of this study. The management and reuse of water, organic wastes and food production should be incorporated in the broader framework of initiatives that aim for participatory and trans-disciplinary regeneration of urban districts [45]. The quantification of monetary costs for the construction, operation and maintenance of decentralized water management facilities and the possible savings that could be achieved through substitution of centralized management systems were beyond this study’s scope. Accordingly, economic issues of urban regeneration with decentralized water management systems in comparison with centralized systems and the transformation potential needs to be addressed in future research.
5. Conclusions
This research discussed flood resilient and sustainable urban redevelopment potential using the example of the conversion of an exemplary IC in Seoul. Due to the natural and anthropogenic basic conditions, such as the extreme precipitation, high flood risks and comparable high building density in the investigated neighborhood, the findings of this research are generally transferable to national and international urban environments. The following four integrated sustainable strategies were applied:
- (i)
- Preservation, renovation and remodeling of existing IC buildings.
- (ii)
- Demolition of existing IC buildings and construction of new buildings on the footprints of existing buildings with additional underground and aboveground floors.
- (iii)
- Increase of floor area ratio and sustainability-related public and private programs in the converted IC in comparison to the existing IC.
- (iv)
- Creation of a stormwater and wastewater discharge-free property that contributes also to the restoration of a nature oriented urban water cycle in its neighborhood.
The study demonstrated the long-term efficacy and flexibility and the multiple advantages of renovation projects for ex-industrial complexes tied with an integrated and multiscale design approach. The research provides therefore an in-depth analysis and a good practice case to address the complexity of urban and architectural sustainable design with practical beneficial results both for the environment and society.
Author Contributions
All authors contributed equally to the original draft preparation, writing and editing of this article. All authors have read and agreed to the published version of the manuscript.
Funding
This research was supported by the Basic Science Research Program through the National Research Foundation of Korea (NRF) and funded by the Ministry of Education (2018R1D1A1B07050989).
Acknowledgments
The authors thank Harald Sommer, Adrian Labonde, and the engineering company Sieker mbH, for their support and provision of STORM XXL software, and Kyung-Ho Kwon for his assistance in the definition of the simulation model and parameters for stormwater management in Korea.
Conflicts of Interest
The authors declare no conflicts of interests.
References
- Shin, S.; Park, C. Analyzing Relationships between Land Use Characteristics and Flood Damage Areas: The Case of Seoul. Korea Spat. Plan. Rev. 2014, 81, 3–20. [Google Scholar]
- Choi, G. Changes in Means and Extreme Events of Changma-Period Precipitation Since mid-Joseon Dynasty in Seoul, Korea. J. Korean Geogr. Soc. 2016, 51, 23–40. [Google Scholar]
- Seo, K.; Lee, J.; Ha, K.; Sangwook, Y.; Lim, Y.; Lee, G.; Guk, J.; Jeong, J.; Jiyoung, K. Changma White Paper; Korea Meteorological Administration: Seoul, Korea, 2011; p. 268. [Google Scholar]
- Lee, S.-W.; Choi, G.; Kim, B.-J. Spatial and Temporal Characteristics of Summer Extreme Precipitation Events in the Republic of Korea, 2002~2011. J. Korean Assoc. Reg. Geogr. 2014, 20, 393–408. [Google Scholar]
- DOOSAN Corporation. Severe Rain Storm. Available online: http://www.doopedia.co.kr/doopedia/master/master.do?_method=view&MAS_IDX=101013000755138 (accessed on 30 August 2018).
- Shin, S.; Lee, S.; Park, M. Extreme Weather-Responding Flood Prevention Stratagy of Seoul; The Seoul Institute: Seoul, Korea, 2011; p. 23. [Google Scholar]
- Ji Soo, K.; Hyo Hyun, S.; Gwang Yong, C. Spatial Patterns of Urban Flood Vulnerability in Seoul. Korean Assoc. Reg. Geogr. 2013, 19, 615–626. [Google Scholar]
- Kim, Y.; Shin, S. Developing a Risk Assessment Method for the Mitigation of Urban Disasters; The Seoul Institute: Seoul, Korea, 2009; p. 265. [Google Scholar]
- Korean Ministry of Environment; Water Supply and Drainage Policy Department. 2016 Statistics of Sewerage; Ministry of Environment: Sejong, Korea, 2017.
- Kato, T.; Endo, A. Contrasting Two Dimensions of Disaster-Induced Water-Shortage Experiences: Water Availability and Access. Water 2017, 9, 982. [Google Scholar] [CrossRef] [Green Version]
- Seong, J.; Park, J. A Study on the Definition Changing of Industrial Heritage. J. Archit. Hist. 2012, 21, 65–81. [Google Scholar]
- Kim, M.; Jung, H.; Hwang, M. A Study on Spatial Distributions of Different Manufacturing Processes of Major Manufacturing Industries in Seoul; The Seoul Institute: Seoul, Korea, 2016; p. 108. [Google Scholar]
- Ko, J. A Study on the Repairing Techniques and Preservation Types of Korean Modern Architecture; DanKook University: Gyeonggi-do, Korea, 2017. [Google Scholar]
- Lee, S.; Yang, H.; Chang, E. Evaluation of Local Capacity for Reusing Industrial Heritage; Korea Research Institute for Human Settlements: Anyang, Korea, 2008. [Google Scholar]
- You, H.; Kim, J.; Shin, H. A Study on the Active Application of Conversion Design for Utilizing the Unused Spaces of Modern Industrial Heritage. J. Korean Inst. Spat. Des. 2013, 23, 12. (In Korean). Available online: http://kiss.kstudy.com/thesis/thesis-view.asp?key=3151362 (accessed on 5 November 2018).
- Korean Cultural Heritage Administration. Cultural Heritage Protection Act; Cultural Heritage Administration: Daejon, Korea, 2012. [Google Scholar]
- Lee, S. ‘Future Heritage’ May Give New Life to Old Spaces. Korea Joongang Daily. 13 February 2014. Available online: http://mengnews.joins.com/view.aspx?aid=2984846 (accessed on 5 November 2018).
- Son, C.J. A Study on Urban Regeneration Process through Collaborative Governance—The Case of Sewoon Arcade; Seoul National University: Seoul, South Korea, 2018. [Google Scholar]
- Kim, D.; Ryu, J.; Cha, J.G.; Jung, E.H. Korea’s urban regeneration project on the improvement of urban micro climate: A focal study on the case of Changwon City. Glob. J. Hum. Sci. Geogr. Geo-Sci. Environ. 2013, 13, 26–37. [Google Scholar]
- Lee, K.; Yhang, W. Specialized Area Design of Modern Industrial Heritage for Cultural City Regeneration. J. North-East Asian Cult. 2014, 41, 15. [Google Scholar] [CrossRef]
- United Nations. Transforming our World: The 2030 Agenda for Sustainable Development; United Nations: New York, NY, USA, 2015. [Google Scholar]
- Seoul Metropolitan Government. Seoul Future Heritage List (2017/12); Seoul Metropolitan Government: Seoul, Korea, 2017.
- Schuetze, T.; Chelleri, L. Integrating Decentralized Rainwater Management in Urban Planning and Design: Flood Resilient and Sustainable Water Management Using the Example of Coastal Cities in The Netherlands and Taiwan. Water 2013, 5, 593–616. [Google Scholar] [CrossRef] [Green Version]
- Schuetze, T.; Santiago-Fandiño, V. Terra Preta Sanitation: A Key Component for Sustainability in the Urban Environment. Sustainability 2014, 6, 7725–7750. [Google Scholar] [CrossRef] [Green Version]
- Correlje, A.; Schuetze, T. Every Drop Counts, 1st ed.; United Nations Environment Programme: Nairobi, Kenya, 2008; p. 197. [Google Scholar]
- Graber, A.; Durno, M.; Gaus, R.; Mathis, A.; Junge, R. UF001 LokDepot, Basel: The first commercial rooftop aquaponic farm in Switzerland. In Proceedings of the International Conference on Vertical Farming and Urban Agriculture (VFUA 2014), Nottingham, UK, 26 September 2014; p. 30. [Google Scholar]
- Million, A.; Buergov, G.; Steglich, A. Roof Water-Farm Urban Water for Urban Agriculture; Universitätsverlag der TU Berlin: Berlin, Germany, 2018. [Google Scholar]
- De Gisi, S.; Petta, L.; Wendland, C. History and Technology of Terra Preta Sanitation. Sustainability 2014, 6, 1328–1345. [Google Scholar] [CrossRef] [Green Version]
- Sieker, H.; Sommer, H.; Ladonde, A. Storm XXL, 3852; Sieker Software: Hoppegarten, Germany, 2013. [Google Scholar]
- Froehler, R.; Huber, C. Space requirments for technical service. In Interiors Construction Manual; Hausladen, G., Tichelmann, K., Eds.; Birkhaeuser Architecture: Berlin/Heidelberg, Germany, 2010; p. 28. [Google Scholar]
- Schuetze, T.; Santiago-Fandiño, V. Quantitative Assessment of Water Use Efficiency in Urban and Domestic Buildings. Water 2013, 5, 1172–1193. [Google Scholar] [CrossRef] [Green Version]
- Padilla, M.; Mok, S.; Raj, H.; Latypov, V.; Bescansa, M. Urban farming in the city of tomorrow. In Assessing the Global Landscape on Urban Food and Resource Production with the Focus on Indoor Plant and Microalgae Cultivation; Fraunhofer Institute for Industrial Engineering IAO: Stuttgart, Germany, 2018; p. 67. [Google Scholar]
- Yeongdeungpo-Gu. Yeongdeungpo-Gu Statistic. 2016; (In Korean). Available online: https://www.ydp.go.kr/www/index.do (accessed on 7 November 2018).
- Korean Statistical Information Service (KOSIS), Population Statistic of Korea (2011~2018.10). (In Korean). Available online: http://kosis.kr/statHtml/statHtml.do?orgId=101&tblId=DT_1B04005N&vw_cd=MT_ZTITLE&list_id=A6&seqNo=&lang_mode=ko&language=kor&obj_var_id=&itm_id=&conn_path=MT_ZTITLE (accessed on 17 November 2018).
- Korean Meteorological Administration (KMA), Precipitation Statistics for Seoul—1904–2018. (In Korean). Available online: https://data.kma.go.kr/stcs/grnd/grndRnList.do?pgmNo=69 (accessed on 20 July 2018).
- Seoul Metropolitan Government, Urban Planning Department Seoul Permeability of Ground. 2015. Available online: http://data.seoul.go.kr/dataList/datasetView.do?infId=356&srvType=S&serviceKind=2 (accessed on 15 December 2018).
- Choi, Y. Seoul’s Water Management Policy. Available online: https://seoulsolution.kr/ko/content/%EC%84%9C%EC%9A%B8%EC%9D%98-%EB%AC%BC%EA%B4%80%EB%A6%AC-%EC%A0%95%EC%B1%85 (accessed on 17 December 2018).
- National Spatial Data Infrastructure Portal. National Spatial Data Infrastructure Map of Seoul. (In Korean). Available online: http://www.nsdi.go.kr/lxportal/ (accessed on 20 July 2018).
- Seoul Metropolitan Government Geotechnical Information System, Seoul Soil Information. 2012. Available online: http://surveycp.seoul.go.kr:8080/Soil/views/FlexViewer/flexSoilViewer.jsp?config=config_soil (accessed on 20 November 2018).
- Seoul Metropolitan Government. Soil Layer Analysis for the Mullae District. (In Korean). Available online: http://surveycp.seoul.go.kr/ (accessed on 21 July 2018).
- Otterpohl, R.; Glaser, B.; Klimek, F.; Bettendorf, T.; Wendland, C.; Schuetze, T.; Buzie, C.; Koerner, I.; Yemaneh, A.; Itchon, G.; et al. Terra Preta Sanitation 1-Background, Principles and Innovations; Deutsche Bundesstiftung Umwelt (DBU): Osnabrück, Germany, 2015. [Google Scholar]
- Rezaei, A.R.; Ismail, Z.; Niksokhan, M.H.; Dayarian, M.A.; Ramli, A.H.; Shirazi, S.M. A Quantity–Quality Model to Assess the Effects of Source Control Stormwater Management on Hydrology and Water Quality at the Catchment Scale. Water 2019, 11, 1415. [Google Scholar] [CrossRef] [Green Version]
- Sapkota, M.; Arora, M.; Malano, H.; Moglia, M.; Sharma, A.; George, B.; Pamminger, F. An Overview of Hybrid Water Supply Systems in the Context of Urban Water Management: Challenges and Opportunities. Water 2015, 7, 153–174. [Google Scholar] [CrossRef] [Green Version]
- Siekmann, T.; Siekmann, M. Resilient urban drainage—Options of an optimized area-management. Urban Water J. 2015, 12, 44–51. [Google Scholar] [CrossRef]
- Fischer, G.; Ostwald, J. Seeding, evolutionary growth, and reseeding: Enriching participatory design with informed participation. In Proceedings of the participatory design conference (PDC’02), Malmo, Sweden, 23–25 June 2002; pp. 135–143. [Google Scholar]
Figure 1.
(a) Flooded areas in Seoul in 1987, 1990, 1998, 2001, 2010 and 2011 (Translated) [6]; (b) flood vulnerable areas in Seoul: areas are assigned to flood vulnerability classes from Level 1 (least vulnerable areas) to Level 5 (most vulnerable areas) [7].

Figure 2.
Location of Mullae-Dong 1 Ga, within Mullae-Dong, and Yeongdeungpo-Gu, Seoul.

Figure 3.
(a) Monthly rainfall and potential evaporation on average between 2000 and 2015 and (b) exemplary dry year in Seoul South Korea in 2015 (graphics produced by the authors on the basis of data collected from the Korean Meteorological Agency and the National Statistical Service [35]).
Figure 3.
(a) Monthly rainfall and potential evaporation on average between 2000 and 2015 and (b) exemplary dry year in Seoul South Korea in 2015 (graphics produced by the authors on the basis of data collected from the Korean Meteorological Agency and the National Statistical Service [35]).

Figure 4.
(a): permeability of ground in Seoul and (b) Mullae-Dong (smaller black encircled area) in Yeongdeungpo-Gu (larger black encircled area).
Figure 4.
(a): permeability of ground in Seoul and (b) Mullae-Dong (smaller black encircled area) in Yeongdeungpo-Gu (larger black encircled area).

Figure 5.
Map with the Mullae-Dong 1 Ga area within the highlighted Mullae-Dong district. Dorim stream and a tributary from the southeast (blue) and green areas are also highlighted. The exemplary IC is located at the southwestern boarder of Mullae-Dong 1 Ga, next to the tributary of the Dorim stream (highlighted turquoise) [38].
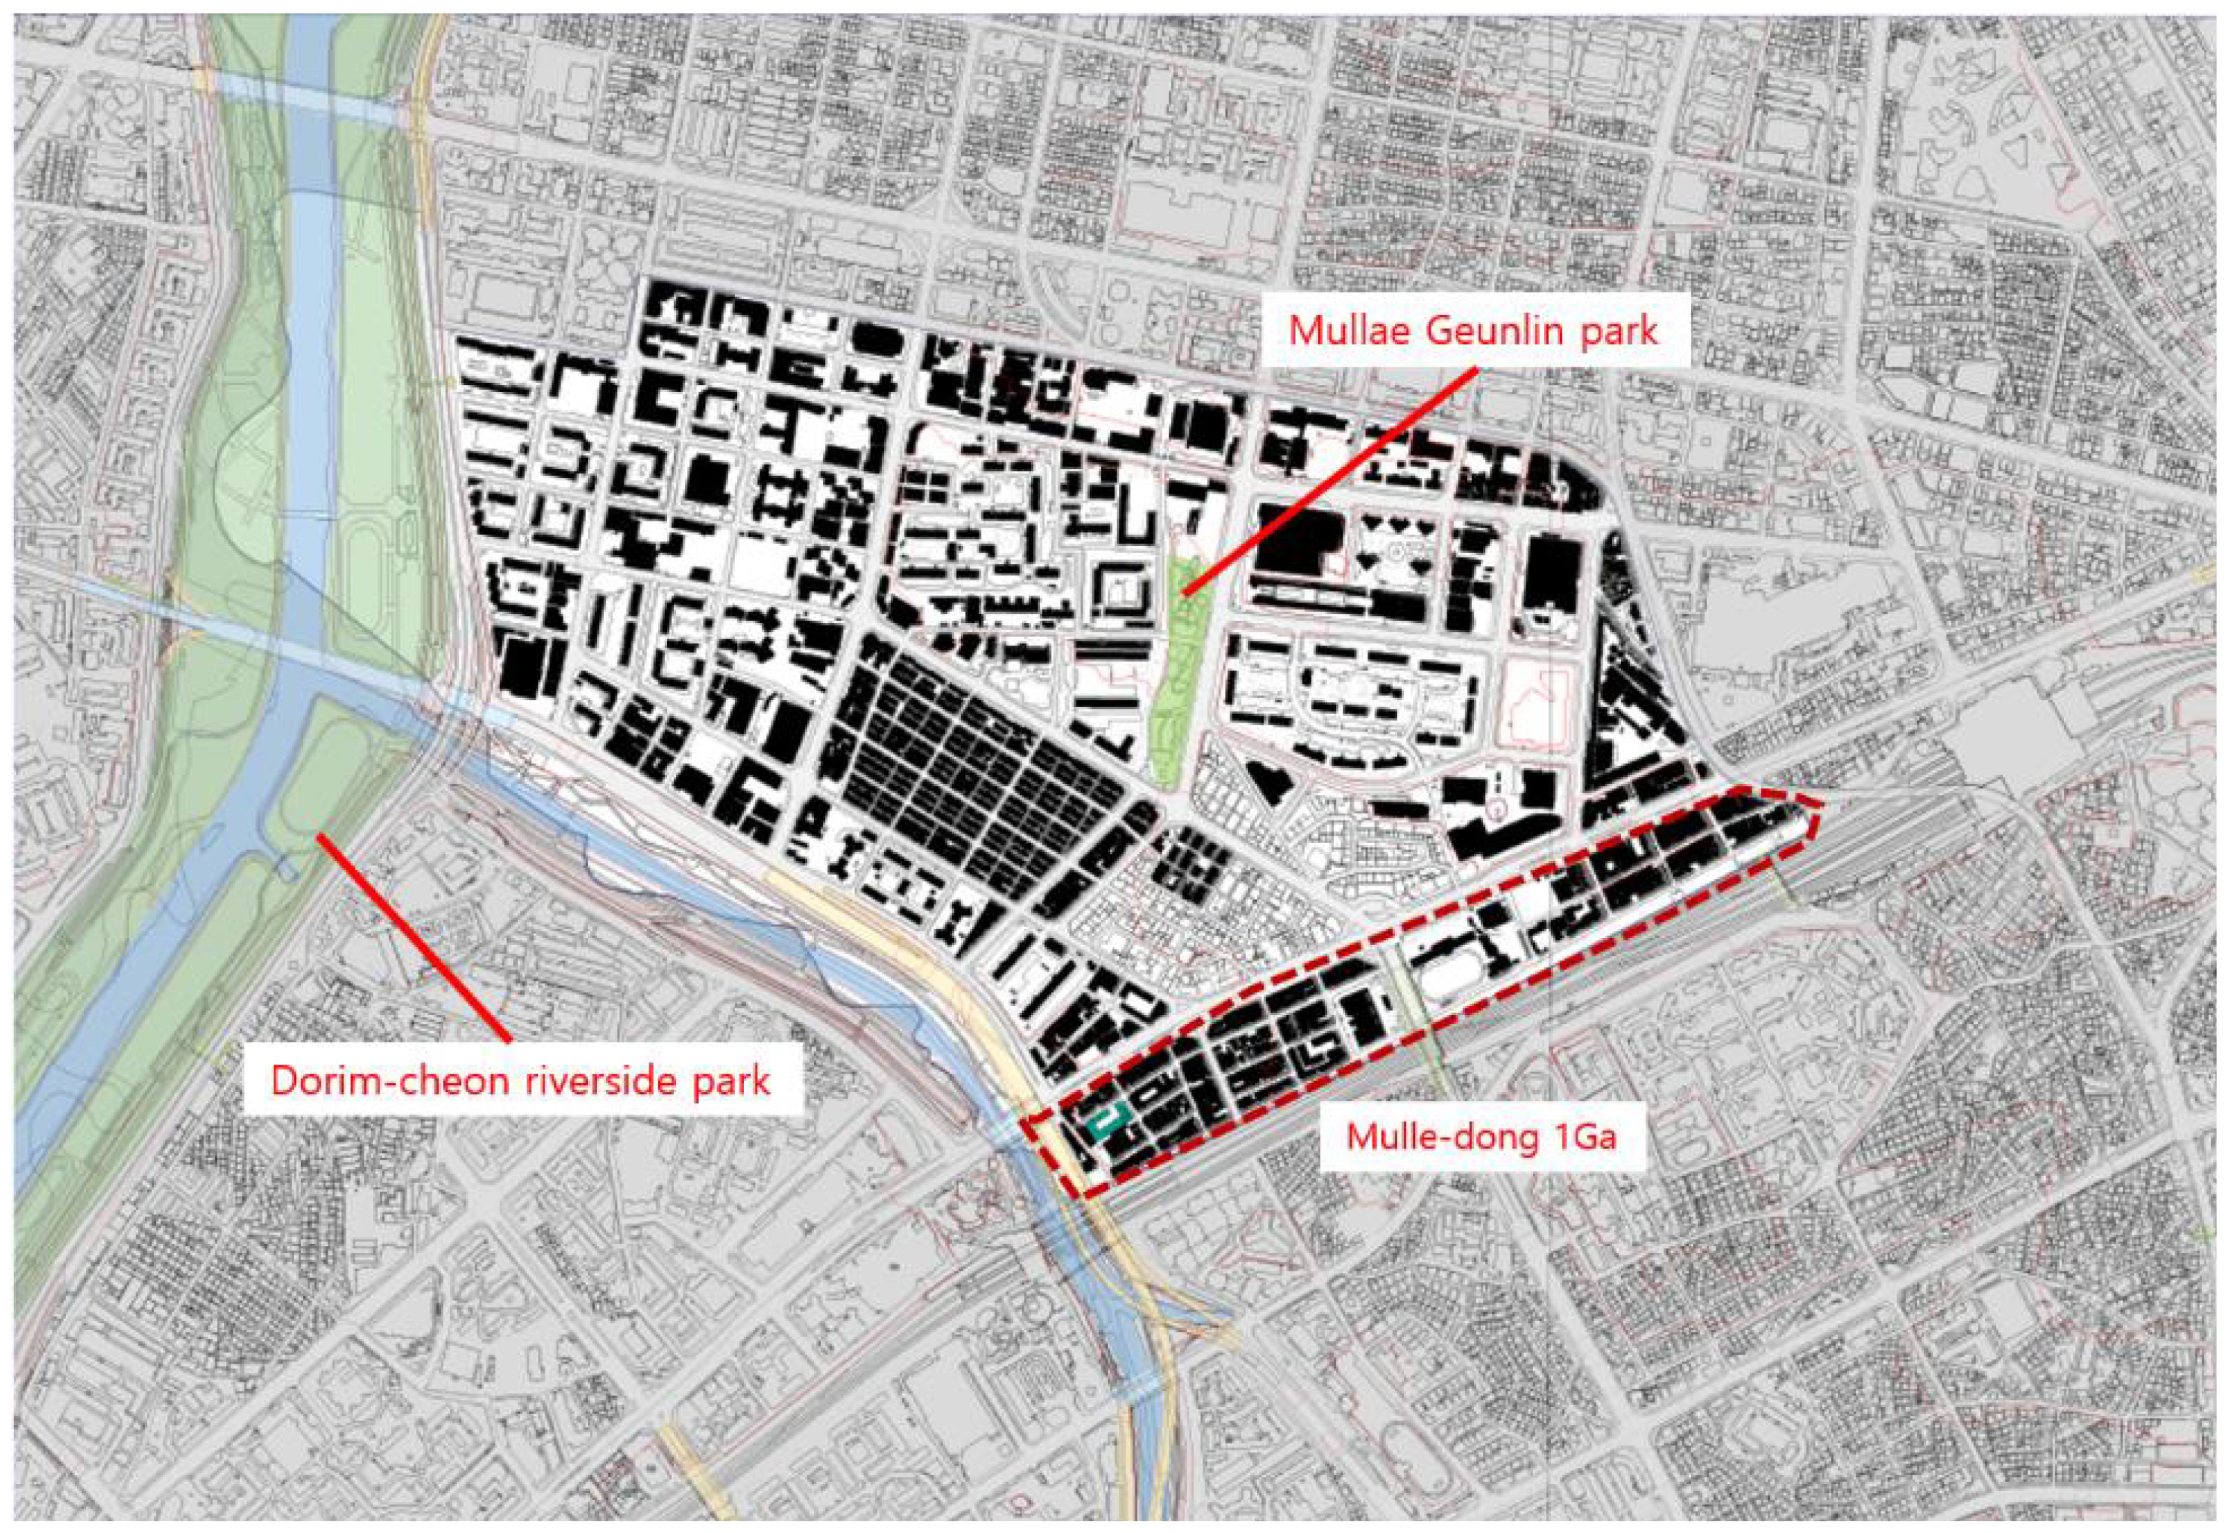
Figure 6.
(a) Site map of the exemplary IC (P2 - light grey) and its neighborhood (P1 and P3—dark grey). (b) Section of the ground from P1 over P2 to P3 with specification of soil types and fluctuating ground water levels and its location in m related to the seal level (0 m) [40].
Figure 6.
(a) Site map of the exemplary IC (P2 - light grey) and its neighborhood (P1 and P3—dark grey). (b) Section of the ground from P1 over P2 to P3 with specification of soil types and fluctuating ground water levels and its location in m related to the seal level (0 m) [40].

Figure 7.
(a) Site plan of the exemplary IC and its direct neighborhood with location of existing water infrastructure components: fire hydrants, mixed wastewater sewage manholes, water supply manholes, drainage points and stormwater sewage manholes. (b) Exemplary photo illustrating the potential blocking of stormwater gutters and the limitation of its drainage capacity. (c) Map of storm water runoff and exemplary positions of the storm water flow in the urban context of the IC.


Figure 8.
Site plan of the existing exemplary IC and its neighborhood. The red dotted line indicates the site border. The specific buildings are indicated with the numbers from 1 to 6.
Figure 8.
Site plan of the existing exemplary IC and its neighborhood. The red dotted line indicates the site border. The specific buildings are indicated with the numbers from 1 to 6.
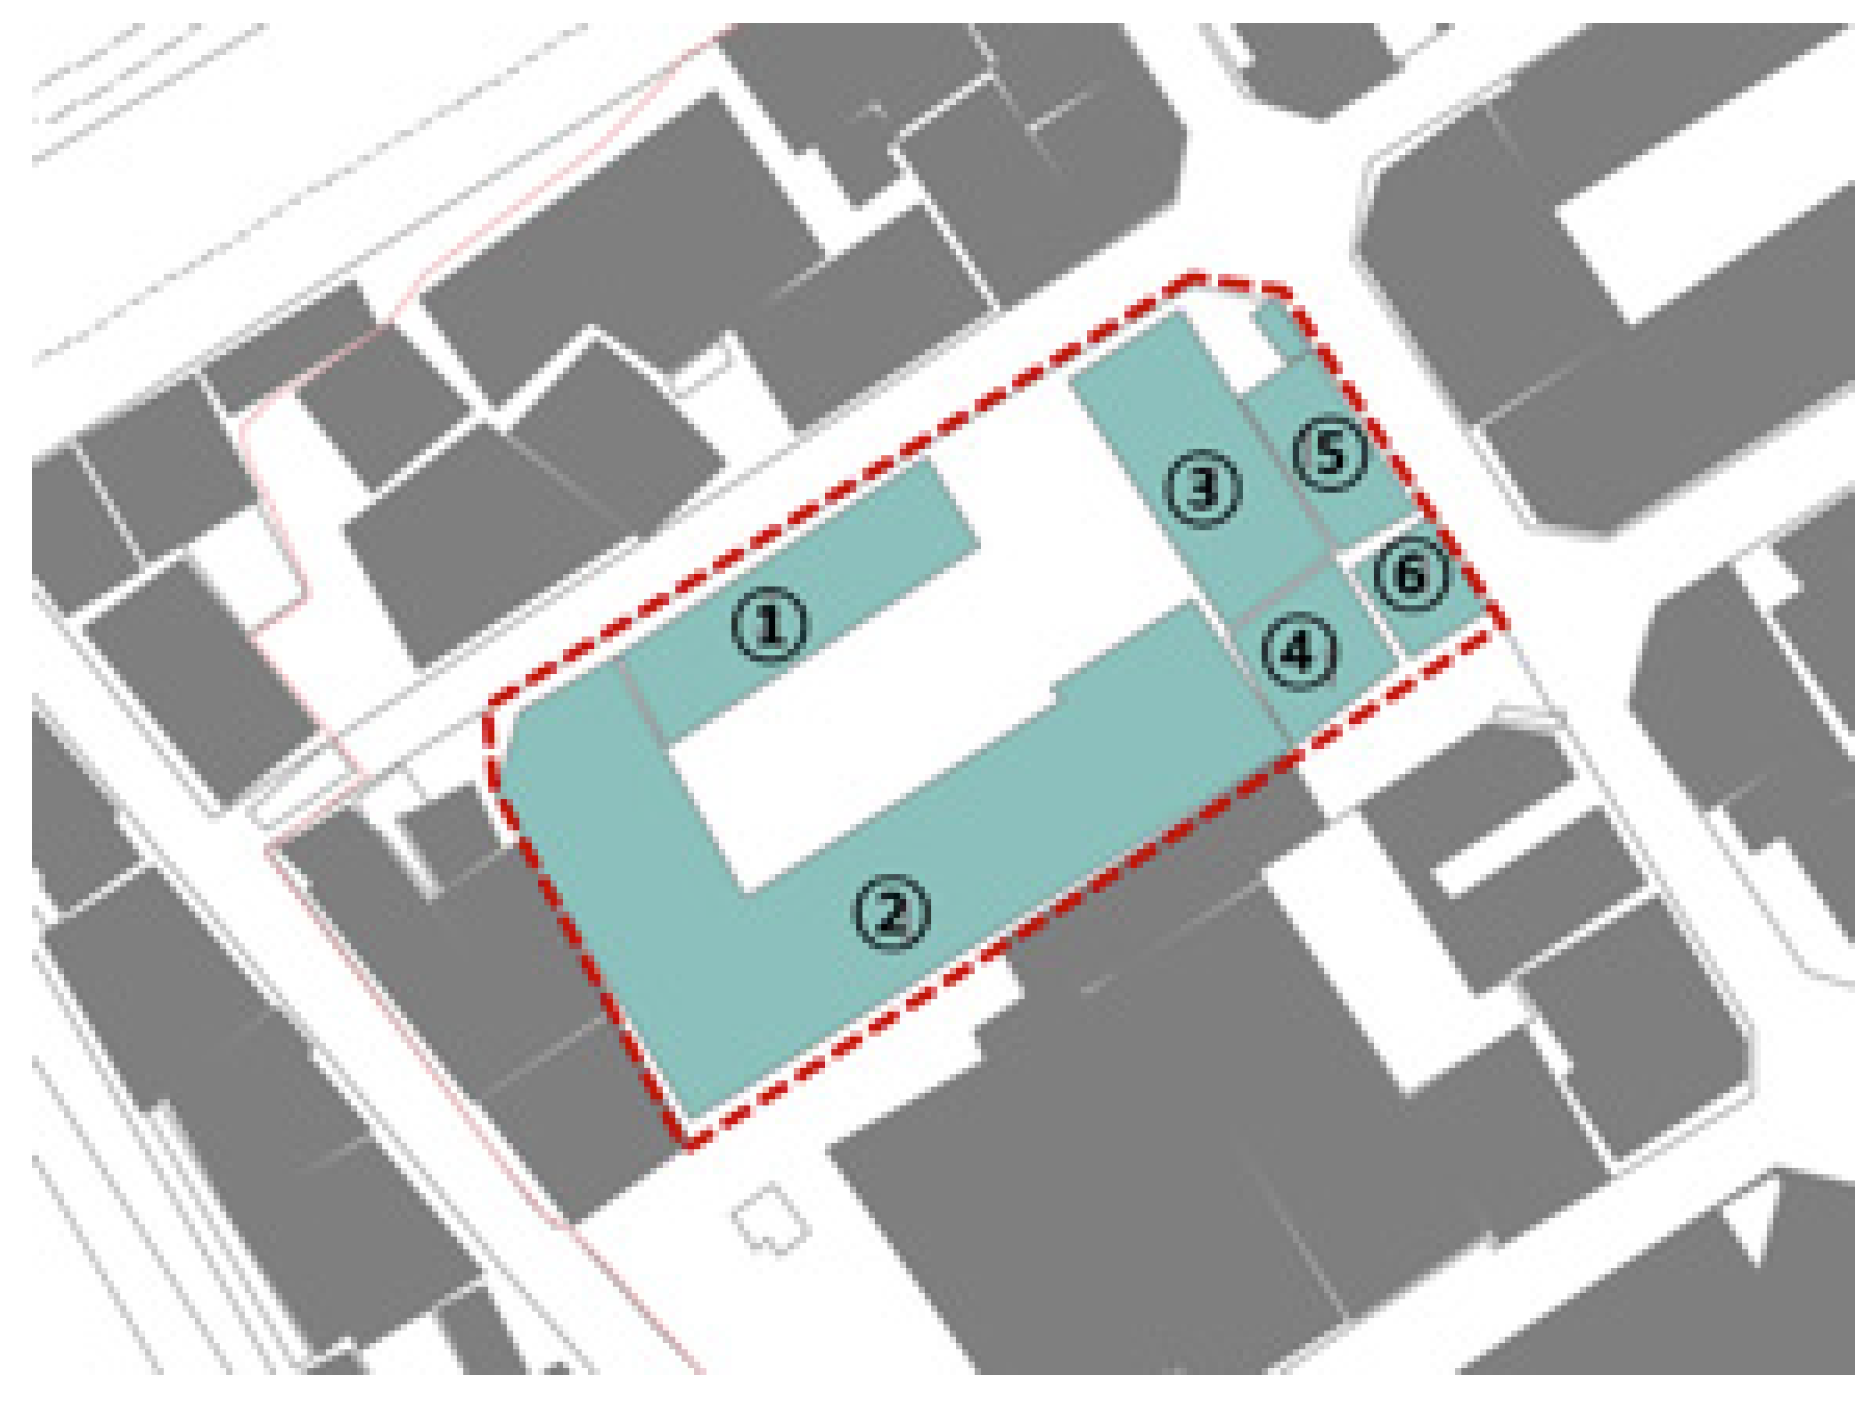
Figure 9.
Photos of the existing façades of buildings 1 to 6.

Figure 10.
Floor plans of the existing and renovated buildings of the exemplary IC: (a) ground floor plan; (b) 1st floor plan of existing buildings 1 to 6; (c) ground floor plan of the new buildings 1, 2 and 3.
Figure 10.
Floor plans of the existing and renovated buildings of the exemplary IC: (a) ground floor plan; (b) 1st floor plan of existing buildings 1 to 6; (c) ground floor plan of the new buildings 1, 2 and 3.

Figure 11.
Renovated IC building plans: (a) B1 plan; (b) GF plan with indication of infiltration ditches in blue; (c) 1st floor plan; (d) 2nd floor plan; (e) roof plan; (f) isometric view of the converted IC.
Figure 11.
Renovated IC building plans: (a) B1 plan; (b) GF plan with indication of infiltration ditches in blue; (c) 1st floor plan; (d) 2nd floor plan; (e) roof plan; (f) isometric view of the converted IC.
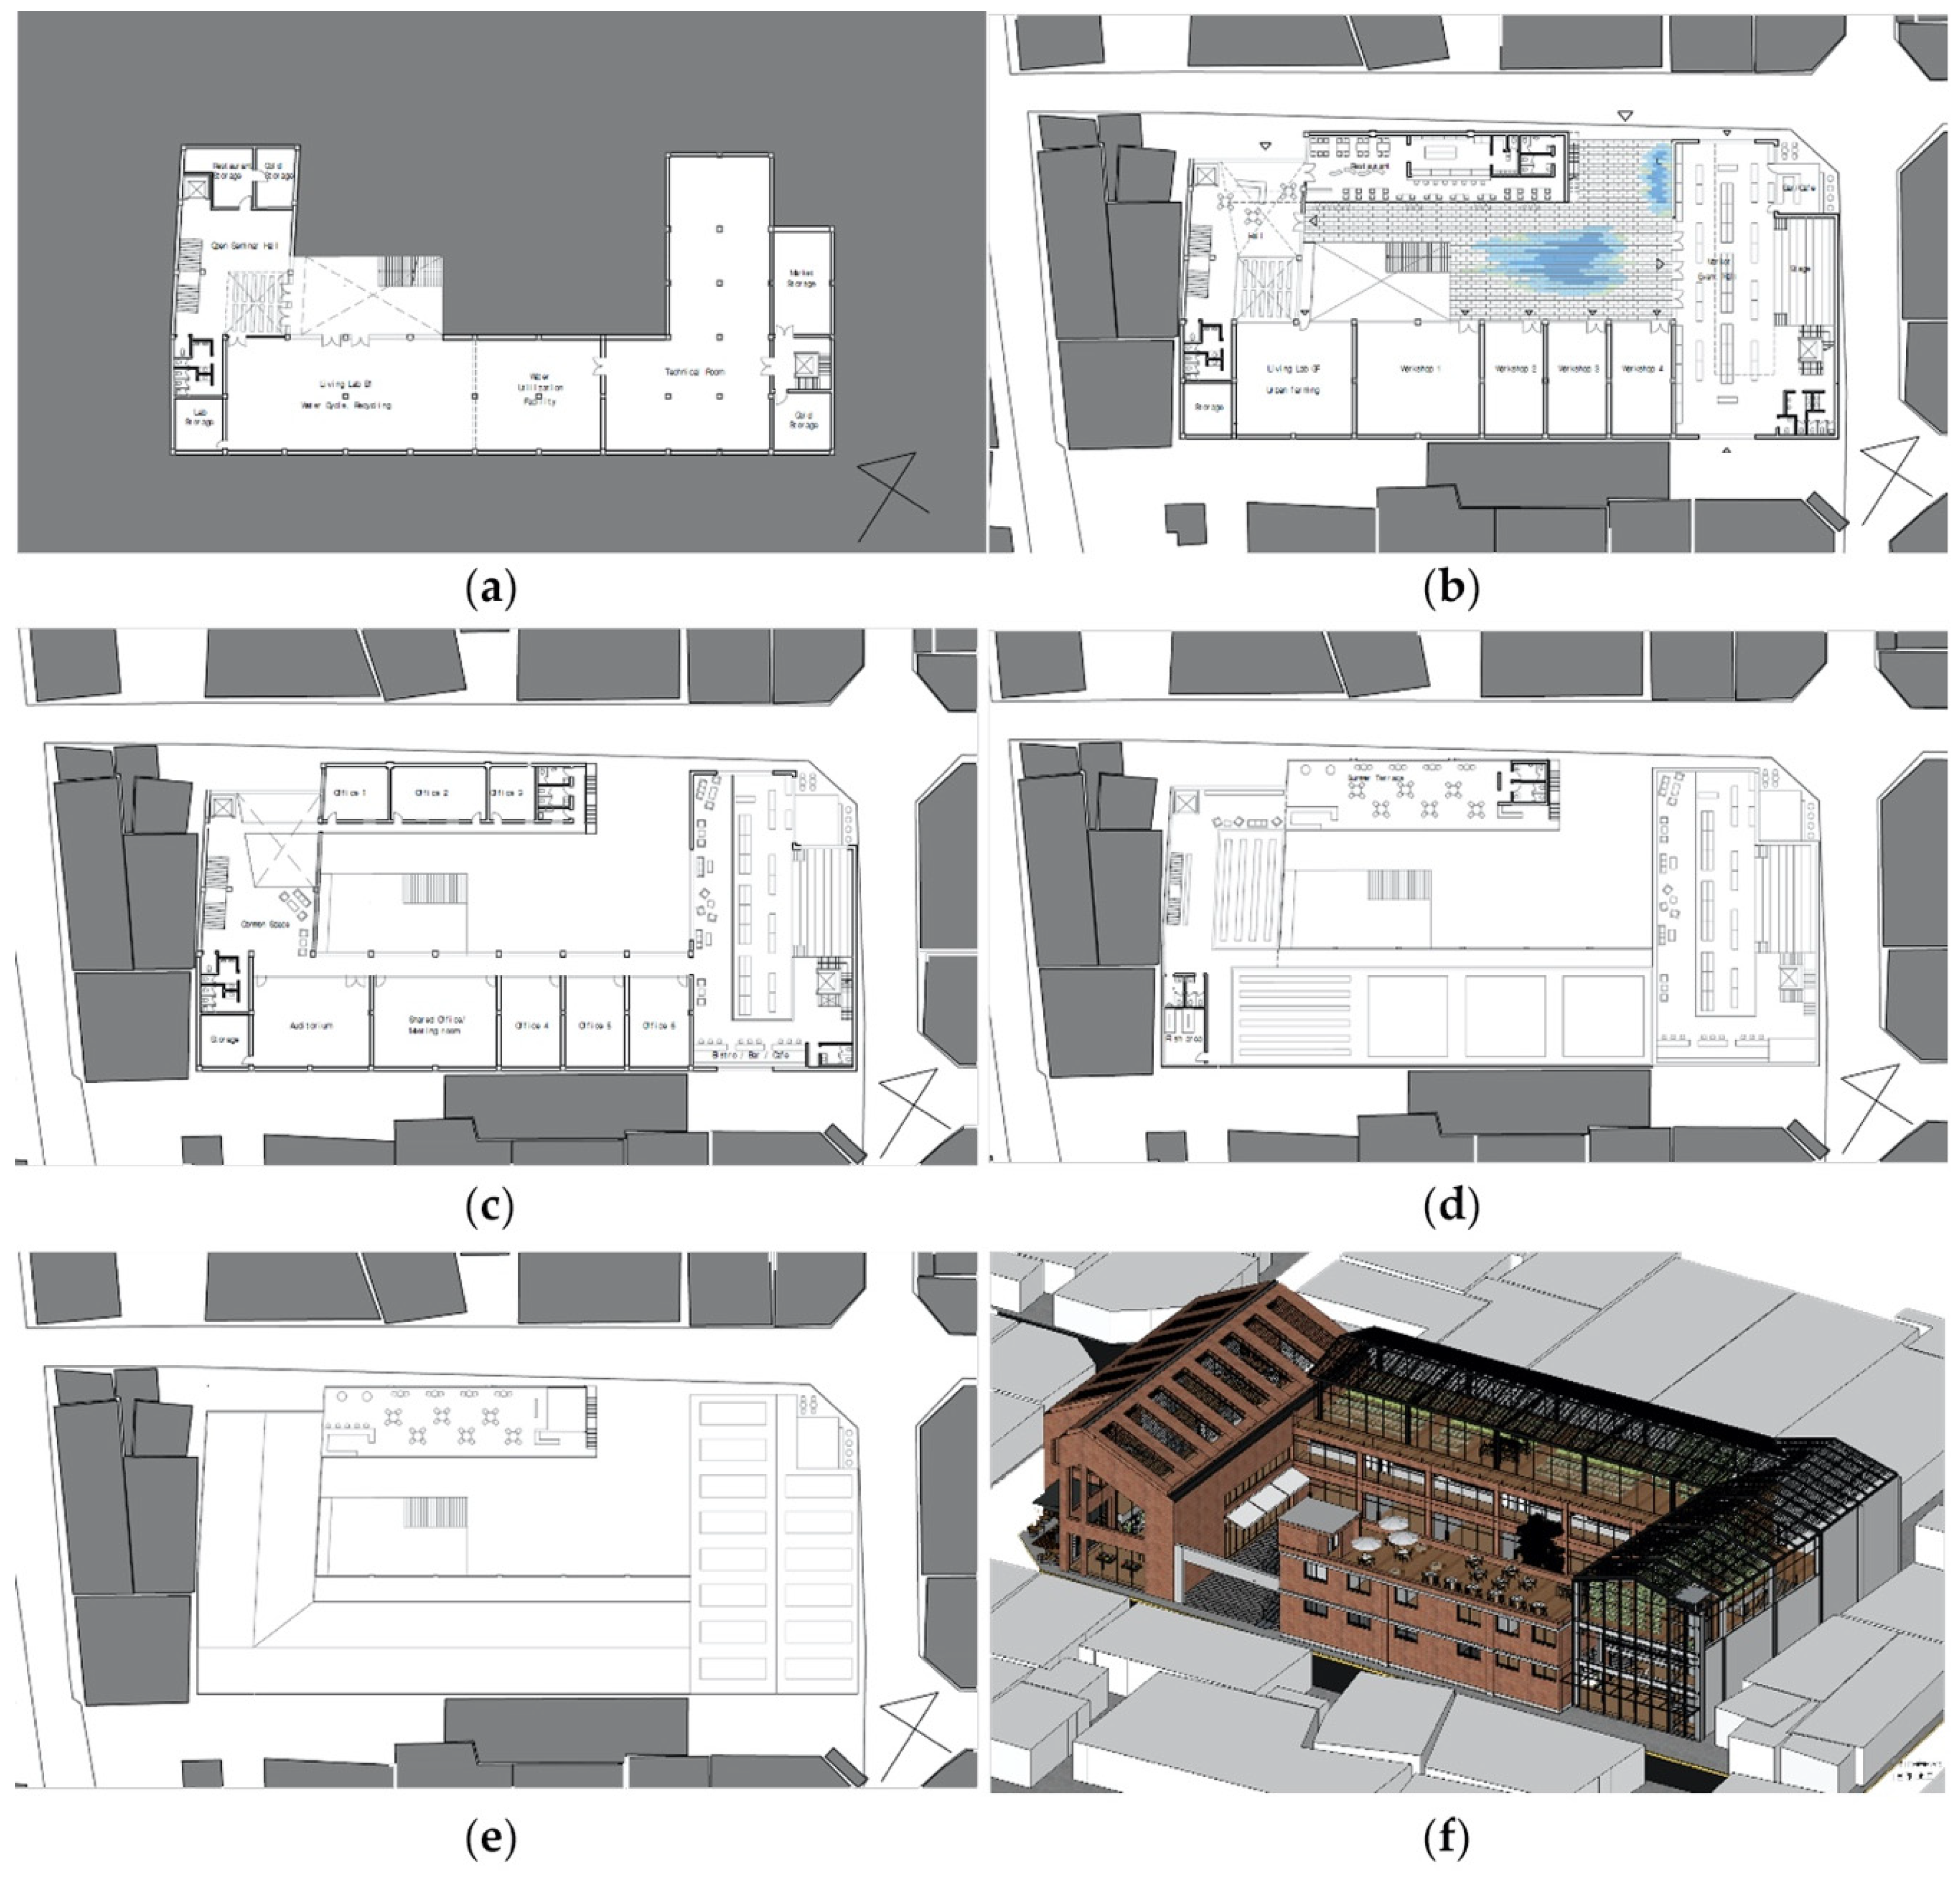
Figure 12.
Diagram of the decentralized water and resource flow in the converted IC buildings with integration of energy aspects.
Figure 12.
Diagram of the decentralized water and resource flow in the converted IC buildings with integration of energy aspects.
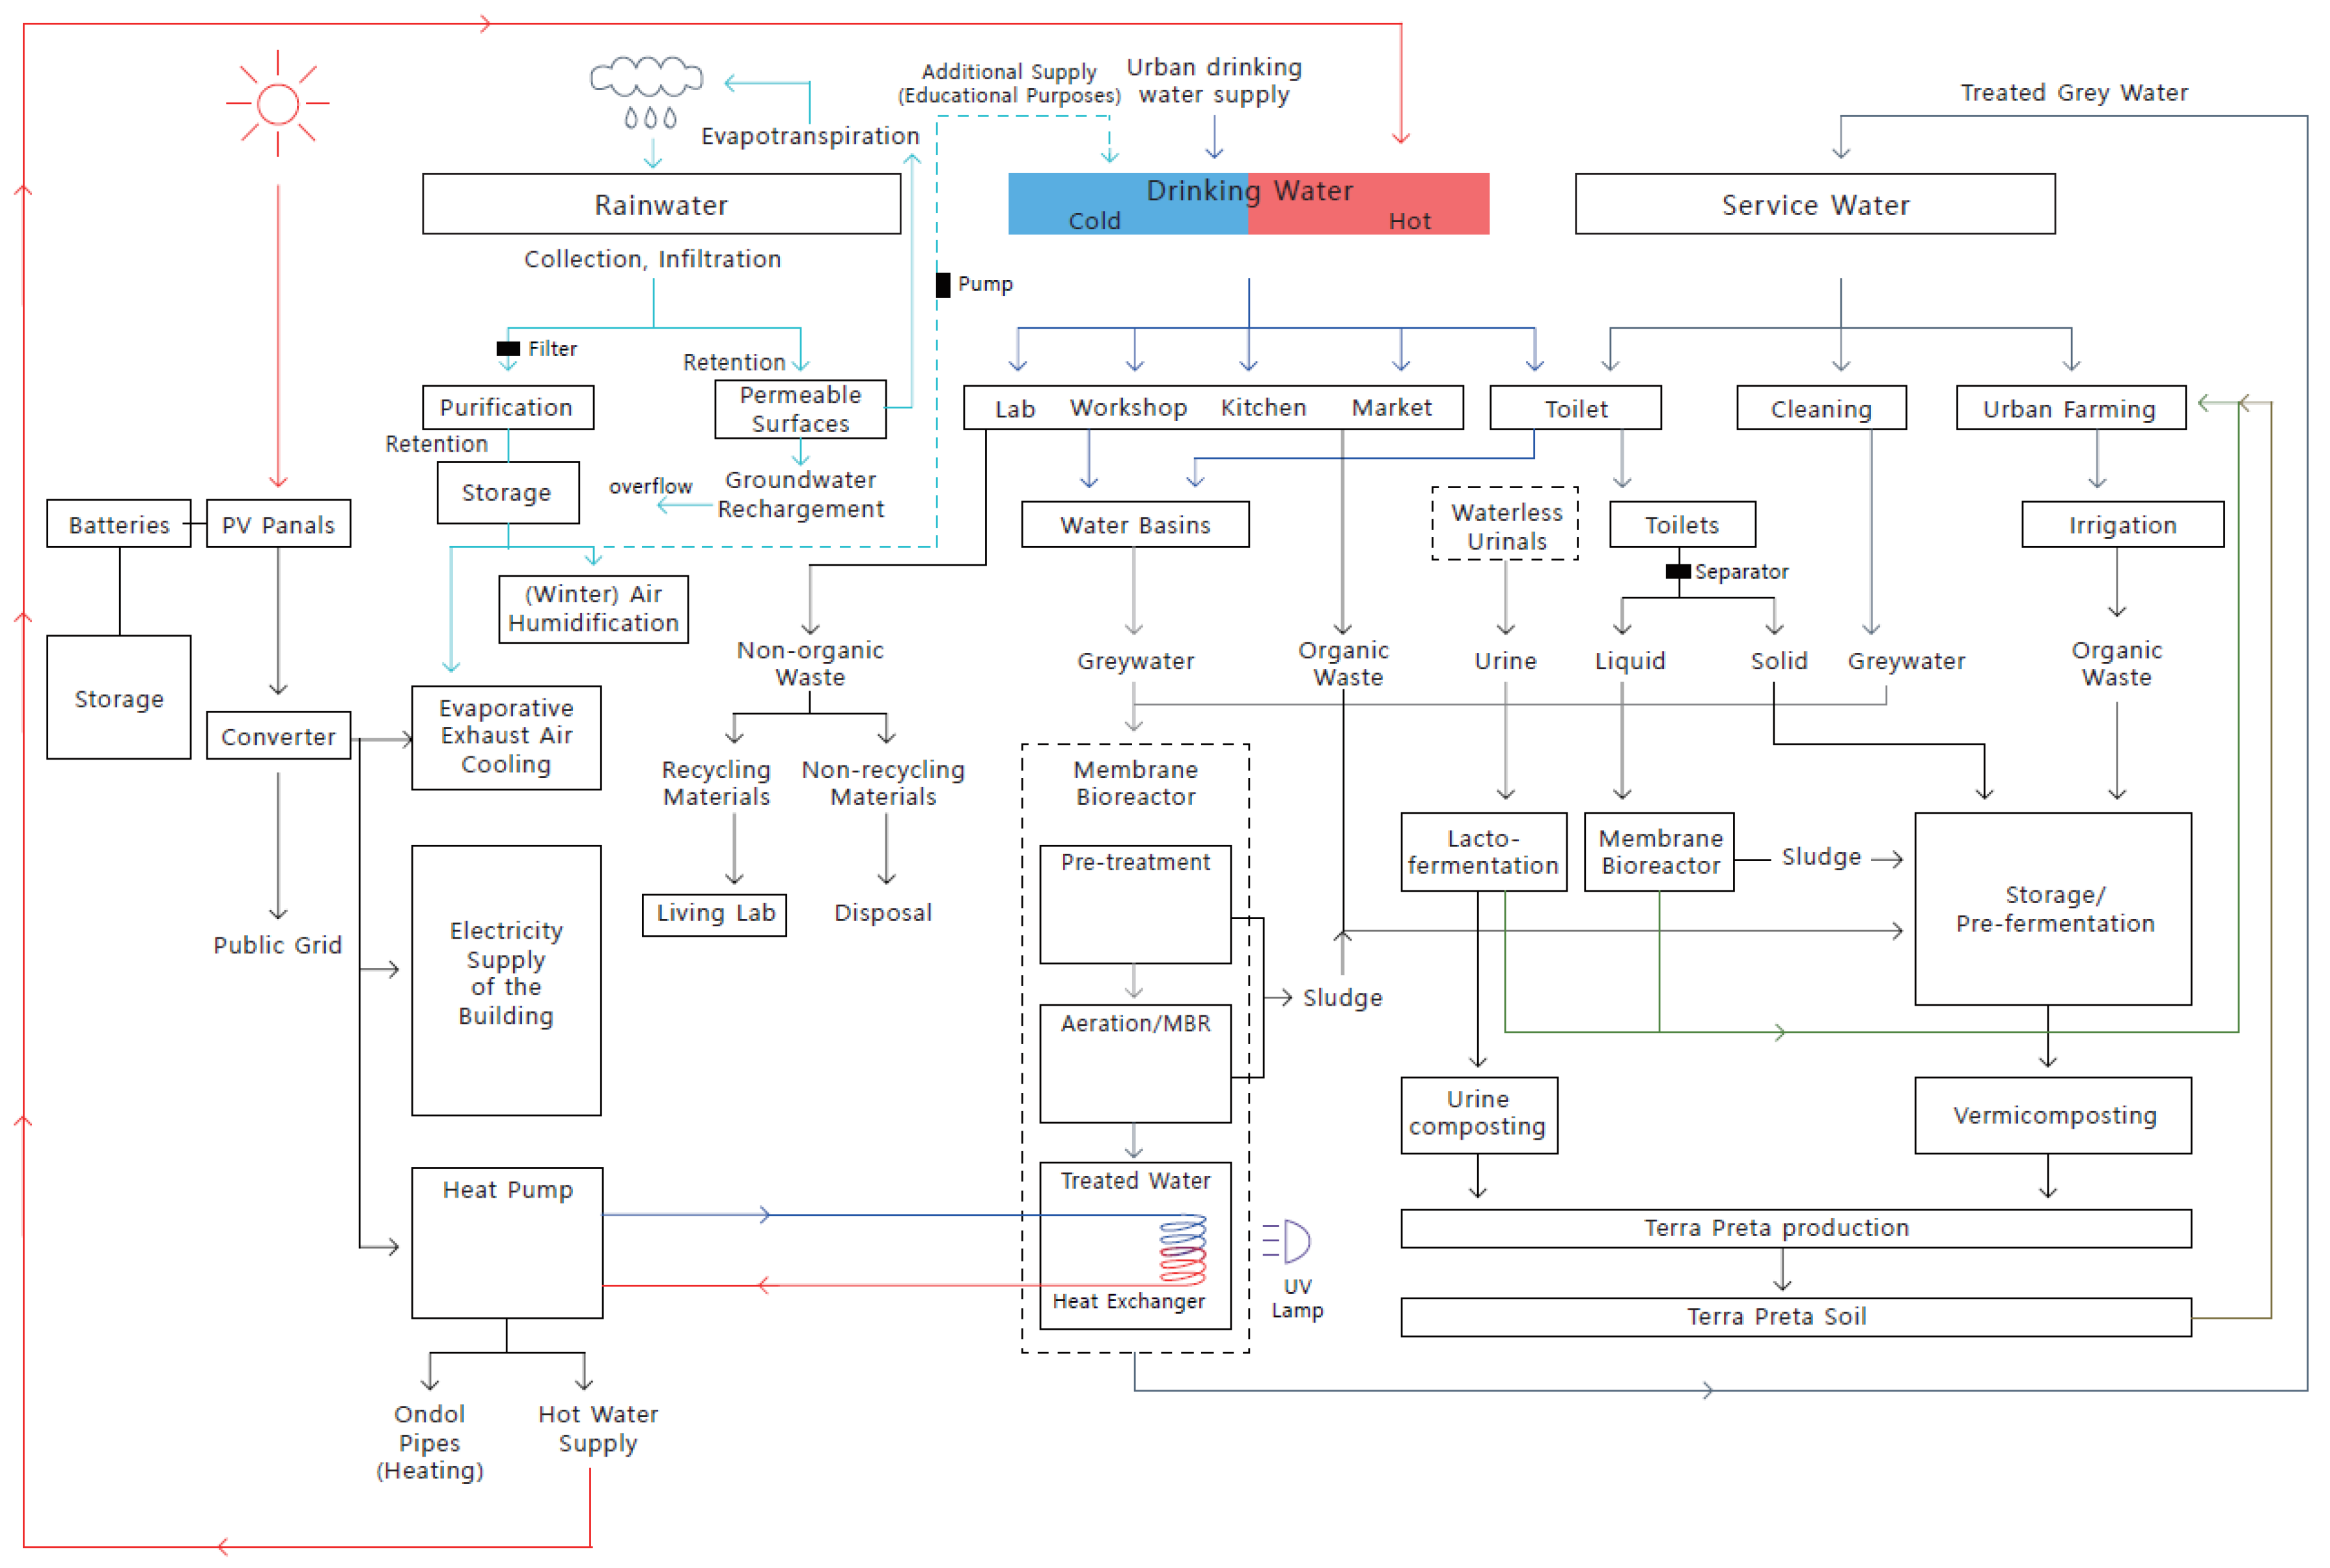
Figure 13.
Decentralized stormwater management solutions; (a) position and dimension of the three proposed stormwater and infiltration and retention volumes in relation to the basement floors of the converted IC buildings 2 and 3; (b) schematic north-south section of buildings 1 and 2 of the decentralized stormwater management system. (1) Collection of storm water from IC complex surfaces exposed to rainfall. (2) Rainwater infiltration from permeable courtyard pavement areas with indication of underground infiltration flow direction of 45 degrees (dashed blue lines). (3) Inlet stormwater drainage. (4) Underground stormwater retention and infiltration facility with indication of stormwater infiltration direction (dashed green lines). (5) Overflow level of the retention and infiltration facility. (6) Stormwater overflow and connection to (7) public sewer. (8) Structural retention facility and building foundation walls.
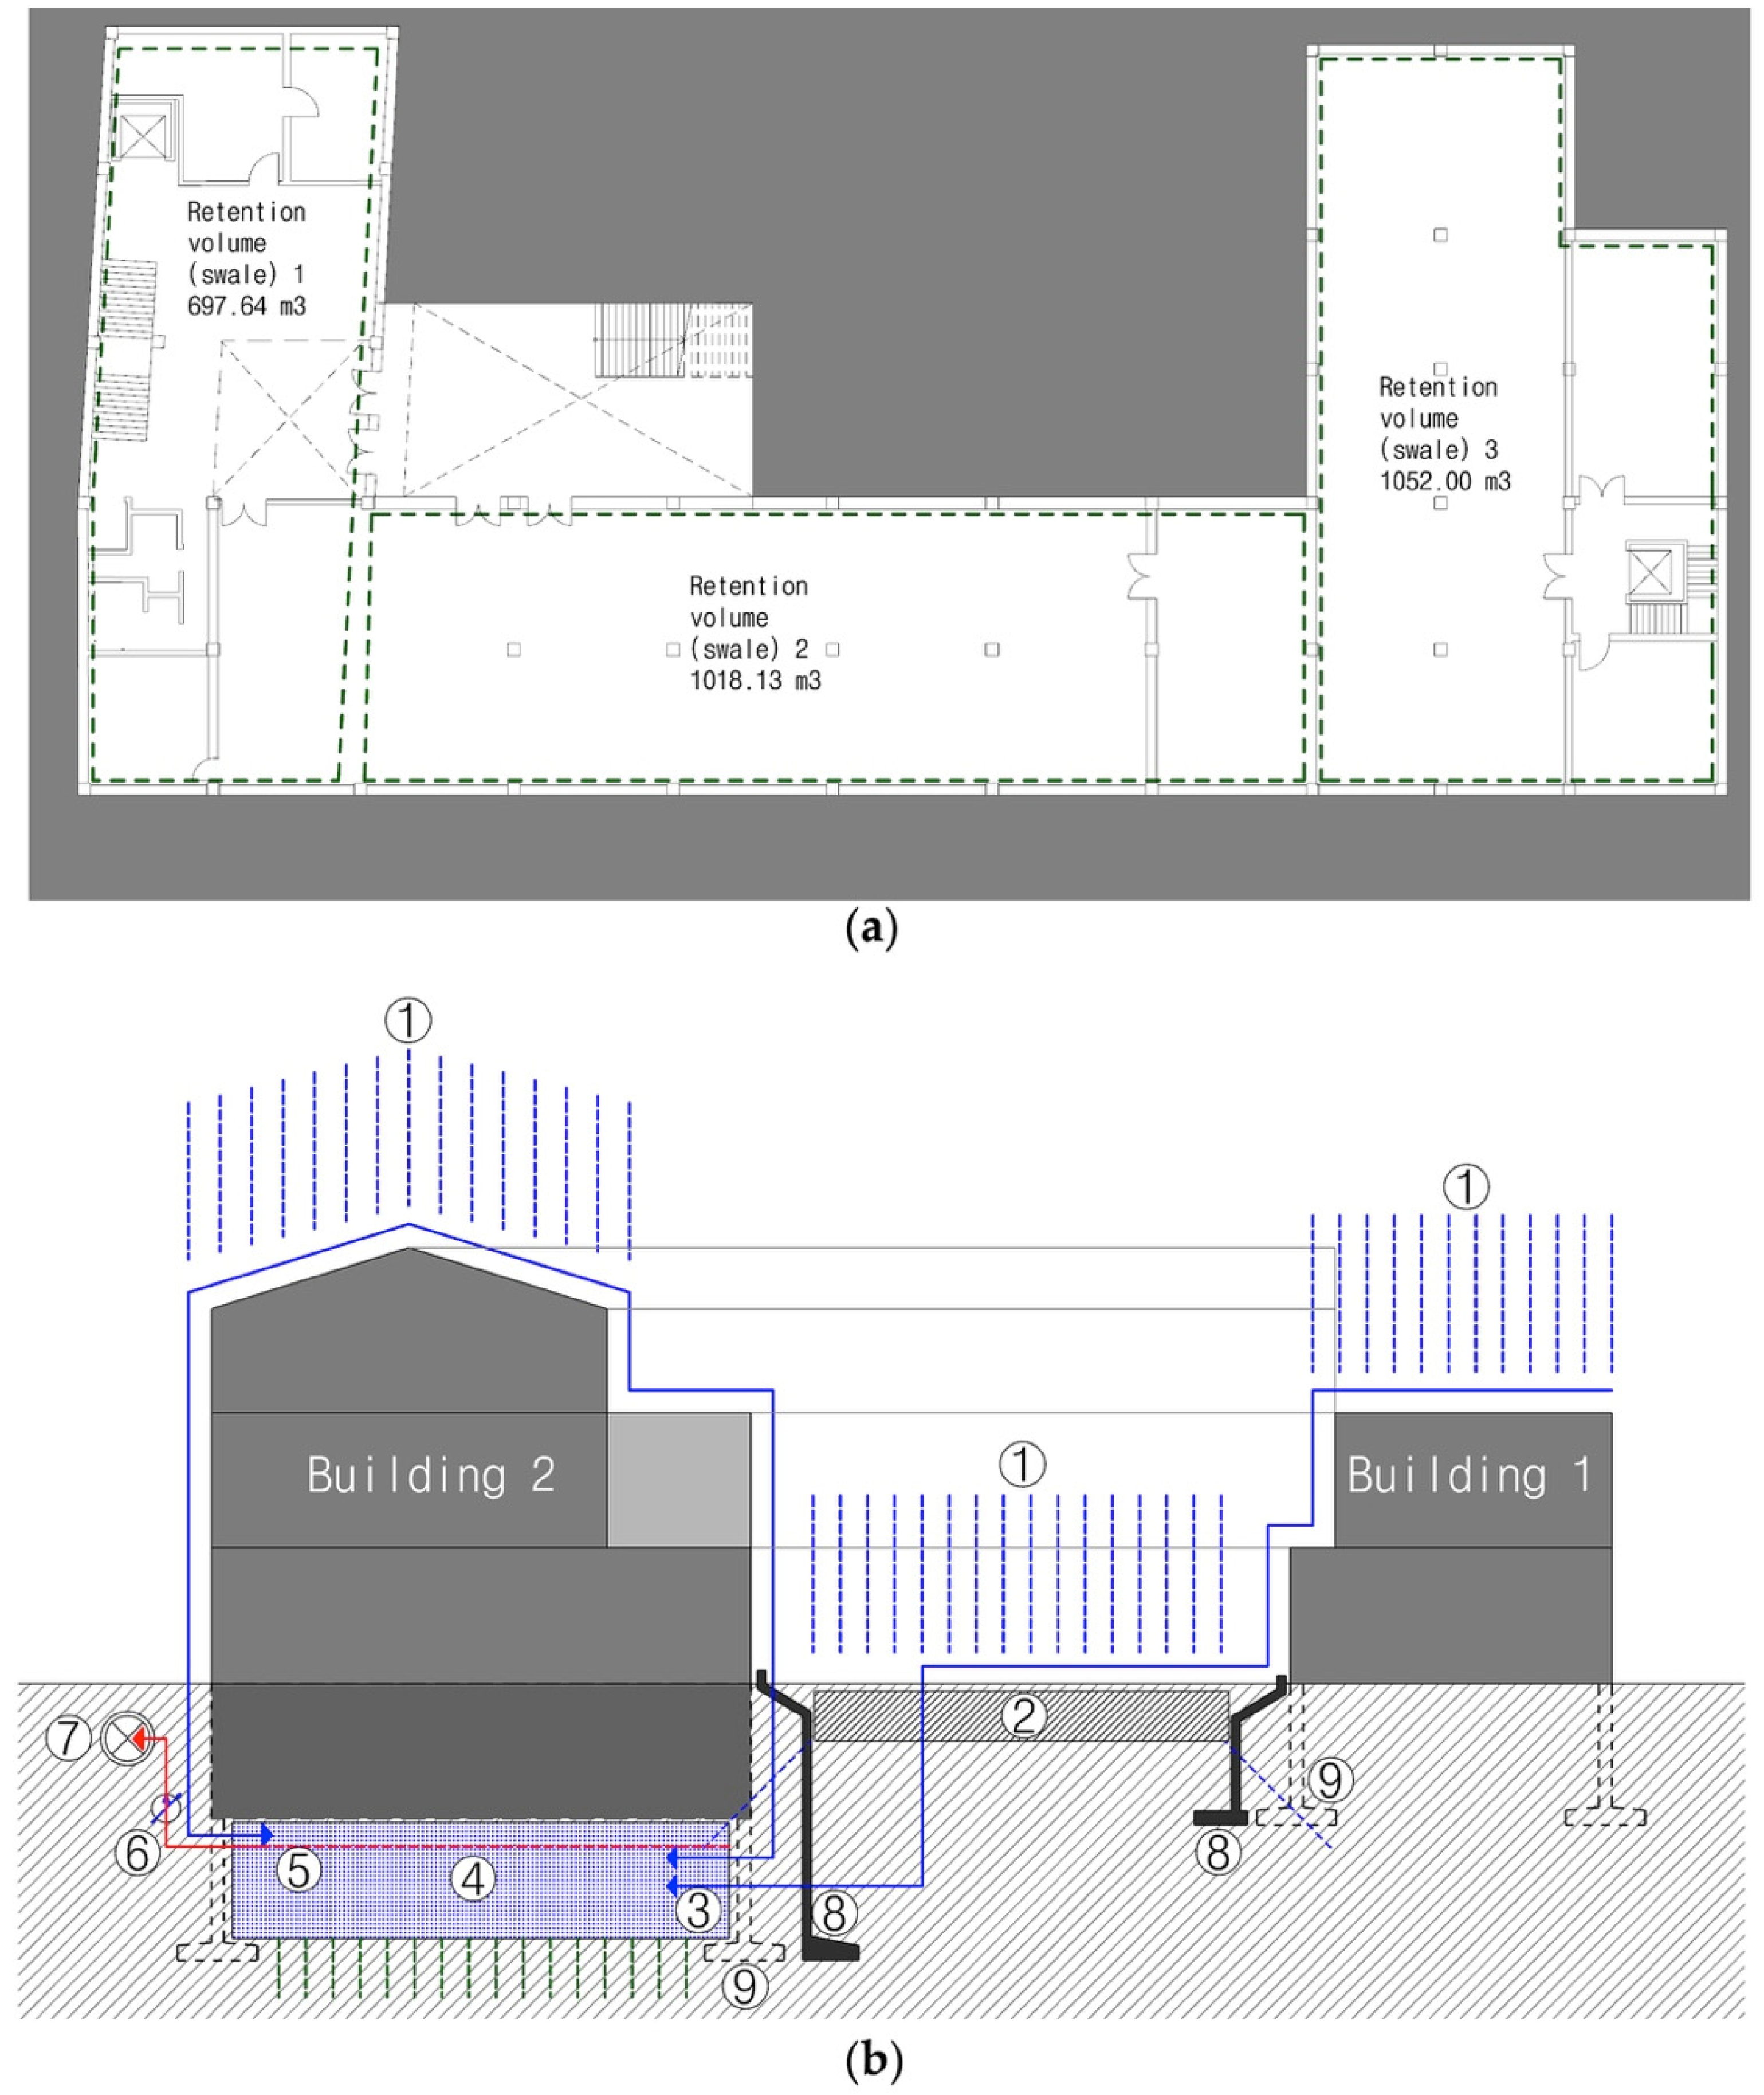
Figure 14.
Graphs with the illustration of overflow events in relation to the infiltration surface areas with associated volumes of 2.45 m3 per m2. The results show the inverse relation between dimensions of each retention/infiltration volume located underneath the newly constructed buildings and stormwater overflow events. Dimensions of infiltration surfaces are related to width and length (in m) of each of the threes swales 1, 2 and 3 (Figure 13a), from 3 × 3 = 9 m2 to 16 × 16 = 96 m2, and a constant depth of 2.45 m; (a): number of overflow events to the sewage system related to infiltration swale surface dimensions; (b): number of overflow events from sewage to stream related to infiltration swale surface dimensions.

Figure 15.
Inverse relation between dimensions of each retention/infiltration volume located underneath the newly constructed building and the percentage of stormwater volume overflow from the sewage to the Dorim stream. Dimensions were based on width and length (in m) of each swale (with 3 swales in total) and a constant depth of 2.45 m.


Table 1.
Characteristics of different historical industrial districts in Seoul.
| Districts | Type of Industry | Flood Vulnerability | Distance to Flood Prone Areas | Registered Seoul Future Heritage | ICs’ Scale | Land Use |
|---|---|---|---|---|---|---|
| Mullae-Dong | Steel | High | Very close (<1 km) | Yes | Various scales | Mixed |
| Seongsu-Dong | Shoes | High | Close (1–5 km) | No | Small scale | Commercial |
| Garibong-Dong | Light | High | Close (1–5 km) | Yes | Large scale | Industrial |
Table 2.
Specifications of existing building conditions on the site.
| Building No. | Building Footprint | Building Construction Quality | Main Structural Elements | Number of Floors | Current Building Use |
|---|---|---|---|---|---|
| 1 | 191 m2 | Good (able to renovate) | Structural brick wall, reinforced concrete columns, beams, slabs and roofs | 2 (ground floor & 1st floor) | Steel manufacturing, shops, storage (ground floor), office (1st floor) |
| 2 | 816 m2 | Poor (unable to renovate) | Reinforced concrete columns, beams, slabs roofs and sandwich panels | 1 (ground floor) | Steel manufacturing, shops, storage |
| 3 & 4 | 286 m2 (3: 200 m2, 4: 86 m2) | Poor (unable to renovate) | Structural brick wall, concrete wall | 1 (ground floor) | Steel manufacturing, shop |
| 5 & 6 | 135 m2 (5: 83 m2, 6: 52 m2) | Poor (unable to renovate) | Structural brick wall, concrete wall | 1 (ground floor) | Steel manufacturing, small restaurant |
Table 3.
Overview of the functional renovation plan for the buildings of the ex-steel mill complex, inclusive of the cumulative area destined for each functional zone.
Table 3.
Overview of the functional renovation plan for the buildings of the ex-steel mill complex, inclusive of the cumulative area destined for each functional zone.
| Building | Underground Floor (Area in m2) | Ground Floor (Area in m2) | First Floor (Area in m2) | Rooftop (Area in m2) |
|---|---|---|---|---|
| Building 1 | Not planned | Restaurant (175) | Offices (134) | Terrace café (192) |
| Building 2 | Environmental laboratory & show room for water treatment and re-use technologies; storage room for the restaurant located in building 1 (1340) | Environmental laboratory: Living Lab and Urban farming/Lobby/Community spaces/Workshops for crafters and artists (750) | Offices; Auditorium; Community spaces (684) | Glasshouse (urban farming) (710) |
| Building 3+4 | Technical room; (300) | Stage and farmer’s market (with building 5 and 6) (459) | Extension of the café area (double height space) (216) | N.a. |
| Building 5+6 | Storage for the market located in the ground floor (129) | Stage and farmer’s market (with building 5 and 6) (459) | N.a. | N.a. |
Table 4.
Predicted building users (visitors and people working on the site).
| User/Day | Restaurant | Work Shop | Office | Urban Farming | Market | Building | Bar/Cafe | Summer Terrace | Total |
|---|---|---|---|---|---|---|---|---|---|
| Visitors | 180~200 | 10 | 10 | 30 | 200~250 | 0~50 | 50 | 0~100 | 570~670 |
| Worker | 10 | 10 | 20 | 4 | 30 | 10 | 2 | 6 | 100 |
| Maximum Case | Market/Event | Event | Summer | 670~770 |
Table 5.
Stormwater management simulation results. Quantification of the reduction of overflow events and increase of infiltration and retention rates are produced through the comparison of the results obtained through five-year period-based STORM simulations for both existing and converted IC.
Table 5.
Stormwater management simulation results. Quantification of the reduction of overflow events and increase of infiltration and retention rates are produced through the comparison of the results obtained through five-year period-based STORM simulations for both existing and converted IC.
| Scenario | Total Stormwater Volume—Gross Precipitation (m3/mm) | Stormwater Evaporated/Infiltrated through Retention (m3 and % of Total Volume) | Stormwater Direct Outflow to the Stream (m3 and % of Total Volume) | Number of Overflow Events: Sewage System into Stream | Stormwater Overflow Volume (m3 and % of Total Volume) |
|---|---|---|---|---|---|
| Existing | 15,890.24/7938 | Surface evaporation: 1114.171 (7.01%) | 14,776.06 (92.99%) | 26 | 2560.04 (16.11%) |
| Renovated | 15,890.24/7938 | Surface evaporation: 1114.71 (7.01%) Evaporation through swales: 2035.69 (12.81%) Infiltration through swales: 12,722.23 (80.06%) | 0 (0%) | 0 | 0 (0%) |
| Improvement (renovated/existing) | - | Surface evaporation: 0 (0%) Evaporation through swales: 2035.69 (+12.81%) Infiltration through swales: 12,722.23 (+80.06%) | −14,776.06 (−92.99%) | −26 | −2560.04 (−16.11%) |
© 2020 by the authors. Licensee MDPI, Basel, Switzerland. This article is an open access article distributed under the terms and conditions of the Creative Commons Attribution (CC BY) license (http://creativecommons.org/licenses/by/4.0/).
Share and Cite
MDPI and ACS Style
Hwang, K.; Schuetze, T.; Amoruso, F.M. Flood Resilient and Sustainable Urban Regeneration Using the Example of an Industrial Compound Conversion in Seoul, South Korea. Sustainability 2020, 12, 918. https://doi.org/10.3390/su12030918
AMA Style
Hwang K, Schuetze T, Amoruso FM. Flood Resilient and Sustainable Urban Regeneration Using the Example of an Industrial Compound Conversion in Seoul, South Korea. Sustainability. 2020; 12(3):918. https://doi.org/10.3390/su12030918
Chicago/Turabian StyleHwang, Kyoyoung, Thorsten Schuetze, and Fabrizio M. Amoruso. 2020. "Flood Resilient and Sustainable Urban Regeneration Using the Example of an Industrial Compound Conversion in Seoul, South Korea" Sustainability 12, no. 3: 918. https://doi.org/10.3390/su12030918
Note that from the first issue of 2016, this journal uses article numbers instead of page numbers. See further details here.