Leveraged Trading, Irrational Sentiment and Sustainability in the Stock Market: Evidence from China


1
School of Business, Hubei University, Wuhan 430062, China
2
Economics and Management School, Wuhan University, Wuhan 430072, China
*
Author to whom correspondence should be addressed.
Sustainability 2020, 12(4), 1310; https://doi.org/10.3390/su12041310
Submission received: 8 January 2020
/
Revised: 8 February 2020
/
Accepted: 9 February 2020
/
Published: 11 February 2020
(This article belongs to the Special Issue Sustainability in Asian Emerging Markets)
Abstract
:Leveraged trading exhibits the characteristics of “strong margin trading and weak short selling” in the Chinese stock market. On the basis of monthly data on leveraged trading in the Chinese stock market from January 2014 to December 2016, we aim to empirically examine the relationship between leveraged trading and investor sentiment, and analyze the characteristics of investor sentiment contained in the leverage ratio. The results show that (1) as the leverage ratio increases, the pattern of investor trading changes from the positive feedback trading of “chasing up and down” to the negative feedback trading of “selling high and buying low”; (2) leveraged trading has the typical characteristics of irrational sentiment; (3) inverse arbitrage strategies based on leverage ratios is effective in one month in the Chinese market. The findings in this paper provide empirical support for clarifying the influence mechanism between leveraged trading and investor sentiment, and can serve as a useful reference for reducing the impact of leveraged trading on volatility and maintaining the sustainability of the stock market.
Keywords:
leveraged trading; investor sentiment; sentiment feedback; arbitrage strategy; stock market sustainabilityJEL Classification:
D91; G01; G411. Introduction
In the stock market, leveraged trading refers to transactions in which investors use their own funds as a guarantee to obtain margin trading or short selling from banks or brokers to amplify transaction values. However, since the Chinese stock market established the leveraged trading system in 2010, “Chinese-style” leveraged trading has been characterized by “strong margin trading and weak short selling”. From 2014 to 2015, the abnormal volatility (According to the Efficient Market Hypothesis (Fama, [1]), changes in asset prices should be driven entirely by fundamental information, and the volatility of asset prices should equal the volatility of fundamental factors. Therefore, abnormal volatility is defined as the portion of the volatility of asset prices that exceeds the boundary of the volatility of fundamental factors (Shiller, [2]).) in the Chinese stock market indicated that the leveraged trading was having a significant impact on investor sentiment and volatility, and was even threatening sustainability in the stock market [3,4].
The role of leveraged trading in the stock market is controversial. Some scholars believe that leveraged trading can ease arbitrage restrictions, promote the return of prices to fundamentals, and facilitate the stabilization of stock prices [5,6,7]. However, other scholars believe that leverage may expand the influence of private information owners on the market, induce market speculation, and aggravate abnormal volatility [8,9,10]. Since the introduction of the leveraged trading system in China, insufficient securities sources, the high cost of securities lending, and excessive optimism of investors during the bull market have caused the volume of short selling to be far smaller than that of margin trading. The significant asymmetry between margin trading and short selling has greatly weakened the role of short selling to curb price overvaluation [4]. Leveraged trading not only lacks a role in the elimination of short selling restrictions, but also further exacerbates short-selling restrictions because of its asymmetry, thereby forming a positive price feedback effect that causes abnormal volatility and even price crashes, which threaten sustainability in the stock market.
In fact, the leveraged trading behaviors of investors can significantly affect volatility through sentiment feedback and market liquidity transmission. On the one hand, the pattern of sentiment feedback is unstable, and investors’ leverage ratios will be nonlinear, which affects their trading psychology and induces abnormal volatility in the sentiment feedback coefficient. When the marginal leverage ratio is high relative to profit, investors are more averse to losses, sentiment becomes extremely sensitive, and sentiment feedback coefficients fluctuate sharply, all of which profoundly affect trading behavior. On the other hand, investors’ leverage ratios can, to some extent, reflect the market liquidity situation. Investors’ leveraged trading can cause drastic changes in market liquidity and result in sharp volatility. Therefore, price behavior becomes more complicated after considering leveraged trading.
The motivation of the research is focused on two aspects of the relationship between leveraged trading and investor sentiment. First, in the sentiment system of investors, the sentiment feedback coefficient is related to the leverage ratio. The sentiment feedback coefficient is initially positive, but as the leverage ratio increases, the coefficient decreases. The second aspect is the characteristics of investor sentiment contained in leveraged trading. Investor sentiment involves not only irrational elements, but also rational ones [11]. If leveraged trading is indeed an important factor that affects investor sentiment, does leveraged trading reflect the characteristics of investors’ rational or irrational sentiments? This paper reports an empirical study on the relationship between leveraged trading and investor sentiment: The first aspect was explored by testing whether the sentiment feedback coefficient is significantly negatively correlated with the leverage ratio; the second aspect was examined by using the three properties of sentiment [12] to determine whether the leverage ratio has the typical characteristics of irrational sentiment.
A breakdown of the paper is structured as follows: Section 2 gives the literature review, Section 3 examines the relationship between leveraged trading and the sentiment feedback coefficient, Section 4 focuses on testing the relationship between the leverage ratio and investor sentiment, Section 5 performs some robustness checks, and Section 6 provides the conclusions.
2. Literature Review
We aim to make an intensive study of the characteristics of leveraged trading in the Chinese stock market from the perspective of investor sentiment. We are concerned about the following issues. First, does leveraged trading affect investors’ behavior through the sentiment mechanisms of the preferences and beliefs? Second, how does leveraged trading affect investors’ feedback coefficients? Third, is leveraged trading closely related to investor sentiment? Therefore, we review the existing literature around the issues mentioned above.
2.1. Sentiment Mechanism and Leveraged Trading
In the Chinese stock market, individual investors are major participants in leveraged trading. The rational financial theory assumes that individual investors’ behavior under uncertain conditions follows the expected utility theory. However, some scholars find that individual investors’ behavior is closely related to the sentiment mechanisms of the preferences and beliefs [9,13,14,15,16,17,18,19,20,21]. By clarifying the sentiment mechanisms that the leverage ratio affects individual investors’ behavior, we can analyze how the leverage ratio affects investors’ feedback coefficients.
The leverage ratio held by individual investors can significantly affect their preferences.
(1) “Myopic loss aversion” [13]: As the leverage ratio increases, individual investors become more driven by their aversion to losses than potential profits. In particular, when the “Framework Effect” [14] influences individual investors, the reference price in their utility evaluation will be close to the current market price. Furthermore, individual investors will evaluate investment decisions too frequently, leading to myopic loss aversion.
(2) “Mental accounting” [15]: Individual investors use different psychological accounts to evaluate the utility of different types of assets. In particular, mental accounting can be realized as an increased risk appetite for profit (House Money Effect [16]) and an increased risk aversion to a loss of principal (Snake Bite Effect).
(3) “Gambling preferences” [17]: At low leverage ratios, individual investors tend to increase their leverage ratio to gain higher returns and have strong gambling preferences; however, as the leverage ratio increases, under the influence of psychological phenomena such as myopic loss aversion and psychological accounting, individual investors’ loss aversion is aggravated. Individual investors no longer have an aggressive gambling preference at low leverage ratios.
(4) “Realization utility” [18]: Individual investors pay more attention to the realized profit or loss compared with the book profit or loss. Therefore, relative to the book profit, individual investors are more sensitive to the losses caused by forced liquidation.
(5) “Herd behavior” [19] and “regret aversion bias” [20]: The behaviors of individual investors tend to show a common trend. Changes in the leverage ratio can lead to a systematic change in investor behavior, which is realized through investor preferences.
In addition, beliefs reflect investors’ expectations for future prices. Because different investors have different degrees of loss aversion, increases in the leverage ratio cause a greater divergence of investors’ expectations for future prices. It has been proven that, under the conditions of heterogeneous beliefs and asymmetric arbitrage, changes in the leverage ratio have a significant effect on stock returns [9,21]. Thus, changes in the leverage ratio can also lead to a systematic change in investor behavior as a result of their beliefs.
2.2. Feedback Trading and Leveraged Trading
In all the types of feedback trading, sentiment feedback trading is the most representative and well-known. Changes in asset prices affect investor sentiment, which in turn affects asset prices. The premise of this feedback trading is that investor sentiment has a systematic effect on asset prices [22]. Compared with other types of feedback trading, "price-sentiment-price" feedback trading is characterized by the fact that the fundamental factors in the feedback trading are exogenous variables, and investor sentiment and asset prices have no direct impact on the fundamental factors.
The sentiment feedback trading is verified by lots of psychological experimental evidence. Tversky and Kahneman [23] find that people tend to use representational revelation to make judgments; people tend to overuse representativeness and ignore the basis rate when estimating probability. Similarly, people tend to classify changes in stock prices into trending or random walk categories, which leads to feedback trading, even if these categories have nothing to do with the fundamental factors [24]. De Bondt [25] shows that investors will trade based on the past stock price series, and under certain conditions, they can generate bubbles consistent with the feedback trading.
On the basis of the sentiment mechanisms of the preferences and beliefs of investors, the following relationship between the leverage ratio and investors’ feedback trading is proposed: At low leverage ratios, investors tend to exhibit the positive feedback trading behavior of “chasing up and down” to gain higher returns, and at high leverage ratios, investors are more inclined to show the negative feedback trading behavior of “selling high and buying low” to “lock in” profits and avoid losses. Therefore, after the introduction of leveraged trading, the feedback trading pattern of investors is no longer completely random but somewhat certain. Therefore, we propose Hypothesis One as follow.
Hypothesis One: the leverage ratio and sentiment feedback coefficients have an “inverted U-shaped” relationship.
2.3. Multidimensionality of Investor Sentiment and Leveraged Trading
There is a huge amount of literature looking at investor sentiment, including measures of investor sentiment [26,27,28,29], investor sentiment and financial market anomalies [2], investor sentiment and stock returns [30,31,32,33,34], investor sentiment and stock market risk [35,36], and investor sentiment and corporate finance [37]. Chinese scholars have also conducted a lot of research on investor sentiment in the Chinese stock market [38,39]. However, the studies failed to give a deep look into the nature of investor sentiment.
There is no uniform definition of investor sentiment. De Long et al. [22] regard investor sentiment as investors’ wrong expectation of the fundamental values of assets. Similarly, Baker and Stein [40] define investor sentiment as a miscalculation of the future underlying value of assets. Barberis and Huang [17] show that investor sentiment is manifested by the investors’ irrational preferences. Baker and Wurgler [27,28] give two definitions of investor sentiment: The propensity of investors to speculate; and the optimistic or pessimistic expectations of future asset prices. Although the expressions are not the same, the current definition of investor sentiment mainly refers to the deviation of belief and preference from the rational financial theory (rational expectations and rational preferences).
Investors in the stock market are not purely "smart" or "dumb", but a unity of "economic man" and "animal spirit". They will try to make themselves "smart" by analyzing the fundamental factors or inferring other investors’ behaviors. But they are often restricted by "animal spirits”, and that irrationality deviates them from rational decision. Verma and Verma [11] divide investor sentiment into two: The “smart” part that reflects “economic man” is called rational sentiment, and the part that reflects investor “animal spirit” is called irrational sentiment. Therefore, investor sentiment is obvious multidimensionality.
As for the leverage ratio, the information contained in it can be divided into three parts: 1. The fundamental factors, the information that has been updated in the current period has an impact on the fundamental value of the asset; 2. Investor sentiment, which has nothing to do with the fundamental factors information. Investor sentiment can be further divided into rational sentiment (“economic man”) and irrational sentiment ("animal spirits"). 3. Idiosyncratic information, which has nothing to do with the fundamental factors and investor sentiment. Therefore, we must carefully screen the multidimensionality contained in the leverage ratio to accurately capture the relationship between the leverage ratio and investor sentiment. We propose Hypothesis Two as follows.
Hypothesis Two: The leverage ratio after purification has the typical characteristics of irrational sentiment.
There are many other measures for investor sentiment, such as the VIX index, the high-low index, the bullish percent index, the BW index [27,28], and more investor sentiment proxies in Section 5.2. However, we neither just study investor sentiment, nor simply find a new proxy for investor sentiment. This paper adds to the growing literature on investor sentiment by testing whether the sentiment feedback trading is significantly correlated with the leverage ratio; and by determining whether the leveraged trading has the typical characteristics of irrational sentiment.
3. Leveraged Trading and the Sentiment Feedback Coefficient
3.1. Methodology
In this section, we use multiple regression model to investigate the relationship between the leverage ratio and the sentiment feedback coefficient.
3.1.1. Definitions of Core Variables
The sentiment feedback coefficient can be expressed as the sensitivity of sentiment changes to return changes [41]. Scholars generally believe that turnover can effectively reflect investor sentiment [27,28], so the turnover rate is used as an indicator of investor sentiment. The sentiment feedback coefficient is defined as shown in (1):
where turnover represents the market turnover, and mktretn represents the market return. The time horizon is monthly. When investors use “chasing up and down” positive feedback trading, if the market return is positive, then the sentiment feedback coefficient is also positive: The more sensitive the investor sentiment to market return changes, the greater the positive feedback coefficient. When investors use negative feedback trading, if the market return is negative, then the sentiment feedback coefficient is negative: The more sensitive the investor sentiment to market return changes, the more negative the sentiment feedback coefficient. Investors’ feedback trading patterns are not fixed and can be both positive and negative.
In this work, market-level data on leveraged trading was used to measure the leverage ratio. The leverage ratio is defined in formula (2).
where tradingleverage represents the leverage ratio, financing represents the total margin trading balance, shorting represents the total short selling balance, and marketvalue represents the total market value. The time horizon is monthly. Formula (2) reflects the proportion of the net margin trading in the market at month t to its total tradable market value. The larger the ratio, the higher the proportion of margin trading in the market, which results in a higher leverage ratio.
3.1.2. Empirical Model
In this study, the relationship between the leverage ratio and the sentiment feedback coefficient was investigated. The following regression model was constructed:
where sentimentfeedback represents the sentiment feedback coefficient, and tradingleverage represents the leverage ratio. The market information contained in investor sentiment is controlled by adding the following control variables: (1) Annualized return, anmktretn; (2) annualized volatility, anvolatility; and (3) market illiquidity, illiquidity. The ratio of the absolute value of return to turnover is expressed as [42]. Heteroscedasticity is controlled for by including the robust standard error in the regression. The time horizon is monthly.
3.2. Data and Descriptive Statistics
The sample period of the presented analysis is from January 2014 to December 2016 (36 months), and market-level data are from this period. The data used in this paper are all from the CSMAR (China Stock Market & Accounting Research) database and the Wind database in China.
The sample period of 36 months from January 2014 to December 2016 includes the whole period of abnormal volatility in the recent Chinese stock market, including the phase of stock prices skyrocketing and the phase of stock prices crash. Based on this sample, we cannot only study the relationship between leveraged trading and investor sentiment, but also the relationship between leveraged trading and abnormal volatility. This is also the main objective of this work. What’s more, after 2016, leveraged trading in the Chinese stock market was to some extent restricted by the regulations, and was not a completely spontaneous market behavior.
Table 1 lists the descriptive statistics of the variables. The sentiment feedback coefficient greatly fluctuates between positive and negative, indicating that the investor feedback trading pattern frequently switches between positive and negative during the sample period. The volatility of the leverage ratio is also very significant. The time series are stationary by the ADF (Augmented Dickey-Fuller) test.
3.3. Results Presentation and Discussion
Table 2 lists the estimated results for the effect of the leverage ratio on the sentiment feedback coefficient. Model 1 tests the linear relationship between the two aspects, Model 2 tests the nonlinear (quadratic function) relationship between the two aspects, and Model 3 adds a one-month lag term of the sentiment feedback coefficient to Model 2 to control for the potential inertial effect. After controlling for market factors, the result shows that the leverage ratio has a significant nonlinear effect on the sentiment feedback coefficient (Model 2), and the sentiment feedback coefficient does not have a significant inertial effect (Model 3). In Model 2, the coefficients of tradingleverage and tradingleverage2 are very significant, and the magnitude of the effect is relatively large. What’s more, the leverage ratio and sentiment feedback coefficients have an “inverted U-shaped” relationship. The turning point for the leverage ratio is about 10.6%. When the leverage ratio does not exceed 10.6% (the corresponding sentiment feedback coefficient is about 4), the higher the leverage ratio, the higher the sentiment feedback coefficient. However, when the leverage ratio exceeds 10.6% (the corresponding sentiment feedback coefficient is about 4), the higher the leverage ratio, the lower the sentiment feedback coefficient, which decreases more quickly when the leverage ratio is higher.
The result of using market-level data for regression analysis confirms the effect of leveraged trading on investor sentiment feedback. Leveraged trading is indeed an important factor for investor sentiment. However, investor sentiment contains not only irrational elements, but also rational ones. Does leveraged trading reflect rational or irrational sentiment? The subsequent parts of this paper examine the characteristics of investor sentiment contained in leveraged trading from the perspective of the leverage ratio and market return.
So far, the Hypothesis One is verified.
4. The Leverage Ratio and Investor Sentiment
In reality, investors often have limited rationality and display a mixture of rational and irrational behavior. Investor decision-making is not driven by a single factor. In addition to the basic factors (“economic man”), investor decision-making also includes the “animal spirit”, which is often regarded as a source of irrational sentiment in the market. Therefore, even a single sentiment index contains multidimensional information, which includes not only sentiment factors but also fundamental factors. First, the influence of fundamental factors on the investor sentiment index needs to be excluded. The regression of macroeconomic variables was used to eliminate the influence of fundamental factors on investor sentiment [27,28,43] to extract a “purer” investor sentiment index.
Those trading on the basis of fundamental factors are generally believed to be rational investors, while those trading on the basis of the “animal spirit” are regarded as irrational investors. However, truly rational investment decisions are not necessarily related to fundamental factors [44]. As stated by “Wall Street legend” Bernard Baruch, “The most important thing in market volatility is often not the events themselves, but people’s reaction to these events.” Therefore, the multidimensionality of the investor sentiment index is reflected in not only fundamental factors and “animal spirit”, but also a process of belief reasoning. Irrational sentiment (“animal spirit”) is at a lower level in belief reasoning. According to the pursuit of maximized utility by the “economic man”, the part that is at a higher level in belief reasoning and has no necessary connection with fundamental factors is called “rational sentiment”. Although investors’ rational sentiment is still sentiment, the purification of sentiment is performed mainly to remove the non-sentiment (rational) factors from the investor sentiment index. Hence, the approach in this paper starts from the sentiment itself and studies the rational and irrational elements in sentiment. The important characteristics of rational sentiment are that it correctly predicts future returns and is forward-looking.
In this paper, the part of investor sentiment that correctly predicts future returns and reflects “Smart Money” is defined as rational sentiment, while the other part of investor sentiment that has a systematic impact on price but cannot correctly predict future returns and reflects “Dumb Money” is defined as irrational sentiment [45].
The two types of sentiment have the following three characteristics:
Characteristic 1: Both must have a systematic impact on price;
Characteristic 2: As a manifestation of “Smart Money” in the market, rational sentiment can correctly predict future returns, while irrational sentiment (as “Dumb Money”) cannot correctly predict future returns;
Characteristic 3: Rational sentiment is bound to be affected by fundamental factors in the past. Although investors use more feedback trading (price–sentiment–price), they do not mainly focus on fundamental factors, so irrational sentiment should be irrelevant to fundamental factors and be affected by past returns.
4.1. Methodology
In this Section, the multiple regression model was used, and we use the residual of the regression for the leverage ratio after purification. Pearson correlation analysis was used to test the correlation between the leverage ratio and past or future values of return. The multiple regression model was used to test the ability of the leverage ratio to predict future returns. The anecdotal history interpretation method was used for intuitive analysis, and the Granger Causality test was used for the leverage ratio and macroeconomic factors.
4.2. Purification of the Leverage Ratio
The leverage ratio was regressed on fundamental factors (including market factors and macroeconomic factors), and (rational) factors in the leverage ratio that are not sentiment-related were removed to extract “purer” sentiment parts. Therefore, we use the residual of the regression shown in Table 3 for Table 4. The regression results are shown in Table 3, and descriptive statistics of the leverage ratio after purification are shown in Table 4. The leverage ratio used in the rest of this paper is the leverage ratio after purification.
4.3. Sentiment Characteristics of the Leverage Ratio
As mentioned in Section 3.1., sentiment has three important characteristics. These criteria were used to incrementally verify the leverage ratio after purification.
4.3.1. Does the Leverage Ratio have a Systemic Effect on Market Return?
Pearson correlation analysis was used to test the correlation between the leverage ratio and market return to examine whether the leverage ratio has a stable and significant impact on market return. The results are shown in Table 5.
Table 5 shows that, in the short term, there is a significant correlation between the leverage ratio and market return, indicating that leveraged trading has a significant systemic effect on price. Because market factors were eliminated by the purification of the leverage ratio, the leverage ratio after purification and present returns are no longer relevant. The leverage ratio shows a significant positive correlation with past returns (before period t, the correlation between the leverage ratio and return is significantly positive, and the magnitude of the correlation is relatively large (greater than 0.3), and future returns show a significant negative correlation (after period t, the correlation between the leverage ratio and returns is significantly negative, and the magnitude of the correlation is also relatively large(almost greater than 0.3). In the longer term (more than two months), the leverage ratio is not significantly correlated with returns. This shows that the leverage ratio is more susceptible to past high returns and is an inverse indicator of future returns; in the long run, the leverage ratio no longer has a predictive effect on returns. This confirms that the leverage ratio exhibits irrational sentiment according to Characteristic 1 of sentiment.
4.3.2. Can the Leverage Ratio Correctly Predict Future Returns?
According to the characteristics of investor sentiment, rational sentiment can correctly predict future returns, while irrational sentiment cannot. Table 5 shows that the leverage ratio is an inverse indicator of future returns, but the above-mentioned statistical correlation analysis did not control for other factors. After adding the necessary control variables, the multiple regression model was used to test the ability of the leverage ratio to predict future returns. The regression results are shown in Table 6.
Table 6 shows that the leverage ratio does not correctly predict future returns. On the one hand, the leverage ratio has a significant impact on the short-term returns for the next 3 months, but it has little ability to correctly predict future longer term (more than three months) returns. On the other hand, the leverage ratio has a significant negative impact on short-term returns, and the magnitude of the effect is relatively large, which means that the leverage ratio is a reverse indicator of short-term returns. This shows that the leverage ratio does not correctly predict future returns and confirms that the leverage ratio exhibits irrational sentiment according to Characteristic 2 of sentiment.
4.3.3. Is the Leverage Ratio Unrelated to Fundamental Factors, and Will it Be Affected by Past Returns?
Rational sentiment is affected by fundamental factors in the past, while irrational sentiment is not related to fundamental factors and is affected by past returns. This was verified by two aspects: First, the lead or lag relationship between the leverage ratio and market index (represented by the Shanghai Composite Index) was examined to verify whether the leverage ratio is affected by past returns; second, the Granger Causality Test was used to verify that the leverage ratio is unrelated to fundamental factors.
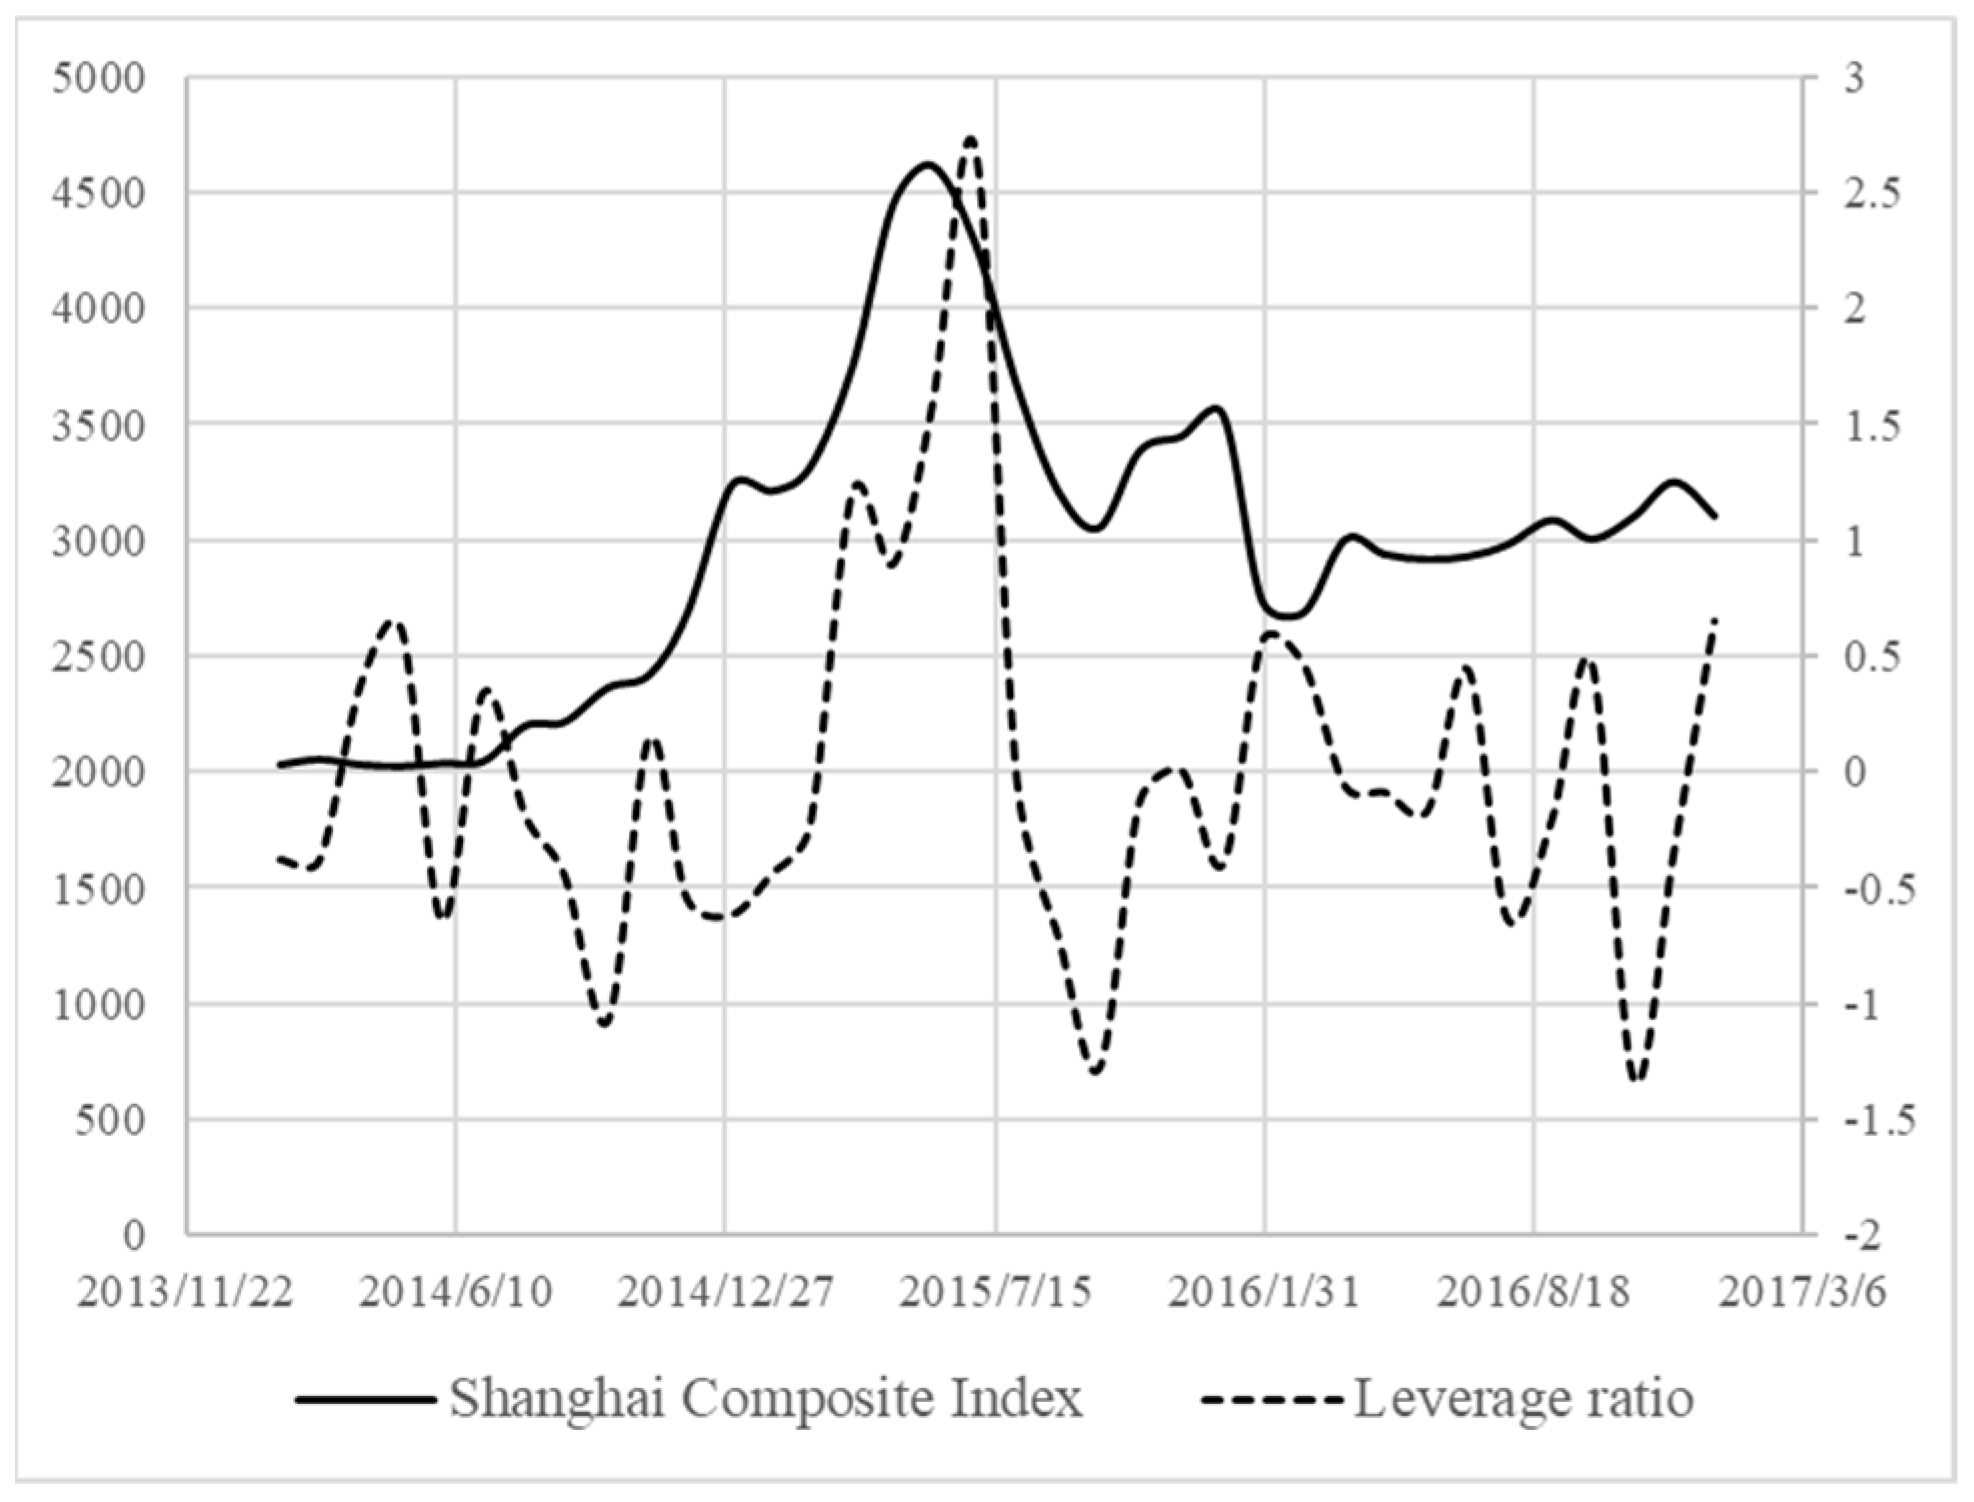
First, the lead or lag relationship between the leverage ratio and market index was examined. The anecdotal history interpretation method [27,28] was used for intuitive analysis. Figure 1 shows the time trend of the Shanghai Composite Index and the leverage ratio (the left axis is the Shanghai Composite Index, and the right axis is the leverage ratio).
Figure 1 shows that the leverage ratio clearly does not have a stable lead or lag relationship with the Shanghai Composite Index. The leverage ratio shows obvious characteristics of irrational sentiment.
First, although the volatility of the leverage ratio is greater than that of the Shanghai Composite Index, it reflects that the leverage ratio is more sensitive to market changes. However, the sensitivity of the leverage ratio is not derived from the “forward-looking” nature of the market future trends. The sensitivity of rational sentiment to market price changes comes from the "forward-looking" nature of "Smart Money" to market trends. On the contrary, the leverage ratio has a significant lag effect on market price changes. In this regard, we chose three representative time points for interpretation: (1) After this round of the bull market started in July 2014, the Shanghai Composite Index rose steadily, but from July 2014 to September 2014, the leverage ratio continued to decline, while it started to rise rapidly after October 2014; (2) after the market crash occurred in early June 2015, the leverage ratio did not decrease rapidly with the market crash, but continued to surge until 2015—the rapid decline only began in early July 2015; (3) after the market melted down in early January 2016, the decline in the leverage ratio also lagged significantly. The lag effect indicates that the leverage ratio is mainly affected by past returns rather than future returns.
Second, the leverage ratio cannot correctly predict future trends. As shown in Figure 1, the leverage ratio is almost negatively related to the future trends of the Shanghai Composite Index; especially after February 2016, the market gradually emerged from the fuse shadow. The Shanghai Composite Index started to rise steadily, but at this time, the volatility of the leverage ratio was very sharp. The leverage ratio does not show a stable correlation with the future trends of the Shanghai Composite Index.
Third, there are obvious “underreactions” and “overreactions” in the leverage ratio. Underreaction occurs when the change in the leverage ratio has a significant lag effect on the change in the Shanghai Composite Index. In particular, the leverage ratio only started to increase after the Shanghai Composite Index achieved a considerable increase, reflecting the “conservative” characteristics of irrational sentiment. Overreaction means that the volatility of the leverage ratio is higher than that of the Shanghai Composite Index; in particular, when the Shanghai Composite Index declines, the decline in the leverage ratio tends to be much larger, which also reflects the characteristics of irrational sentiment.
An interpretation of the Shanghai Composite Index and leverage ratio time series reveals that the leverage ratio has obvious characteristics of irrational sentiment. Changes in the leverage ratio have a significant sensitivity to price volatility, but this sensitivity is completely different from the “forward-looking” characteristics of rational sentiment. Leverage ratios are mainly affected by past returns, but they do not correctly predict future returns.
Besides this, rational sentiment is affected by fundamental factors in the past, while irrational sentiment has nothing to do with fundamental factors and is affected by past returns. Granger causality test was used for the leverage ratio and macroeconomic factors, and macroeconomic factors were treated as exogenous variables. The results are shown in Table 7.
Table 7 shows that the leverage ratio is not the Granger cause for returns, and the leverage ratio does not have the ability to correctly predict future returns. However, returns are the Granger reason for the leverage ratio; thus, the leverage ratio is indeed affected by past returns, which is consistent with the analysis of Figure 1. Macroeconomic factors (consumer price index, industrial added value growth, and macroeconomic prosperity index) are not Granger reasons for the leverage ratio, indicating that the leverage ratio is not affected by past fundamental factors. This confirms that the leverage ratio exhibits irrational sentiment according to Characteristic 3 of sentiment.
In summary, empirical tests were conducted on the leverage ratio using the three characteristics of sentiment one by one, and the results confirm that the leverage ratio exhibits irrational sentiment characteristics.
So far, the Hypothesis Two is verified.
5. Robustness Test
Two questions need to be answered to ensure that the conclusions are sufficiently robust: (i) Is the leverage ratio a good proxy for irrational sentiment? Can it reflect common trends with regard to mainstream irrational sentiment proxies? (ii) The leverage ratio is a relatively significant reverse indicator of future short-term returns: If a reverse arbitrage portfolio is constructed (long-buying low leverage ratio portfolios and short-selling high leverage ratio portfolios), is it possible to obtain significant short-term excess returns? Robustness tests were conducted to answer these questions.
5.1. Methodology for Robustness Test
In this Section, Pearson correlation analysis was conducted between the leverage ratio and mainstream irrational sentiment proxies. We construct a zero-cost arbitrage portfolio by using the leverage reverse arbitrage strategy based on leverage ratios, and we use the multiple factors models (i.e. CAPM, the Three-Factor Model [46], and the Four-Factor Model [47]) to test the effective of the inverse arbitrage strategy. The details are shown in Section 5.2 and Section 5.3.
5.2. Representation of the Leverage Ratio as a Sentiment Proxy
Pearson correlation analysis was conducted between the leverage ratio and mainstream irrational sentiment proxies (i.e., market turnover, closed-end fund discount rate, market trading volume, number of IPO, number of new investor accounts, IPO first-day return, consumer confidence index, investor confidence index (source: The Wind Database), and CICSI [48]) to determine whether the leverage ratio reflects common trends with regard to mainstream irrational sentiment proxies. The correlation results are shown in Table 8.
Table 8 shows that the leverage ratio is significantly positively correlated with irrational sentiment proxies, and the magnitude of the correlation is relatively large (greater than 0.3). This shows that the leverage ratio is a good proxy for irrational sentiment. To a certain extent, this implies that investors who engage in leveraged trading are mostly irrational (individual) investors, which is in line with the situation in the Chinese stock market.
5.3. Effective of the Inverse Arbitrage Strategies based on Leverage Ratios
First, individual stocks were grouped from high to low by the leverage ratio and divided into three groups: A high leverage ratio group (H: The leverage ratio is above 70%), a low leverage ratio group (L: The leverage ratio is below 30%), and a medium leverage ratio group (M: The leverage ratio is between 30% and 70%). Second, a zero-cost arbitrage portfolio was constructed using the leverage reverse arbitrage strategy (LMH), that is, long buying the stock portfolio of the low leverage ratio group and short selling the stock portfolio of the high leverage ratio group at the same time. Finally, the multiple factors models (i.e., CAPM, the Three-Factor Model [46], and the Four-Factor Model [47]) were used to test the short-term (within three months) returns of the arbitrage portfolio. If the arbitrage portfolio still has significant short-term (within three months) excess returns after risk adjustment for the above models, then it can be inferred that the arbitrage portfolio contains a sentiment premium, indicating that the leverage ratio reflects irrational sentiment and constitutes an independent risk factor for short-term returns. The models are shown in formulas (4)–(6):
where LMHt-1 is the excess return of the constructed arbitrage portfolio (differences in monthly returns of the low leverage ratio group and the high leverage ratio group), and i represents the lag order. According to the result in Table 5, the leverage ratio can significantly affect the returns of the next three periods. Hence, i = 1, 2, 3. was set as constant to represent excess returns after risk adjustment.
Formula (4) includes the market risk premium factor Mkt (difference between the market return and risk-free interest rate); formula (5) adds the scale factor SMB (difference in the monthly return between a small market value portfolio and large market value portfolio), the book-to-market ratio factor HML (difference in monthly returns between the high book-to-market ratio portfolio and the low book-to-market ratio portfolio); formula (6) includes a momentum factor, UMD (difference in monthly returns between the returns of the first 30% portfolio and the last 30% portfolio of the first 3 months). The risk factor data are all from the RESSET database in China.
Table 9 shows that the constants of CAPM, the Three-Factor Model, and the Four-Factor Model regression are all significantly positive at 2.23%, 3.83%, and 3.58%, respectively, and the magnitude of the effect is relatively large. Thus, after adjusting for market factors, scale factors, book-to-market ratio factors, and momentum factors, the arbitrage portfolio based on the leverage ratio in month t − 1 can still obtain significant excess returns in month t; the excess returns here are exactly the sentiment premium [49]. The excess returns of the arbitrage portfolio are still significantly present after risk adjustment, indicating that the leverage reverse arbitrage strategy has a significant ability to predict future short-term (1 month) returns. Table 10 and Table 11 show that as the number of leading periods increases, the excess returns of the arbitrage portfolio become less significant; thus, the leverage reverse arbitrage strategy does not have any predictive power for future longer term (more than 1 month) returns. This fully verifies that the leverage ratio has the typical characteristics of irrational sentiment and the inverse arbitrage strategies based on leverage ratios is effective in one month in the Chinese market.
6. Conclusions
In this paper, the correlation between leveraged trading and investor sentiment is empirically studied. First, the leverage ratio and investor sentiment feedback coefficient are verified to be significantly negatively correlated: The feedback trading pattern changes from “positive” for a low leverage ratio to “negative” for a high leverage ratio. Second, leveraged trading is verified to have the typical characteristics of irrational sentiment.
The conclusions are different from the previous studies. First, the rational financial theory asserts that leveraged trading is a rational behavior of arbitrage, and leveraged trading maintains the stock market sustainable [5,6,7]. However, we find that leveraged trading is very closely related to investor sentiment. Second, there is little literature related to the relationship between leverage ratio and the sentiment feedback coefficient, and we find the leverage ratio and sentiment feedback coefficients have an “inverted U-shaped” relationship. Third, although there is a huge literature looking at investor sentiment, including measures of investor sentiment [26,27,28,29], investor sentiment and financial market anomalies [2], investor sentiment and stock returns [30,31,32,33,34], investor sentiment and stock market risk [35,36], and investor sentiment and corporate finance [37], however, the studies failed to give a deep looking in the nature of investor sentiment. We screen the multidimensionality contained in the leverage ratio to accurately capture the relationship between the leverage ratio and investor sentiment, and we find that the leverage ratio after purification has the typical characteristics of irrational sentiment. Generally speaking, the conclusions provide new insights in understanding leveraged trading and investor sentiment in the Chinese stock market.
The characteristics of leveraged trading are discussed from the perspective of investor sentiment. Rational financial theory asserts that leveraged trading can facilitate arbitrage, thereby improving market pricing efficiency. However, because leveraged trading in the Chinese stock market is significantly characterized by “strong margin trading and weak short selling”, it not only fails to eliminate arbitrage restrictions, but also increases the risk of noise traders, induces abnormal volatility, and disrupts market stability. This paper provides a new theoretical perspective and realistic evidence for supervising leveraged trading in the Chinese stock market.
There are some recommendations for investors’ decision. Investors can use the characteristics of the leverage ratio to develop arbitrage strategies, which can achieve significant excess returns. Specifically, investors construct the following arbitrage portfolio: Long buying the stock portfolio of the low leverage ratio group and short selling the stock portfolio of the high leverage ratio group at the same time in month t, which can obtain significant excess returns in month t + 1. The reverse arbitrage strategy constructed on the basis of leverage as an inverse indicator of future short-term return is a good interpretation of Warren Buffett’s classic saying: “The time to be greedy is when others are afraid, and the time to be afraid is when others are greedy.” Such arbitrage activities also reduce the impact of leveraged trading on volatility and maintain sustainability in the stock market.
However, this paper has several limitations that need future study. First, we only consider “the whole period of abnormal volatility”, and this leads to a risk of data snooping. Therefore, high frequent (daily, weekly) data and more recent data should be applied for further empirical research. Second, conducting country comparisons and analyzing the differences between stock markets in different countries will make sense. Third, investor trading data from investment banks and the method of computational finance can be applied to analyze the micro mechanism of leveraged trading affecting investors’ behavior. Therefore, more investigations should be conducted to enhance the reliability and applicability of the research results.
Author Contributions
Conceptualization, Z.P.; Formal analysis, Z.P.; Supervision, C.H.; Validation, C.H. All authors have read and agreed to the published version of the manuscript.
Funding
This work is supported by the Postdoctoral Science Foundation of China (2019M652605) and the National Natural Science Foundation of China (71671134).
Conflicts of Interest
The authors declare no conflict of interest.
References
- Fama, E.F. Efficient Capital Market: A Review of Theory and Empirical Work. J. Financ. 1970, 25, 382–417. [Google Scholar] [CrossRef]
- Shiller, R.J. The Use of Volatility Measures in Assessing Market Efficiency. J. Financ. 1981, 36, 291–304. [Google Scholar]
- Chu, J.; Fang, J.X. Margin-trading, Short-selling and the Deterioration of Crash Risk. Econ. Res. J. 2016, 5, 143–158. [Google Scholar]
- Xu, C.S.; Ma, K. The Effect of Margin Trading on the Stock Overvaluation in the Bull Market: An Empirical Analysis Based on the Data of 2014 Shanghai A-shares. Econ. Rev. 2017, 1, 40–52. [Google Scholar]
- Hsieh, D.A.; Miller, M.H. Margin Regulation and Stock Market Volatility. J. Financ. 1990, 45, 3–29. [Google Scholar] [CrossRef]
- Xiao, H.; Kong, A.G. A Study on the Mechanism of the Securities Margin Trading on the Fluctuations of the Special Nature of the Stock Price: A test Based on the Difference-in-Difference Model. Manag. World 2014, 8, 30–43. [Google Scholar]
- Li, Z.S.; Chen, C.; Li, B.X. Does Short Selling Improve Price Efficiency in the Chinese stock market? Evidence from Natural Experiments. Econ. Res. J. 2015, 5, 165–177. [Google Scholar]
- Chowdhry, B.; Nanda, V. Leverage and Market Stability: The Role of Margin Rules and Price Limits. J. Bus. 1998, 71, 179–210. [Google Scholar] [CrossRef]
- Hong, H.; Stein, J.C. Differences of Opinion, Short-Sales Constraints, and Market Crashes. Rev. Financ. Stud. 2003, 16, 487–525. [Google Scholar] [CrossRef]
- Wang, Z.Y.; Wang, Z.X. Price Limit, Margin Trading and Stock Price Volatility: A Comparative Study between A-share and H-share. Econ. Res. J. 2017, 4, 151–165. [Google Scholar]
- Verma, R.; Verma, P. Noise Trading and Stock Market Volatility. J. Multinatl. Financ. Manag. 2007, 17, 231–243. [Google Scholar] [CrossRef]
- Hu, C.S.; Chi, Y.C. Investor Sentiment: Rational or Irrational. Chin. Rev. Financ. Stud. 2012, 6, 46–62. [Google Scholar]
- Benartzi, S.; Thaler, R.H. Myopic Loss Aversion and the Equity Premium Puzzle. Q. J. Econ. 1995, 110, 73–92. [Google Scholar] [CrossRef] [Green Version]
- Barberis, N.; Thaler, R. A Survey of Behavioral Finance. Handb. Econ. Financ. 2003, 1, 1053–1128. [Google Scholar]
- Thaler, R.H. Mental Accounting Matters. J. Behav. Decis. Mak. 1999, 12, 183–206. [Google Scholar] [CrossRef]
- Thaler, R.H.; Johnson, E.J. Gambling with the House Money and Trying to Break Even: The Effects of Prior Outcomes on Risky Choice. Manag. Sci. 1990, 36, 643–660. [Google Scholar] [CrossRef] [Green Version]
- Barberis, N.; Huang, M. Stocks as Lotteries: The Implications of Probability Weighting for Security Prices. Am. Econ. Rev. 2008, 98, 2066–2100. [Google Scholar] [CrossRef] [Green Version]
- Barberis, N.; Xiong, W. Realization Utility. J. Financ. Econ. 2012, 104, 251–271. [Google Scholar] [CrossRef]
- Lee, C.; Shleifer, A.; Thaler, R.H. Investor Sentiment and the Closed-End Fund Puzzle. J. Financ. 1991, 46, 75–109. [Google Scholar] [CrossRef]
- Kahneman, D.; Riepe, M.W. Aspects of Investor Psychology. J. Portf. Manag. 1998, 24, 52–65. [Google Scholar] [CrossRef]
- Guo, W.C.; Wang, F.Y.; Wu, H.M. Financial Leverage and Market Volatility with Diverse Beliefs. Econ. Theory 2011, 47, 337–364. [Google Scholar] [CrossRef] [Green Version]
- De Long, J.B.; Shleifer, A.; Summers, L.H.; Waldmann, R. Noise Trader Risk in Financial Markets. J. Political Econ. 1990, 98, 703–738. [Google Scholar] [CrossRef]
- Tversky, A.; Kahneman, D. Availability: A Heuristic for Judging Frequency and Probability. Cogn. Psychol. 1974, 4, 207–232. [Google Scholar]
- Barberis, N.; Shleifer, A.; Vishny, R. A Model of Investor Sentiment. J. Financ. Econ. 1998, 49, 307–343. [Google Scholar] [CrossRef]
- De Bondt, W.P.M. Betting on Trends: Intuitive Forecasts of Financial Risk and Return. Int. J. Forecast. 1993, 9, 355–371. [Google Scholar] [CrossRef]
- Brown, G.W.; Cliff, M.T. Investor Sentiment and the Near-Term Stock Market. J. Empir. Financ. 2004, 11, 1–27. [Google Scholar] [CrossRef]
- Baker, M.; Wurgler, J. Investor Sentiment and the Cross-Section of Stock Return. J. Financ. 2006, 61, 1645–1680. [Google Scholar] [CrossRef] [Green Version]
- Baker, M.; Wurgler, J. Investor Sentiment in the Stock Market. J. Econ. Perspect. 2007, 21, 129–152. [Google Scholar] [CrossRef] [Green Version]
- Khan, M.; Ahmad, E. Measurement of Investor Sentiment and Its Bi-Directional Contemporaneous and Lead–Lag Relationship with Returns: Evidence from Pakistan. Sustainability 2019, 11, 94. [Google Scholar] [CrossRef] [Green Version]
- Yu, J.F.; Yuan, Y. Investor Sentiment and the Mean–Variance Relation. J. Financ. Econ. 2011, 100, 367–381. [Google Scholar] [CrossRef] [Green Version]
- Stambaugh, R.F.; Yu, J.F.; Yuan, Y. The Short of It: Investor Sentiment and Anomalies. J. Financ. Econ. 2012, 104, 288–302. [Google Scholar] [CrossRef] [Green Version]
- Stambaugh, R.F.; Yu, J.F.; Yuan, Y. The Long of It: Odds that Investor Sentiment Spuriously Predicts Anomaly Returns. J. Financ. Econ. 2014, 114, 613–619. [Google Scholar] [CrossRef] [Green Version]
- Huang, D.F.; Jiang, J.T.; Zhou, G. Investor Sentiment Aligned: A Powerful Predictor of Stock Returns. Rev. Financ. Stud. 2015, 28, 791–837. [Google Scholar] [CrossRef]
- Seok, S.I.; Cho, H.; Park, C.; Ryu, D. Do Overnight Returns Truly Measure Firm-Specific Investor Sentiment in the KOSPI Market? Sustainability 2019, 11, 3718. [Google Scholar] [CrossRef] [Green Version]
- Liu, S.Y.; Lee, Y.T.; Yang, Y.H. The Systematic Crash Risk and Investor Preference in Chinese Stock Market. J. Financ. Res. 2016, 428, 55–70. [Google Scholar]
- Guijarro, F.; Moya-Clemente, I.; Saleemi, J. Liquidity Risk and Investors’ Mood: Linking the Financial Market Liquidity to Sentiment Analysis through Twitter in the S&P500 Index. Sustainability 2019, 11, 7048. [Google Scholar]
- Owen, A.L.; Jeremy, C.S. Investor Sentiment and Corporate Finance: Micro and Macro. Am. Econ. Rev. 2006, 96, 147–151. [Google Scholar]
- Wang, Y.; Iorio, A.D. The Cross Section of Expected Stock Returns in the Chinese A-Share Market. Glob. Financ. J. 2007, 17, 335–349. [Google Scholar] [CrossRef]
- Zhu, B.; Niu, F. Investor Sentiment, Accounting Information and Stock Price: Evidence from China. Pac.-Basin Financ. J. 2016, 38, 125–134. [Google Scholar] [CrossRef]
- Baker, M.; Stein, J.C. Market Liquidity as a Sentiment Indicator. J. Financ. Mark. 2004, 7, 271–299. [Google Scholar] [CrossRef] [Green Version]
- Hu, C.S.; Peng, Z.; Chi, Y.C. Feedback Trading, Trading Inducement and Asset Price Behavior. Econ. Res. J. 2017, 5, 189–202. [Google Scholar]
- Amihud, Y. Illiquidity and Stock Return: Cross-Section and Time-Series Effects. J. Financ. Mark. 2002, 5, 31–56. [Google Scholar] [CrossRef] [Green Version]
- Kumar, A.; Lee, C. Retail Investor Sentiment and Return Co-movements. J. Financ. 2006, 61, 2451–2486. [Google Scholar] [CrossRef]
- Xiong, W.; Yu, J. The Chinese Warrants Bubble. Am. Econ. Rev. 2011, 101, 2723–2753. [Google Scholar] [CrossRef] [Green Version]
- Schmeling, M. Institutional and Individual Sentiment: Smart Money and Noise Trader Risk? Int. J. Forecast. 2007, 23, 127–145. [Google Scholar] [CrossRef] [Green Version]
- Fama, E.F.; French, K.R. Common Risk Factors in the Return on Stocks and Bonds. J. Financ. Econ. 1993, 33, 3–56. [Google Scholar] [CrossRef]
- Carhart, M.M. On Persistence in Mutual Fund Performance. J. Financ. 1997, 52, 57–82. [Google Scholar] [CrossRef]
- Yi, Z.G.; Mao, N. The Measurement of Sentiment in Chinese Stock Market: The Construction of CICSI. J. Financ. Res. 2009, 11, 174–184. [Google Scholar]
- Tang, J.W.; Wang, C. Market Sentiment, Premiums and Volatility. Econ. Rev. 2009, 4, 58–64. [Google Scholar]
Figure 1.
Time trend of the Shanghai Composite Index (left y-axis) and the leverage ratio (right y-axis).
Figure 1.
Time trend of the Shanghai Composite Index (left y-axis) and the leverage ratio (right y-axis).


Table 1.
Descriptive statistics of variables.
| Variables | Meaning of Variables | Sample Size | Mean | Standard Deviation | Min | Max |
|---|---|---|---|---|---|---|
| Explained variable: Investors’ sentiment feedback coefficient | ||||||
| sentimentfeedback | Investors’ sentiment feedback coefficient | 36 | −0.795 | 5.563 | −10.130 | 8.874 |
| Core explanatory variable: Market leverage ratio | ||||||
| tradingleverage | Market leverage ratio % | 36 | 10.294 | 1.650 | 6.642 | 14.286 |
| Control variables | ||||||
| anmktretn | Annualized rate of return % | 36 | 2.144 | 9.428 | −27.709 | 19.662 |
| illiquidity | Market illiquidity | 36 | 0.268 | 0.152 | 0.110 | 0.825 |
| anvolatility | Annualized volatility % | 36 | 49.688 | 6.662 | 41.635 | 58.375 |
Table 2.
Regression result of the leverage ratio to the sentiment feedback coefficient.
| Model 1 | Model 2 | Model 3 | |
|---|---|---|---|
| Variables | sentimentfeedback | ||
| sentimentfeedback -1 | 0.000448 | ||
| tradingleverage | −0.0310 | 6.561 * | 10.40 *** |
| tradingleverage2 | −0.309 ** | −0.477 *** | |
| anmktretn | 0.427 *** | 0.422 *** | 0.432 *** |
| illiquidity | 14.17 ** | 15.33 *** | 11.93 * |
| anvolatility | −0.894 ** | −0.790 ** | −0.217 * |
| constant | 29.99 ** | −7.273 | −47.87 *** |
| N | 36 | 36 | 35 |
| Adj R-squared | 0.591 | 0.608 | 0.547 |
| F statistic | 26.24 *** | 20.55 *** | 18.75 *** |
| Portmanteau (Q) statistic | 9.9202 | 9.4293 | 9.6887 |
Note: The robust standard errors are used in the estimation. * represents significance at the 10% significance level; *** represents significance at the 1% significance level. The portmanteau (Q) statistic is used to test time series autocorrelation. The portmanteau (Q) statistics are not significant at the 10% significance level in Model 1–Model 3. Therefore, we can accept the null hypothesis of no autocorrelation. sentimentfeedback-1 represents the value of sentimentfeedback lagged one-month term. tradingleverage2 represents the squared value of tradingleverage.
Table 3.
Purification result of the leverage ratio.
| Variables | Leverage Ratio | |
|---|---|---|
| Market factors | anmktretn (Annualized rate of return %) | −0.0217 |
| illiquidity (Market illiquidity) | −1.978 * | |
| anvolatility (Annualized volatility %) | −0.0156 | |
| Macroeconomic factors | cpi (Consumer Price Index YoY growth %) | 1.709 *** |
| iavr (Industrial Added Value YoY growth %) | 0.0809 | |
| mci (Macroeconomic Prosperity Index) | −0.245 *** | |
| constant | 25.72 *** | |
| N | 36 | |
| Adj R-squared | 0.724 | |
| F statistic | 24.65 *** | |
| Portmanteau (Q) statistic | 23.20 |
Note: The robust standard errors are used in the estimation. * represents significance at the 10% significance level; ** represents significance at the 5% significance level; *** represents significance at the 1% significance level. The portmanteau (Q) statistic is used to test time series autocorrelation. The portmanteau (Q) statistics are not significant at the 10% significance level. Therefore, we can accept the null hypothesis of no autocorrelation. The macroeconomic prosperity index is compiled through regular questionnaire surveys of entrepreneurs. It is based on entrepreneurs’ judgments and expectations of the company’s operating conditions and macroeconomic conditions, thereby positively reflecting the company’s operation conditions and positively forecasting the macroeconomic conditions in the future. The macroeconomic prosperity index is mainly reflected by the entrepreneur confidence index and the business prosperity index. We use the data of the macroeconomic prosperity index from the Wind database in China.
Table 4.
Descriptive statistics of the leverage ratio after purification.
| Variable | Meaning of Variables | Sample Size | Mean | Standard Deviation | Min | Max |
|---|---|---|---|---|---|---|
| pureleverage | leverage ratio after purification | 36 | 0 | 0.789 | −1.332 | 2.690 |
Table 5.
Pearson correlation analysis of the leverage ratio and market return.
| Market Return (anmktretnk) | Month t − 3 | Month t − 2 | Month t − 1 | Month t | Month t + 1 | Month t + 2 | Month t + 3 |
|---|---|---|---|---|---|---|---|
| pureleveraget | 0.315 * | 0.340 ** | 0.390 ** | 0 | −0.441 ** | −0.298 * | −0.160 |
Note: The Pearson correlation coefficients between pureleveraget and anmktretnk (k= t-3, t-2, t-1, t, t+1, t+2, t+3) are listed in Table 5. * represents significance at the 10% significance level; ** represents significance at the 5% significance level.
Table 6.
Prediction result of the leverage ratio for future returns.
| Months in Advance | pureleverage | Adj R-squared | Months in Advance | pureleverage | Adj R-squared |
|---|---|---|---|---|---|
| 1 | −2.335 | 0.136 | 7 | −0.652 | 0.087 |
| 2 | −3.735 * | 0.197 | 8 | −1.666 | 0.105 |
| 3 | −5.079 *** | 0.268 | 9 | 3.987 | 0.175 |
| 4 | 0.292 | 0.089 | 10 | 1.066 | 0.093 |
| 5 | 1.176 | 0.096 | 11 | 2.114 | 0.109 |
| 6 | −1.008 | 0.091 | 12 | 3.509 * | 0.161 |
Note: The following regression model was constructed: , k=t-1, t-2, t-3, t-10, t-11, t-12. The robust standard errors are used in the estimation. * represents significance at the 10% significance level; *** represents significance at the 1% significance level.
Table 7.
Granger causality test results.
| Item | Optimal Lag Order | F Statistic | chi2 Statistic | Results |
|---|---|---|---|---|
| anmktretn is not the Granger cause of pureleverage | 3 | 3.36 ** | 12.79 *** | Rejected |
| pureleverage is not the Granger cause of anmktretn | 3 | 0.98 | 1.07 | Accepted |
| cpi is not the Granger cause of pureleverage | 3 | 0.22 | 0.24 | Accepted |
| iavr is not the Granger cause of pureleverage | 3 | 2.07 | 2.26 | Accepted |
| mci is not the Granger cause of pureleverage | 3 | 0.65 | 0.71 | Accepted |
Note: The optimal lag order was jointly determined according to AIC and BIC. ** represents significance at the 5% significance level; *** represents significance at the 1% significance level.
Table 8.
Pearson correlation between the leverage ratio and mainstream irrational sentiment proxies.
Table 8.
Pearson correlation between the leverage ratio and mainstream irrational sentiment proxies.
| Market Turnover | Closed-End Fund Discount Rate | Market Trading Volume | Number of IPO | Number of New Investor Accounts | |
|---|---|---|---|---|---|
| pureleverage | 0.333 ** | 0.397 ** | 0.244 | 0.380 ** | 0.351 ** |
| IPO first-day return | Consumer confidence index | Investor confidence index | CICSI | ||
| pureleverage | −0.002 | 0.172 | −0.041 | 0.359 ** | |
Note: The Pearson correlation coefficients between pureleverage in month t and mainstream irrational sentiment proxies in month t are listed in Table 8. ** represents significance at the 5% significance level. IPO represents Initial Public Offering. CICSI represents Compound Index of China Stock Market Investor Sentiment constructed by Yi and Mao [48].
Table 9.
Effect of the leverage ratio change in month t − 1 on month t returns.
| CAPM | Three-Factor Model | Four-Factor Model | |
|---|---|---|---|
| Variables | LMH | ||
| Mkt | −0.244 * | −0.163 | −0.144 |
| SMB | −0.911 *** | −0.892 *** | |
| HML | −1.157 *** | −1.098 *** | |
| UMD | −0.0572 | ||
| Constant | 2.231 ** | 3.826 *** | 3.579 *** |
| N | 35 | 35 | 35 |
| Adj R-squared | 0.097 | 0.293 | 0.276 |
| F statistic | 3.79 * | 7.83 *** | 6.81 *** |
| Portmanteau (Q) statistic | 16.3022 | 11.4502 | 10.8724 |
Note: The robust standard errors are used in the estimation. * represents significance at the 10% significance level; ** represents significance at the 5% significance level; *** represents significance at the 1% significance level. The portmanteau (Q) statistic is used to test time series autocorrelation. The portmanteau (Q) statistics are not significant at the 10% significance level. Therefore, we can accept the null hypothesis of no autocorrelation.
Table 10.
Effect of the leverage ratio change in month t − 2 on month t returns.
| CAPM | Three-Factor Model | Four-Factor Model | |
|---|---|---|---|
| Variables | LMH | ||
| Mkt | −0.0709 | −0.0618 | 0.0132 |
| SMB | −0.206 | −0.135 | |
| HML | −0.383 | −0.152 | |
| UMD | −0.225 ** | ||
| Constant | 1.961 * | 2.302 | 1.326 |
| N | 34 | 34 | 34 |
| Adj R-squared | −0.020 | −0.057 | 0.007 |
| F statistic Portmanteau (Q) statistic | 0.23 28.13 ** | 0.55 23.00 * | 1.92 18.72 |
Note: The robust standard errors are used in the estimation. * represents significance at the 10% significance level; ** represents significance at the 5% significance level. The portmanteau (Q) statistic is used to test time series autocorrelation. We can reject the null hypothesis of no autocorrelation in CAPM and Three-Factor Model, while we can accept the null hypothesis of no autocorrelation in Four-Factor Model.
Table 11.
Effect of the leverage ratio change in month t − 3 on month t returns.
| CAPM | Three-Factor Model | Four-Factor Model | |
|---|---|---|---|
| Variables | LMH | ||
| Mkt | 0.0799 | 0.0449 | 0.106 |
| SMB | 0.127 | 0.179 | |
| HML | −0.148 | 0.0385 | |
| UMD | −0.188 | ||
| Constant | 1.766 | 1.524 | 0.765 |
| N | 33 | 33 | 33 |
| Adj R-squared | −0.019 | −0.035 | −0.003 |
| F statistic Portmanteau (Q) statistic | 0.25 25.60 ** | 0.47 22.88 * | 2.40 * 22.03 * |
Note: The robust standard errors are used in the estimation. * represents significance at the 10% significance level; ** represents significance at the 5% significance level. The portmanteau (Q) statistic is used to test time series autocorrelation. We can reject the null hypothesis of no autocorrelation in all of these three models.
© 2020 by the authors. Licensee MDPI, Basel, Switzerland. This article is an open access article distributed under the terms and conditions of the Creative Commons Attribution (CC BY) license (http://creativecommons.org/licenses/by/4.0/).
Share and Cite
MDPI and ACS Style
Peng, Z.; Hu, C. Leveraged Trading, Irrational Sentiment and Sustainability in the Stock Market: Evidence from China. Sustainability 2020, 12, 1310. https://doi.org/10.3390/su12041310
AMA Style
Peng Z, Hu C. Leveraged Trading, Irrational Sentiment and Sustainability in the Stock Market: Evidence from China. Sustainability. 2020; 12(4):1310. https://doi.org/10.3390/su12041310
Chicago/Turabian StylePeng, Zhen, and Changsheng Hu. 2020. "Leveraged Trading, Irrational Sentiment and Sustainability in the Stock Market: Evidence from China" Sustainability 12, no. 4: 1310. https://doi.org/10.3390/su12041310
Note that from the first issue of 2016, this journal uses article numbers instead of page numbers. See further details here.