The Rape Pomace and Microcrystalline Cellulose Composites Made by Press Processing


Department of Production Engineering, Institute of Mechanical Engineering, Warsaw University of Life Sciences—SGGW, Nowoursynowska str. 164, 02-787 Warsaw, Poland
*
Author to whom correspondence should be addressed.
Sustainability 2020, 12(4), 1311; https://doi.org/10.3390/su12041311
Submission received: 14 January 2020
/
Revised: 3 February 2020
/
Accepted: 5 February 2020
/
Published: 11 February 2020
Abstract
:This paper presents the results of research on biocomposites resulting from the combination of post-extraction rapeseed meal (RP) and microcrystalline cellulose (MCC). The products were fabricated using a press machine with a mould heating system. The biocomposites were then subjected to stress tests, their surface wettability was determined and color analyses were conducted. Fourier Transform Infrared Spectroscopy (FTIR), a cross-section observed by scanning electron microscope (SEM) and thermogravimetric analysis (TGA) were used to examine the structure and thermomechanical properties of the material obtained. The research results showed that an increase in the share of MCC to 8% and increasing the process temperature to 140 °C improved the strength parameters of the products obtained, as well as their thermal resistance. It was also found that the wettability of products was affected both by process temperature and addition of cellulose; similar wettability results were obtained for MCC 8% (120 °C) and MCC 2% (140 °C). Photographs taken using a scanning electron microscope revealed that the biocomposite surface was the smoothest in the case of materials fabricated under the highest process temperature and with the highest MCC proportion.
1. Introduction
Progressing degradation of the natural environment is a factor that obligates societies to work towards sustainable development. As awareness of sustainable development issues increases, there is a successive growth in demand for biodegradable products and packaging of various kinds. Raw materials for production of these may include biocomposites, which fit the concept of sustainable development, being made exclusively of ingredients of natural origin. Important criteria for the application of natural products in everyday life are requirements with regard to their durability and stress resistance, linked to thermal and mechanical properties of the biocomposites. This criteria, dictated both by manufacturers of products of this kind and their purchasers, obligates researchers to search for proper raw materials and their compositions [1]. Promising natural materials, which may be applied for the production of biodegradable composites include polysaccharides, proteins, lipids, and rubber [2]. The use of multiple bio-composite materials in the mass scale is very often restricted by their poor mechanical properties or the high manufacturing costs.
Therefore, it is reasonable to search for new raw materials, rich in natural polymers, which are attractive for manufacturers from an economic point of view. One example of such promising raw material is post-extraction rapeseed meal. On average, it contains approximately 35% vegetable protein and 19% raw fiber. According to the literature, the introduction of protein as a component of the mix used for the production of biocomposites is very advantageous as it improves their mechanical properties. This has been confirmed by research involving soy protein and milk protein [3]. The presence of polar amino acids in proteins, such as carboxyl and amines, enables hydroxyl groups to cross-link and form covalent bonds, which improves the mechanical properties of biocomposites [4]. In other research projects, it has been found that proteins rich in sulfur amino acids, particularly rapeseed proteins when combined with rubber, cause a substantial enhancement of the cross-linking process [5]. Some researchers believe there is a connection between improvement in properties of the composites listed above and the presence of numerous intermolecular interactions between the polymer matrix and functions in protein-based raw materials (the so-called interphase and hydrodynamic effects) [6,7]. Thanks to these properties, proteins can also be used as adhesives or binding agents in innovative composite materials [8]. On the other hand, protein-rich composites, due to a high number of nitrogen atoms in a single polypeptide molecule, show an increase in thermal resistance [9]. The properties of proteins are improved in the presence of such chemical groups as amines, phenols, and diamines, which results in a strong antioxidant effect of protein-rich biopolymers. This is associated with the binding of the active forms of oxygen, as well as the emergence of strong interactions with polymer chains [10]. According to Fahma [11], in native protein, most polar and non-polar groups are not accessible due to internal bonds, which are influenced by hydrogen bonds, hydrophobic interactions, and van der Waals forces. This kind of protein requires splitting internal bonds (the unfolding of the protein complex) or dispersion of polar protein molecules, as has been indicated by [12,13]. Therefore, in order to increase dispersion and cause the protein to gain adhesive properties, its denaturation is necessary [14]. Apart from their beneficial chemical properties, vegetable proteins are cheaper and more accessible in comparison with animal proteins, and they are more environment-friendly than synthetic binding agents (matrices). Moreover, as in the case of starch, the presence of organic matter facilitates the transport of water, which contributes to the development of microorganisms and enhances the biological degradation process. Despite a number of beneficial properties of proteins, composites made directly of protein raw materials are characterized by high rigidity [7]. Therefore, it is justifiable to combine these raw materials with other biodegradable, modern ingredients that are generally accessible. These include, for instance, microcrystalline cellulose (MCC).
Due to the advantages of MCC, mainly low cost and good mechanical properties, biocomposites filled with MCC have been widely studied, but the practical use of MCC filler into protein reach materials is limited in comparison with materials containing traditional fillers. This additive usually influences a number of biocomposite properties such as enhancement of strength parameters, decrease in density, improved morphology and biodegradability [15]. MCC is also characterized by a high specific surface area in comparison with conventional long cellulose fibers [16]. In addition, it has been reported that Young’s modulus of MCC is 25 ± 4 GPa [17]. This parameter makes it possible to obtain better interactions between the matrix and the reinforcement. Such cellulose reinforcement can be gained by using MCC in which the amorphous regions have been eliminated by hydrolysis. The application of cellulose of this kind makes it possible to enhance the mechanical properties of biocomposites and to ensure their good thermal resistance and dimensional stability [18]. This, however, is not true for all types of matrices as MCC is conventionally degraded at 220 °C [15]. Another challenge associated with the use of MCC is the alleviation of problems with the decomposition of this raw material after drying. Its behavior is associated with the presence of hydrogen bonds, which enhance adhesion between micro-fibers. According to numerous research reports, MCC has significant application potential [19]. Taking into account the fact that this raw material can be potentially obtained not only from trees or cotton but also from grass, bushes or the by-products of the agriculture and food industry, it may become a very attractive ingredient of innovative biocomposites.
Poland has a substantial production surplus of rapeseed meal, and according to experts, a high surplus of post-extraction rapeseed meal is available on the market. Thus, the rapeseed meal surplus in Poland can be used for the manufacturing of biodegradable products and packaging in line with the principles of sustainable development. However, in order to make it possible to use biocomposites made of rapeseed meal in the manufacturing of biodegradable products, they must have the desired properties. These can be enhanced by adding microcellulose (MCC). The available literature lacks information on the impact of microcellulose on the properties of biocomposites, in which rapeseed meal is the main ingredient. The research objective is to obtain a composite from a mix of rapeseed meal and microcellulose, to be subjected to tests to determine the impact of process temperature and the addition of microcellulose on physical and chemical properties of the composite obtained.
2. Materials and Methods
2.1. Materials
The research material was post-extraction rapeseed meal purchased on the domestic market (ZT Kruszwica S.A., Poland). The basic chemical composition of post-extraction meal was crude ash 7.2%, total protein 36.5%, crude fat 2.4%, crude fiber 12.5% d.m. The additive consisted of microcrystalline cellulose MCC, type MC-102 CAS N° 9004-43-6, DMF N° 9201, DCB N° 09371 (Blanver, Sao Paulo, Brazil). A biocomposite made of rapeseed meal (RP) was produced by adding microcrystalline cellulose in the proportion presented in Table 1. The addition of MCC was from 2% to 8%. The variability of the additive resulted from the literature studies, where it was shown that a small amount of crystalline cellulose significantly increases the mechanical strength of the high protein films [20]. The samples prepared were mixed using the electric agitator CAT 30 at the speed of 300 rpm for 60 s. The moisture content of the material after mixing was 9% ± 0.2%.
2.2. Biocomposite Production
The biocomposites were produced in a research workstation, which consisted of a hydraulic press FR—5014 (Farys, Rzepin, Poland) with a maximum load of 150 kN. On the piston mandrel and in the bottom part of the press, electrically heated slabs were installed, containing internal heaters with a total power of 1600 W. Temperature was controlled by heater adjusters with an accuracy of ±0.1 °C. The slab wall thickness was 15 ± 0.1 mm on both sides of the heater. A metal mold was inserted in between the slabs, making it possible to form/press a sample with an area of 30 cm2 and a thickness of 5 ± 0.1 mm (Figure 1). The mass of each sample inserted in the mold was 20 g. The stress value during the pressing process in the research project was 25 MPa. The biocomposites-forming trials were conducted under three temperatures: 120, 130, 140 °C (± 0.1 °C). The exact interval of temperatures applied can be found in Table 1. The sample pressing time was 4.5 min.
2.3. Mechanical Properties
The stress tests were conducted using the INSTRON 8802 (Instron, Norwood, MA, USA) fatigue testing system, using a three-point bending method. Bending strength (Rg) and Young’s modulus (E) were determined. Cuboidal beams with dimensions of 5 × 15 × 50 mm were used for research purposes. The beams were cut by mechanical processing. The distance between supports was 30 mm. Bending strength was calculated according to the following formula:
where Fg—bending force (maximum force recorded while bending); l—distance between supports; Wg—bending strength index Wg for a rectangular cross-section beam
where b—beam width; h—beam height.
The value of Young’s modulus was calculated according to the formula
where F0,2—bending force corresponding with strain equal to 0.2% of total strain of beam extreme fibers; l—distance between supports; f0,2—deflection corresponding with strain equal to 0.2% of total strain of beam extreme fibers; f0,2 for a rectangular cross-section beam
ε = 0,2%; Iy—moment of inertia of the cross-section; Iy—for a rectangular cross-section beam
2.4. Color Analysis
Photographs were taken using an STX stereoscopic microscope with a ring light (LED, color temperature 7000 K) equipped with an Optatech 5 Mpx camera (Opta-Tech, Warsaw, Poland). Before taking the photographs, white balance was applied, compared to the Minolta S. no. 1863310 white chart. Photos were analyzed using CorelDRAW Home and Student X7 Version 17.1.0.572 (Corel Corporation, Ottawa, Canada), with utilization of the histogram function.
2.5. Water Contact Angle
Measurements were conducted using the so-called sitting drop method, where the contact angle was determined on the basis of drop shape analysis (the measurement of the internal angle tangent to the drop edge and the surface; Figure 2). The measurement station consisted of a Nikon D5100 digital camera (Nikon, Tokyo, Japan), an adjusted measurement table and a syringe mounted in a holder, enabling accurate metering of measuring liquid (distilled water). Drops of 2 μL were placed on the surface of the biocomposite being analyzed. The photograph was taken within 1 s after drop placement. The contact angle was determined using Autodesk Autocad Mechanical 2019 Student version Product version 23.0.46.0 (Autodesk, Inc., San Rafael, CA, USA), after importing photographs to the software as a raster image.
2.6. SEM Microscopic Analysis
The structure of composite materials was analyzed using the (SEM) HITACHI S-3400N scanning electron microscope (Hitachi, Inc., Tokyo, Japan), at an accelerating voltage of 20 kV in low-vacuum conditions under 70 Pa. The composite surface and fracture were analyzed.
2.7. TGA and DTA
The thermal stability of the composites was investigated by thermogravimetric analysis (TGA) and differential thermal analysis (DTA). Research was conducted using a Q50 TGA V20. 13 (TA Instruments, New Castle, DE, USA), Build 39, at a heating speed of 10 °C·min−1 from room temperature to 650 °C, under nitrogen flow (40 mL·min1), the single sample mass being around 50 mg.
2.8. The Infrared Spectrum Analysis FTIR
The FTIR infrared spectrum analysis was conducted using an FT–IR Nicolet 8700 spectrometer (Thermo Fisher Scientific, Waltham, MA, USA). The spectra were recorded at a resolution of 2 cm−1 within the range of 400–4000 cm−1. The tests were conducted at room temperature.
2.9. Statistical Analysis
The research was conducted using two-component central composite design (DOE) 2**2 (Table 1) with interactions of individual factors, such as process temperature, the addition of MCC. The design consisted of 10 repetitions, with 2 center points and 8 non-center points. The significance of factors examined in the model was determined by an ANOVA test using statistical software STATISTICA 2013 (data analysis software system) version 13, (TIBCO Software Inc., Palo Alto, CA, USA), (Table 2). The above empirical model was used to present the results: bending strength, Young’s modulus, contact angle, L*a*b* color parameters. In order to present the results of the TGA and FTIR analysis, extreme measurement points were selected from the model (production temperature of 120 and 140 °C with the addition of 5% and 8% of MCC). The trials were conducted with 3 repetitions each.
3. Results and Discussion
3.1. Bending Strength and Young’s Modulus
It was found that the bending strength, Rg, of the biocomposites produced increased in tandem with increases in the proportion of MCC added and with increases in process temperature. The significance of the results obtained was confirmed by ANOVA variance analysis (Table 2), taking into account all variables in the empirical model. Many researchers believe that MCC reinforcement is associated with the high resistance of MCC integrated with the polymer matrix [21]. According to other researchers, an increase in strength is associated with the large total area of short fibers of MCC, which enhances the strength parameters of composites [22]. In the research conducted, it was also found that as the process temperature increased, the products tended to get darker; thus, the increase in their strength could be caused by cross-linking of rapeseed protein with MCC as a result of the Maillard reaction [23]. It was also noted that at the highest temperature applied, the impact of the proportion of cellulose was reduced to a minimum. This is indicated by reaching the maximum temperature, at which the impact of the addition of cellulose ceases to improve the bending strength (Figure 3a). However, it was found that an increase in the addition of MCC and process temperature resulted in enhanced elasticity of biocomposites, as presented in the chart in Figure 3b. The highest value of Young’s modulus was recorded at the maximum temperature, with the addition of 8% of cellulose.
3.2. Sample Surface Color Changes
Color analysis showed that the biocomposites obtained were dark, in shades close to purple and brown (Figure 3d–f). This is due to the value of coefficients a* and b*, which range between −112 and −121 on the lab color space scale. It was also found that the values of coefficients a* and b* tended to decrease along with the process temperature. An increase in the process temperature (in both cases) resulted in an increase in the value, and thus, in the proportion of red and yellow (brown). The dark color is caused mainly by rape shells visible on the biocomposite surface, and it is also associated with the change in color during denaturation and the Maillard reaction [23].
3.3. Water Contact Angle
Analysis of the contact angle has shown that the biocomposites obtained have not exceeded the value of 0° < θ < 90°, which means they are hydrophobic materials [24]. The results obtained are similar to those obtained for starch films [25]. The highest contact angle of 62.7° was obtained for the sample containing 8% of MCC, at 120 °C. A similar contact angle value of 61.75° was obtained for biocomposites containing the least MCC and produced at the highest process temperature. It was found that the contact angle increased along with process temperature and the proportion of MCC added. At process parameters (MCC 8% and temperature 140 °C), this parameter value drops slightly to 58.9°, which reflects the reduced resistance of this material to wetting. The contact angle may be also reduced due to increased roughness/porousness of the surface (temperature of 120 °C), noticeable in the SEM photos.
3.4. SEM Analysis
The structure of biocomposites obtained consisted of pressed particles of post-extraction rapeseed meal (RP) and MCC cellulose particles, melted into the polymer matrix. A similar structure of pressed rapeseed pomace was observed by other researchers [26]. The exact structure is illustrated by the photograph of the sample “bend”, showing a visibly layered structure (Figure 4a). On the other hand, the photograph in Figure 4b reveals a fibrous structure, which is typical of denaturated protein, contained in the material. Photographs in Figure 4c,d illustrate the outer surface of the biocomposites obtained. It was found that the surface of samples obtained at a temperature of 140 °C was visibly less porous in comparison with those obtained at 120 °C. This may be due to the fact that, above 130 °C, the proteins contained in the meal change their form from sol to gel. This makes them more compatible with MCC.
3.5. TGA and DTA Analysis
Exemplary series of results of thermogravimetric analysis (TGA; Figure 5a) and derivative thermogravimetric analysis (DTA; Figure 5b). Table 3 presents a summary of percentage mass losses during analysis for individual temperature ranges. Analysis of the results obtained allowed for the identification of five main stages of mass loss. The first zone is between 30 and 170 °C, and it corresponds mainly to water evaporation from the biocomposite. The mass loss in this range is on average between 6.07% and 6.89% and in increases along with TPP temperature and decreasing MCC proportion. In the temperature range 170–220 °C, mass loss averaged from 4.51% to 5.29% and was associated, among other things, with softening of cellulose components and degradation of components characterized by low molecular mass [27]. Mass loss in the temperature range 220–260 °C could be due to degradation of hemicellulose and fats contained in rapeseed meal. In the temperature range between 250 and 400 °C, cellulose degradation takes place [28]. In the temperature range between 400 and 600 °C, depolymerization takes place, caused mainly by the degradation of acetylated components of high molecular mass as well as other processes [29]. Analysis of mass changes has shown that the first mass loss by 5% was recorded at 117.3 °C (sample at 120 °C, MCC 8%). The highest value of temperature, 151.9 °C, at which a 5% mass loss was recorded, was identified in a sample produced under the conditions of 140 °C, MCC 5%. A 50% mass loss was recorded in the temperature range 360—340 °C; in all charts analyzed, this range was associated with the highest value of the mass derivative (Figure 5b). This is due to high cellulose content in rapeseed meal. Also, the mass loss dynamics are higher for biocomposites produced with a greater proportion of MCC.
3.6. The Infrared Spectrum Analysis FTIR
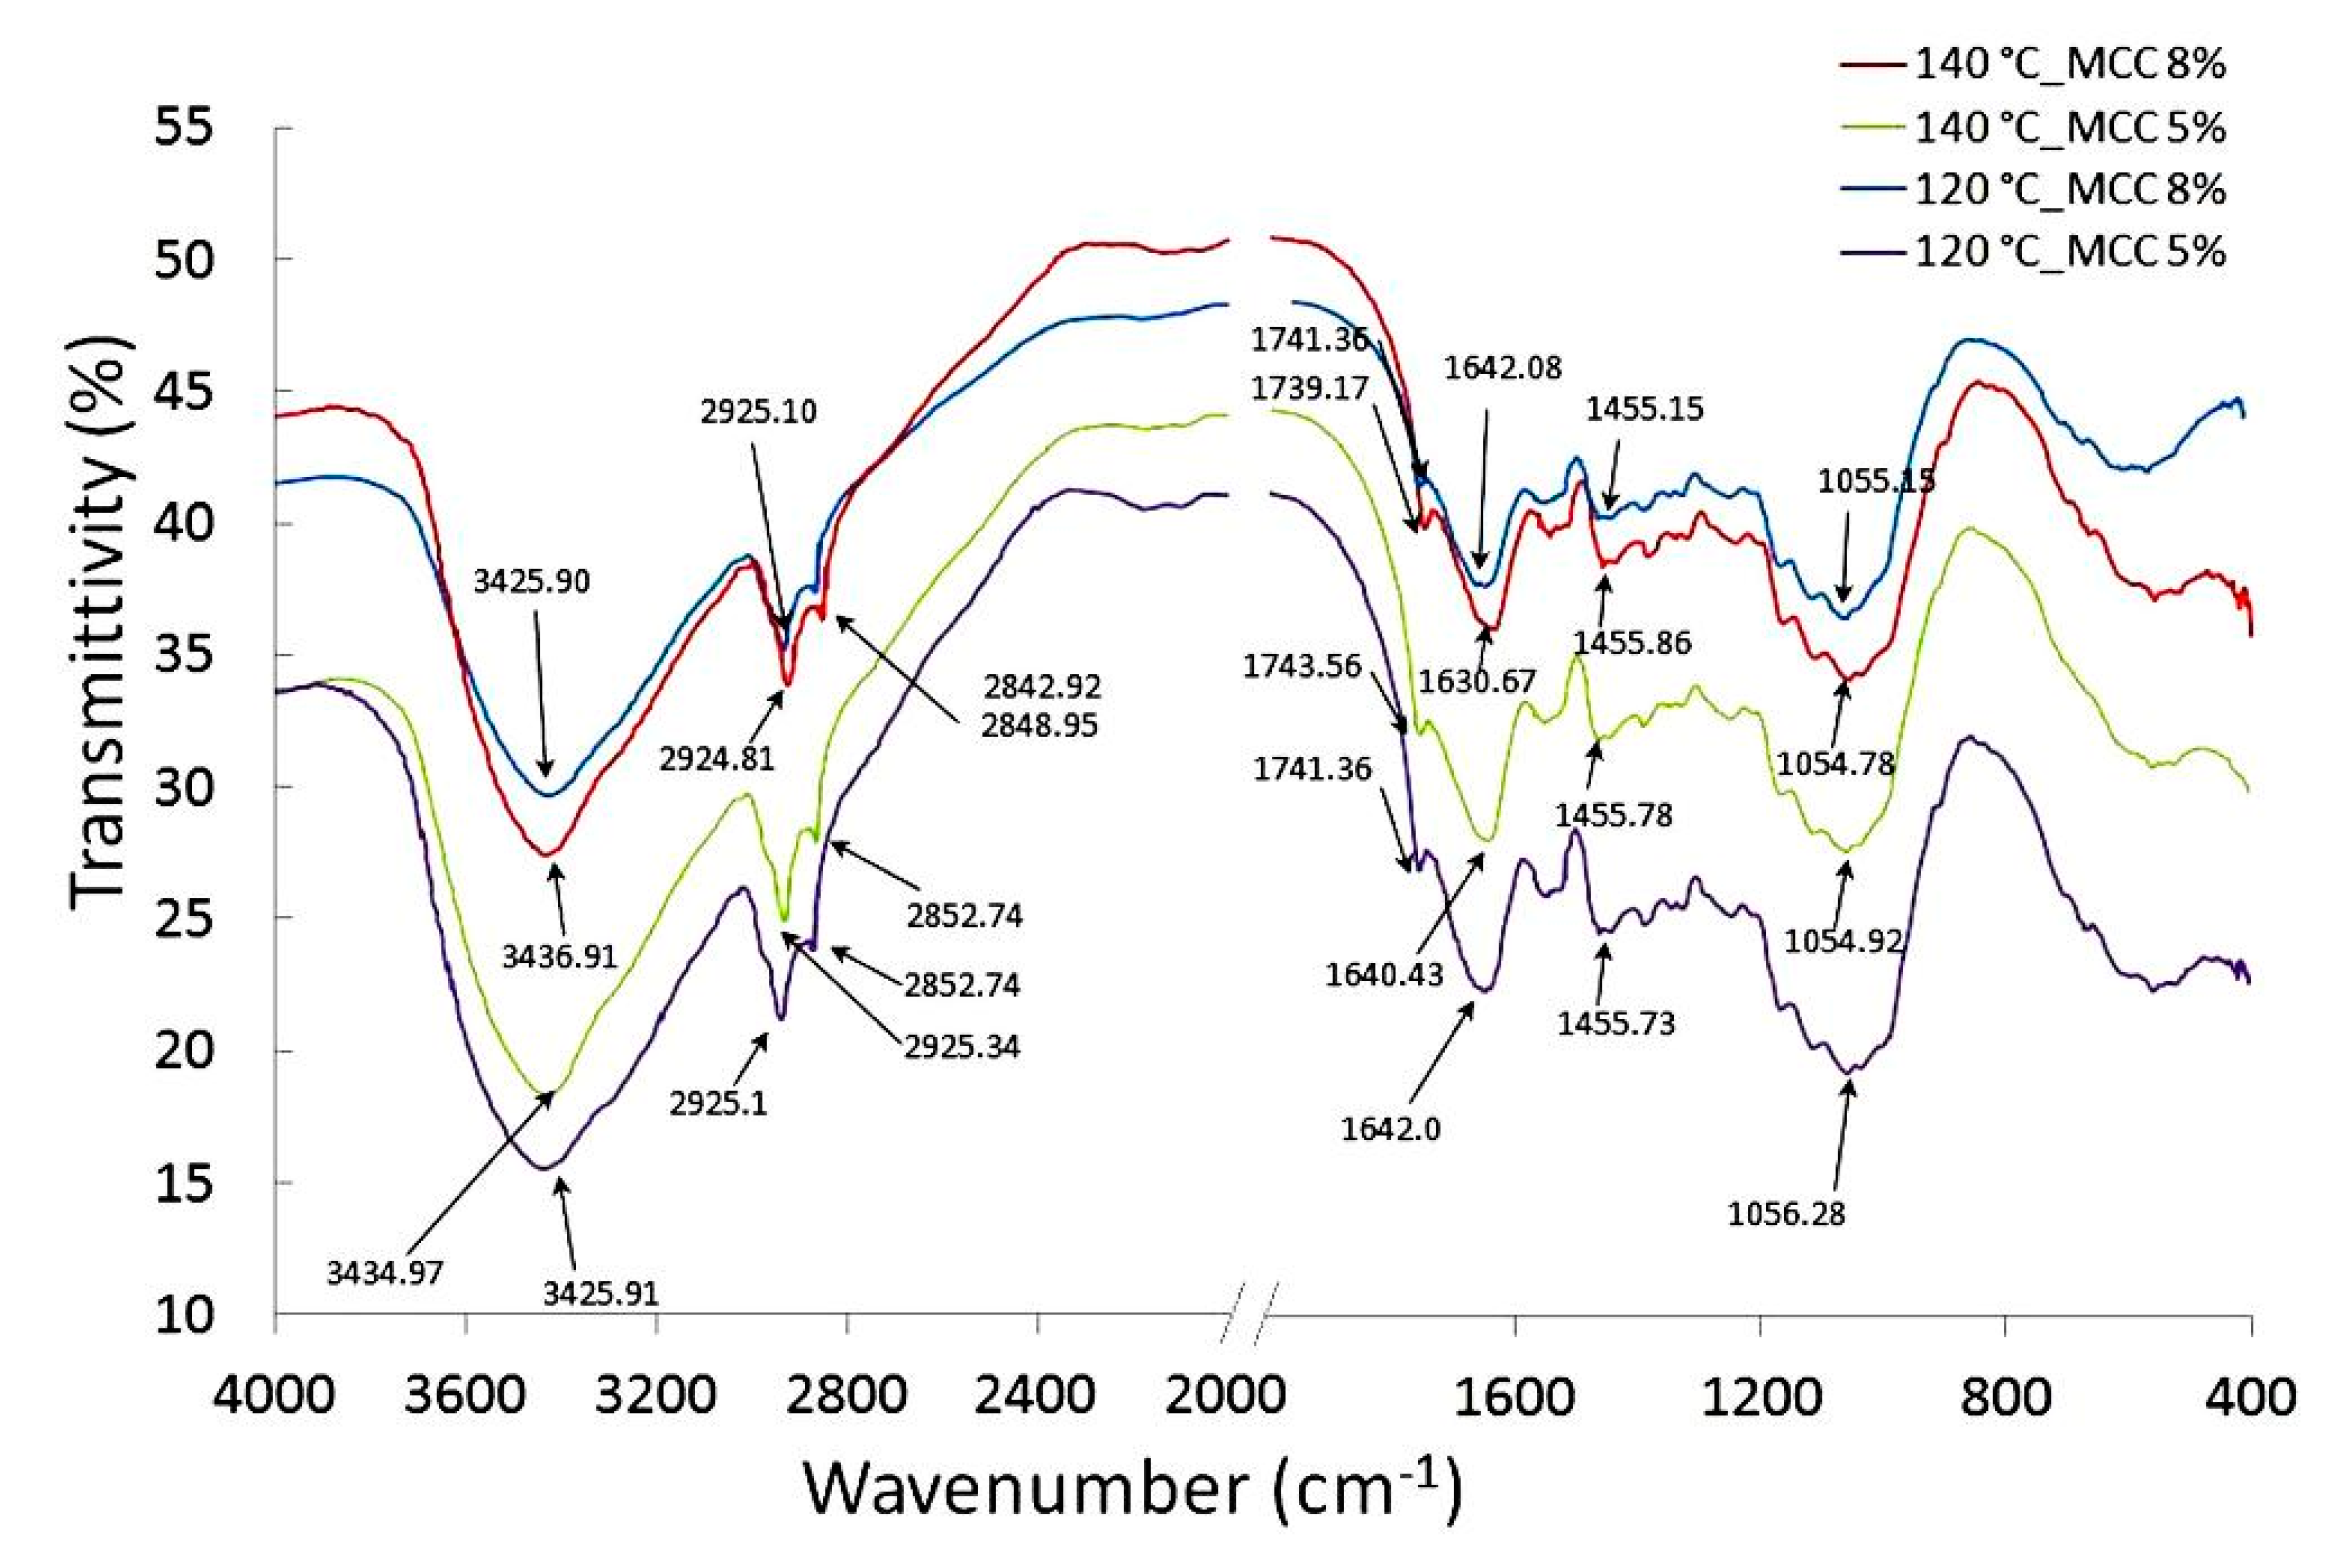
Figure 6 presents the results of fourier transform infrared spectroscopy (FTIR) analysis conducted for biocomposite samples made of rapeseed meal (RP) containing 8% and 5% MCC at process temperatures of 120 and 140 °C. All of the spectra observed show a similar distribution. The tests show typical vibrations for cellulose-rich organic materials [30,31]. The introduction of MCC did not result in the emergence of new groups of compounds—only a small shift in the spectrum transmittance distribution was observed. Analysis of the results obtained indicates three basic regions: the first one within the range of 3500–2700 cm−1, which indicates valence vibrations of O-H methyl group bonds; the second region corresponds with an absorption range 2200–1500cm−1, and the bands in this range indicate the presence of groups of compounds containing double bonds (C=O, C=C); the third region—the so-called “fingerprint region”—contains bands originating mainly from single C-O bonds, as well as many bonds that correspond with bending vibrations. Similar ranges in the analyzed FTIR spectra were found in [31]. The maximum transmittance values achieved for hydroxyl bonds (-OH) increase along with the content of MCC. This suggests enhancement of hydrophobic properties of biocomposites along with increases in their MCC content.
4. Conclusions
The properties of biocomposites obtained from combining post-extraction rapeseed meal and microcrystalline cellulose MCC show that it is potentially possible to utilize products of this kind. The best feature of the products obtained is their high mechanical resistance; however, it is necessary to enhance elasticity, even in products that contain 8% of MCC. In the process of production of biocomposites, good results were obtained under a process temperature of 140 °C with an addition of 8% of MCC, which translated directly to improved surface quality and thermal resistance. However, increasing the process temperature exerts a significant influence on the darkening of the product. The highest surface contact angle can be obtained at the temperatures of 120 and 130 °C, with the highest proportion of MCC.
Author Contributions
A.E. developed the concept and design of the study; T.Ż. contributed to the literature study and analyzed the data; J.S., J.S. they conducted the experiments; T.Ż., A.E., J.S. wrote the paper; A.E. critically revised it. All authors have read and agreed to the published version of the manuscript.
Funding
The article was supported financially by an internal grant of the “Incubator of Innovation 2.0” Grant No. 513-01-800300-R00159-04. APC was funded by Institute of Mechanical Engineering money, SGGW.
Conflicts of Interest
The authors declare no conflict of interest.
References
- Zelazinski, T.; Ekielski, A.; Tulska, E.; Vladut, V.; Durczak, K. Wood dust application for improvment of selected properties of thermoplastic starch. Inmateh. Agric. Eng. 2019, 58, 37–44. [Google Scholar]
- John, M.J.; Thomas, S. Biofibres and biocomposites. Carbohydr. Polym. 2008, 71, 343–364. [Google Scholar] [CrossRef]
- Jiang, S.J.; Zhang, T.; Song, Y.; Qian, F.; Tuo, Y.; Mu, G. Mechanical properties of whey protein concentrate based film improved by the coexistence of nanocrystalline cellulose and transglutaminase. Int. J. Biol. Macromol. 2019, 126, 1266–1272. [Google Scholar] [CrossRef] [PubMed]
- Kim, J.T.; Netravali, A.N. Mechanical, thermal, and interfacial properties of green composites with ramie fiber and soy resins. J. Agric. Food Chem. 2010, 58, 5400–5407. [Google Scholar] [CrossRef] [PubMed]
- Prochoń, M.; Ntumba, Y.H.T. Effects of Biopolymer Keratin Waste Sources in XNBR Compounds. Rubber Chem. Technol. 2015, 88, 258–275. [Google Scholar] [CrossRef]
- Janowska, G.; Kucharska-Jastrząbek, A.; Rybiński, P. Thermal stability, flammability and fire hazard of butadiene-acrylonitrile rubber nanocomposites. J. Therm. Anal. Calorim. 2011, 103, 1039–1046. [Google Scholar] [CrossRef] [Green Version]
- Ghanbarzadeh, B.; Oleyaei, S.A.; Almasi, H. Nanostructured materials utilizedin biopolymer-based plastics for food packaging applications. Crit. Rev. Food Sci. Nutr. 2015, 55, 1699–1723. [Google Scholar] [CrossRef]
- Kim, J.R.; Netravali, A.N. Self-healing green composites based on soy protein and microfibrillated cellulose. Compos. Sci. Technol. 2017, 143, 22–30. [Google Scholar] [CrossRef] [Green Version]
- Prochoń, M.; Janowska, G.; Przepiórkowska, A.; Kucharska-Jastrząbek, A. Thermal stability and flammability of biodecomposable elastomer materials (Stabilność termiczna i palność biorozkładalnych materiałów elastomerowych). Polimery 2013, 58, 413–420. [Google Scholar] [CrossRef]
- Andrea, C.; Cibulkova, Z.; Lehocky, P. Stabilization effect of potential antioxidants on the thermooxidative stability of styrene-butadiene rubber. J. Therm. Anal. Calorim. 2011, 105, 607–613. [Google Scholar]
- Fahmy, Y.; El-Wakil, N.A.; El-Gendy, A.A.; Abou-Zeid, R.E.; Youssef, M.A. Plant proteins as binders in cellulosic paper composites. Int. J. Biol. Macromol. 2010, 47, 82–85. [Google Scholar] [CrossRef] [PubMed]
- Wolf, W.J. Soybean proteins: Their functional, chemical, and physical properties. J. Agric. Food Chem. 1970, 18, 969–976. [Google Scholar] [CrossRef]
- Kinsella, J.E. Functional properties of soy proteins for food applications. J. Am. Oil Chem. Soc. 1979, 56, 242–258. [Google Scholar] [CrossRef]
- Nir, I.Y.; Feldman, Y.; Aserin, A.; Garti, N. Surface properties and emulsification behavior of denatured soy proteins. J. Food Sci. 1994, 59, 606. [Google Scholar] [CrossRef]
- Trache, D.; Donnot, A.; Khimeche, K.; Benelmir, R.; Brosse, N. Physico-chemicalproperties and thermal stability of microcrystalline cellulose isolated fromAlfa fibres. Carbohydr. Polym. 2014, 104, 223–230. [Google Scholar] [CrossRef]
- Yang, S.; Tang, Y.; Wang, J.; Kong, F.; Zhang, J. Surface treatment of cellulosic paper with starch-based composites reinforced with nanocrystalline cellulose. Ind. Eng. Chem. Res. 2014, 53, 13980–13988. [Google Scholar] [CrossRef]
- Eichhorn, S.; Young, R. The Young’s modulus of a microcrystalline cellulose. Cellulose 2001, 8, 197–207. [Google Scholar] [CrossRef]
- Yu, J.; Wang, C.; Wang, J.; Chu, F. In situ development of self-reinforced cellulose nanocrystals based thermoplastic elastomers by atom transfer radical polymerization. Carbohydr. Polym. 2016, 141, 143–150. [Google Scholar] [CrossRef]
- Goudarzi, T.; Spring, D.W.; Paulino, G.H.; Lopez-Pamies, O. Filled elastomers: A theory of filler reinforcement based on hydrodynamic and interphasial effects. J. Mech. Phys. Solids 2015, 80, 37–67. [Google Scholar] [CrossRef] [Green Version]
- Li, C.; Luo, J.; Qin, Z.; Chen, H.; Gao, Q.; Li, J. Mechanical and thermal properties of microcrystalline cellulose-reinforced soy protein isolate-gelatin eco-friendly films. RSC Adv. 2015, 5, 56518–56525. [Google Scholar] [CrossRef]
- Balaxi, M.; Nikolakakis, I.; Kachrimanis, K.; Malamataris, S. Combined effects ofwetting, drying, and microcrystalline cellulose type on the mechanicalstrength and disintegration of pellets. J. Pharm. Sci. 2009, 98, 676–689. [Google Scholar] [CrossRef]
- Trache, D.; Hussin, M.H.; Chuin, C.T.H.; Sabar, S.; Fazita, M.N.; Taiwo, O.F.; Hassan, T.M.; Haafiz, M.M. Microcrystalline cellulose: Isolation, characterization and bio-composites application—A review. Int. J. Biol. Macromol. 2016, 93, 789–804. [Google Scholar] [CrossRef]
- Su, J.F.; Huang, Z.; Yuan, X.Y.; Wang, X.Y.; Li, M. Structure and properties of carboxymethyl cellulose/soy protein isolate blend edible films crosslinked by Maillard reactions. Carbohydr. Polym. 2010, 79, 145–153. [Google Scholar] [CrossRef]
- Grylewicz, A.; Spychaj, T.; Zdanowicz, M. Thermoplastic starch/wood biocomposites processed with deep eutectic solvents. Compos. Part A Appl. Sci. Manuf. 2019, 121, 517–524. [Google Scholar] [CrossRef]
- Valencia, G.A.; Luciano, C.G.; Lourenço, R.V.; do Amaral Sobral, P.J. Microstructure and physical properties of nano-biocomposite films based on cassava starch and laponite. Int. J. Biol. Macromol. 2018, 107, 1576–1583. [Google Scholar] [CrossRef]
- Zdanowska, P.; Florczak, I.; Słoma, J.; Tucki, K.; Orynycz, O.; Wasiak, A.; Świć, A. An Evaluation of the Quality and Microstructure of Biodegradable Composites as Contribution towards Better Management of Food Industry Wastes. Sustainability 2019, 11, 1504. [Google Scholar] [CrossRef] [Green Version]
- Kamdem, D.P.; Shen, Z.; Nabinejad, O. Development of biodegradable composite chitosan-based films incorporated with xylan and carvacrol for food packaging application. Food Packag. Shelf Life 2019, 21, 100344. [Google Scholar] [CrossRef]
- Lin, Z.; Renneckar, S.; Hindman, D.P. Nanocomposite-based lignocellulosic fibers 1. Thermal stability of modified fibers with clay-polyelectrolyte multilayers. Cellulose 2007, 15, 333. [Google Scholar] [CrossRef]
- Yang, H.; Yan, R.; Chen, H.; Lee, D.H.; Zheng, C. Characteristics of hemicellulose, cellulose and lignin pyrolysis. Fuel 2007, 86, 1781–1788. [Google Scholar] [CrossRef]
- Eleutério, T.; Pinto, A.S.; Pereira, M.J.; Vasconcelos, H.C. Preliminary Structural and Thermal Characterization of Conteira’s (Hedychium gardnerianum) Fibers for Further Functionalization with Silica Colloidal Nanoparticles. Procedia Eng. 2017, 200, 162–169. [Google Scholar] [CrossRef]
- Hempel, H.; Fürll, C.; Munder, F. Processing of bast fiber plants for industrial application. In Natural Fibers, Biopolymers, and BiocompositesNat; CRC Press: Boca Raton, FL, USA, 2005; pp. 129–161. [Google Scholar]
Figure 1.
Research workstation used for biocomposite production.
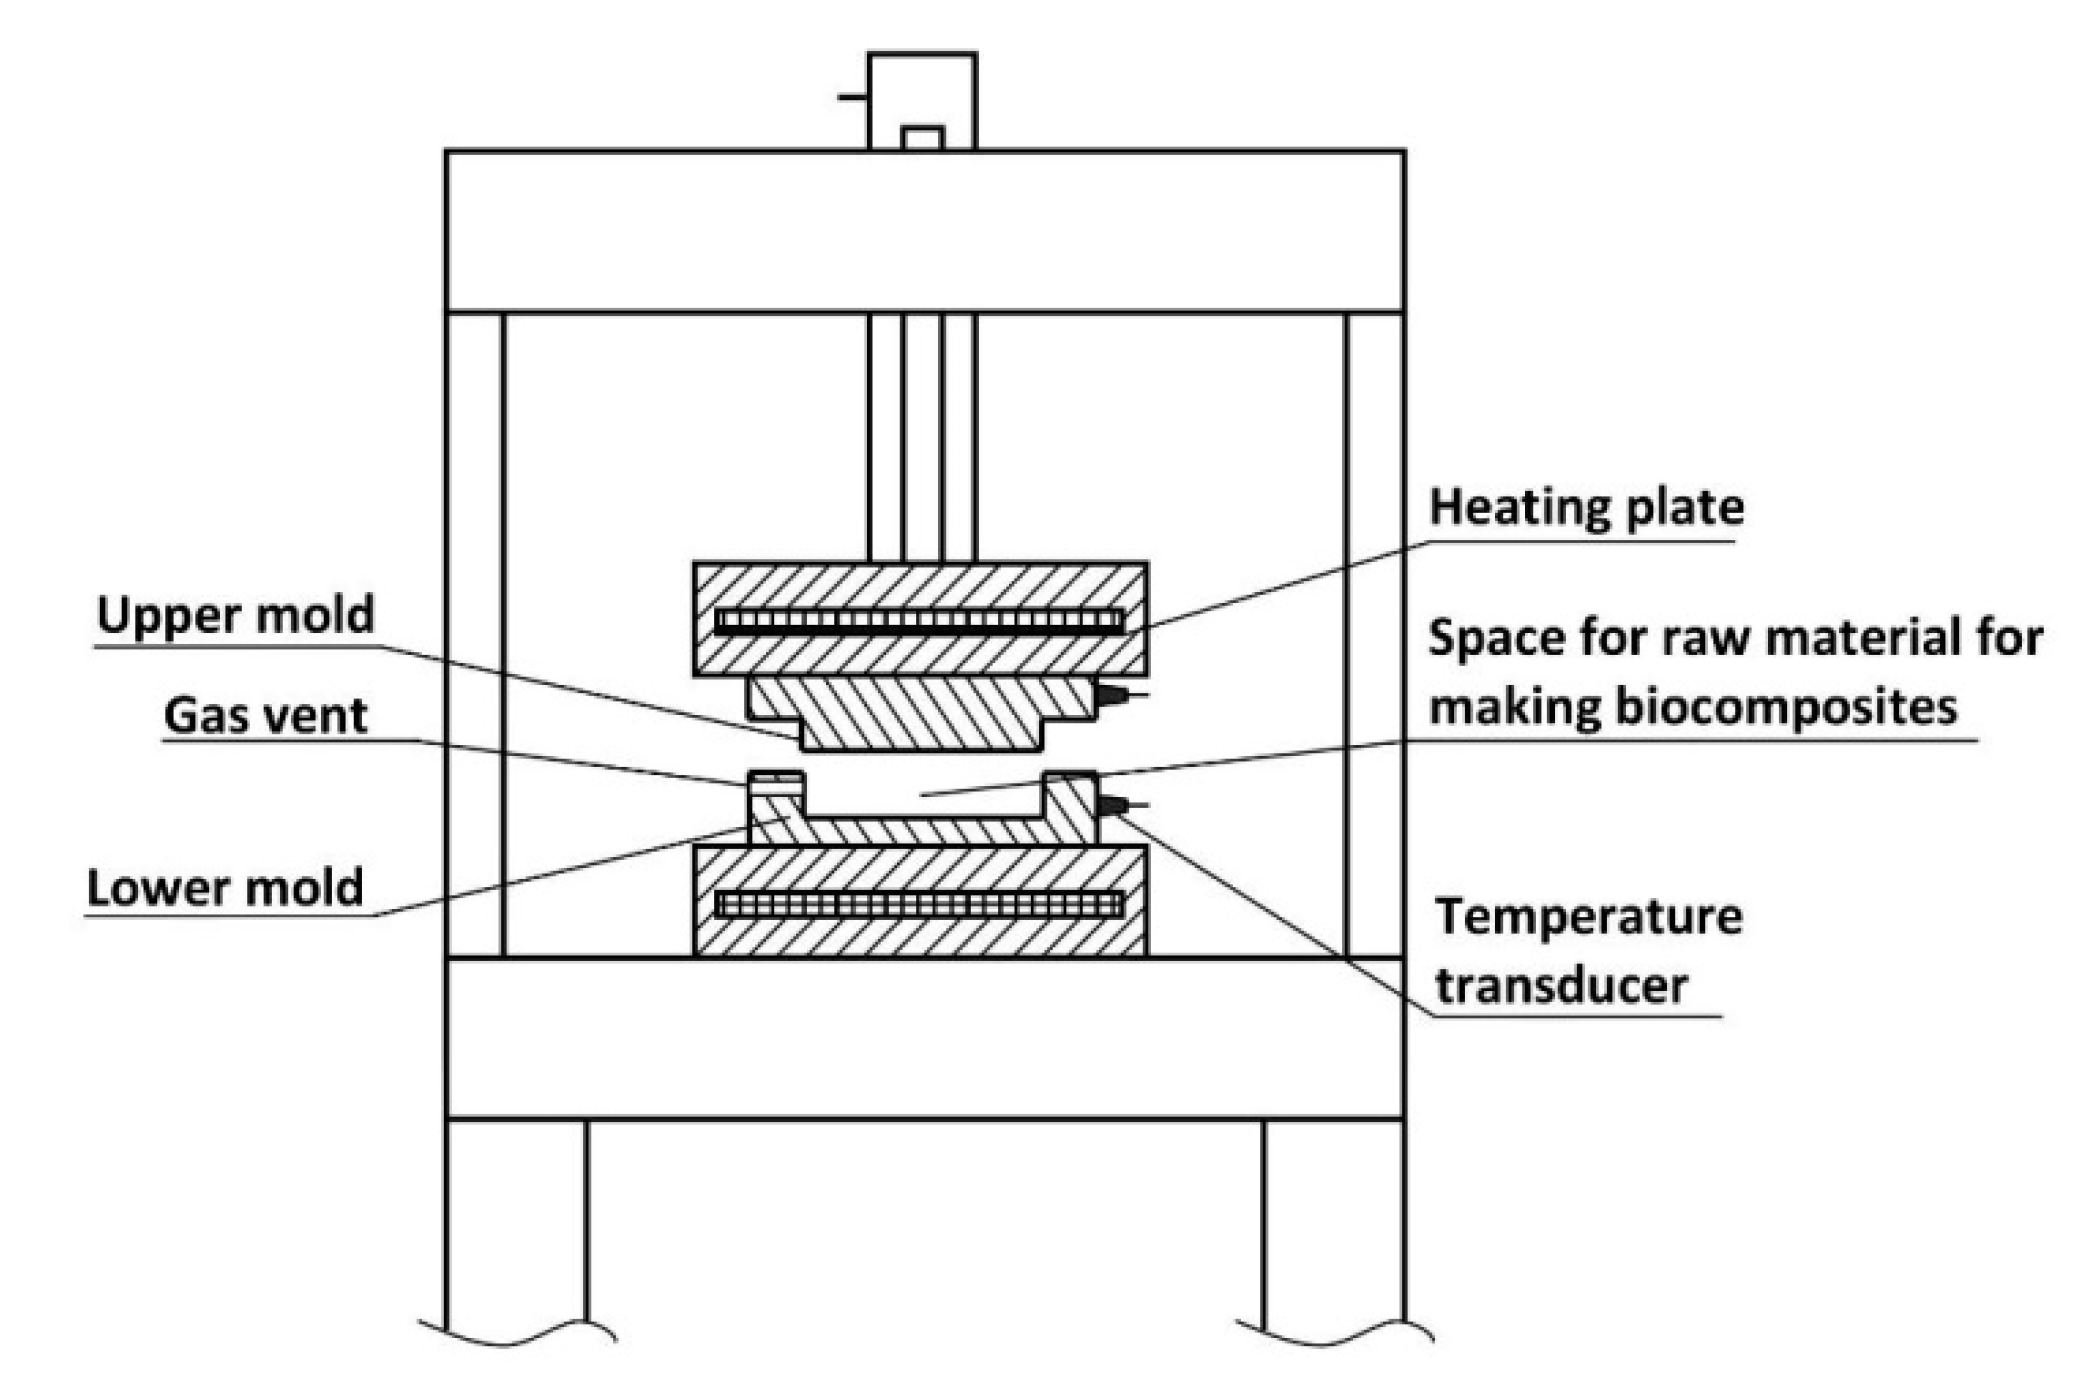
Figure 2.
Illustration of determination of the contact angle using the sitting drop method. γsv—surface energy of material in balance with saturated liquid steam. γsl—solid and liquid interphase surface energy. γlv—surface energy of measuring liquid in balance with saturated steam. Θ—surface contact angle.
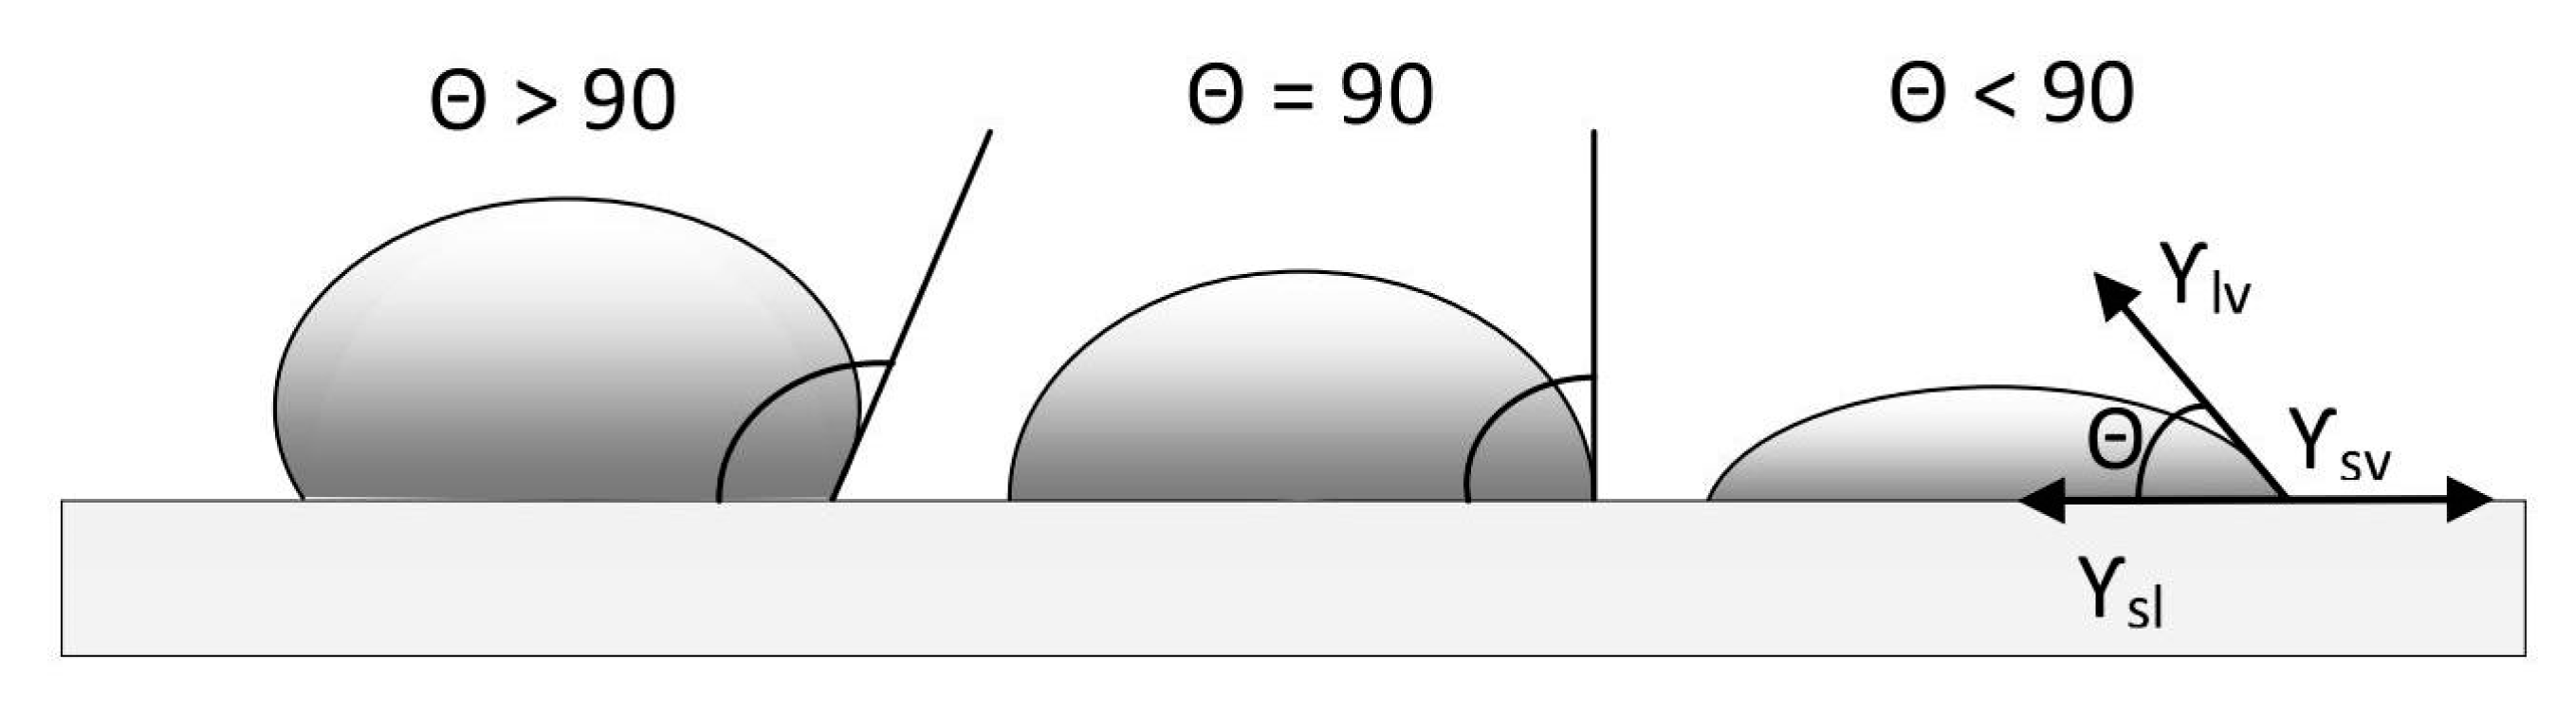
Figure 3.
The impact of the addition of microcrystalline cellulose (MCC) and process temperature on changes in the following parameters: (a) bending strength, (b) Young’s Modulus, (c) contact angle, (d) color component L*, (e) color component a*, (d) color component b*.
Figure 3.
The impact of the addition of microcrystalline cellulose (MCC) and process temperature on changes in the following parameters: (a) bending strength, (b) Young’s Modulus, (c) contact angle, (d) color component L*, (e) color component a*, (d) color component b*.
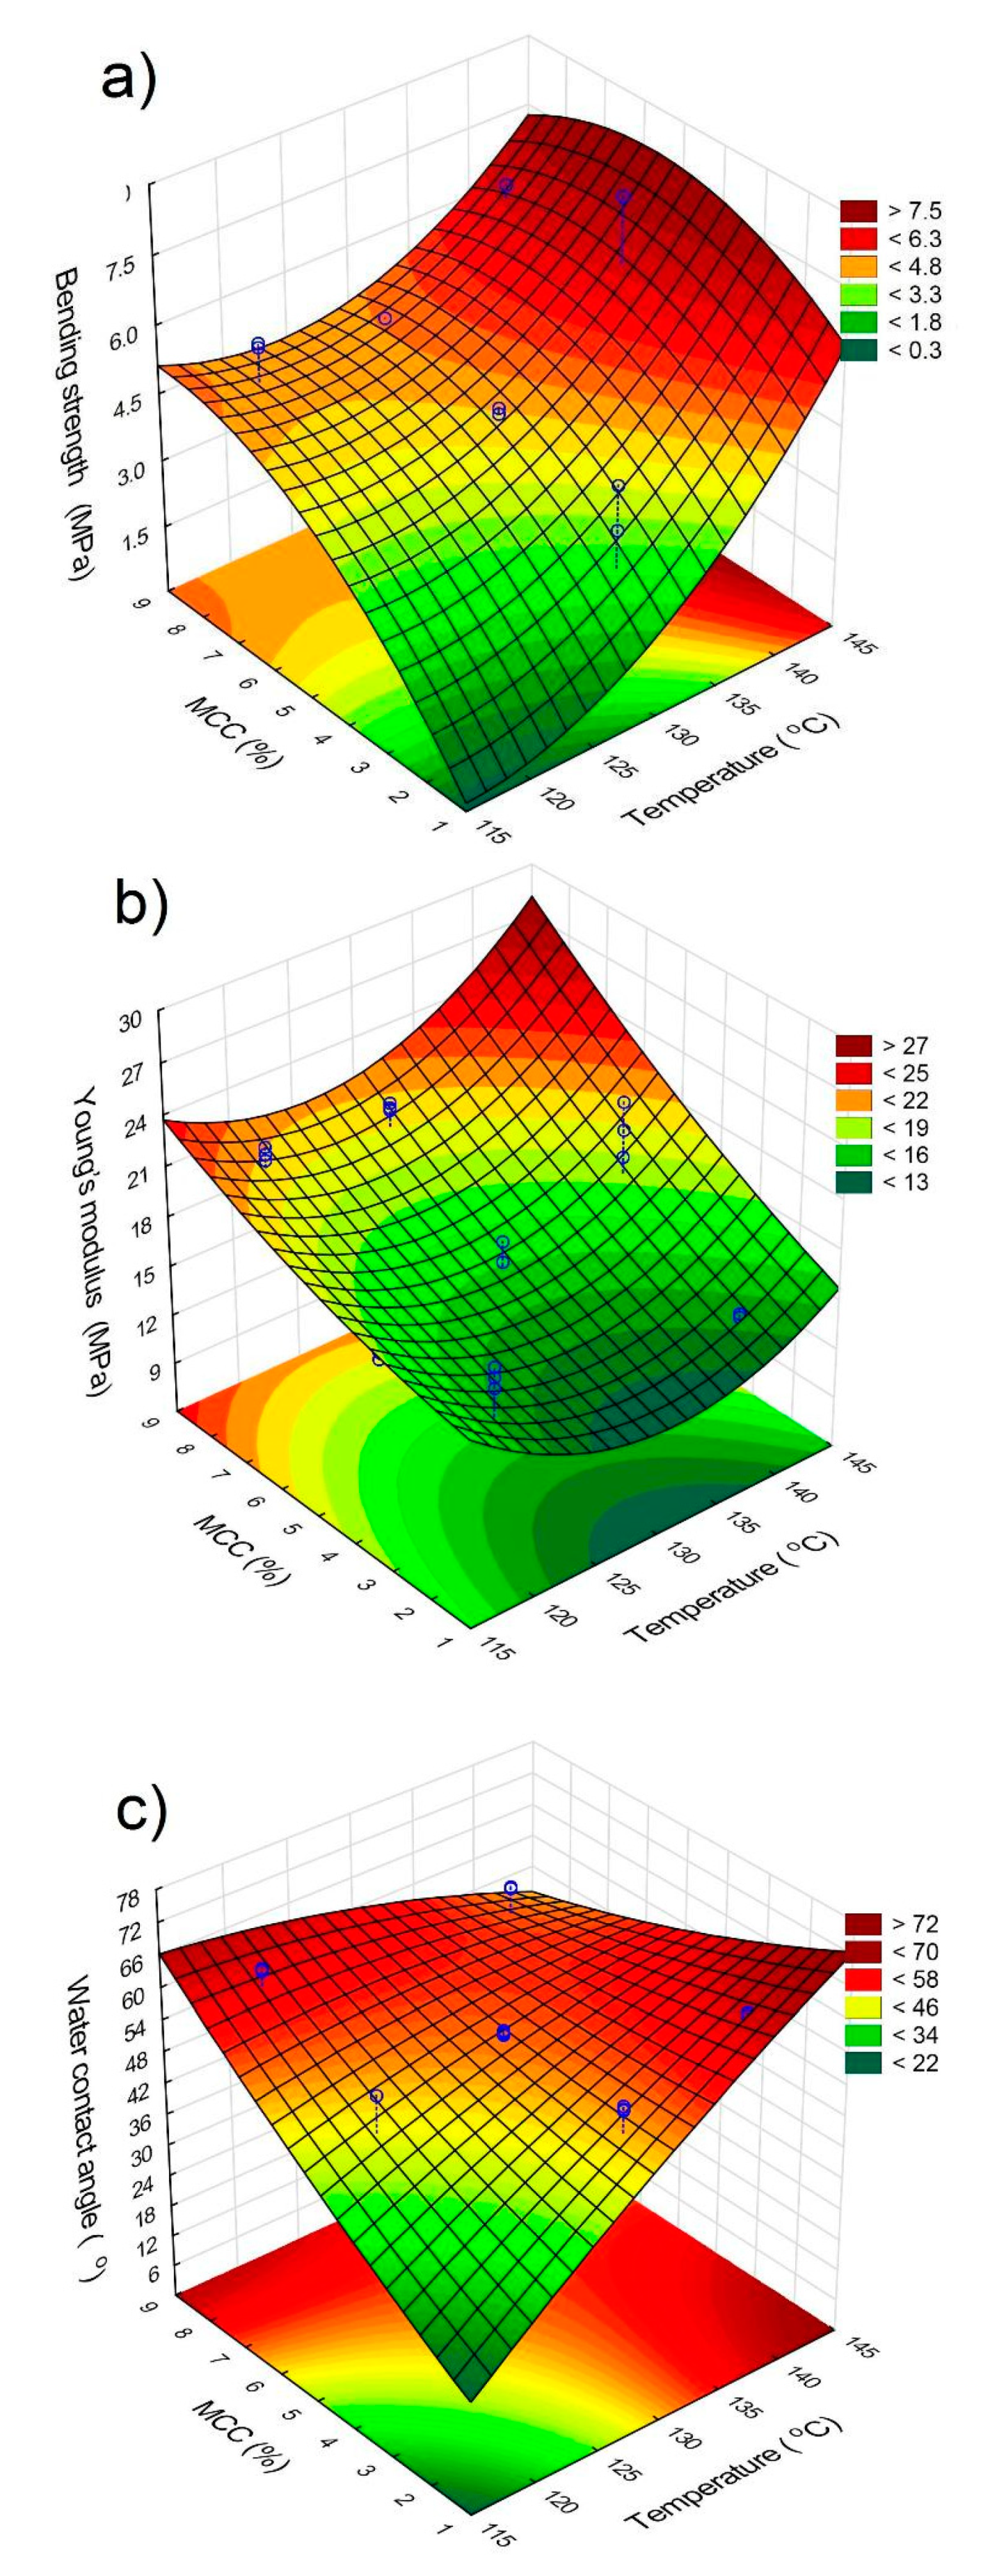
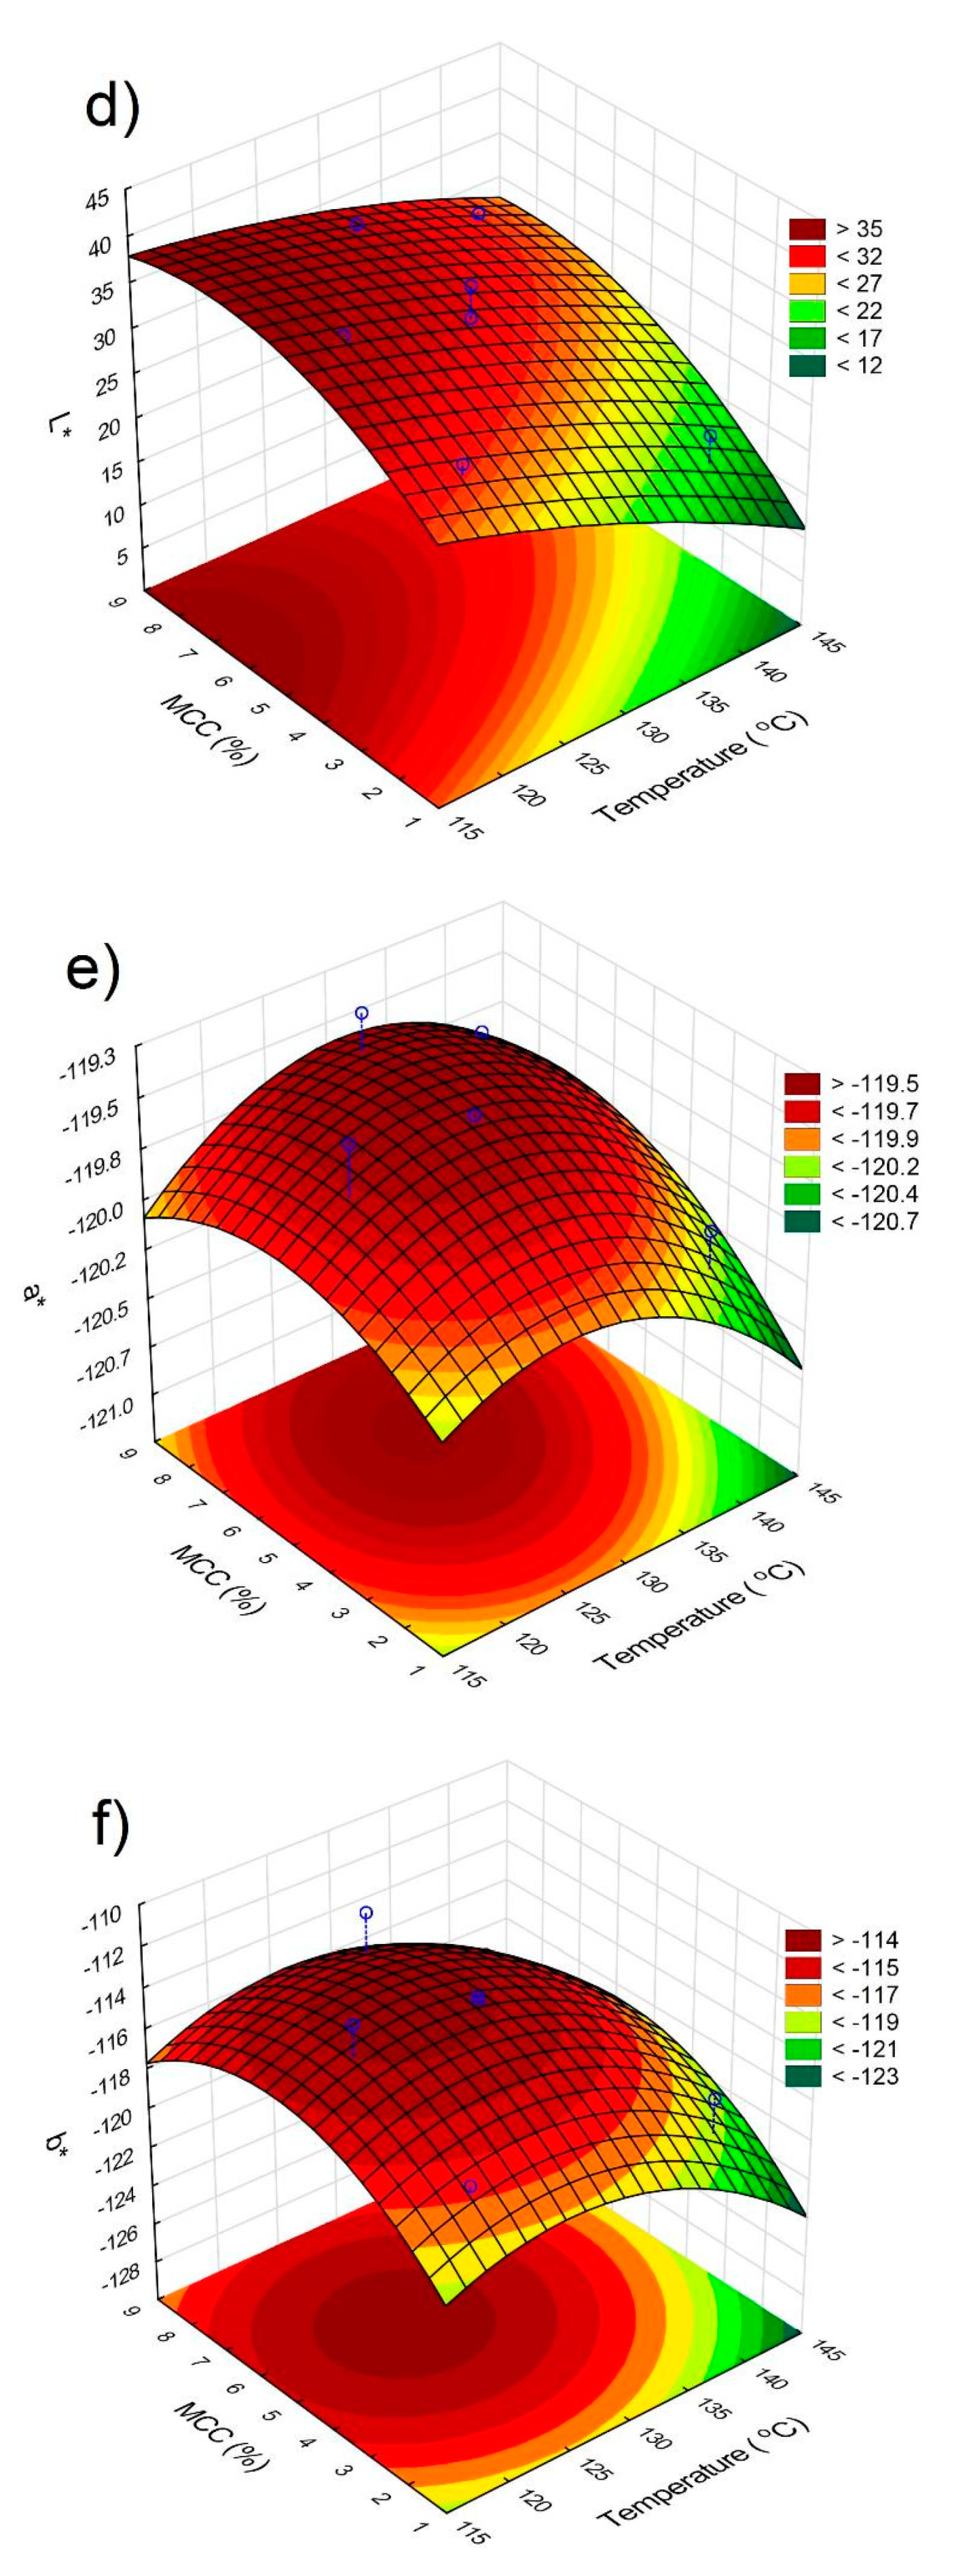
Figure 4.
Photographs of SEM scanning microscopy of biocomposites: (a) sample “bend” (temp. 140 °C, MCC 8%); (b) fibrous structure, typical for denatured vegetable protein (temp. 140 °C, MCC 8%); (c) outer surface (temp. 120 °C, MCC 8%); (d) outer surface (temp. 140 °C, MCC 8%).
Figure 4.
Photographs of SEM scanning microscopy of biocomposites: (a) sample “bend” (temp. 140 °C, MCC 8%); (b) fibrous structure, typical for denatured vegetable protein (temp. 140 °C, MCC 8%); (c) outer surface (temp. 120 °C, MCC 8%); (d) outer surface (temp. 140 °C, MCC 8%).
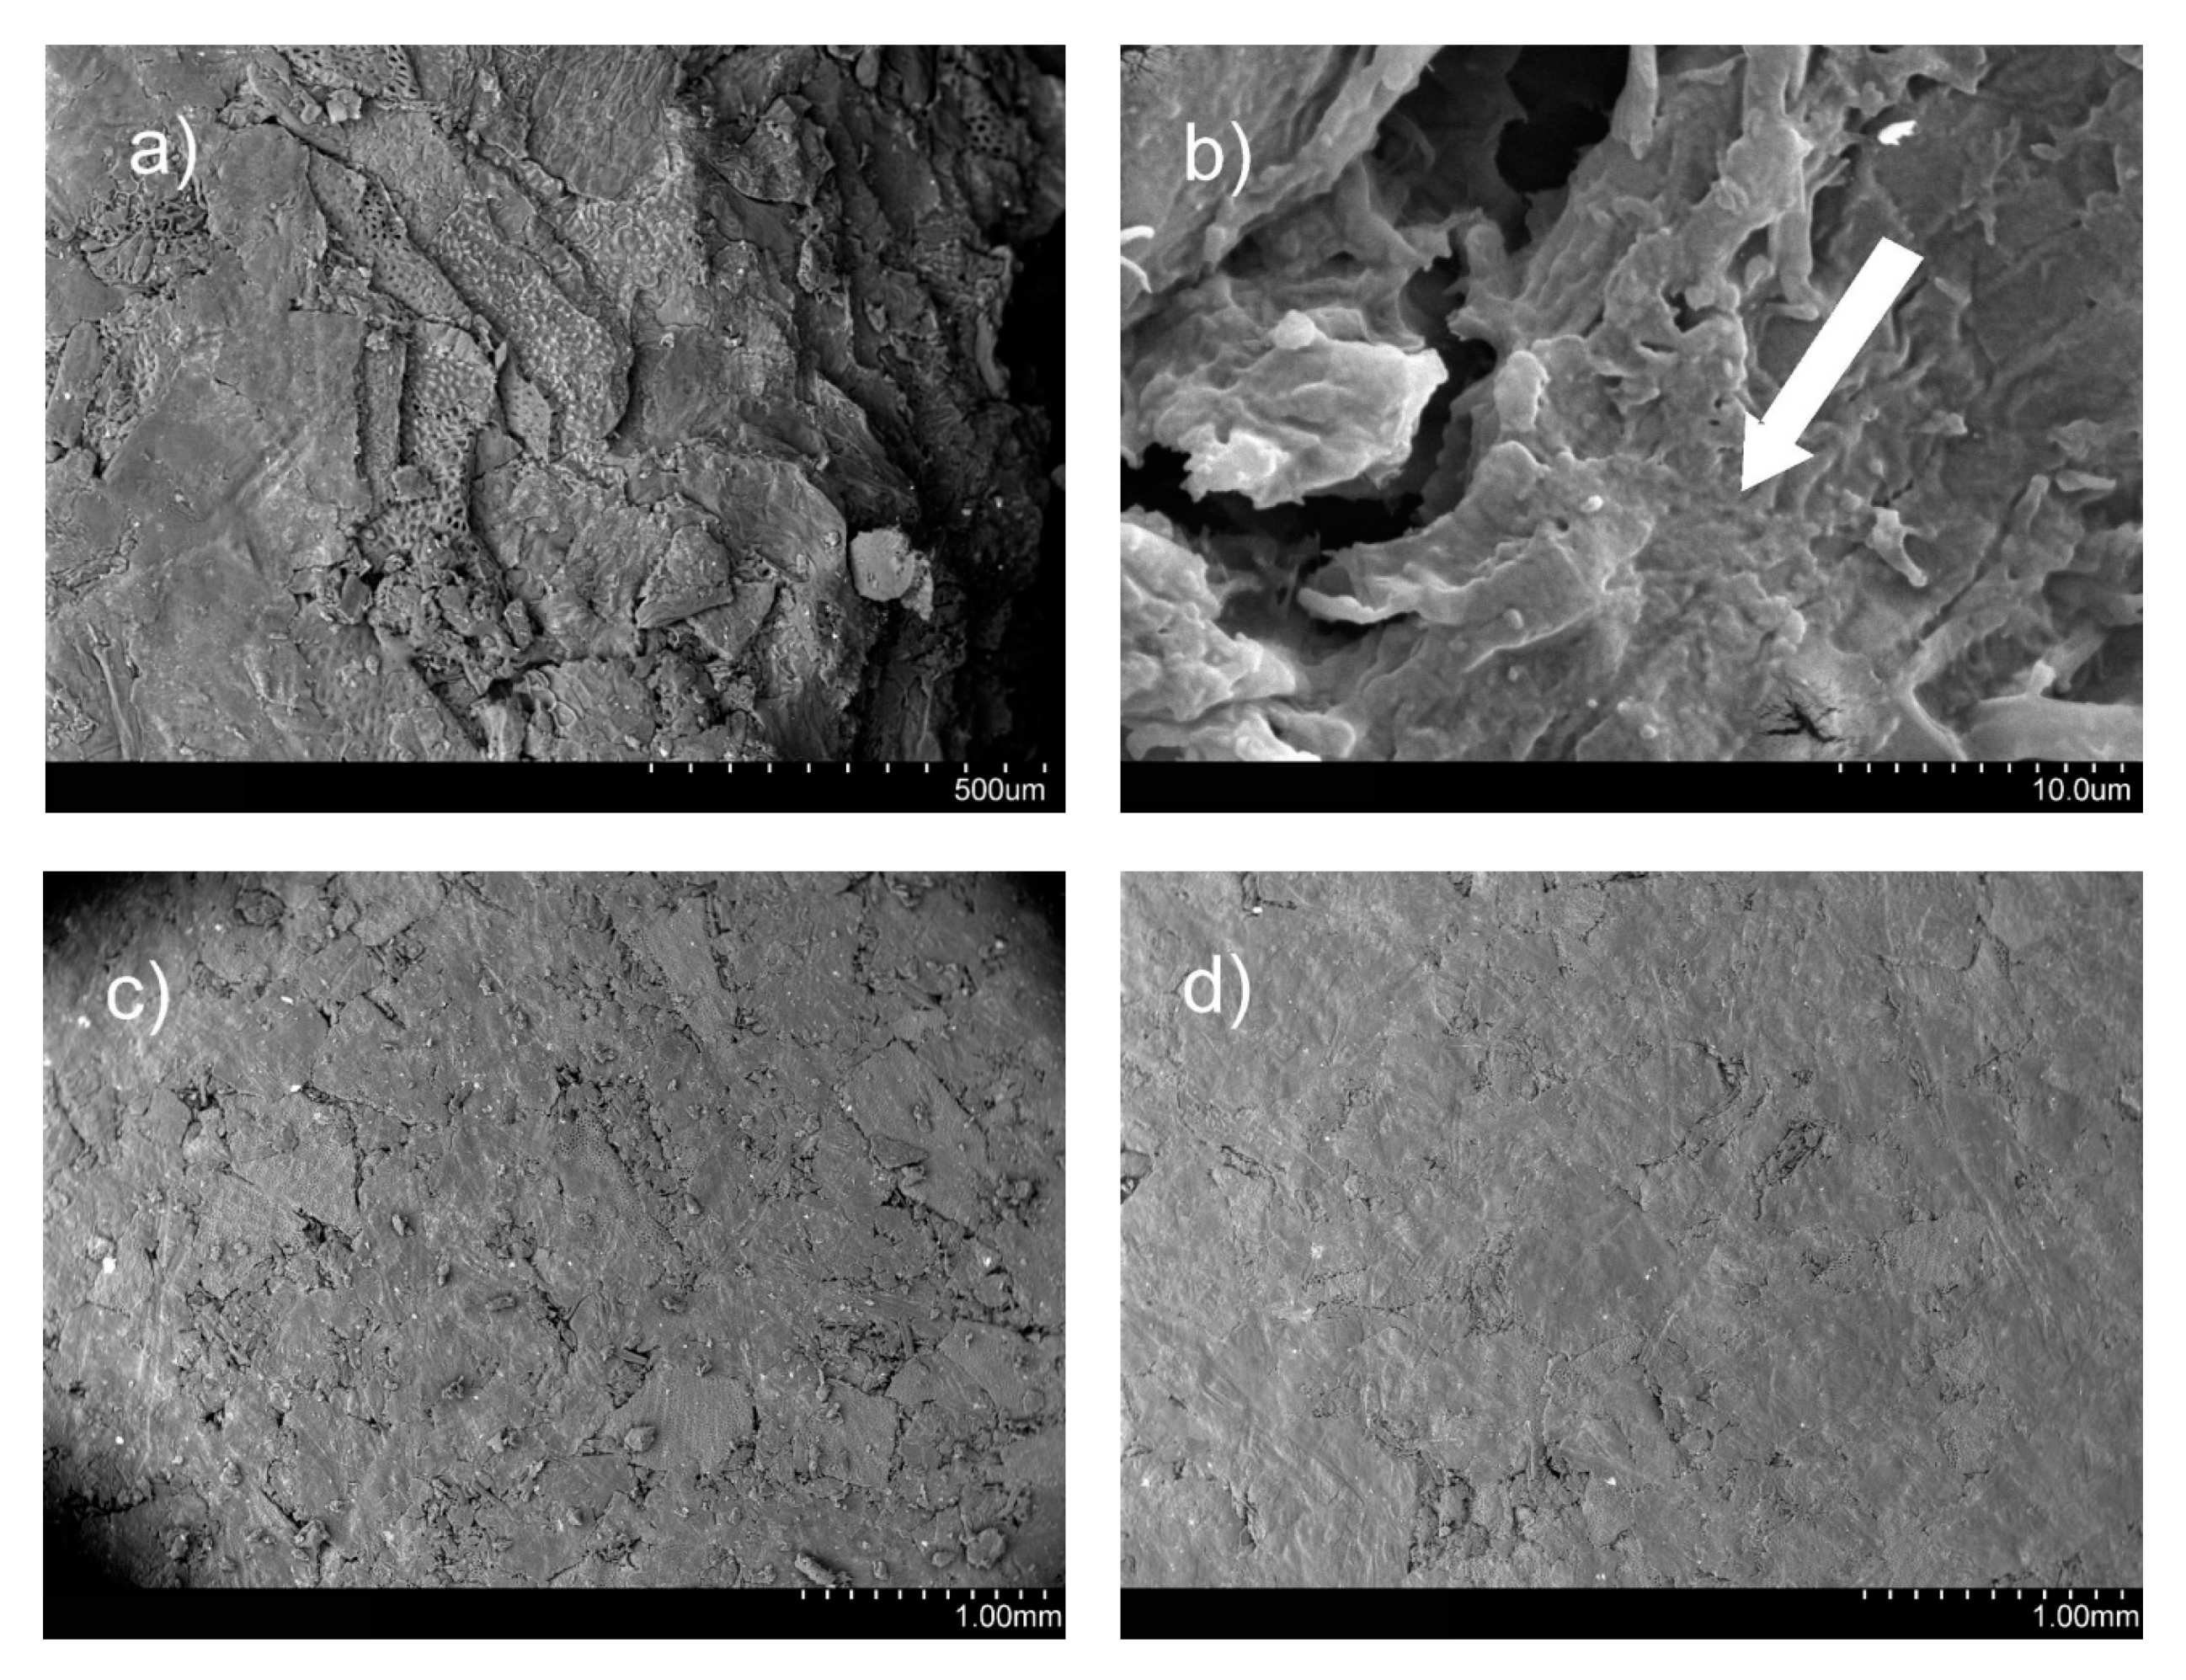
Figure 5.
Thermogravimetric analysis (TGA) (a) and differential thermal analysis (DTA) (b) curves for biocomposites containing 5% and 8% of MCC, produced at process temperatures of 120 and 140 °C.
Figure 5.
Thermogravimetric analysis (TGA) (a) and differential thermal analysis (DTA) (b) curves for biocomposites containing 5% and 8% of MCC, produced at process temperatures of 120 and 140 °C.

Figure 6.
Fourier transform infrared spectroscopy (FTIR) for biocomposites containing 5% and 8% of MCC, produced at process temperatures of 120 and 140 °C.
Figure 6.
Fourier transform infrared spectroscopy (FTIR) for biocomposites containing 5% and 8% of MCC, produced at process temperatures of 120 and 140 °C.

Table 1.
Statistical research plan.
| Samp. Number | Index Temperature | Index Celuloza MCC | Temperature (°C) | Cellulose MCC (%) |
|---|---|---|---|---|
| 1 | 1 | 1 | 120 | 2 |
| 2 | 1 | −1 | 120 | 8 |
| 3 | −1 | 1 | 140 | 2 |
| 4 | −1 | −1 | 140 | 8 |
| 5 | 1 | 0 | 120 | 5 |
| 6 | −1 | 0 | 140 | 5 |
| 7 | 0 | 1 | 130 | 2 |
| 8 | 0 | −1 | 130 | 8 |
| 9 | 0 | 0 | 130 | 5 |
| 10 | 0 | 0 | 130 | 5 |
Table 2.
ANOVA variance analysis results: SS, sum of squares; df, degree of freedom; MS, sum of mean squares; F statistics; P-value of test probability; L, linear; Q, square.
Table 2.
ANOVA variance analysis results: SS, sum of squares; df, degree of freedom; MS, sum of mean squares; F statistics; P-value of test probability; L, linear; Q, square.
| Bending Strength (MPa); R2 = 0.70; Pure Error MS = 0.26 | ||||||
|---|---|---|---|---|---|---|
| Source of Variation | SS | df | MS | F | P | |
| 1. Temperature (°C) | L | 38.8710 | 1 | 38.8720 | 147.9580 * | 0.0000 |
| Temperature (°C) | Q | 4.8399 | 1 | 4.8399 | 18.4219 * | 0.0003 |
| 2. MCC (%) | L | 16.9260 | 1 | 16.9260 | 64.4251 * | 0.0000 |
| MCC (%) | Q | 0.0757 | 1 | 0.0757 | 0.2882 | 0.5970 |
| Interaction 1 L vs. 2 L | 2.8791 | 1 | 2.8791 | 10.9588 * | 0.0033 | |
| Lack of fit | 22.2617 | 3 | 7.4206 | 28.2448 * | 0.0000 | |
| Pure error | 5.5172 | 21 | 0.2627 | |||
| Total SS | 93.1133 | 29 | ||||
| Young’s modulus (MPa); R2 = 0.73; Pure error MS = 0.72 | ||||||
| 1. Temperature (°C) | L | 11.9937 | 1 | 11.9937 | 16.7259 * | 0.0005 |
| Temperature (°C) | Q | 15.9162 | 1 | 15.9162 | 22.1961 * | 0.0001 |
| 2. MCC (%) | L | 243.6040 | 1 | 243.6040 | 339.7200 * | 0.0000 |
| MCC (%) | Q | 2.0482 | 1 | 2.0482 | 2.8564 | 0.1058 |
| Interaction 1 L vs. 2 L | 6.6008 | 1 | 6.6008 | 9.2052 * | 0.0063 | |
| Lack of fit | 87.3961 | 3 | 29.1320 | 40.6263 * | 0.0000 | |
| Pure error | 15.0585 | 21 | 0.7171 | |||
| Total SS | 380.6645 | 29 | ||||
| Water contact angle; R2 = 0.70; Pure error MS = 3.48 | ||||||
| 1. Temperature (°C) | L | 504.132 | 1 | 504.1323 | 144.8413 * | 0.0000 |
| Temperature (°C) | Q | 35.127 | 1 | 35.1269 | 10.0922 * | 0.0045 |
| 2. MCC (%) | L | 179.065 | 1 | 179.0655 | 51.4470 * | 0.0000 |
| MCC (%) | Q | 3.846 | 1 | 3.8463 | 1.1051 | 0.3051 |
| Interaction 1 L vs. 2 L | 861.060 | 1 | 861.0602 | 247.3896 * | 0.0000 | |
| Lack of fit | 590.492 | 3 | 196.8306 | 56.5510 * | 0.0000 | |
| Pure error | 73.092 | 21 | 3.4806 | |||
| Total SS | 2243.379 | 29 | ||||
| L*; R2 = 0.96; Pure error MS = 0.89 | ||||||
| 1. Temperature (°C) | L | 421.901 | 1 | 421.9011 | 476.7090 * | 0.0000 |
| Temperature (°C) | Q | 49.574 | 1 | 49.5737 | 56.0137 * | 0.0000 |
| 2. MCC (%) | L | 446.080 | 1 | 446.0804 | 504.0294 * | 0.0000 |
| MCC (%) | Q | 119.247 | 1 | 119.2475 | 134.7385 * | 0.0000 |
| Interaction 1 L vs. 2 L | Q | 1 | 10.8871 | 12.3014 * | 0.0020 | |
| Lack of fit | 24.667 | 3 | 8.2222 | 9.2903 * | 0.0004 | |
| Pure error | 18.586 | 21 | 0.8850 | |||
| Total SS | 1048.196 | 29 | ||||
| Total SS | ||||||
| 1. Temperature (°C) | L | 0.135435 | 1 | 0.1354 | 1629.3092 * | 0.0000 |
| Temperature (°C) | Q | 0.186196 | 1 | 0.1862 | 2239.9661 * | 0.0000 |
| 2. MCC (%) | L | 0.497160 | 1 | 0.4972 | 5980.9173 * | 0.0000 |
| MCC (%) | Q | 0.157331 | 1 | 0.1573 | 1892.7180 * | 0.0000 |
| Interaction 1 L vs. 2 L | 0.072348 | 1 | 0.0723 | 870.3610 * | 0.0000 | |
| Lack of fit | 0.738541 | 3 | 0.2462 | 2961.5901 * | 0.0000 | |
| Pure error | 0.001746 | 21 | 0.0001 | |||
| Total SS | 1.686337 | 29 | ||||
| b*; R2 = 0.72; Pure error MS = 0.0025 | ||||||
| 1. Temperature (°C) | L | 35.3359 | 1 | 35.3359 | 13961.8112 * | 0.0000 |
| Temperature (°C) | Q | 17.8599 | 1 | 17.8599 | 7056.7514 * | 0.0000 |
| 2. MCC (%) | L | 23.6495 | 1 | 23.6495 | 9344.3313 * | 0.0000 |
| MCC (%) | Q | 27.5162 | 1 | 27.5162 | 10872.1205 * | 0.0000 |
| Interaction 1 L vs. 2 L | 0.2982 | 1 | 0.2982 | 117.8401 * | 0.0000 | |
| Lack of fit | 55.5766 | 3 | 18.5255 | 7319.7521 * | 0.0000 | |
| Pure error | 0.0531 | 21 | 0.0025 | |||
| Total SS | 147.2223 | 29 | ||||
* Significant at P ≤ 0.05.
Table 3.
Summary of percentage mass loss during thermogravimetric analysis (TGA).
| Sample | Mass Losses (%) | Temperature at 5% Mass Losses (°C) | Temperature at 50% Mass Losses (°C) | |||||
|---|---|---|---|---|---|---|---|---|
| I 30–170 °C | II 170–220 °C | III 220–260 °C | IV 260–400 °C | V 400–600 °C | Total 30–600 °C | |||
| MCC 5%; 120 °C | 7.61 | 5.11 | 8.13 | 38.85 | 7.97 | 67.67 | 132.5 | 351.2 |
| MCC 5%; 140 °C | 6.10 | 7.97 | 8.15 | 38.78 | 8.03 | 67.03 | 151.9 | 354.1 |
| MCC 8%; 120 °C | 8.12 | 5.29 | 7.69 | 37.22 | 11.00 | 69.32 | 117.3 | 346.0 |
| MCC 8%; 140 °C | 6.66 | 4.53 | 8.88 | 37.01 | 12.15 | 69.23 | 145.9 | 349.5 |
© 2020 by the authors. Licensee MDPI, Basel, Switzerland. This article is an open access article distributed under the terms and conditions of the Creative Commons Attribution (CC BY) license (http://creativecommons.org/licenses/by/4.0/).
Share and Cite
MDPI and ACS Style
Żelaziński, T.; Słoma, J.; Skudlarski, J.; Ekielski, A. The Rape Pomace and Microcrystalline Cellulose Composites Made by Press Processing. Sustainability 2020, 12, 1311. https://doi.org/10.3390/su12041311
AMA Style
Żelaziński T, Słoma J, Skudlarski J, Ekielski A. The Rape Pomace and Microcrystalline Cellulose Composites Made by Press Processing. Sustainability. 2020; 12(4):1311. https://doi.org/10.3390/su12041311
Chicago/Turabian StyleŻelaziński, Tomasz, Jacek Słoma, Jacek Skudlarski, and Adam Ekielski. 2020. "The Rape Pomace and Microcrystalline Cellulose Composites Made by Press Processing" Sustainability 12, no. 4: 1311. https://doi.org/10.3390/su12041311
Note that from the first issue of 2016, this journal uses article numbers instead of page numbers. See further details here.