Uncertainty Analysis of Embedded Energy and Greenhouse Gas Emissions Using BIM in Early Design Stages


Institute of Energy Efficient and Sustainable Design and Building, Technische Universität München (Technical University of Munich, TUM), 80333 München, Germany
*
Author to whom correspondence should be addressed.
Sustainability 2020, 12(7), 2633; https://doi.org/10.3390/su12072633
Submission received: 25 February 2020
/
Revised: 18 March 2020
/
Accepted: 20 March 2020
/
Published: 26 March 2020
(This article belongs to the Special Issue Integration of LCA and BIM for Sustainable Construction)
Abstract
:With current efforts to increase energy efficiency and reduce greenhouse gas (GHG) emissions of buildings in the operational phase, the share of embedded energy (EE) and embedded GHG emissions is increasing. In early design stages, chances to influence these factors in a positive way are greatest, but very little and vague information about the future building is available. Therefore, this study introduces a building information modeling (BIM)-based method to analyze the contribution of the main functional parts of buildings to find embedded energy demand and GHG emission reduction potentials. At the same time, a sensitivity analysis shows the variance in results due to the uncertainties inherent in early design to avoid misleadingly precise results. The sensitivity analysis provides guidance to the design team as to where to strategically reduce uncertainties in order to increase precision of the overall results. A case study shows that the variability and sensitivity of the results differ between environmental indicators and construction types (wood or concrete). The case study contribution analysis reveals that the building’s structure is the main contributor of roughly half of total GHG emissions if the main structural material is reinforced concrete. Exchanging reinforced concrete for a wood structure reduces total GHG emissions by 25%, with GHG emissions of the structure contributing 33% and windows 30%. Variability can be reduced systematically by first reducing vagueness in geometrical and technical specifications and subsequently in the amount of interior walls. The study shows how a simplified and fast BIM-based calculation provides valuable guidance in early design stages.
1. Introduction
Buildings play an important role in providing comfortable conditions for human life and work. Therefore, it is not surprising that constructing and operating them and the related infrastructure consumes a large part of global resources [1], both in terms of material as well as energy [2], and directly and indirectly emits 40% of global greenhouse (GHG) gas emissions [3]. Hence, the building industry is one of the focus areas for the reduction of energy demand and GHG emissions [4]. Life cycle energy demand by and emissions from buildings consist of two components—embedded (also known as embodied) and operational [5]. Due to the long lifespan of buildings, conditioning the building is responsible for the largest share of energy consumption and emissions of existing buildings. Therefore, efficiency efforts have focused on the operation phase [4]. However, with increasing energy efficiency and a growing share of renewable energy for building operation, embedded energy and environmental impacts gain importance. The European directive on the energy performance of buildings [6] requires all newly constructed buildings in Europe to be nearly zero energy buildings (NZEB) starting in the year 2020. This means that new buildings will consume almost no non-renewable energy during their operation. Consequently, all non-renewable energy demand and thus the largest share of GHG emissions will occur during the construction, maintenance, and end-of-life phases. Recent studies underline this trend [5,7].
To evaluate the environmental performance of building throughout their entire life cycle, life cycle assessment (LCA) is in the process of being established in the building industry [8]. However, unlike operational energy calculations, LCA is not part of standard planning processes. Even operational energy calculations are conducted as late as possible in the design process when more information about the future building is available, mainly to show compliance with standards [9]. LCA calculations are not mandatory except for certification purposes by a green or sustainable building certification system, such as DGNB (Deutsche Gesellschaft für nachhaltiges Bauen, German Sustainable Building Council) [10] or LEED (Leadership in Leadership in Environmental and Energy Design) [11]. In light of the increasing importance of the construction, maintenance, and end-of-life phases, both standardization and tools for evaluation are needed [12].
Energy and environmental performance evaluation throughout the building design process bears significant improvement opportunities [13], but at the same time, it poses multiple challenges. The assumptions made throughout the initial design stages and the decisions based on these assumptions have significant influence on building performance [14,15]. As the potential to minimize energy demand and GHG emissions is greatest in these early design stages [16,17], there is increasing demand for performance evaluation in these stages. However, there is a lack of information about future building, and information, which can serve as a basis for analysis, is uncertain. To deal with this vagueness, sensitivity analyses should be employed in order to visualize uncertainties in the results as well as influential parameters contributing significantly to result uncertainties [18]. Moreover, for the designer, it is also valuable to see which building parts contribute most to the overall quantity of energy demand and environmental impact. For the purposes of this study, we use the term contribution analysis for this calculation.
Uncertainty analysis has recently been used extensively in building (operational) energy assessment [19]. For LCA, which includes embedded energy and environmental impact calculations, uncertainty analysis is less common [20], but with increasing relevance of embedded life cycle phases of buildings, it is becoming an important research field. Sources of uncertainty in embedded energy and impacts overlap with uncertainties for operational energy mainly when they pertain to exterior building parts [21]. Of the different uncertainties present in LCA studies—parameter uncertainty, model uncertainty, and scenario uncertainty [22]—this study is concerned with uncertainty in the building design parameters.
Uncertainty analysis consist of a sampling step (preprocessing), calculation (uncertainty propagation), and final analysis (post-processing) of the results [23]. The sampling step involves varying the input parameters according to their distribution functions. Monte Carlo simulation is one of the most commonly used sampling technique in probabilistic calculations, generating random samples based on the input parameters’ distribution functions [24]. Subsequently, the uncertainties are propagated, i.e., the output results for each sample and mean value and variance of all output values are calculated. Global sensitivity analysis then identifies how much input parameter uncertainties contribute to output variance. Only if sampling is based on distribution functions, global sensitivity analysis is possible [25]. Global sensitivity analysis techniques usable in LCA include (squared) standardized regression coefficients, squared Spearman correlation coefficients, or Sobol indices [25].
Full building LCA calculations require detailed information about the materials used in the building, construction processes, energy demand and generation, and end-of-life scenarios. Although there are building characteristics that influence both embedded and operational energy and impacts, the calculation methods for each are essentially different: operational energy demand ideally requires dynamic thermal simulation taking into account the exterior conditions (climate, shading provided by surrounding buildings, etc.). The calculation of environmental impacts for building operation uses the operational energy demand as an input value and calculates the related environmental impact by taking the energy sources (mechanical systems and energy carrier) into account. Embedded energy and environmental impact calculations, in contrast, are essentially matrix calculations whose complexity stems from the amount of data and information required. To reduce this complexity to a manageable level, aggregated data is provided in building LCI/LCIA databases such as the Oekobaudat [26]. This paper explores in detail the analysis of embedded energy and GHG emissions in early design stages in addition to the uncertainty analysis of relevant parameters for both operational and embedded energy published in Harter et al. [21]. The related operational energy calculation is described in detail by Singh and Geyer [27].
Existing LCA and energy calculation tools work well for later design stages when the building’s shape and materials are established in detail [28]. Current methods to calculate embedded energy and impacts do not lend themselves to early design stages, as they require more information input than commonly available at an early stage. In early stages, missing information in terms of both materials and missing building elements have to be estimated. However, estimations require expert knowledge and lack transparency for the designer. Moreover, design uncertainties are not systematically taken into account [20]. In this context, building information modeling (BIM), a well-established modeling technology with 3D-data including geometry and information on different levels [29], offers several opportunities: it facilitates managing the amount of data needed for calculations and providing automated or semi-automated calculations [30,31].
In early stage performance analysis, few, if any, variants of a project are evaluated, as standard calculations are lengthy and hence time-intensive. Commonly, only a handful of previous sample projects are available, providing guidance from experience to find the most relevant parameters. However, as various buildings are only comparable to a limited extent, even normalization to usable floor area and one building type does not provide satisfying standard values [32], as influential parameters can differ from project to project. Hence, the aim of this project is the development of a tool for engineers and designers to provide a project-specific quick estimate of the embedded energy and GHG emissions of the building using a limited number of background datasets, but taking uncertainties caused by design vagueness into account. Subsequently, this will be integrated into the overall performance evaluation such that trade-offs between operational and embedded life cycle phases can be visualized and other criteria (cost, fire safety, etc.) are taken into account.
This paper presents the calculation methods and our sample project in Section 2, starting with the LCA method (Section 2.1), subsequently describing the integration into BIM (Section 2.2) the sensitivity and contribution analysis (Section 2.3), and finally the sample project (Section 2.4). We split the results, Section 3, into three parts. In Section 3.1, we tackle the question of which parameter uncertainties contribute the most to result uncertainties (sensitivity analysis). Section 3.2 analyses the contribution of the building parts, i.e., which parts contribute the most to total embedded energy and environmental impacts (contribution analysis). Section 3.3 tests the influence of a different material choice for the building part with the most contribution to GHG emissions. Section 3.4 evaluates the order of magnitude of average total rough estimate results and validates them against a complete LCA and a simplified manual LCA of the final building design. Section 4 discusses the results, describes the limitation of this project, and provides an outlook toward future research.
2. Methods
2.1. Life Cycle Assessment (LCA)
Building LCA in Europe is standardized per the norms DIN EN ISO 14040 (Environmental management—Life cycle assessment—Principles and framework) [32] and DIN EN 15978 (Sustainability of construction works—Assessment of environmental performance of buildings—Calculation method) [33]. The norm DIN EN ISO 14040 provides the general framework, structuring LCA into four steps: goal and scope definition, life cycle inventory, life cycle impact assessment, and reporting. Our calculations follow this standard, with the goal defined as the comparison between design variants and scope as life cycle primary energy (PE) analysis and analysis of GHG emissions. The life cycle inventory was conducted with a quantity takeoff from an IFC model and a link to Oekobaudat [26]. For the purposes of this study, we translated required Oekobaudat datasets into an SQL database, which provide PE and global warming potential (GWP) values. We included the following building phases: A1–A3 production (including raw materials supply, transportation, manufacturing), B4 replacement, and C3–C4 end-of-life (waste processing and disposal), as defined by DIN EN 15978 [33]. Phase D, reflecting end-of life credits and loads from reuse, recovery, recycling, was calculated separately and is not included in total results. Values for A1–A3, C3–C4, and D come directly from Oekobaudat, whereas phase B4 is related to the reference service life of the building components. For Oekobaudat data, it is mandatory that for construction materials life cycle stages A1–A3 are included. Whenever neither data for life cycle phases C3 nor C4 was included in specific datasets, we used generic end-of-life processes such as construction waste processing. An example for this is mineral wool, for which the generic dataset “construction rubble landfill” provides end-of-life impacts.
We considered building parts (Table 1) that typically contain the largest share of building materials [32]. Reference service life (RSL) lengths of materials were combined for building parts following the definitions used in German LCA studies conducted for building certification [34] which is based on [35]. For the internal walls, instead of the 50-year RSL of gypsum boards, we assumed a conservative value (20 years) for office buildings, for which the interior is renewed more often than every 50 years due to a change in user or for reasons of representativeness. The study period is 50 years, as this is the standard defined by DGNB [36] and BNB (Bewertungssystem Nachhaltiges Bauen, Sustainable Building Certification System) [37] certification systems and used by the majority of recent building LCA studies [38].
We considered result values for PE demand in megajoules (MJ), split into renewable (PERT) and non-renewable (PENRT) primary energy, and global warming potential (GWP) in kg CO2-eq. This choice is based on the fact that buildings contribute significantly to global energy demand and GHG emissions (Section 1). PENRE, the energy resources part of PENRT, and GWP are related because the burning of fossil fuels emits carbon dioxide and thereby contributes to global warming. Therefore, we additionally looked for a possible correlation between PENRT and GWP.
2.2. Integration into BIM
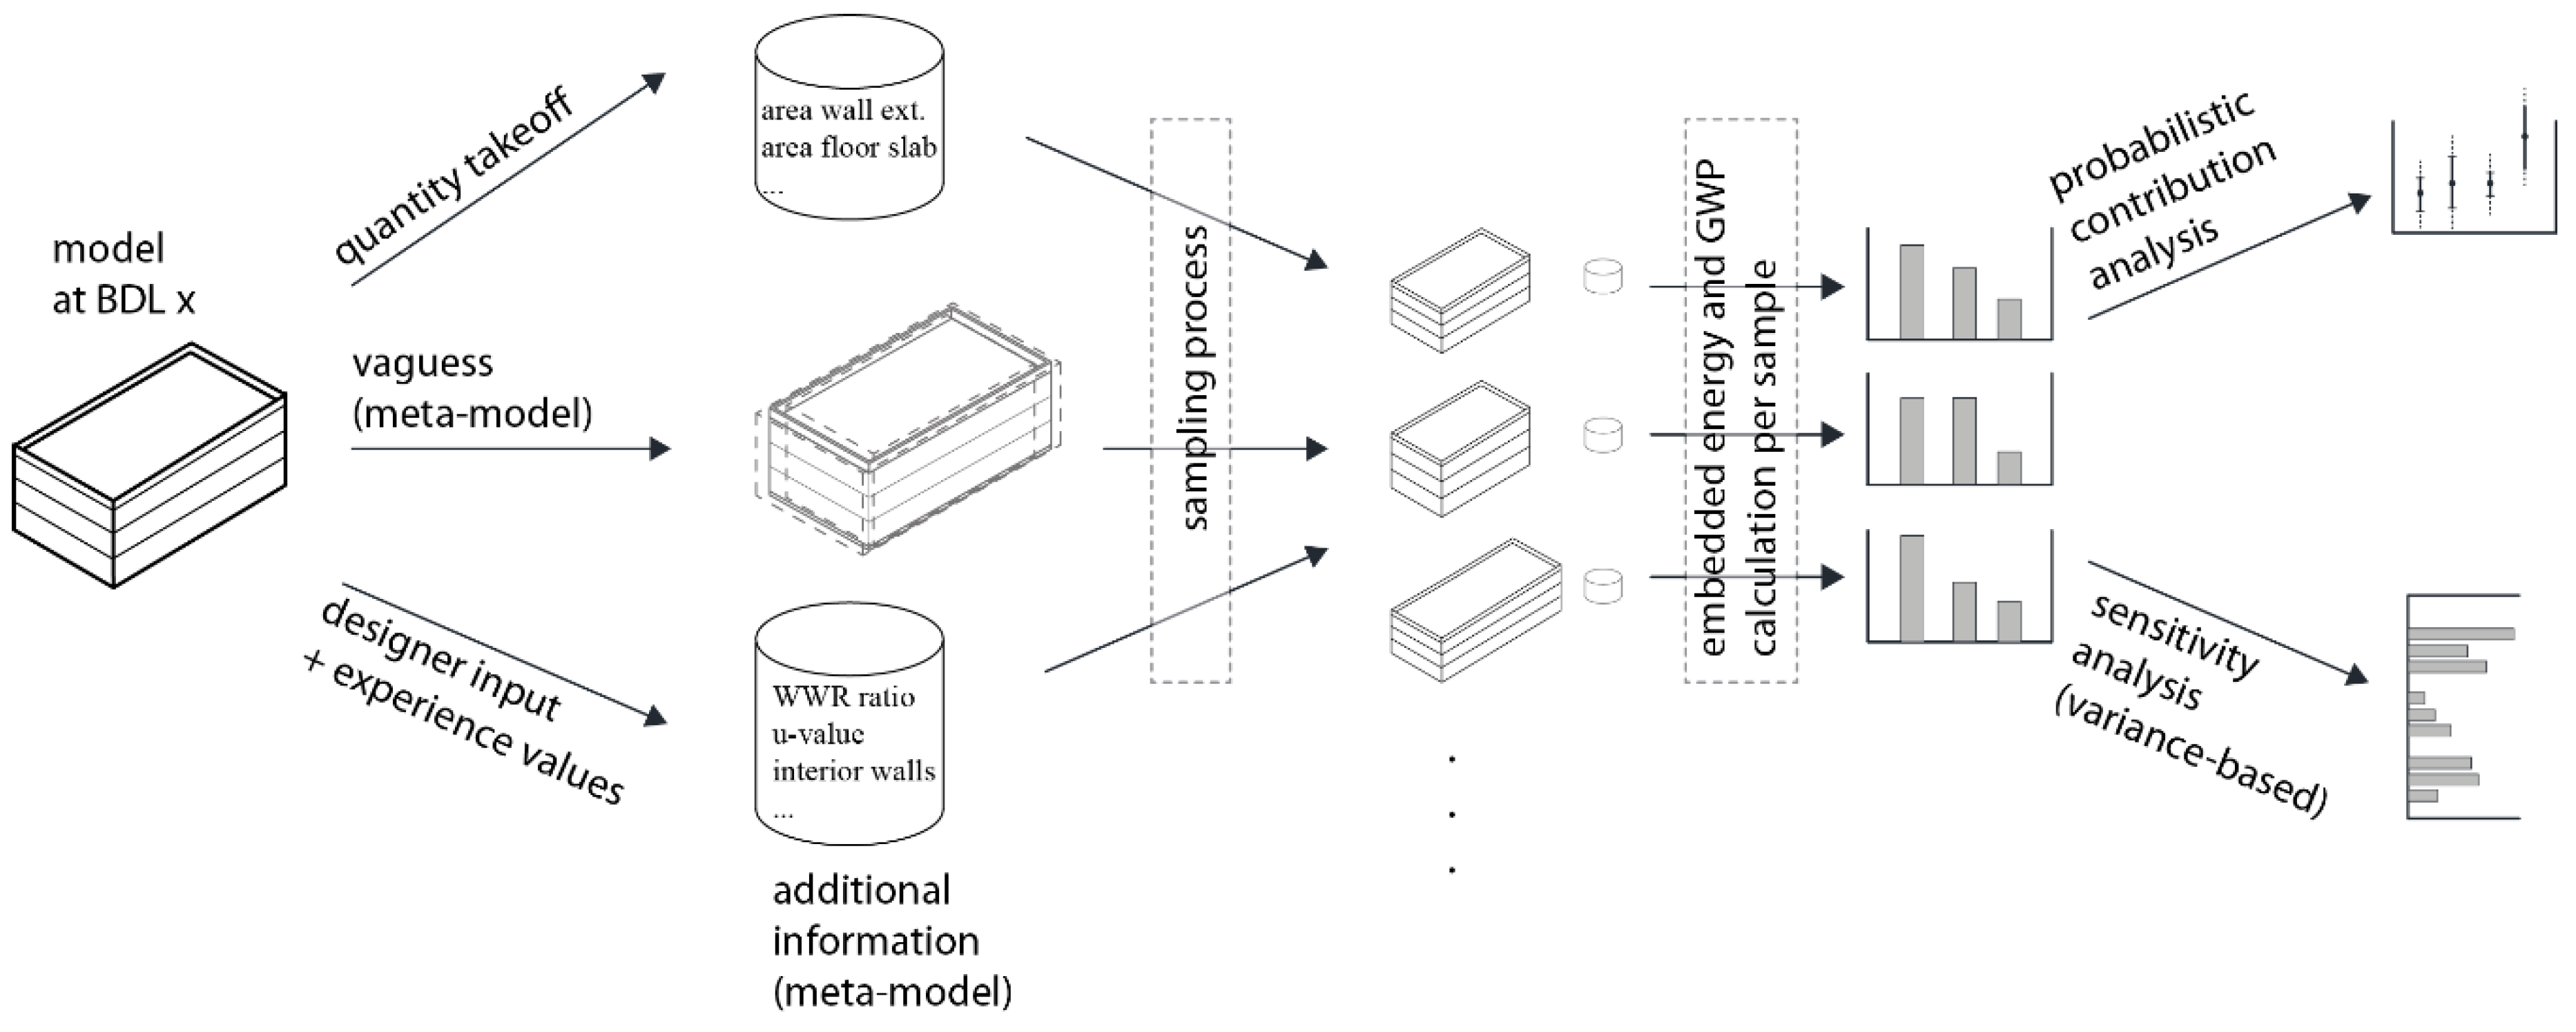
The LCA calculations described in Section 2.1 rely on BIM methods developed within the research group EarlyBIM [39]. The calculation process involves quantity takeoffs of the main building parts from an early design stage IFC model, including exterior wall areas, base plate area, roof area and floor slab areas (Figure 1). The sampling process uses these quantity takeoffs in conjunction with vagueness defined by the designer. To provide information about geometric and semantic uncertainties in BIM-models, the meta-model allows specification of vagueness of the overall building model and building components [40]. We use this meta-model to integrate vagueness into PE and GWP calculations. The designer and the consulting engineer provide additional information needed for the calculations, such as window-to-wall-ratio or u-values (Table 2). This information also contains vagueness according to the design stage.
As described, parameters termed “geometry” are derived from the BIM model. The parameter “interior walls” represents the (volume) percentage of interior walls of total interior volume of the building (i.e., gross volume minus volume of exterior walls, base plate, floor slabs, and roof). The window-to-wall-ratio is the ratio of transparent area to total exterior wall area. The technical specifications depend on consultant input. U-values of exterior building parts determine the energy standard of the building. “Construction thicknesses” represent the thickness of the structural elements (i.e., excluding insulation), depend on the structural requirements of the building parts, and are subdivided by building part (base plate, floor slabs, exterior walls, and roof). Finally, the reinforcement amount is needed for concrete building parts only and is defined to be the mass (kg) of reinforcing steel per volume (m3) of concrete. As we are analyzing embedded impacts in more detail, the number of parameters is reduced compared to our previous study concerned with LCEA [21]. Also, the reduced number of parameters allows us to regroup them differently providing a more specific analysis.
The method is integrated with the concept of building development levels (BDL) developed within the EarlyBIM research group [41,42]. BDL describes the project-specific maturity of a BIM model. This concept was developed, because the commonly used term level of development (LOD) specifies the geometric and semantic information content of building elements but explicitly not the entire building model [43]. On the contrary, models typically are multi-LOD-models, i.e., they consist of elements of various LODs throughout the design process. The BDL concept was developed to enable the project team to specify required information and vagueness on a building level during the design process. The LOD concept is used as a basis for the elements contained in the models. Starting with BDL1, when no 3D information is available yet, models are increasingly enriched with geometric and semantic information with decreasing vagueness of the contained information. As the BDL specification does not contain values for LCA calculations, we defined a set of input parameters needed for our calculations (Table 2) and grouped them according to the design process, as a group of parameters tends to be defined at the same time by the same actor. For each parameter, a mean value and vagueness (percentage of possible deviation) are provided. Quantities and specifications in conjunction with corresponding vagueness serve as input parameters for the following sensitivity and contribution analysis.
2.3. Sampling Process, Sensitivity, and Contribution Analysis
The input parameters (Table 2) for the LCA calculation elements are subsequently sampled using a uniform distribution of the design parameters as recommended by Kristensen and Petersen [44] for design uncertainties. All parameters are varied simultaneously (Monte Carlo), such that each building sample consists of a unique combination of parameter values. The sampling sets are generated within MatLab using the ERAdist MCS (normal MOM) probability distribution class developed by Geyer et al. [45]. Given the very short calculation time (less than 30 seconds for the initial calculation of one BDL, less than five seconds for subsequent calculation and generation of graphs), we chose a generous number of sampling sets (105). For each sample, the LCI/LCA results are calculated for primary energy (PENRT, PERT) and GHG emissions (GWP).
For the subsequent variance-based sensitivity analysis, we calculated first-order sensitivity indices, showing how input parameter uncertainties influence result uncertainty. The sum of the sensitivity coefficients should be equal or close to 100%, as it is assumed that higher-order effects are close to zero. This sensitivity analysis provides guidance to the designer which uncertainties to systematically reduce in order to improve exactness of calculations.
Additionally, we conducted a contribution analysis. We calculated the means and standard deviation per building part (Table 1) and for the whole building to see which building parts contribute the largest share to energy demand and GHG emissions. This contribution analysis shows the relevance of each building part for the total outcome and guides the designer toward the building parts with the highest overall reduction potential. Contribution and sensitivity analysis are related—parameters influencing the most relevant building parts will also prove to exhibit comparatively larger sensitivities.
According to Raskin and Tylor [46] various terms for uncertainty are used in both colloquial and scientific language, with their definitions themselves uncertain. We use the term uncertainty—as suggested in Hawer at al. [47]—as an umbrella term for all types of uncertainty such as fuzziness, vagueness, ambiguity, etc. To further specify design uncertainty separated from other uncertainties inherent in the BIM model we used the term vagueness. In this, we differ from Abualdenien and Borrmann [41] where design uncertainty was referred to as fuzziness. Both concepts are, however, closely connected according to [48]. In our study, vagueness is due to decisions not yet made in the design process. It is assumed that this vagueness is eliminated by the time the building has been built. Of course, even the as-built state of a building contains uncertainties due to e.g., construction tolerances or the dynamic nature of u-values.
Huijbregts et al. [22] identified three types of uncertainty in LCA studies—parameter, scenario, and model uncertainty. Of these, our study is concerned with parameter uncertainty, termed vagueness, as explained above. Uncertainties in the underlying scenarios or assumptions, such as length of the study period or reference service lives, were not included in our sensitivity analysis, as these are outside of the influence of the architect or engineer during the planning process. Rasmussen et al. [49] provide an overview of the influence of these choices. Neither are LCA models, such as characterization methods, varied in our study, as the employed database, Oekobaudat [26], does not provide data for this, and designers cannot influence these choices. Therefore, the underlying datasets are fixed in this study, in contrast to Tecchio et al. [50,51], which employed the method of structured under-specification to capture uncertainty in material choice in early design stages.
The value corridors for the input parameters determine the characteristics of the building to be analyzed, covering a wide range of building forms and construction types. For example, the window-to-wall ratio represents the type of façade, such as fully glazed curtain wall or opaque façade with few window openings.
2.4. Case Study
We applied our method to the office building “FTmehrHAUS” by Ferd. Tausendpfund GmbH, using BIM models at BDL 2, 3, and 4. The case study is a three-story, rectangular-shaped building with a gross floor area of approximately 1200 m2 located in Regensburg, Germany. The building was built in 2016 using three different wall types for each story of exterior wall: concrete, masonry and sand lime stone, each with an exterior insulation and finishing system (EIFS). The building’s structure is made of reinforced concrete. Table 3 shows the input values for the calculations representing the sample building. The building’s energy standard exceeds the requirements of the current German energy saving ordinance [52].
Initial vagueness percentages were chosen to represent a rough design of the case study building at BDL2. Geometric uncertainties were chosen to be lowest, as we assumed that the rough volume is decided upon early in the process. However, these are project-specific and can vary greatly from project to project, as they depend on the specific site conditions. For example, it is possible that the building footprint is fixed by a development plan, such that the vagueness of the ground and floor slab areas would be zero. All other vagueness percentages were set to 25% to represent a reasonable range of values in order to test the method. These, too, can differ from project to project, as there might be specific requirements, such as an ambitious energy standard with very low u-values. Vagueness is subsequently reduced following guidance from the sensitivity analysis. The results of this case study cannot be generalized for the above reasons, but the method can be applied to other buildings.
For validation purposes, a standard LCA calculation of the project based on the execution drawings and additional information from the client was conducted. To maintain comparability with the probabilistic calculation, as described in Section 2.1, we considered one uniform wall type (concrete with EIFS) for the entire exterior wall. The Oekobaudat version (2016-I), study period, and products’ reference service lives are identical with the respective framework for the probabilistic calculation. For comparison with the sampling and uncertainty propagation results, all data was input into the tool eLCA [53], from which results were exported in csv format and split into the four building parts structure, insulation, windows, and internal (Table 1).
3. Results
3.1. Sensitivity Analysis
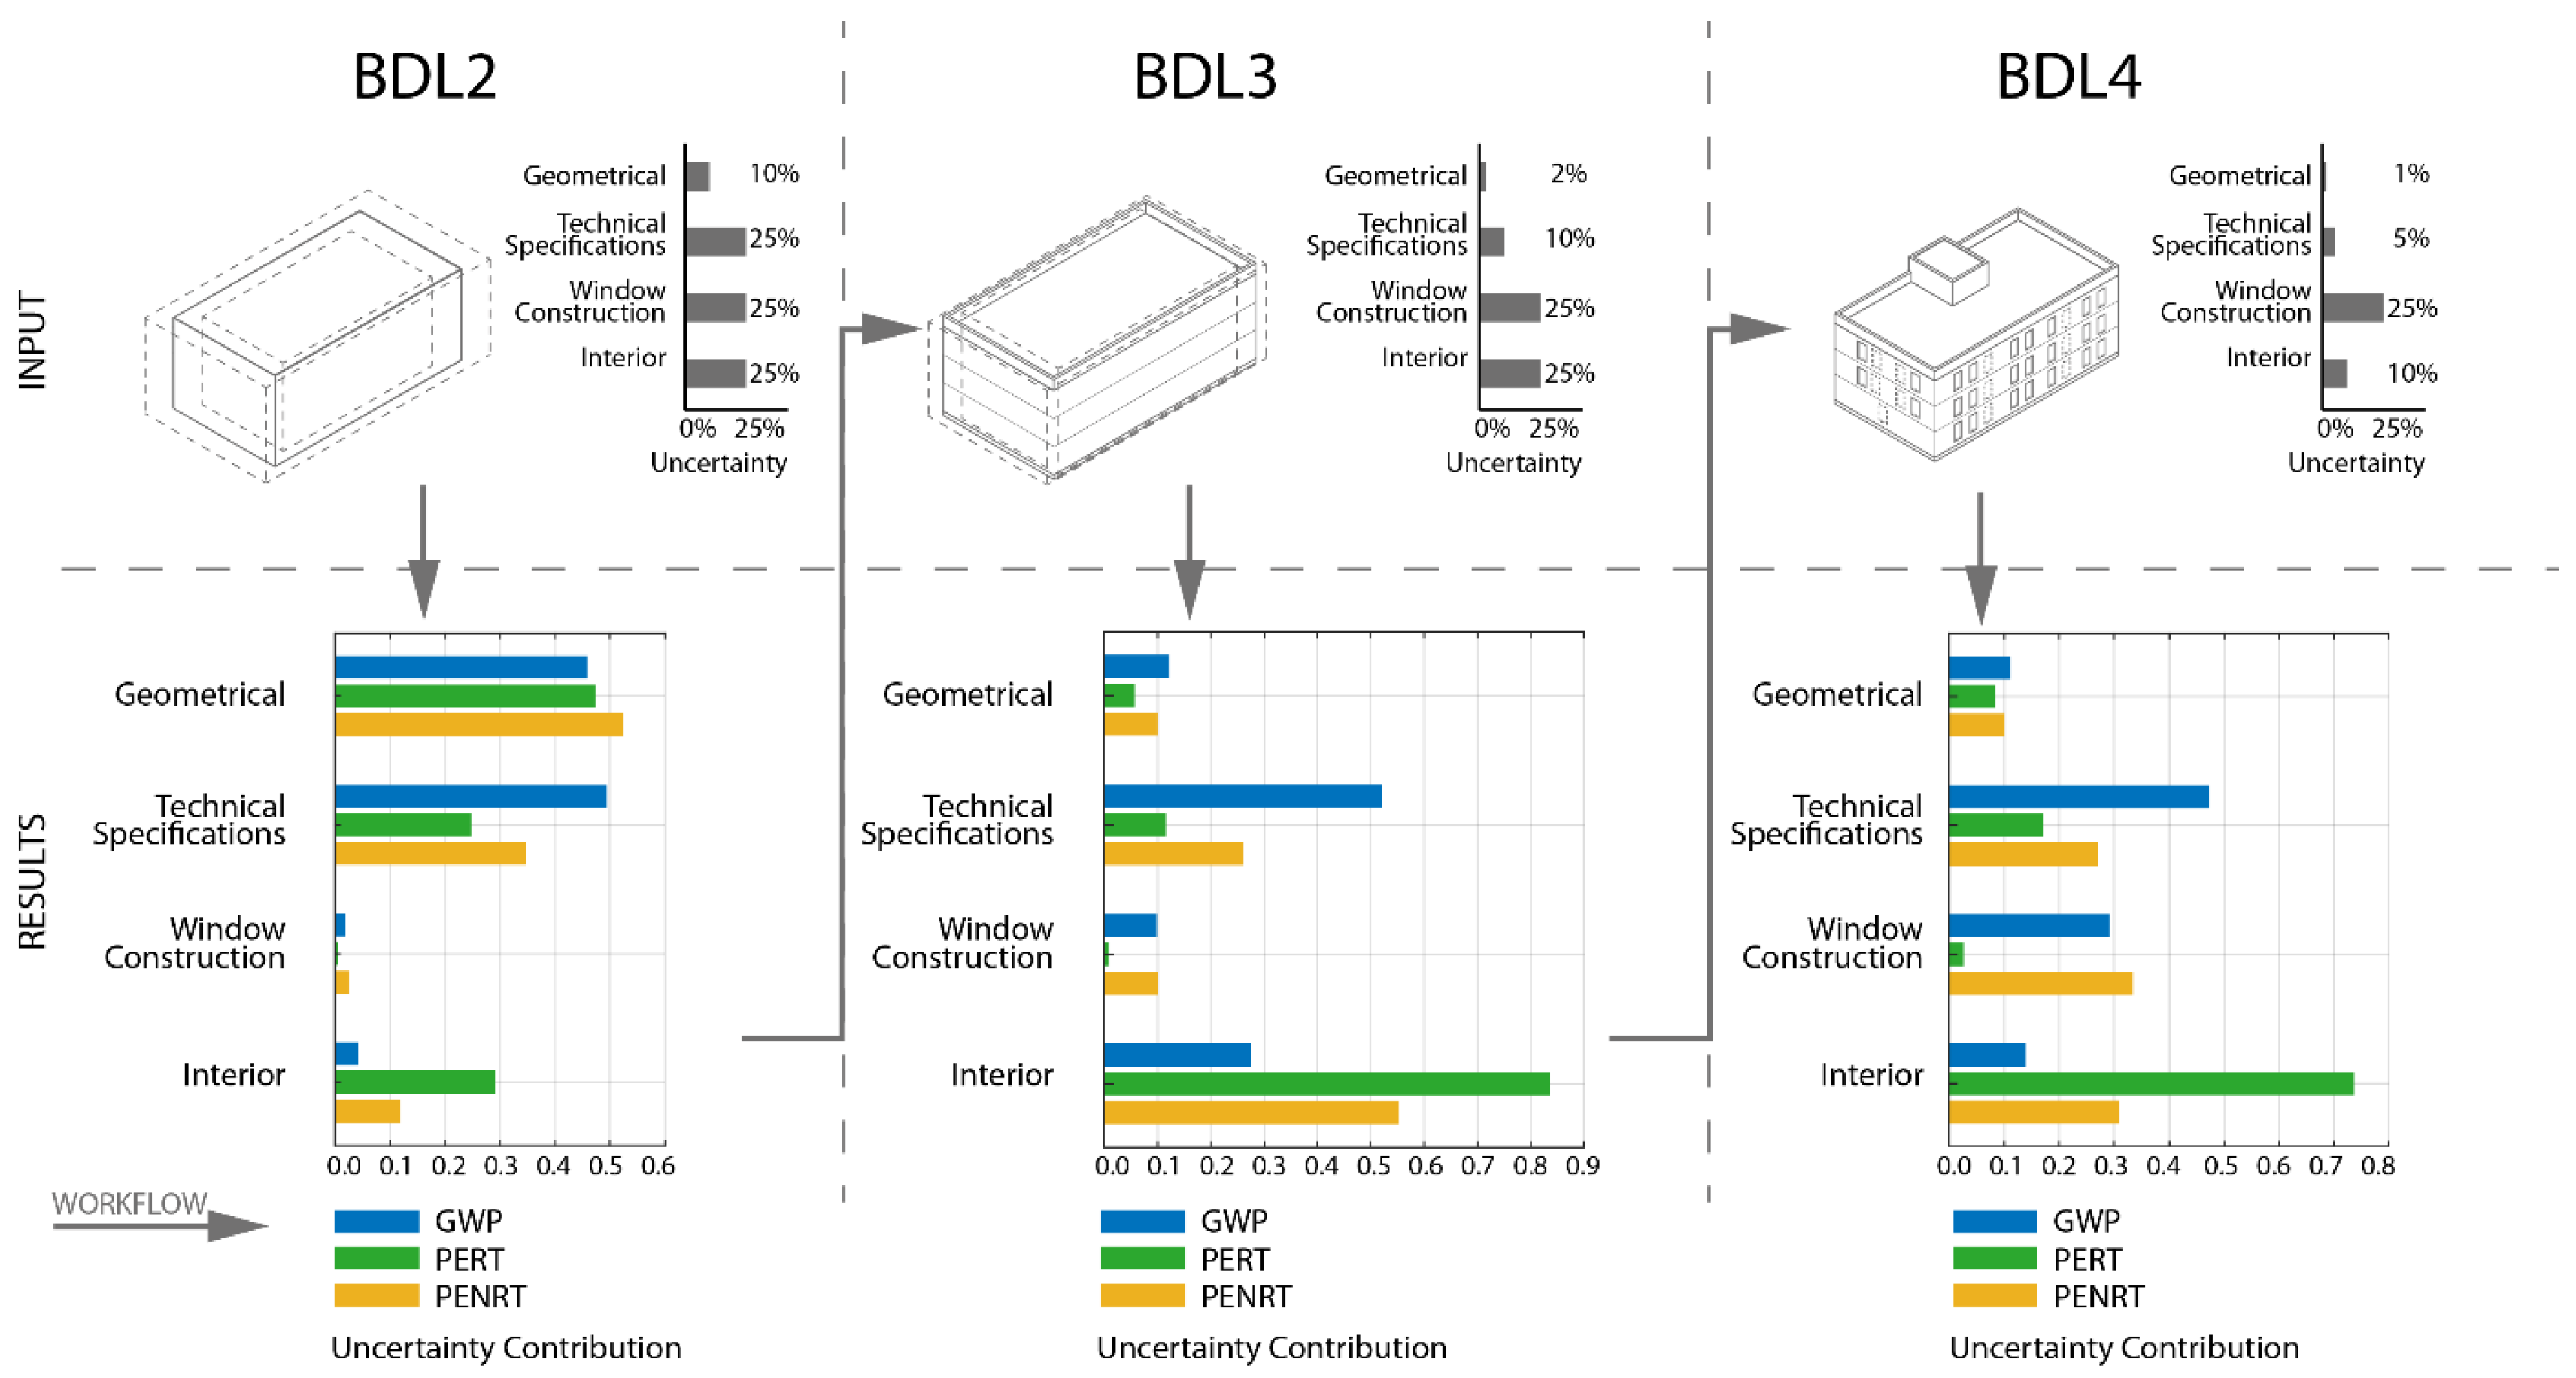
Figure 2 shows uncertainties and resulting uncertainty contribution for each parameter group according to BDL 2, 3, and 4. Exact numbers are listed in Appendix A, Table A1. Input parameter uncertainties are strategically reduced with increasing BDL to reduce overall uncertainty in the results. Note that the sum of uncertainty contribution is always close to one (100%) (see Section 2.3). It has to be kept in mind that Figure 2 shows uncertainty contribution, not overall result uncertainty. The latter is shown in Section 3.2.
In BDL 2, result uncertainties are highly dependent on the geometrical parameter uncertainties, followed by the uncertainties in technical specifications. Hence, these input uncertainties are reduced for BDL3 in order to increase the accuracy of the results. In BDL3, result uncertainties, now overall lower than in BDL2, are strongly dependent on interior (for PERT and PENRT) and still on technical specifications (for GWP). Therefore, uncertainty in these parameters is reduced for BDL4. In BDL4, the uncertainty contribution of windows increases for GWP and PENRT, as all other uncertainties are small. In this process, it is clear that there are trade-offs involved when decreasing uncertainties simultaneously: reducing uncertainties in one parameter increases the contribution of another parameter, e.g., uncertainty contribution of the technical specifications to GWP does not change, as the uncertainty contribution of interior decreases simultaneously. However, overall uncertainty decreases significantly with increasing BDL (see Section 3.2).
Overall, an ideal picture would show equal sensitivities for all parameters. This, however, is impossible due to the differing nature of the indicators considered. Between PENRT and GWP, parallels can be identified. This is not surprising, as the use of fossil energy sources (represented by the indicator PENRT) contributes largely to GHG emissions, represented by the indicator GWP. However, GWP and PENRT do not correlate entirely, as there are other sources of GHG emissions, such as the chemical process of clinker production, which is a step in the process of cement production. PERT behaves differently from both PENRT and GWP: Results’ uncertainty for PERT is to the largest extent due to the uncertainty of the amount of interior walls, starting from BDL3. In turn, the uncertainty in window construction is insignificant for PERT uncertainty. This is related to the fact that the materials used in interior wall construction (gyp board) have a comparatively high content of PERT, whereas the materials used in window construction (PVC, glass) do not.
The sensitivity analysis guides the workflow of strategic uncertainty reduction and thereby reduces overall uncertainties. From the BDL 2 analysis, the planning team receives the information that geometric uncertainties and technical specifications are the main sources for result uncertainty. Therefore, planning efforts should focus on these aspects to arrive at BDL3. Subsequently, the layout of the interior walls needs to be specified in addition to the aforementioned parameters. These steps increase reliability of results as will be shown in the following Section 3.2.
3.2. Contribution Analysis
This section analyses the contribution of functional parts of the building to show how the sensitivity analysis indicates where in the building the highest potential to reduce PE demand and GHG emissions is located. This pertains to the indicator GWP for GHG emissions and PERT and PENRT for primary energy use. Building parts are defined in Table 1.
Figure 3 shows the results for the sample building for BDL2 and BDL4. BDL 3 was omitted as results lie between BDL2 and BDL4 and do not contain additional information regarding the building part contribution.
First, the overall reduction of result uncertainty is clearly visible. Average values stay constant as we did not change any of the mean input values. The contribution of the building parts changes insignificantly from one BDL to the next. This, too, is an expected result for the same reason as the (mean) input values stay the same.
Second, the contribution analysis can guide architects and consultants towards strategic building parts, i.e., the parts that should be considered primarily when looking for ways to reduce energy demand and GHG emissions. To render a building part truly strategic a second condition must be fulfilled: alternative materials with lower PE content and GHG emissions need to be available. For example, for a concrete base plate, no alternative materials are available. However, alternatives in structural design either providing a different kind of foundation or an alternative concrete/reinforcement combination might be available. Hence, this study provides guidance toward the building parts with the highest influence but does not provide design assistance, i.e., it entrusts the design team with determining if alternative solutions are available. For GWP and PENRT, the building’s structure, made of reinforced concrete, clearly emerges as a decisive part, contributing half of the building’s GWP and 37% of PENRT. Second, windows are relevant and thirdly, interior walls. Insulation plays a lesser role despite the above average energy standard of the building.
As a building part’s contribution depends on the materials used for each building part, reducing overall emissions without changing any of the input parameters requires looking at alternative building materials.
3.3. GWP Reduction Potential
Since the structure is the largest contributor to total GWP and the use of wood is known to reduce GHG emissions, we ran the sensitivity and contribution analyses with wood instead of reinforced concrete. In general, this alternative is only available when fire safety requirements allow the use of wood (which is the case for our case study as we deal with a building of a low fire safety class) and takes into account that some parts cannot be replaced such as the base plate. All results are listed in Appendix A, Table A2. This case study shows the effect of a different material choice. Overall, changing the structural material reduces GWP by 25% and PENRT by 10% while at the same time increasing PERT by 123% (see Figure 4). This result is in line with previous LCA studies, which unequivocally state that the use of wood structures reduces GHG emissions [54]. The large increase in PERT is due to the calculation background used in Oekobaudat: the sunlight absorbed by the trees is attributed to the wood as consumption of renewable energy.
The analysis also shows that, at BDL2, uncertainties are such that there are reinforced concrete building samples with lower GWP than some of the wood building samples. However, this overlap between the probabilistic results is located outside of the interquartile range. This means that the wood structure is highly likely to perform better in this indicator. For PENRT, the wood structure is still likely to perform better, but the overlaps between the two material options are greater than for GWP. For the indicator PERT, on the other hand, there are no overlaps. Therefore, any sample of the wood building will demand more PERT than any sample of the concrete building. However, PERT is still only roughly 26% of overall PE demand, compared to 12.5% for the concrete building. In other words, total PE demand of the wood building is 7% higher than of the concrete building.
The contribution of the building parts shifts accordingly (Figure 5). The wood structure is responsible for 33% of GHG emissions instead of 50% for the case the reinforced concrete structure. The absolute results for other building parts stay the same, but their contribution increases as the total decreases. For PERT, the same applies reversely: the contribution of the structure doubles from 36% to 73%, reducing the relevance of all other building parts.
According to this analysis, the next step to minimize GHG emissions would be to look at other material options for the window frames. This is building-specific and has to be evaluated on a case-by-case basis.
3.4. Order of Magnitude and Validation
Since we are using a simplified model with only few materials, we verified the results with a more detailed LCA calculation based on the execution drawings of the case study. Additionally, we conducted a simplified LCA manually in order to verify the probabilistic calculation. This simplified calculation uses a fixed size of the building matching the mean input values and the same reduced number of materials as the probabilistic calculation. For the probabilistic calculation, mean values of the BDL4 calculation are shown, as these are the least uncertain. However, as described in Section 3.2, mean values are consistent throughout the BDLs.
Table 4 shows the results of the simplified and probabilistic calculations in comparison to the detailed calculation based on the execution drawings. All values are rounded without digits. Hence, the sum of all contribution percentages can differ from 100%, as it does for PERT and PENRT simplified (99%) and PENRT detailed (99%). Simplified and probabilistic calculations generally deliver similar results differing by a maximum of −5% and +8%. This indicates that the probabilistic calculation is by far superior to a manual simplified calculation, as it can calculate 105 samples in less than one minute, a task that is virtually impossible for a traditional calculation by hand.
Compared to the detailed calculation, the probabilistic calculation underestimates GWP and PENRT by 27% and 30%, respectively, but does not differ significantly in PERT results. Therefore, we look at GWP and PENRT separately from PERT results. Generally, for GWP and PENRT, detailed results are at the high end of the value corridor of the BDL2 calculation shown in Figure 3. This is to be expected as the probabilistic calculation neglects all finishes and small elements and therefore is restricted to a handful of materials, whereas the detailed calculation is based on 42 different materials. Hence, the absolute values of the calculation should not be used in the planning process, for example to determine compliance to certification benchmarks. Instead, the design process should be based on comparative analyses.
However, the contribution analysis, i.e., the indication of strategic building parts, differs by +5% (GWP) or −7% (PENRT) or less. The shares of structure and windows are slightly overestimated, the shares of insulation and internal underestimated. At the same time, the ranking of the building parts remains the same as in the detailed model for GWP. For PENRT, it indicates correctly the structure as the main contributor, but differs in the ranking of the other building parts, as their contributions are very close (21%, 21%, and 23%) in the detailed calculation. As guidance to the design team, the analysis shows correctly where the largest contribution and thereby the potentially largest reduction potential lies, as the probabilistic calculation matches the detailed calculation without uncertainties. This tendency of concrete structures to be the main contributor of GWP confirms results from previous studies [55,56].
For PERT, the overall result differs by a maximum of +5% (simplified calculation) and +2% (probabilistic calculation), but contribution differs by up to −5% and +9%, changing the ranking of building parts. The detailed calculation indicates that the structure offers the largest reduction potential, whereas the probabilistic and simplified calculations suggest the internal walls as the largest contributor. The underlying reason for this is the fact that the probabilistic calculation uses one material, gypsum board, for the interior walls; whereas the interior of the as-built building consists of a mixture of different wall types, e.g., glass partitions or masonry walls. Gypsum board demands about 10 times more renewable energy pro volume (m3) than masonry (2167 MJ vs. 263 MJ) but shows only roughly three times as much GWP. Hence, for a building part with an inhomogeneous mix of materials, the simplification to just one material can have a large influence on results. For building parts with fewer materials, like the building’s structure, where the bulk of the building part is made of one material, the probabilistic calculation should render accurate indications of their relevance within the building.
4. Discussion
Our results highlight the possibility of real-time life cycle analysis in early stages of design. Although the early stage analysis tends to underestimate the absolute values for PE demand and GHG emissions, valuable advice can be provided in two ways. First, the sensitivity analysis guides the designer towards the input parameters whose uncertainty causes the highest result uncertainties. Second, a contribution analysis reveals the strategic building parts where the potential is largest to reduce emissions and energy consumption.
The design team can use the results of the sensitivity analysis to reduce result uncertainties systematically by reducing the vagueness of the most relevant input parameters during the design process. Although reducing vagueness is a natural part of the detailing process, in a regular design process the design team is not aware of the impact on the precision of environmental analysis if an input parameter is detailed. Our analysis provides guidance toward which parameter’s uncertainty to reduce first to get a more precise indication of environmental impact. A previous study [21] showed that this method can also applied to the entire life cycle including operational energy consumption. Future work should add other criteria (such as cost) and take into account the multi-criterial nature of decision processes in building design.
The contribution analysis shows the building parts contributing most to PE demand and GHG emissions hence revealing their theoretical reduction potential. In order to determine the reduction that can be realized, alternative materials need to be tested. We provided an example of this by replacing the concrete structure by a wood structure where possible. To integrate this trial-and-error process into a design assistance tool, a database containing alternatives for different materials and building parts needs to replace our simplified database containing only fixed materials. Hollberg et al. [57] and Röck et al. [58] employ a component catalogue to address this challenge showing the realizable reduction potential.
The contribution analysis works well for homogenous building parts, such as the structure, and confirms results from previous studies. On the other hand, the contribution analysis tends to skew results when building parts with a multitude of materials, such as the building’s interior, are concerned. One way to counteract this would be to subdivide the building into more parts but thereby losing the early design stage simplicity. In addition, this phenomenon relates to material uncertainties in early design stages, which were not included in this study, but are subject to current (e.g., Tecchio et al. [51]) and future research.
For our early stage analysis, we considered three indicators. This represents a simplification from all 23 indicators available in Oekobaudat. However, the analysis shows that strategically reducing uncertainties in parallel for all three indicators is unachievable because result uncertainty for each indicator is dependent on input uncertainty of different parameters. This was to be expected regarding non-renewable and renewable energy, as increasing the use of renewable energy sources reduces non-renewable PE demand, i.e., these two indicators should inversely correlate. It is somewhat surprising that GWP and PENRT do not correlate, as the burning of fossil fuels, i.e., the use of PENRT, causes GHG emissions. In part, the fact that the chemical process of clinker production in the cement production process emits CO2 provides an explanation. For other materials than concrete, the reasons for the lack of correlation are less clear. Generally, this points to the fact that LCA results should not be reduced to one indicator, as none of the indicators can be regarded as representative for all others. Instead, decisions based on LCA results need to be treated as multi-criteria decisions.
To increase the completeness of results, more building materials will be implemented in our model. In order to achieve this, additional input parameters will have to be considered (e.g., concrete strength) and additional information (e.g., type of waterproofing) will have to be estimated. Additionally, the structural material types, reinforced concrete and wood, will be complemented by structural steel and hybrid structures. This has implications on the possible application of the method but does not change the methodological approach.
As shown in our previous work [21], LCA is incomplete if it neglects the operational phase. Therefore, we direct future research efforts towards integrating all life cycle phases, which implies also including the building’s mechanical systems. We expect multiple interdependencies calling for a detailed sensitivity and contribution analysis in conjunction with a weighting system for results.
Author Contributions
Conceptualization, P.S.-M.; Methodology, P.S.-M. and H.H.; Software, H.H. and K.T.; Validation, P.S.-M. and K.T.; Writing—Original Draft Preparation, P.S.-M.; Writing—Review and Editing, H.H., W.L. and K.T.; Visualization, P.S.-M.; Funding Acquisition, W.L. and P.S.-M. All authors have read and agreed to the published version of the manuscript.
Funding
This research was funded by the German Research Foundation (Deutsche Forschungsgemeinschaft, DFG) under grant FOR2363—project number: 271444440.
Acknowledgments
We thank Ferdinand Tausendpfund GmbH & Co. KG for providing their office building as a sample project. Thank you also to our colleague Jimmy Abualdenien from the EarlyBIM project for the valuable input and discussions. Last, but not least, we would like to thank two anonymous reviewers for their valuable feedback.
Conflicts of Interest
The authors declare no conflict of interest.
Appendix A. Results of Probabilistic Calculation

Table A1.
Sensitivities as shown in Figure 2.
Table A1.
Sensitivities as shown in Figure 2.
| BDL2 | |||||
| geo 10% | tech 25% | win 25% | int 25% | sum | |
| ‘gwp’ | 0.48 | 0.48 | 0.02 | 0.04 | 1.01 |
| ‘pert’ | 0.49 | 0.25 | 0.01 | 0.27 | 1.02 |
| ‘penrt’ | 0.54 | 0.34 | 0.02 | 0.11 | 1.01 |
| BDL3 | |||||
| geo 2% | tech 10% | win 25% | int 25% | sum | |
| ‘gwp’ | 0.13 | 0.53 | 0.09 | 0.26 | 1.01 |
| ‘pert’ | 0.06 | 0.12 | 0.01 | 0.83 | 1.02 |
| ‘penrt’ | 0.11 | 0.27 | 0.09 | 0.54 | 1.01 |
| BDL4 | |||||
| geo 1% | tech 5% | win 25% | int 10% | sum | |
| ‘gwp’ | 0.11 | 0.46 | 0.30 | 0.14 | 1.01 |
| ‘pert’ | 0.08 | 0.17 | 0.03 | 0.74 | 1.02 |
| ‘penrt’ | 0.10 | 0.25 | 0.34 | 0.32 | 1.01 |
Table A2.
Full results of probabilistic calculations for BDL 2, 3, and 4 and concrete and wood structure.
Table A2.
Full results of probabilistic calculations for BDL 2, 3, and 4 and concrete and wood structure.
| BDL 2 Concrete | ||||||||
| - | - | Mean | Var | StD | %con | %ins | %win | %int |
| ‘gwp’ | ‘kgCO_2-Eq’ | 3.3924E + 05 | 3.5565E + 08 | 1.8859E + 04 | 49.81% | 13.51% | 22.77% | 13.92% |
| ‘pert’ | ‘MJ’ | 5.2745E + 05 | 1.1230E + 09 | 3.3511E + 04 | 36.68% | 9.04% | 11.02% | 43.27% |
| ‘penrt’ | ‘MJ’ | 3.6601E + 06 | 3.9457E + 10 | 1.9864E + 05 | 37.58% | 14.57% | 24.90% | 22.94% |
| ‘pert+penrt’ | MJ | 4.1876E + 06 | 5.3446E + 10 | 2.3118E + 05 | - | - | - | - |
| PENRT/PET | 12,60% | - | - | - | - | - | - | - |
| BDL 2 Wood | ||||||||
| Mean | Var | StD | %con | %ins | %win | %int | ||
| ‘gwp’ | ‘kgCO_2-Eq’ | 2.5298E + 05 | 1.5306E + 08 | 1.2372E + 04 | 33.11% | 18.00% | 30.34% | 18.55% |
| ‘pert’ | ‘MJ’ | 1.1750E + 06 | 6.2815E + 09 | 7.9256E + 04 | 72.12% | 3.98% | 4.85% | 19.05% |
| ‘penrt’ | ‘MJ’ | 3.3117E + 06 | 2.7923E + 10 | 1.6710E + 05 | 31.72% | 15.94% | 27.24% | 25.10% |
| ‘pert+penrt’ | MJ | 4.4867E + 06 | 5.7203E + 10 | 2.3917E + 05 | - | - | - | - |
| PENRT/PET | 26.19% | - | - | - | - | - | - | - |
| BDL 3 Concrete | ||||||||
| Mean | Var | StD | %con | %ins | %win | %int | ||
| ‘gwp’ | ‘kgCO_2-Eq’ | 3.3683E + 05 | 4.9952E + 07 | 7.0677E + 03 | 49.84% | 13.44% | 22.78% | 13.94% |
| ‘pert’ | ‘MJ’ | 5.1711E + 05 | 3.4538E + 08 | 1.8584E + 04 | 36.69% | 8.99% | 11.02% | 43.30% |
| ‘penrt’ | ‘MJ’ | 3.6196E + 06 | 7.4711E + 09 | 8.6436E + 05 | 37.60% | 14.51% | 24.92% | 22.97% |
| ‘pert+penrt’ | MJ | 4.1367E + 06 | 1.0806E + 10 | 1.0395E + 05 | - | - | - | - |
| PENRT/PET | 12.50% | - | - | - | - | - | - | - |
| BDL 3 Wood | ||||||||
| mean | var | StD | %con | %ins | %win | %int | ||
| ‘gwp’ | ‘kgCO_2-Eq’ | 2.5271E + 05 | 2.8307E + 07 | 5.3204E + 03 | 33.14% | 17.92% | 30.37% | 18.57% |
| ‘pert’ | ‘MJ’ | 1.1745E + 06 | 9.7327E + 08 | 3.1197E + 04 | 72.13% | 3.96% | 4.85% | 19.06% |
| ‘penrt’ | ‘MJ’ | 3.3086E + 06 | 6.2364E + 09 | 7.8971E + 04 | 31.74% | 15.87% | 27.26% | 25.13% |
| ‘pert+penrt’ | MJ | 4.4831E + 06 | 1.1056E + 10 | 1.0515E + 05 | - | - | - | - |
| PENRT/PET | - | 26.20% | - | - | - | - | - | - |
| BDL 4 Concrete | ||||||||
| mean | var | StD | %con | %ins | %win | %int | ||
| ‘gwp’ | ‘kgCO_2-Eq’ | 3.3679E + 05 | 1.4690E + 07 | 3.8328E + 03 | 49.84% | 13.44% | 22.79% | 13.94% |
| ‘pert’ | ‘MJ’ | 5.1709E + 05 | 6.2175E + 07 | 7.8851E + 03 | 36.69% | 8.99% | 11.02% | 43.30% |
| ‘penrt’ | ‘MJ’ | 3.6191E + 06 | 2.0592E + 09 | 4.5378E + 04 | 37.61% | 14.50% | 24.92% | 22.97% |
| ‘pert+penrt’ | MJ | 4.1362E + 06 | 2.7302E + 09 | 5.2251E + 04 | - | - | - | - |
| PENRT/PET | - | 12.50% | - | - | - | - | - | - |
| BDL 4 Wood | ||||||||
| mean | var | StD | %con | %ins | %win | %int | ||
| ‘gwp’ | ‘kgCO_2-Eq’ | 2.5267E + 05 | 1.0625E + 07 | 3.2596E + 03 | 33.14% | 17.91% | 30.37% | 18.58% |
| ‘pert’ | ‘MJ’ | 1.1744E + 06 | 2.2059E + 08 | 1.4852E + 04 | 72.12% | 3.96% | 4.85% | 19.07% |
| ‘penrt’ | ‘MJ’ | 3.3082E + 06 | 1.8105E + 09 | 4.2550E + 04 | 31.74% | 15.86% | 27.27% | 25.13% |
| ‘pert+penrt’ | MJ | 4.4826E + 06 | 2.7277E + 09 | 5.2227E + 04 | - | - | - | - |
| PENRT/PET | - | 26.20% | - | - | - | - | - | - |
References
- Hegger, M.; Fuchs, M.; Stark, T.; Zeumer, M. Energie Atlas, Nachhaltige Architektur; Birkhäuser: Berlin, Germany; Basel, Switzerland, 2012; ISBN 978-3-7643-8385-5. [Google Scholar]
- International Energy Agency. World Energy Outlook 2019, Executive Summary; International Energy Agency: Paris, France, 2019.
- International Energy Agency. Buildings: A Source of Enormous Untapped Efficiency Potential. Available online: https://www.iea.org/topics/buildings (accessed on 6 December 2019).
- IPCC. Climate Change 2014. Mitigation of Climate Change. Contribution of Working Group III to the Fifth Assessment Report of the Intergovernmental Panel on Climate Change; Cambridge University Press: New York, NY, USA, 2014.
- Dixit, M.K.; Fernández-Solís, J.L.; Lavy, S.; Culp, C.H. Need for an embodied energy measurement protocol for buildings: A review paper. Renew. Sustain. Energy Rev. 2012, 16, 3730–3743. [Google Scholar] [CrossRef]
- EU Commission. Directive (EU) 2018/of the European Parliament and of the Council of 30 May 2018 amending Directive 2010/31/EU on the energy performance of buildings and Directive 2012/27/EU on energy efficiency. Off. J. Eur. Union 2018, 156, 75–91. [Google Scholar]
- Wiik, M.K.; Fufa, S.M.; Kristjansdottir, T.; Andresen, I. Lessons learnt from embodied GHG emission calculations in zero emission buildings (ZEBs) from the Norwegian ZEB research centre. Energy Build. 2018, 165, 25–34. [Google Scholar] [CrossRef]
- Weissenberger, M.; Jensch, W.; Lang, W.; Weißenberger, M. The convergence of life cycle assessment and nearly zero-energy buildings: The case of Germany. Energy Build. 2014, 76, 551–557. [Google Scholar] [CrossRef] [Green Version]
- Schlueter, A.; Geyer, P. Linking BIM and Design of Experiments to balance architectural and technical design factors for energy performance. Autom. Constr. 2018, 86, 33–43. [Google Scholar] [CrossRef]
- Deutsche Gesellschaft für Nachhaltiges Bauen (German Sustainable Building Council). Available online: www.dgnb.de (accessed on 24 March 2020).
- LEED Rating System. Available online: www.usgbc.org/leed (accessed on 24 March 2020).
- Röck, M.; Saade, M.R.M.; Balouktsi, M.; Rasmussen, F.N.; Birgisdottir, H.; Frischknecht, R.; Habert, G.; Lützkendorf, T.; Passer, A. Embodied GHG emissions of buildings—The hidden challenge for effective climate change mitigation. Appl. Energy 2020, 258, 114107. [Google Scholar] [CrossRef]
- Röck, M.; Hollberg, A.; Habert, G.; Passer, A. LCA and BIM: Integrated Assessment and Visualization of Building Elements’ Embodied Impacts for Design Guidance in Early Stages. Procedia CIRP 2018, 69, 218–223. [Google Scholar] [CrossRef]
- Antón, L.Á.; Díaz, J. Integration of Life Cycle Assessment in a BIM Environment. Procedia Eng. 2014, 85, 26–32. [Google Scholar] [CrossRef] [Green Version]
- Howell, I. The value information has on decision-making. New Hamps. Bus. Rev. 2016, 38, 19. [Google Scholar]
- de Wilde, P.; Augenbroe, G.; van der Voorden, M. Design analysis integration: Supporting the selection of energy saving building components. Build. Environ. 2002, 37, 807–816. [Google Scholar] [CrossRef]
- Kovacic, I.; Zoller, V. Building life cycle optimization tools for early design phases. Energy 2015, 92, 409–419. [Google Scholar] [CrossRef]
- Knotten, V.; Svalestuen, F.; Hansen, G.K.; Lædre, O. Design Management in the Building Process—A Review of Current Literature. Procedia Econ. Financ. 2015, 21, 120–127. [Google Scholar] [CrossRef] [Green Version]
- Tian, W.; Heo, Y.; de Wilde, P.; Li, Z.; Yan, D.; Park, C.S.; Feng, X.; Augenbroe, G. A review of uncertainty analysis in building energy assessment. Renew. Sustain. Energy Rev. 2018, 93, 285–301. [Google Scholar] [CrossRef] [Green Version]
- Lloyd, S.M.; Ries, R. Characterizing, Propagating, and Analyzing Uncertainty in Life-Cycle Assessment: A Survey of Quantitative Approaches. J. Ind. Ecol. 2007, 11, 161–179. [Google Scholar] [CrossRef]
- Harter, H.; Singh, M.M.; Schneider-Marin, P.; Lang, W.; Geyer, P. Uncertainty Analysis of Life Cycle Energy Assessment in Early Stages of Design. Energy Build. 2019, 208, 109635. [Google Scholar] [CrossRef]
- Huijbregts, M.A.J.; Gilijamse, W.; Ragas, A.M.J.; Reijnders, L. Evaluating Uncertainty in Environmental Life-Cycle Assessment. A Case Study Comparing Two Insulation Options for a Dutch One-Family Dwelling. Environ. Sci. Technol. 2003, 37, 2600–2608. [Google Scholar] [CrossRef]
- Hopfe, C.J. Uncertainty and Sensitivity Analysis in Building Performance Simulation for Decision Support and Design Optimization; Technische Universiteit Eindhoven: Eindhoven, The Netherlands, 2009. [Google Scholar]
- Ivanov, O.L.; Honfi, D.; Stripple, H. Uncertainty and Variation in LCA—Implementation of Probabilistic Methods to Assess Environmental Impacts of Infrastructures; Report TVBK-3070; Lund University: Lund, Sweden, 2018. [Google Scholar]
- Groen, E.A.; Bokkers, E.A.; Heijungs, R.; de Boer, I.J. Methods for global sensitivity analysis in life cycle assessment. Int. J. Life Cycle Assess. 2017, 22, 1125–1137. [Google Scholar] [CrossRef] [Green Version]
- BMI. Oekobaudat. Available online: https://www.oekobaudat.de/datenbank/archiv/oekobaudat-2017-i.html (accessed on 8 December 2019).
- Singh, M.M.; Geyer, P. Information requirements for multi-level-of-development BIM using sensitivity analysis for energy performance. Adv. Eng. Inf. 2020, 43, 101026. [Google Scholar] [CrossRef]
- Soust-Verdaguer, B.; Llatas, C.; García-Martínez, A. Critical review of BIM-based LCA method to buildings. Energy Build. 2017, 136, 110–120. [Google Scholar] [CrossRef]
- Eastman, C.; Teicholz, P.; Sacks, R.; Liston, K. BIM Handbook. A Guide to Building Information Modeling for Owners, Managers, Designers, Engineers, and Contarctors, 2nd ed.; John Wiley & Sons, Ltd.: Hoboken, NJ, USA, 2011. [Google Scholar]
- Hester, J.; Miller, T.R.; Gregory, J.; Kirchain, R. Actionable insights with less data: Guiding early building design decisions with streamlined probabilistic life cycle assessment. Int. J. Life Cycle Assess. 2018, 23, 1903–1915. [Google Scholar] [CrossRef]
- Schneider-Marin, P.; Dotzler, C.; Röger, C. Design2Eco. Lebenszyklusbetrachtung im Planungsprozess von Büro- und Verwaltungsgebäuden: Entscheidungsgrundlagen und Optimierungsmöglichkeiten für frühe Planungsphasen; Lehrstuhl für Energieeffizientes und Nachhaltiges Planen und Bauen: Munich, Germany, 2019; ISBN 3738803238. [Google Scholar]
- DIN Deutsches Institut für Normung e.V. DIN EN ISO 14040 Environmental Management—Life Cycle Assessment—Principles and Framework. (ISO 14040:2006); German and English Version EN ISO 14040:2006; Beuth Verlag: Berlin, Germany, 2009. [Google Scholar] [CrossRef]
- DIN Deutsches Institut für Normung e.V. DIN EN 15978 Nachhaltigkeit von Bauwerken—Bewertung der Umweltbezogenen Qualität von Gebäuden—Berechnungsmethode; Deutsche Fassung EN 15978:2011; Beuth Verlag: Berlin, Germany, 2012. [Google Scholar] [CrossRef]
- BBSR. Nutzungsdauern von Bauteilenfür Lebenszyklusanalysen nach Bewertungssystem Nachhaltiges Bauen (BNB); BBSR: Bonn, Germany, 2017.
- Bahr, C.; Lennerts, K. Lebens- und Nutzungsdauer von Bauteilen. Endbericht; BBSR—Bundesinstitut für Bau-, Stadt- und Raumforschung, BBR—Bundesamt für Bauwesen und Raumordnung: Berlin, Germany, 2010. [Google Scholar]
- DGNB GmbH. ENV1.1 Oekobilanz des Gebaeudes. DGNB System—Kriterienkatalog Gebäude Neubau; DGNB Deutsche Gesellschaft für nachhaltiges Bauen (German Sustainable Building Council): Stuttgart, Germany, 2018. [Google Scholar]
- BMUB. Bilanzierungsregeln für die Erstellung von Ökobilanzen; BMUB: Bonn, Germany, 2015.
- Cabeza, L.F.; Rincón, L.; Vilariño, V.; Pérez, G.; Castell, A. Life cycle assessment (LCA) and life cycle energy analysis (LCEA) of buildings and the building sector: A review. Renew. Sustain. Energy Rev. 2014, 29, 394–416. [Google Scholar] [CrossRef]
- Mattern, H. DFG-Forschergruppe 2363. Available online: https://for2363.blogs.ruhr-uni-bochum.de/de/ (accessed on 24 March 2020).
- Abualdenien, J.; Borrmann, A. A Multi-LOD Model for Visualizing Building Information Models’ Vagueness. In Proceedings of the 12th European Conference on Product and Process Modeling (ECPPM 2018), Copenhagen, Denmark, 12–14 September 2018. [Google Scholar]
- Abualdenien, J.; Borrmann, A. A meta-model approach for formal specification and consistent management of multi-LOD building models. Adv. Eng. Inf. 2019, 40, 135–153. [Google Scholar] [CrossRef] [Green Version]
- Schneider-Marin, P.; Abualdenien, J. A Framework to Facilitate an Interdisciplinary Design Process Using BIM. In Proceedings of the 31. Forum Bauinformatik, Berlin, Germany, 11–13 September 2019; Sternal, M., Ungureanu, L.-C., Böger, L., Bindal-Gutsche, C., Eds.; Universitätsverlag der TU Berlin: Berlin, Germany, 2019; pp. 67–74, ISBN 978-3-7983-3104-4. [Google Scholar]
- BIMForum. Level of Development Specification. Part I and Commentary. 2019. Available online: https://bimforum.org/wp-content/uploads/2019/04/LOD-Spec-2019-Part-I-and-Guide-2019-04-29.pdf (accessed on 14 March 2020).
- Kristensen, M.H.; Petersen, S. Choosing the appropriate sensitivity analysis method for building energy model-based investigations. Energy Build. 2016, 130, 166–176. [Google Scholar] [CrossRef]
- Geyer, S.; Papaioannou, I.; Uribe, F. ERADist Probability Distribution Class; Engineering Risk Analysis Group, Technische Universität München: München, Germany, 2019. [Google Scholar]
- Raskin, V.; Taylor, J.M. Fuzziness, Uncertainty, Vagueness, Possibility, and Probability in Natural Language. In Proceedings of the 2014 IEEE Conference on Norbert Wiener in the 21st Century (21CW), Boston, MA, USA, 24–26 June 2014; Gibbs, M., Adamson, G., Eds.; IEEE: Piscataway, NJ, USA, 2014; pp. 1–6, ISBN 978-1-4799-4562-7. [Google Scholar]
- Hawer, S.; Schönmann, A.; Reinhart, G. Guideline for the Classification and Modelling of Uncertainty and Fuzziness. Procedia CIRP 2018, 67, 52–57. [Google Scholar] [CrossRef]
- Klir, G.J. Where do we stand on measures of uncertainty, ambiguity, fuzziness, and the like? Fuzzy Sets Syst. 1987, 24, 141–160. [Google Scholar] [CrossRef]
- Rasmussen, F.N.; Malmqvist, T.; Moncaster, A.; Wiberg, A.H.; Birgisdóttir, H. Analysing methodological choices in calculations of embodied energy and GHG emissions from buildings. Energy Build. 2018, 158, 1487–1498. [Google Scholar] [CrossRef]
- Tecchio, P.; Gregory, J.; Ghattas, R.; Kirchain, R. Structured Under-Specification of Life Cycle Impact Assessment Data for Building Assemblies. J. Ind. Ecol. 2019, 23, 319–334. [Google Scholar] [CrossRef] [Green Version]
- Tecchio, P.; Gregory, J.; Olivetti, E.; Ghattas, R.; Kirchain, R. Streamlining the Life Cycle Assessment of Buildings by Structured Under-Specification and Probabilistic Triage. J. Ind. Ecol. 2019, 23, 268–279. [Google Scholar] [CrossRef]
- BBSR—Bundesinstitut für Bau-, Stadt- und Raumplanung. eLCA. Available online: www.bauteileditor.de (accessed on 24 March 2020).
- Energieeinsparverordnung—Verordnung über energiesparenden Wärmeschutz und energiesparende Anlagentechnik bei Gebäuden (EnEV); Deutsche Bundesregierung (German Federal Government): Berlin, Germany, 2013.
- Saade, M.R.M.; Guest, G.; Amor, B. Comparative whole building LCAs: How far are our expectations from the documented evidence? Build. Environ. 2020, 167, 106449. [Google Scholar] [CrossRef]
- Schneider-Marin, P.; Dotzler, C.; Röger, C.; Lang, W.; Glöggler, J.; Meier, K.; Runkel, S. Design2Eco|Schlussbericht. Lebenszyklusbetrachtung im Planungsprozess von Büro- und Verwaltungsgebäuden—Entscheidungsgrundlagen und Optimierungsmöglichkeiten für frühe Planungsphasen; Abschlussbericht, Forschungsinitiative Zukunft Bau, Band F 3137; FraunhoferIRB Verlag: Stuttgart, Germany, 2019. [Google Scholar]
- Hildebrand, L. Strategic Investment of Embodied Energy during the Architectural Planning Process; TU Delft: Delft, The Netherlands, 2014; ISBN 978-94-6186-326-3. [Google Scholar]
- Hollberg, A.; Lützkendorf, T.; Habert, G. Top-down or bottom-up?—How environmental benchmarks can support the design process. Build. Environ. 2019, 153, 148–157. [Google Scholar] [CrossRef]
- Röck, M.; Hollberg, A.; Habert, G.; Passer, A. LCA and BIM: Visualization of environmental potentials in building construction at early design stages. Build. Environ. 2018, 140, 153–161. [Google Scholar] [CrossRef]
Figure 1.
Workflow for embedded energy and input calculation with uncertainty.

Figure 2.
Input uncertainty (vagueness) in parameter groups and resulting uncertainty contribution for a rectangular building shape and reinforced concrete structure; exact numbers are listed in Appendix A, Table A1.
Figure 2.
Input uncertainty (vagueness) in parameter groups and resulting uncertainty contribution for a rectangular building shape and reinforced concrete structure; exact numbers are listed in Appendix A, Table A1.

Figure 3.
Box plots of sample building contributions and uncertainties for a reinforced concrete building: global warming potential (GWP), renewable primary energy (PERT), and non-renewable primary energy (PENRT). The mean is represented by a horizontal line, the interquartile range by a thick line, min and max are connected by a thin line and outliers are shown as dotted lines.

Figure 4.
Boxplots of comparison of total values for wood and concrete construction for global warming potential (GWP), renewable primary energy (PERT), and non-renewable primary energy (PENRT). The mean is represented by a horizontal line, the interquartile range by a thick line, min and max are connected by a thin line and outliers are shown as dotted lines.

Figure 5.
Boxplots of contribution and overall values of wood structure for BDL2 for global warming potential (GWP), renewable primary energy (PERT), and non-renewable primary energy (PENRT). The mean is represented by a horizontal line, the interquartile range by a thick line, min and max are connected by a thin line and outliers are shown as dotted lines.

Table 1.
Building parts included and reference service life (RSL) considered.
| Building Part | Structure | Insulation | Windows | Internal |
|---|---|---|---|---|
| Elements included | Ground slab | Exterior insulation: | Frames | Interior walls |
| Floor slabs | Ground slab | |||
| Exterior walls | Exterior walls | (Triple) glazing | ||
| Roof slab | Roof | |||
| RSL (years) | >50 | 40 | 40 | 20 |
Table 2.
Input parameter groups.
| Geometry (Areas) 1 | Interior 2 | Windows 2 | Technical Specifications 3 |
|---|---|---|---|
| Ground slab | Interior walls (%) | WW-ratio | u-values |
| Floor slabs | - | - | Construction thicknesses |
| Exterior walls | - | - | Reinforcement amount |
| Roof | - | - | - |
1 Extracted from building information modeling (BIM) model (IFC); 2 Additional designer input (experience values); 3 Additional consultant input (experience values).
Table 3.
Input values representative of the sample building.
| Parameter Group | Parameter | Mean Value | Vagueness at BDL2 |
|---|---|---|---|
| Geometry | Ground slab area | 405 m2 | ±10% |
| Floor slab area | 810 m2 | ±10% | |
| Exterior wall area (total) | 840 m2 | ±10% | |
| Roof area | 405 m2 | ±10% | |
| Interior | Interior Walls | 6% | ±25% |
| Windows | WW-ratio | 30% | ±25% |
| Technical Specifications | u-value (ground slab) | 0.19 W/m2 × K | ±25% |
| u-value (ext. wall) | 0.18 W/m2 × K | ±25% | |
| u-value (roof) | 0.15 W/m2 × K | ±25% | |
| Construction thickness (ground slab) | 0.35 m | ±25% | |
| Construction thickness (ext. wall) | 0.20 m | ±25% | |
| Construction thickness (floor slabs) | 0.25 m | ±25% | |
| Construction thickness (roof slab) | 0.25 m | ±25% | |
| reinforcement | 140 kg/m3 | ±25% |
Table 4.
Comparison of life cycle assessment (LCA) results of probabilistic, simplified and detailed calculation for the case study.
Table 4.
Comparison of life cycle assessment (LCA) results of probabilistic, simplified and detailed calculation for the case study.
| LCA | GWP [kg CO2-eq.] | PERT [MJ] | PENRT [MJ] | ||||
|---|---|---|---|---|---|---|---|
| Detailed | TOTAL | 470,482 (100%) | 538,084 (100%) | 5,229,523 (100%) | |||
| structure | 45% | 212,979 | 40% | 217,507 | 34% | 1,785,981 | |
| insulation | 16% | 74,065 | 10% | 51,446 | 21% | 1,118,043 | |
| windows | 20% | 94,727 | 16% | 84,939 | 21% | 1,101,638 | |
| internal | 19% | 88,710 | 34% | 184,192 | 23% | 1,223,861 | |
| Simplified | TOTAL | 358,621 (76%) | 524,702 (98%) | 3,756,157 (73%) | |||
| structure | 49% (+4%) | 177,351 | 37% (−3%) | 193,148 | 36% (+2%) | 1,368,205 | |
| insulation | 16% (±0%) | 50,146 | 11% (+1%) | 60,055 | 18% (−3%) | 674,660 | |
| windows | 23% (+3%) | 81,115 | 11% (−5%) | 60,239 | 25% (+4%) | 953,488 | |
| internal | 12% (−7%) | 42,497 | 40% (+6%) | 211,260 | 20% (−3%) | 759,804 | |
| Probabilistic (mean, BDL4) | TOTAL | 336,788 (73%) | 517,086 (96%) | 3,619,140 (70%) | |||
| structure | 50% (+5%) | 167,852 | 37% (−3%) | 189,709 | 38% (+4%) | 1,361,042 | |
| insulation | 13% (−3%) | 45,252 | 9% (−1%) | 46,475 | 14% (−7%) | 524,675 | |
| windows | 23% (+3%) | 76,742 | 11% (−5%) | 56,994 | 25% (+4%) | 902,003 | |
| internal | 14% (−5%) | 46,943 | 43% (+9%) | 223,908 | 23% (±0%) | 831,419 | |
© 2020 by the authors. Licensee MDPI, Basel, Switzerland. This article is an open access article distributed under the terms and conditions of the Creative Commons Attribution (CC BY) license (http://creativecommons.org/licenses/by/4.0/).
Share and Cite
MDPI and ACS Style
Schneider-Marin, P.; Harter, H.; Tkachuk, K.; Lang, W. Uncertainty Analysis of Embedded Energy and Greenhouse Gas Emissions Using BIM in Early Design Stages. Sustainability 2020, 12, 2633. https://doi.org/10.3390/su12072633
AMA Style
Schneider-Marin P, Harter H, Tkachuk K, Lang W. Uncertainty Analysis of Embedded Energy and Greenhouse Gas Emissions Using BIM in Early Design Stages. Sustainability. 2020; 12(7):2633. https://doi.org/10.3390/su12072633
Chicago/Turabian StyleSchneider-Marin, Patricia, Hannes Harter, Konstantin Tkachuk, and Werner Lang. 2020. "Uncertainty Analysis of Embedded Energy and Greenhouse Gas Emissions Using BIM in Early Design Stages" Sustainability 12, no. 7: 2633. https://doi.org/10.3390/su12072633
Note that from the first issue of 2016, this journal uses article numbers instead of page numbers. See further details here.