Abstract
A life cycle analysis was performed for the assessment of the environmental performances of three existing Italian power plants of comparable nominal power operating with different sources of renewable energy: Geothermal, solar, and wind. Primary data were used for building the life cycle inventories. The results are characterized by employing a wide portfolio of environmental indicators employing the ReCiPe 2016 and the ILCD 2011 Midpoint+ methods; normalization and weighting are also applied using the ReCiPe 2016 method at the endpoint level. The midpoint results demonstrate a good eco-profile of the geothermal power plant compared to other renewable energy systems and a definite step forward over the performance of the national energy mix. The Eco-Point single score calculation showed that wind energy is the best technology with a value of 0.0012 Eco-points/kWh, a result in line with previously documented life cycle analysis studies. Nevertheless, the geothermal power plant achieved a value of 0.0177 Eco-points/kWh which is close to that calculated for the photovoltaic plant (0.0087 Eco-points/kWh) and much lower than the national energy mix one (0.1240 Eco-points/kWh). Also, a scenario analysis allowed for a critical discussion about potential improvements to the environmental performance of the geothermal power plant.
1. Introduction
Geothermal energy is an important energy resource, largely contributing to limiting the use of fossil fuels, for both electricity and direct uses (mainly heat for district heating). The world installed electrical capacity is over 12 × 103 MWe [1,2,3,4], with the provision of direct heat of the order of 165 × 103 GWh/yr [5]. The geothermal resource is well distributed around the world [6,7], and several locations are favored by the presence of hot fluid resources (hydrothermal systems). Recently, the feasibility of enhanced geothermal systems (EGS) has been demonstrated and this technology will allow even more widespread use of the earth’s inner heat [8,9]. Experience has demonstrated that geothermal energy can be considered renewable if the resource is correctly managed [10,11], if the sizing of the conversion/utilization plants is compatible with that of the hydrothermal reservoir, and if reinjection of the fluids is practiced.
Italy has a long tradition of geothermal energy utilization [12], with nearly 1 × 10³ MWe installed in two areas of the Tuscany region (Larderello/Travale and Monte Amiata) operated by Enel Green Power. Specifically, the plants of the Larderello/Travale region (about 700 MWe) have been in industrial operation for more than 60 years, and this activity has considerably contributed to the local economic growth. An extensive grid exists for the management of fluids, including primary supply to local district heating as well as resource and reinjection fluid distribution. All power plants are equipped with effective emissions treatment equipment, which removes the greatest part of hydrogen sulfide (H2S) and mercury (Hg) though the application of proprietary technology (AMIS® process [13,14]). The geothermal power plants located in Tuscany have demonstrated high reliability, with equivalent operation time exceeding 7.5 × 10³ hrs/yr and with a productivity of more than 6.2 × 10³ GWh/yr [15].
Solar electricity is mainly produced by photovoltaic (PV) power plants. Over the world, the power installed exceeds 500 GWe [16]. Italy represents one of the main players in Europe with more than 20 GWe installed and productivity exceeding 24 × 103 GWh/yr [15]. Most of the PV plants in Italy are small (<50 kWe); however, a significant share of production is done by 6% of the power plants with size >50 kWe. The productivity data show that the utilization factor of solar PV is much smaller than for geothermal, with an equivalent full-load operability of about 1.2 × 10³ hrs/yr. This is due to the periodic cycle of solar radiation (daily and seasonal).
Wind energy has experienced a strong increase with specific reference to Europe (180 GWe installed with a productivity of about 362 × 103 GWh/yr [16]). In Italy more than 10 GWe are installed (mainly in the south), with productivity exceeding 17 × 103 GWh/yr [15]. The equivalent full-load operability is typically 2000 hrs/yr, as the wind resource is highly stochastic.
The lower operability identifies solar PV and wind as variable renewable energy (VREs), raising strong challenges to the grid infrastructure (solar being today more predictable and favored in this sense). Higher market penetration of renewable energy sources (RES) will entail optimized strategies for production/load matching, and the development of extensive energy storage infrastructures supporting VREs. These latter will entail additional costs and environmental impacts, as well documented by the scientific literature about storage systems. Geothermal energy, which is typically employed as a baseload energy resource, is highly complementary to VREs and can represent very valuable support, both in countries with limited electric grid infrastructure and in developed countries committed to ever-higher market penetration of electricity compared to other energy vectors [17,18].
This work arises from the recognition that completely clean energy does not exist: The only clean energy is the one we do not need to use, namely that saved with efficiency actions. However, in an environmentally sustainable perspective RES are better than fossil fuels, but even in this case choices should be based on a rigorous comparison of the environmental advantages and drawbacks. The life cycle analysis (LCA) approach is an optimum tool to make this comparison.
The goal of this study is to compare the environmental performances of three power plants based respectively on geothermal, solar, and wind energy through the LCA methodology and grounding on robust and reliable primary data.
2. Materials and Method
2.1. Life Cycle Analysis (LCA)
LCA is a method to evaluate the environmental load associated with a product, process, or activity. LCA allows quantifying the used amount of energy and materials and of emissions and waste released in the environment, allowing for the evaluation of the associated potential impacts. The assessment is performed over the entire life cycle of the product, process, or activity covering extraction and processing of raw materials; manufacturing, transportation, and distribution; use, re-use, maintenance; recycling, and final disposal. The results of LCA can be expressed via a large number of environmental indicators and, generally, several impact categories are used to circumspectly detect the full range of ecological burdens associated with the investigated process or activity over the three environmental compartments (atmosphere, soil, and water), thus aiming at avoiding burden shifting. The LCA methodology is regulated according to the general guidelines described in the International Standard Organization (ISO) series 14040 [19,20] and consists of four phases:
- Goal and scope definition: In this phase, the goal of the study, the system boundaries, the quality requisites of the data sources are described, and the functional unit of the analysis is specified.
- Life cycle inventory analysis (LCI): The purpose of this phase is to collect the input/output data pertinent to the system studied; generally robust and reliable LCIs are built on primary data, that is to say specific data that highly characterize the system under study.
- Life cycle impact assessment (LCIA): This phase evaluates the significant potential environmental impacts using the LCI results; the process involves associating inventory data with specific environmental impact categories and the calculation of indicator values using accepted characterization factors.
- Life cycle interpretation: It is the final phase of an LCA study in which the results of the LCI and LCIA steps are presented and discussed; interpretation includes conclusions and recommendations adapted to the goal and scope of the study.
LCA was born as a detailed and quantitative approach for the evaluation of environmental sustainability [21]. The regulatory approach described in the ISO standards and the more completely elaborated ILCD Handbook guidelines [22] claims for the development of an LCA study until the characterization of the environmental impacts at a midpoint level. With this approach, the LCIA method looks at the impact earlier along the cause–effect chain of the environmental mechanism, and can refer to a relevant number of impact categories characterized by a low uncertainty but, on the other hand, is difficult to interpret. In principle, it represents a good approach for the characterization of the eco-profile of the product or activity under exam to use several wide-scope LCIA methods and check if findings are consistent in all of them. If so, it is possible to claim that findings appear robust. But when this is not the case, the LCA practitioner might have to delve into the particularities of the LCIA methods and find out why the results are dissimilar, which can be a good learning experience about the characteristics of the applied LCIA methods.
The environmental evaluation at the endpoint level is a non-mandatory part of LCA, which includes normalization and weighting steps that allow expressing the results referring to a limited number of damage categories, typically resources availability, human health, and ecosystem quality. Endpoint results provide insight on the environmental impact at the end of this cause–effect chain of the environmental mechanism, thus with larger uncertainty. If interpretation at this level provides a more limited amount of details, it is recognized that it is more suitable for the presentation of results to non-technical audiences. The various LCIA methods apply different impact category grouping, normalization, and weighting factors, thus it is necessarily recommended to refer to the same methodology when comparing different technologies dealing with the same product or process.
Energy conversion and utilization is one of the most famous and important fields of application of LCA calculations. LCA indeed offers a powerful approach to analyze systems overarching the complete life cycle of a system (from cradle to grave) which is necessary when considering the substitution of fossil fuels with renewables. When applying LCA to energy conversion systems, for fossil fuel-based technologies it is common to find high impacts connected to the use of fossil resources in the operational phase [23,24,25]; on the other hand, RES, which minimizes the use of consumables such as fossil fuel, entail a consistent use of materials because of the diffuse nature of renewable energy, some of which are rare, or whose extraction and/or production entails direct or indirect negative effects on the environment. In general, RES scores better environmental performance than fossil fuel systems in most impact categories. However, these outcomes should be evaluated, validated, and compared among different RES.
Several LCA studies are available on solar PV energy conversion systems [26,27,28,29,30,31,32,33,34,35]; in general, the results indicate that a significant impact is coming from the manufacture of the PV modules, with the current silicon technology performing better than cadmium telluride, notwithstanding substantial advantages for thin-film manufacturing [36]. A significant fraction contribution to the overall eco-profile (20–30%) comes from the structural materials and glazing. The environmental footprint is lower than the best fossil fuel-based technologies in most categories, with a weighted score typically 4–8 times smaller. The relatively standard production process has led to the development of accepted guidelines [37], which have determined an improved homogeneity in the results and better comparability of the studies. Wind energy has also attracted several LCA studies [38,39,40,41]: In comparison with fossil fuel-based systems, the environmental footprint is very limited, and only a restricted number of categories is usually involved (global warming potential, GWP; acidification potential, AP; eutrophication potential, EP; cumulative energy demand, CED). In the field of wind energy, no specific LCA guidelines are available; however, significant studies have been published by leading manufacturers such as Vestas [42]; the results have been cross-checked by researchers and substantial agreement is documented [43,44,45,46].
Geothermal power plants have raised the attention of local and national policymakers in terms of their environmental performances and sustainability, and the comparison with other RES has then become necessary. Several studies on the application of LCA to geothermal power systems are available in the literature [47,48,49,50,51,52,53,54,55,56,57,58]; however, most studies are only focused on GWP, and there is a considerable spread in the results.
Examples of comparison of RES options are documented in the technical literature [59,60,61,62]; however, they mostly rely on previously published LCA studies and, in most cases, on the use of literature data. There is a substantial lack of primary data (produced by the plant owner or operator), which stand as more reliable as the source of the information can be completely tracked. Utilities such as Enel Green Power have a good opportunity to access these primary data (often gathered with the purpose of economic analyses, or in case of the commitment of construction works or trusting of maintenance services), and to use them to document the environmental quality of their product (electricity). This represents a key passage in the environmental evaluation, both in terms of company, services, and products (possibly leading to an ECO-Label), and is also a motivation behind the present study.
The case studies described in the following section were analyzed using the OpenLCA 1.10 software package [63]; for secondary data, the Ecoinvent database 3.6 was adopted [64,65]. The system modeling approach employed is cradle to grave. The functional unit was set as 1 kWh of electricity delivered to the grid, assuming a lifetime of 30 years for all the power plant solutions investigated. The system boundaries were defined to include the whole life cycle of the system. Operation and maintenance (including replacement of major equipment) were modeled following the experience of Enel Green Power as power plant manager.
The assessment was performed comparing the ReCiPe 2016 [66] and the ILCD 2011 Midpoint+ [67] LCIA methods both employed for the characterization of potential impact at midpoint level. Normalization and weighting, applying an hierarchist (H) cultural perspective, were applied to the ReCiPe 2016 results to determine the systems eco-profiles at the endpoint level (with weighted results expressed in Eco-points).
All data gathered in the LCI are primary data provided by Enel Green Power resulting from checked information about materials employed for construction. Secondary data were used for common materials (e.g., steel, concrete, copper, plastics, etc.) and upstream processes (e.g., transport). The LCI also reports data for operation and maintenance, including replacement of equipment, consumables, etc.
2.2. Case Studies
The case studies here considered represent three Italian power plants of similar nominal capacity (about 20 MWe): The geothermal power plant Chiusdino 1, the wind farm in Pietragalla, and the solar photovoltaic power plant Serre Persano Difesa Servizi (DS).
2.2.1. Chiusdino Geothermal Power Plant
Chiusdino 1 is a standard Enel Green Power geothermal power plant, with a nominal capacity of 20 MWe (Figure 1). The live steam (130 t/h; 14,5 bar, 196 °C) is provided by five production wells located close to the power plant or in the neighborhood (Table 1). The plant was built in 2011 and has recently been connected to a district heating network, with a planned capacity of 7 MWth of heat.
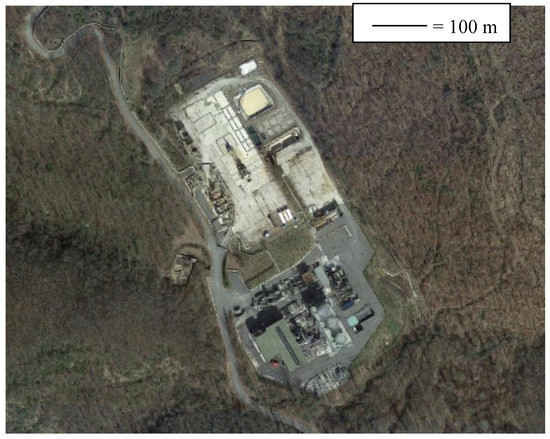
Figure 1.
Google Earth aerial view of Chiusdino power Plant (location: 43°09’37.0” N; 11°03’49.9” E); bottom: Power plant; upper: Travale wellhead platform.

Table 1.
Details of production wells, Chiusdino 1 Power plant.
The Chiusdino 1 power plant is equipped with an AMIS® emissions treatment system, which removes H2S and Hg with measured efficiencies of 99.8% and 82.2%, respectively. A soda solution is used for acid gas treatment. The whole liquid condensate of Chiusdino 1 is reinjected using a complex network of pipelines connecting to the Larderello reinjection sites, with an overall estimated length of about 20 km. Details on the pollutant streams emitted, according to measured values certified by the regional authority for environmental protection (ARPAT), are provided in Table 2.
Table 2.
Emissions of the Chiusdino 1 Power plant.
For Chiusdino 1, three scenarios were examined to consider the effects of emissions treatment: (i) The real scenario “GEO,” featuring the AMIS® process; (ii) the hypothetical scenario “GEO_NA,” representing the power plant as if no AMIS® process were operating; and (iii) the “GEO_AS,” featuring the emissions treatment plus a 40% substitution of natural emissions (i.e., 40% of the power plant emissions would anyway reach the atmosphere as natural emissions).
The Chiusdino 1 power plant is operated at full load, with a demonstrated operability of 7560 hrs/yr. This leads to very high productivity of about 151,200 MWh/yr. Appendix A shows the LCI and technical details for the Chiusdino 1 power plant.
2.2.2. Pietragalla Wind Farm
The Pietragalla wind farm is composed of nine horizontal axis Repower MM92 wind turbines, each having a nominal rating of 2 MWe (Figure 2). The wind farm has been operational since 2011. Every wind turbine has a rotor diameter of 92.5 m and is installed on top of a pre-assembled tower (three pieces) with an overall height of 100 m. The tower, nacelle, and rotor require substantial construction work for the foundations; moreover, the erection (and maintenance) of the machine requires the construction of a platform with suitable extension and load-supporting capability. The installation site required only minor works for viability. The operational data over the recent three years period (2016–2018) indicate productivity of 42,069 MWh/yr, equivalent to full-load operability of 2337 hrs/yr (a very high value for typical Italian wind energy installations). Appendix B shows the LCI and technical details for the Pietragalla wind farm.
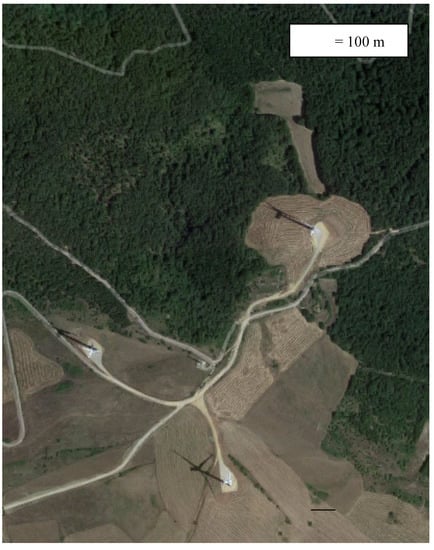
Figure 2.
Google Earth aerial view of Pietragalla wind power plant; three of the nine turbines are visualized (location: 40°43′31.63” N; 15°49′41.85” E).
2.2.3. Serre Persano Difesa Servizi (DS) Photovoltaic Solar Plant
The Serre Persano DS PV solar plant, feature a peak power level of 21 MWe and was built by Enel Green Power in the period 2011–2013. The surface covered is 770,000 m2, with two fields connected to the same electrical works station (Figure 3). On the whole, the PV plant has 157,556 modules, arranged in 11,254 strings with 24 inverters. Table 3 resumes the features of the two PV fields.
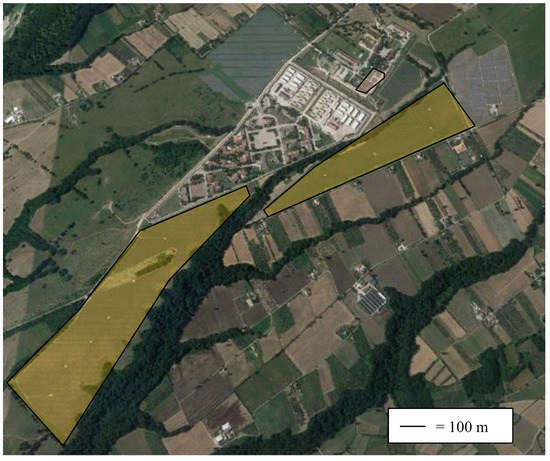
Figure 3.
Google Earth aerial view of Serre Persano DS Photovoltaic (PV) plant; shaded areas highlight the PV installations (location: 40°34’08.5” N 15°06’10.5” E).
Table 3.
Summary specifications of the Serre Persano DS Photovoltaic (PV) fields.
Including the evaluation of the decay in productivity with aging, the average productivity of the Serre Persano DS solar PV plant was evaluated at 24,768 MWh/yr, with an equivalent full-load operability of about 1179 hrs/yr (a good performance for a plant built during 2011–2013 in Southern Italy). Appendix C shows the LCI and technical details for the Serre Persano DS solar PV plant.
3. Results and Discussion
3.1. Life Cycle Impact Assessment at Midpoint Level: ILCD 2011 Midpoint+ versus ReCiPe 2016
The purpose of this section is to show the results of the midpoint impact categories and to analyze them so that a consistent choice can be made about the impact assessment methodology (ILCD 2011 Midpoint+ or ReCiPe 2016). The results are shown for the three cases referred to as geothermal (GEO, GEO_AS, GEO_NA) and for the solar photovoltaic (PV) and wind (W) reference cases. Furthermore, the comparison with the national electricity mix (NEM) is performed referring to the ecoinvent process that models the Italian energy mix based on Eurostat data for the year 2014 (renewable energies: 43.1%; coal: 19.0%; natural gas: 28.9%; oil: 1.0%; nuclear-imported: 4.6%; other sources: 3.7%). The detailed results of the midpoint impact analysis are reported in Appendix D.
A graphical comparison among ILCD 2011 Midpoint+ and ReCiPe 2016 results calculated at midpoint level is shown in Figure 4, Figure 5, Figure 6, Figure 7 and Figure 8 for the most relevant categories using color-coded bars: The best-performing category is shown with a green bar; a red or a yellow bar identifies the worst or the second-worst technology; grey bars represent intermediate results.
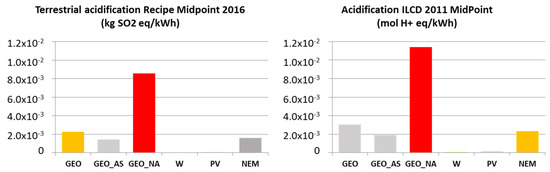
Figure 4.
Bar diagrams of ILCD 2011 Midpoint+ and Recipe 2016 impact assessment at midpoint level: Acidification.
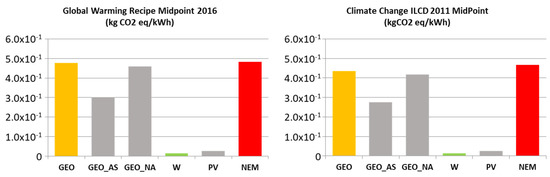
Figure 5.
Bar diagrams of ILCD 2011 Midpoint+ and ReCiPe 2016 impact assessment at midpoint level: Climate change.
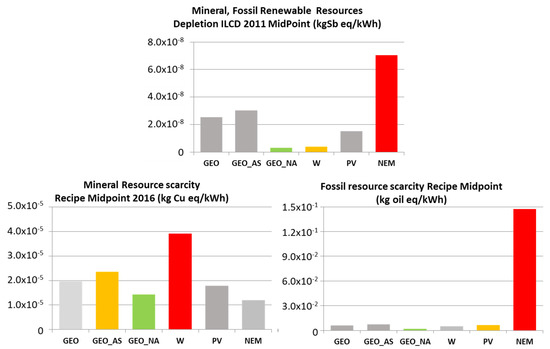
Figure 6.
Bar diagrams of ILCD 2011 Midpoint+ and ReCiPe 2016 impact assessment at midpoint level: Resource depletion.
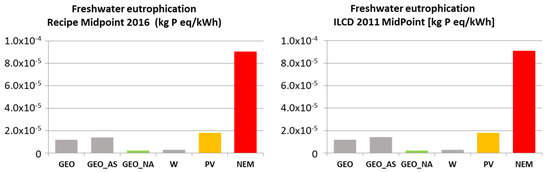
Figure 7.
Bar diagrams of ILCD 2011 Midpoint+ and ReCiPe 2016 impact assessment at midpoint level: Freshwater eutrophication.
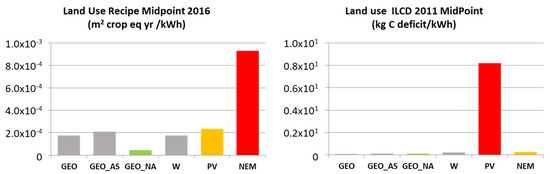
Figure 8.
Bar diagrams of ILCD 2011 Midpoint+ and ReCiPe 2016 impact assessment at midpoint level: Land use.
Although ILCD 2011 Midpoint+ and ReCiPe 2016 methods are based on different calculation methodologies for some environmental impact, the ranking between RES technologies is similar (the best and worst technology are, in general, correctly identified for the main categories). An exception is the land use category (Figure 8) for which the ILCD 2011 Midpoint+ method assigns a large impact in the case of PV because of relevant soil preparation and excavation operations. Another relevant case is the high score assigned to W in the mineral resource scarcity category for the ReCiPe 2016 method (Figure 6), which is motivated by the use of rare mineral resources (lanthanides) in the generator for wind turbines. ReCiPe 2016 is also more effective in the assessment of land use because it refers directly to equivalents of squared meters of crops subtracted per year; in this case, the score is largest for the NEM, followed by PV (Figure 8). The ILCD 2011 Midpoint+ (and its more recent development into the Environmental Footprint (EF) method [68,69]) is more sound scientifically and pays strong attention to eco-toxicity and human health, but ReCiPe 2016 seems, at present, more suitable for application to energy conversion (with specific reference to the urge for substituting fossil with renewable resources).
The results of the comparison are synthesized graphically (impact category indicators) in the spider-net diagrams (Figure 9 for ILCD Midpoint 2011+ and in Figure 10 for ReCiPe 2016).
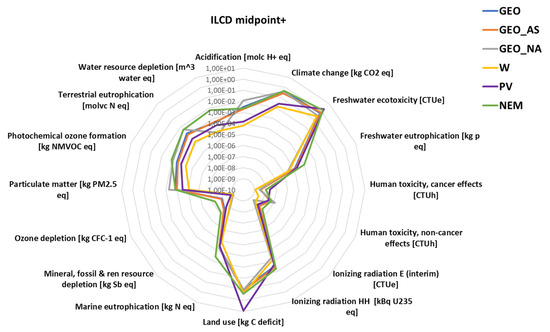
Figure 9.
Spider net diagram of ILCD 2011 Midpoint+ impact assessment results (log scales).
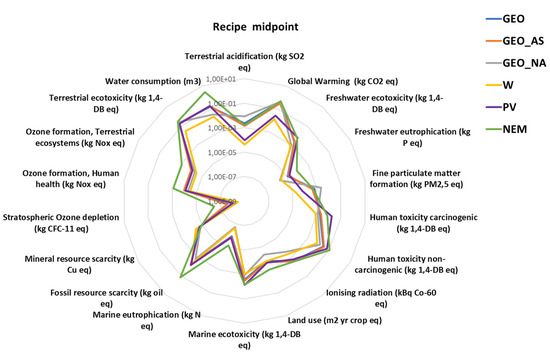
Figure 10.
Spider net diagram of ReCiPe 2016 Midpoint+ impact assessment results (log scales).
As it emerges from the synthetic representation shown in Figure 9 and Figure 10, the ILCD 2011 Midpoint+ and Recipe 2016 methods—apart from using different reference units for similar categories—are in qualitative agreement. On the whole, the ReCiPe 2016 method appears as a preferable approach for qualitative comparison of RES with the conventional energy mix, as it presents a more balanced representation of the impacts in different categories at the midpoint level. The ILCD 2011 Midpoint+ method pays special attention to toxicity, radiation, and human health effects while, for example, introduces some bias representing the land use impact category in terms of equivalent carbon deficit (which penalizes the PV technology in this analysis). Moreover, the ILCD 2011 Midpoint+ method clusters mineral, fossil, and renewable resources into one category, thereby hindering the direct comparison with conventional energy conversion systems which relies heavily on the operation phase on fossil resources. ReCiPe 2016 accounts separately mineral and fossil resource consumption, thereby allowing RES to emerge clearly in terms of environmental performances. For the matters above, the ReCiPe 2016 method appears to be a more suitable impact assessment methodology at the midpoint characterization level for the comparison of the environmental performances of RES.
Finally, a contribution analysis of the midpoint impact categories for the ReCiPe 2016 method is presented in Figure 11. The contribution analysis shows that the relative impacts for each of the energy technologies considered take place in different categories: For example, for geothermal the dominant categories are terrestrial acidification and fine particulate matter formation (for the scenario of power plants not equipped with emissions treatment, GEO_NA), water consumption, marine and freshwater eco-toxicity. Wind and solar PV score high, in relative terms, for marine and terrestrial eco-toxicity. The NEM scenario produces large impacts for water consumption, for the marine and freshwater environments, for land use, and fossil resource scarcity.
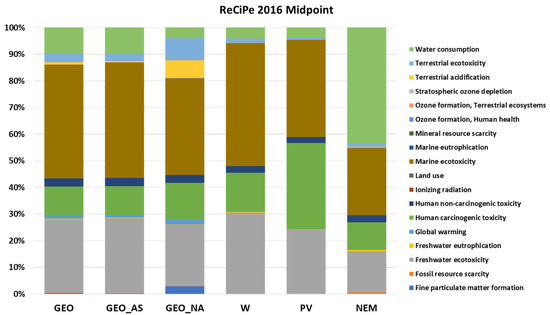
Figure 11.
Contribution analysis of the ReCiPe 2016 method at midpoint level.
3.2. Impact Assessment at the Endpoint Level: ReCiPe 2016 Normalized and Weighted Results
In this section results calculated at the endpoint level are presented. For the reasons outlined in Section 3, supported by the better suitability of the method in the field of energy conversion (with specific reference to a transition from fossil to renewable resources), ReCiPe 2016 is applied in the following for normalization and weighting calculations. These operations allow grouping the impact assessment in three areas of protection: Ecosystem quality, human health, and resources. Normalization for ReCiPe is done referring to the European population and leads to the calculation of results in function of (i) disability-adjusted life years (DALY) unit for human health, representing the years that are lost or that a person is disabled due to a disease or accident; (ii) species per year (species*yr) unit for ecosystem quality, representing the local species loss integrated over time; (iii) dollar unit (USD 2013) for resources scarcity, representing the extra costs involved for future mineral and fossil resource extraction. The overall results of the environmental impact evaluation at the endpoint level are summarized in Table 4; results are also illustrated graphically in Figure 12.
Table 4.
ReCiPe 2016 (H) normalized results at the endpoint level.
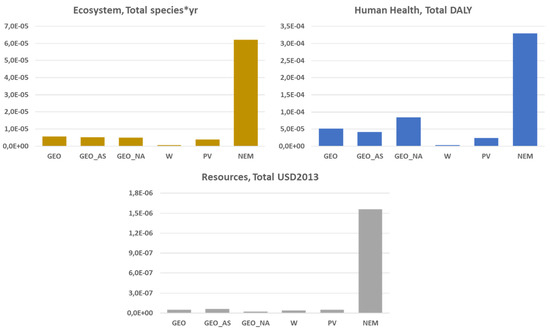
Figure 12.
Normalized results of the ReCiPe 2016 (H) method at the endpoint level.
In Figure 13 the contribution analysis of the ReCiPe 2016 normalized results at the endpoint level is shown for all the case studies. According to the midpoint-to-endpoint values of the scaling factor implemented for the method [66], the human health damage category dominates the eco-profiles of all the scenarios with a detectable contribution of the resources damage category that increases going from PV to NEM and W.
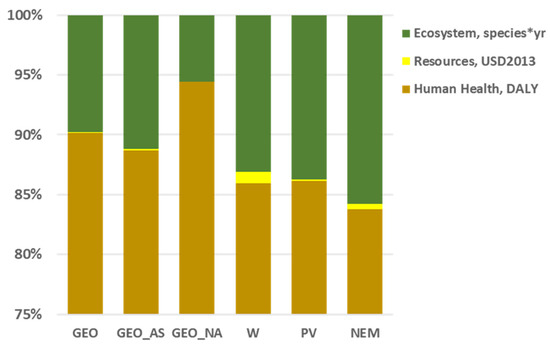
Figure 13.
Contribution analysis of ReCiPe 2016 (H) normalized results at the endpoint level.
The weighting step in LCA allows calculating a synthetic indicator (expressed in Eco-points) and, thus, to calculate a global indicator of environmental performance, which can be used for overall comparison among the different technologies. In this study, the hierarchist (H) cultural perspective was assumed to weigh the normalized results of the ReCiPe 2016 method at the endpoint level; this involves weighting ecosystem damages by a factor 400, while human health and resource damages are weighted by a factor of 300. This perspective is a common assumption in the field of energy conversion systems. The ReCiPe 2016 weighted results are shown in Figure 14 in terms of Eco-points referred to the functional unit (1 kWh of electricity).
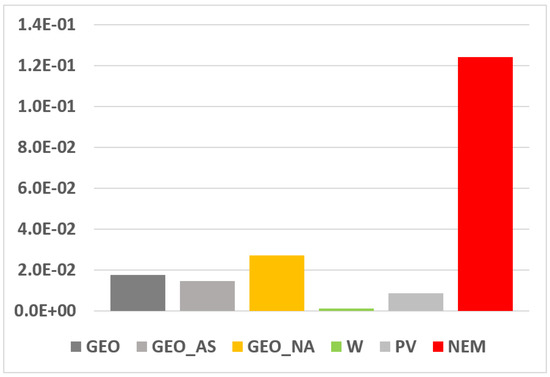
Figure 14.
Weighted results calculated with the ReCiPe 2016 method (Eco-points/kWh).
4. Conclusions
Geothermal energy conversion was benchmarked by LCA methodology in comparison with other RES and with the Italian national energy mix. Calculations were performed based on specific power plant info recovered from primary data, taking advantage of life cycle inventories available through the plant operator (Enel Green Power). Three options were considered for geothermal energy: The current power plant with AMIS® emissions treatment (GEO); the same system without emissions treatment (GEO_NA); and a hypothetical case where 40% of the emissions could be considered a substitute of the natural emissions (GEO_AS). The GEO cases were compared with a wind energy farm (W) and with a large solar PV power plant (PV) having a similar capacity.
Midpoint calculations were performed comparing the ILCD 2011 Midpoint+ and ReCiPe 2016 methods. The results were similar in terms of identifying the most impacting categories: Terrestrial acidification, human toxicity, marine and freshwater eco-toxicity for the geothermal power plant (with a notable improvement in the case of emissions treatment); marine and freshwater eco-toxicity for wind and solar PV. The ReCiPe midpoint contribution analysis (Figure 11) shows that several other categories (usually not accounted in the literature [33,34,35,38,39,40,41,42,55,56,59,60,61,62]) should be considered when evaluating RES through LCA (mainly: Human toxicity, marine and freshwater eco-toxicity). The national energy mix impacts mainly on water consumption and fossil fuel depletion. In absolute terms, wind energy emerged as the least impacting technology in most categories. It was evident already for the impact evaluation at midpoint level that the ReCiPe 2016 method can provide a higher degree of detail, accounting for relevant issues when comparing RES and fossil fuels (for example, mineral and fossil resources depletion).
The impact evaluation at the endpoint level was performed with the ReCiPe 2016 method allowing to cluster the results in three significant damage categories (ecosystem quality, human health, and resources). All RES technologies scored better than the national energy mix, as the latter includes the use of a considerable amount of fossil fuel resources (mostly gas and coal). Geothermal scenarios even with emissions treatment (GEO and GEO_AS) resulted to have lower performance compared with wind and solar PV for ecosystem quality and human health damage categories; however, it represents a definite step forward to the NEM and it compares well to other RES for the resources damage category. This result is a direct consequence of the high productivity of geothermal power plants (over 7500 hrs/yr operation at nominal load, compared to 1300 for solar PV and 2300 for the wind farm). These results were confirmed by the contribution analysis performed on the ReCiPe 2016 normalized results at the endpoint level.
Finally, weighting allowed to calculate a final synthetic indicator that can be used to compare the environmental performances of the different electricity generation systems. To this end, a hierarchist cultural perspective was applied to the normalized ReCiPe 2016 results. Wind resulted to be the best technology with a value of 0.0012 Eco-points/kWh, a result in line with previously documented LCA studies. However, the geothermal power plants achieved values of about 0.0177 Eco-points/kWh which were close to solar PV (0.0087 Eco-points/kWh) and much lower than those of the national energy mix (0.1240 Eco-points/kWh).
The results obtained represent a multi-category LCA comparison of different RES technologies based on primary data for three relevant test cases, and are thus a valuable addition to the available literature which is mostly based on secondary data and/or reworking of published results, often obtained with superseded LCA methodologies. The values are within the ranges for the typical categories considered in the literature (typically: GWP, AP, EP; W: [38,39,40,41,42]; PV: [33,34,35]; GEO: [55,56]; RES: [59,60,61,62]), except for GWP which is substantially higher than average for the operating Italian power plants [50,54] because of the high content of non-condensable gases (NCGs) in the natural resource.
These results, which should be matched with the real local availability of the RES and to an analysis of economic profitability, confirm that geothermal energy conversion is a good option for sustainable development.
Author Contributions
D.F. was responsible for LCI building from primary data. The LCI data was collected using primary data by F.S. and D.F., R.B. (Roberto Bonciani) provided expertise on power plant and emissions treatment processes. G.M., R.B. (Riccardo Basosi), and M.L.P. organized the validation and presentation of the results. All authors contributed to writing and interpreting the results. All authors have read and agreed to the published version of the manuscript.
Funding
This research received no direct funding through research projects, in which the authors are however involved.
Acknowledgments
The Authors applied for LCI data gathering prospects developed within the GEOENVI H2020 project (Grant agreement no. 818242). R. Basosi and M.L. Parisi acknowledge MIUR Grant—Department of Excellence 2018–2022.
Conflicts of Interest
The authors declare no conflict of interest.
Symbols/Acronyms
| AP | Acidification Potential |
| CED | Cumulative Energy Demand |
| EGS | Engineered Geothermal System |
| EP | Eutrophication Potential |
| GEO | Geothermal with AMIS® process |
| GEO_AS | Geothermal with AMIS® process treatment plus a 40% substitution of natural emissions |
| GEO_NA | Geothermal without AMIS® process |
| GWh/yr | Giga Watt-hour per year |
| H | Hierarchist Cultural Perspective (Endpoint) |
| GWP | Greenhouse Warming Potential |
| Hrs/yr | Hours per year |
| LCA | Life Cycle Analysis |
| LCI | Life-Cycle Inventory |
| LCIA | Life Cycle Impact Assessment |
| MWe | MegaWatt electric |
| MWth | MegaWatt thermal |
| NCG | Non-Condensable Gases |
| PV | Photovoltaic |
| RES | Renewable Energy Source |
| VRE | Variable Renewable Energy |
| W | Wind |
Appendix A. Life Cycle Inventory Data for the Chiusdino 1 Power Plant
Table A1.
Description.
Table A1.
Description.
| Name | Chiusdino 1 | |
|---|---|---|
| Location | 43°09’37.0” N 11°03’49.9” E | |
| Construction start date | Dec-2010 | |
| Expected life | 30 | yrs |
| Geothermal reservoir | Metamorphic | |
| Reservoir depth | 3–4.5 | km |
| Land occupation | 11,000 | m2 |
| Type of geothermal resource | Steam | |
| Production technology | Natural draft | |
| Electrical generation technology | Flash and condensation | |
| Cooling system | Evaporative towers | |
| End-use of energy | Electricity | |
| Installed capacity | ||
| Electrical | 20 | MWe |
| Operating capacity | ||
| Electrical | 18 | MWe |
| Expected annual decay rate | 0 | % per year |
| Net annual production | ||
| Electricity delivered to the grid | 151.2 | GWh |
| Capacity factor | 8400 | h |
| Out of order | 18 | h/yr |
| Average pressure at the wellhead | 15.74 | bar |
| Average temperature at the wellhead | 199.61 | °C |
| Overall flow rate | 36.1 | kg/s |
| Condenser temperature | 25 | °C |
| Reinjection | ||
| Temperature | 25 | °C |
| Pressure | Atmospheric | |
| Liquid phase, % of the total from the wells | 30% | |
| Gas phase | 0% | |
| Composition of the geothermal fluid | ||
| Dissolved gasses (NCG) mass fraction | 4.00% | |
| CO2 | 5100 | kg/h |
| CO | 0.4 | kg/h |
| CH4 | 79 | kg/h |
| H2S | 90 | kg/h |
| NH3 | 11.6 | kg/h |
| Hg | 5.6 | g/h |
| Trace elements | ||
| As | 0.042 | mg/L |
| B | - | mg/L |
| Sb | - | mg/L |
| Se | - | mg/L |
| Rn | - | Bq/m3 |
| NCG emissions treatment system (AMIS) | ||
| H2S removal efficiency | 99.8% | |
| Hg removal efficiency | 82.2% | |
| NH3 removal efficiency | 87% | |
| CO2 removal efficiency | 0% | |
| B removal efficiency | 99% | |
| As removal efficiency | 99% |
Table A2.
Construction.
Table A2.
Construction.
| Drilling | ||
| Production wells | 5 | |
| Average depth | 3818 | m |
| Reinjection wells (equivalent) | 2 | |
| Average depth | 3000 | m |
| Drilling time | 146 | days per well |
| Diesel fuel consumption for generator set (total) | 1,970,950 | l |
| Diesel fuel consumption—construction works, per well | 309,734 | l |
| Wells casing and cementing | ||
| Production wells | ||
| Steel | 1,458,476 | kg |
| Portland cement | 1,737,190 | kg |
| Bentonite | 832,324 | kg |
| Silica sand | 503,976 | kg |
| Lignosulfonates | 11,454 | kg |
| Perlite | 38,180 | kg |
| NaOH | 1,282,848 | kg |
| HCl | 328,348 | l |
| Oli and lubricants | 91,632 | kg |
| Excavations | 1925 | m3 |
| Drilling mud | 2,103,718 | kg |
| Reinjection wells (equivalent) | ||
| Steel | 228,971 | kg |
| Portland cement | 272,972 | kg |
| Bentonite | 130,600 | kg |
| Silica sand | 79,047 | kg |
| Lignosulfonates | 0 | kg |
| Perlite | 5814 | kg |
| NaOH | 188,426 | kg |
| HCl | 13,358 | l |
| Oli and lubricants | 14,457 | kg |
| Excavations | 2,931,364,589 | m3 |
| Drilling mud | 320,351 | kg |
| Drilling Platform | ||
| Occupied surface | 10,000 | m2 |
| Portland cement | 1,230,000 | kg |
| Aluminum | 9000 | kg |
| Steel | 43,000 | kg |
| Sand | 1,937,000 | kg |
| Plastic | 1250 | kg |
| Excavation | 1790 | m3 |
| Fills | 2150 | m3 |
| Steam adduction pipeline | ||
| Total length | 2758 | m |
| Steel for supports and foundations | 163,736 | |
| Steel for piping | 313,398 | kg |
| Portland cement | 493.680 | m3 |
| Aluminum | 12,962.6 | kg |
| Rock wool insulation | 130,177.6 | kg |
| Excavations | 468.86 | m3 |
| Fills | 468.86 | m3 |
| Condensate Pipeline | ||
| Total length | 5,000 | m |
| Plastics | 36,565 | kg |
| Powerhouse Equipment | ||
| Turbine and Alternator | ||
| Number of turbines | 1 | |
| Rated Power | 20 | MWe |
| Type | Ansaldo TUVA 20 MW 2nd generation | |
| Expected Life * | 25 | years |
| Number of alternators | 1 | |
| Rated Power | 23 | MWA |
| Type | Ansaldo | |
| Expected Life * | >25 | years |
| Cast iron | 13,400 | kg |
| Copper | 4000 | kg |
| Iron-nickel-chromium alloy | 1000 | kg |
| Rock wool | 4400 | kg |
| Chromium steel 18/8 | 9800 | kg |
| Steel, low-alloyed | 600 | kg |
| Steel, unalloyed | 76,400 | kg |
| Compressors | ||
| Number of compressors | 1 | |
| Capacity | 5 | t/h |
| Type | Modified F. Tosi centrifugal unit | |
| Expected Life * | 25 | yrs |
| Aluminum | 5680 | kg |
| Cast iron | 12,120 | kg |
| Steel, unalloyed | 8080 | kg |
| Copper | 16,200 | kg |
| Condenser | ||
| Number of condensers | 1 | |
| Rated Power | 20 | MW |
| Type | Ansaldo/ENEL | |
| Expected Life | 30 | yrs |
| Chromium steel 18/8 | 68,250 | kg |
| Intercooler | ||
| Chromium steel 18/8 | 18,000 | kg |
| Cooling towers | ||
| Number of cells | 3 | |
| Type | Hamon cooling tower | |
| Main material | PSRV | |
| Expected Life | 25 | yrs |
| Steel piping | 8190 | kg |
| Plastic piping | 81,900 | kg |
| Fiberglass | 90,220 | kg |
| Copper | 150 | kg |
| Cast iron | 450 | kg |
| Gas treatment system | ||
| Type | AMIS 1 unit | |
| Main material | Stainless steel 316L | |
| Capacity (max flow rate) | 5000 | kg/h |
| Expected Life | 30 | years |
| Sorbent (Selenium for Hg) | 4000 | kg |
| Catalyst (Titanium for H2S) | 9000 | kg |
| Aluminum | 500 | kg |
| Chromium steel 18/8 | 11,500 | kg |
| Building | ||
| Portland cement | 637,500 | kg |
| Diesel fuel for construction works | 195,500 | l |
| Excavations | 8,500 | m3 |
| Plastic pipes | 637,500 | kg |
| Fills | 17,944,960 | kg |
| Aluminum | 810 | kg |
| Steel, low-alloyed | 170,000 | kg |
| Accessories | ||
| Copper | 30,000 | kg |
| Plastic pipes | 15,000 | kg |
| Chromium steel 18/8 | 150,000 | kg |
| Steel, low-alloyed | 220,000 | kg |
* Major maintenance and refitting every 4 years.
Table A3.
Operation and Maintenance.
Table A3.
Operation and Maintenance.
| Emissions-to-Air | ||
| CO2 | 5100 | kg/h |
| CO | 0.4 | kg/h |
| H2S | 18.4 | kg/h |
| CH4 | 79.3 | kg/h |
| NH3 | 1.5 | kg/h |
| Hg | 1.1 | g/h |
| As | 2.8 | mg/h |
| Se | 0.4 | g/h |
| Machinery maintenance | ||
| Lubricants | 25,000 | kg |
| Waste mineral oil | 25,000 | kg |
| Iron-nickel-chromium alloy | 5375 | kg |
| Chromium steel 18/8 | 3500 | kg |
| Waste steel | 8875 | kg |
| Fluid treatment | ||
| NaOH | 2,500,000 | kg/yr |
Table A4.
End of Life.
Table A4.
End of Life.
| Wells Abandonment (per well) | ||
|---|---|---|
| Expected time | 10 | days |
| Diesel fuel consumption | 25,000 | l |
| Portland cement | 25,000 | kg |
| Inert | 5000 | kg |
| Steel | 0 | kg |
| Water | 0 | l |
Appendix B. Life Cycle Inventory Data for the Pietragalla Wind Farm
Table A5.
Description.
Table A5.
Description.
| Name | Potenza Pietragalla | |
|---|---|---|
| Location | 40.776954, 15.837555 | |
| Construction start date | 2005 | |
| Expected life | 30 | years |
| Land occupation | 1,500,000 | m2 |
| Production technology | HAWT Repower MM92 | |
| Electrical generation technology | Generator at the summit MV at ground HV at substation | |
| End-use of energy | Electricity | |
| Installed capacity | ||
| Electrical | 18 | MWe |
| Operating capacity | ||
| Electrical | 18 | MWe |
| Expected annual decay rate for the electrical power | 0 | % per yr |
| Net annual production | ||
| Electricity delivered to the grid | 25.2 | GWh |
| Capacity factor (at 18 MWe) | 1400 | h |
| Out of order (per year) | 50 | h |
| Resource characteristics | ||
| Mean power density (at 100 m) | 1041 | W/m2 |
| Maximum average wind speed (at 100 m) | 9.32 | m/s |
Table A6.
Construction.
Table A6.
Construction.
| Pitches and Logistic Surfaces | ||
| Excavations | 75,000 | m3 |
| Fills | 11,250 | m3 |
| Steel | 430,272 | kg |
| Cement | 3339 | m3 |
| Occupied surface | 20,305 | m2 |
| Wood | 324 | m2 |
| Diesel fuel for excavations | 37,500 | l |
| Cable-Ducts | ||
| Total length | 15,000 | m |
| Aluminum | 19,660 | kg |
| Copper | 6560 | kg |
| Optical fiber | 15,000 | m |
| Excavations | 7015 | m3 |
| Fills | 1960 | m3 |
| Diesel fuel for excavations | 3510 | l |
| Occupied surface | 7500 | m2 |
| Horizontal Axis Wind Turbine (HWAT) | ||
| Number of HAWT | 9 | |
| Rated power | 2 | MW |
| Description | Repower MM92 | |
| Expected life | 30 | years |
| Diesel fuel for construction works | 14,400 | l |
| Tower | ||
| Steel | 146,500 | kg |
| Copper | 6480 | kg |
| Rotor Blades | ||
| Steel | 1620 | kg |
| Fiberglass | 6480 | kg |
| Nacelle | ||
| Steel | 56,520 | kg |
| Copper | 5600 | kg |
| Fiberglass | 2780 | kg |
| Hub | ||
| Steel | 17,000 | kg |
| Viability (Road Constructions) | ||
| Excavations | 24,784 | m3 |
| Fills | 700,800 | kg |
| Asphalt | 8190 | m3 |
| Diesel fuel for construction works | 13,000 | l |
| Substation | ||
| Steel | 36,800 | kg |
| Fills | 1220 | m3 |
| PEAD tubing | 1260 | kg |
| Cement | 970 | m3 |
| Pre-cast concrete | 16.4 | m3 |
| Copper | 5000 | kg |
| Aluminum | 1500 | kg |
| Diesel | 1000 | l |
| Occupied surface | 2620 | m2 |
Table A7.
Operation and Maintenance.
Table A7.
Operation and Maintenance.
| Lubricating oil | 202,500 | kg |
| Waste mineral oils | 202,500 | kg |
| Steel, chromium 18/8 | 999,000 | kg |
| Steel, low alloyed | 540,000 | kg |
| Iron Scrap | 1,539,000 | kg |
| Diesel for O&M | 54,000 | l |
Table A8.
End of Life.
Table A8.
End of Life.
| Machinery disassemblement | ||
|---|---|---|
| Time (per HAWT—estimate) | 10 | days |
| Diesel for O&M (per HAWT—estimate) | 25,000 | l |
| Steel (per HAWT—95% recycled) | 221,640 | kg |
| Copper (per HAWT—95% recycled) | 12,080 | kg |
| Fiberglass (per HAWT—100% recycled) | 22,220 | kg |
| Cement (per HAWT—left on site) | 371 | m3 |
| Iron for foundation works (per HAWT—95% recycled) | 47,808 | kg |
Appendix C. Life Cycle Inventory data for the Serre Persano DS Photovoltaic Power Plant
Table A9.
Description.
Table A9.
Description.
| Name | Serre Persano DS | |
|---|---|---|
| Location | 40°34’08.5” N 15°06’10.5” E | |
| Construction start date | 2013 | |
| Expected life | 30 | yrs |
| Land occupation | 770,000 | m2 |
| Electrical generation technology | Photovoltaic generator, inverter for subfield, elevation downstream substation | |
| Module NA F130 G5 | 53,760 | |
| Module NA F135 G6 | 103,796 | |
| Inverter Santerno SUNWAY TG760 1000V TE | 24 | |
| End-use of energy | Electricity | |
| Installed capacity | ||
| Electrical | 21.0 | MWe |
| Operating capacity | ||
| Electrical | 19.53 | MWe |
| Expected annual decay rate | 0.07 | % per year |
| Net annual production | ||
| Electricity delivered to the grid | 29.50 | GWh |
| Capacity factor | 1281 | h |
| Out of order (per year) | 0 | h |
| Resource characteristics | ||
| Global annual radiation on the normal surface | 2131 | kWh/m2 |
Table A10.
Construction.
Table A10.
Construction.
| Pitches and Logistic Surfaces | ||
| Excavations | 54,000 | m3 |
| Fills | 1080 | m3 |
| Occupied surface | 770,000 | m2 |
| Diesel for excavations | 30,000 | l |
| Metal Carpentry | ||
| Steel | 10,023,790 | kg |
| Aluminum | 2,594,686 | kg |
| Diesel for construction | 18,135 | l |
| Photovoltaic Modules | ||
| Module NA F130 G5 | 53,760 | |
| Module NA F135 G6 | 103,796 | |
| Electrical Connections | ||
| Copper | 63,125 | kg |
| Aluminum | 1516 | kg |
| Excavations | 2954 | m3 |
| Sand | 29,546 | kg |
| Cement | 1181 | kg |
| Plastic | 18,381 | kg |
| Diesel for construction | 1477 | l |
| Inverter | ||
| Inverter Santerno SUNWAY TG760 1000V TE | 24 | |
| Delivery Cabin | ||
| Precast concrete | 41,000 | kg |
| Portland cement | 272,176 | kg |
| Diesel for construction | 1176 | l |
| Plastic pipes | 1470 | kg |
| Fills | 581,760 | kg |
| Steel | 43,052 | kg |
| Aluminum | 1743 | kg |
| Copper | 5880 | kg |
Table A11.
Operation & Maintenance.
Table A11.
Operation & Maintenance.
| Diesel for cleaning machine | 56,270 | l |
| Decarbonised water | 16,881,000 | kg |
Table A12.
End of Life.
Table A12.
End of Life.
| Diesel for disassembly | 341 | l |
| Electricity, medium voltage | 159,716 | kWh |
| Used cable | 29,935 | kg |
| Aluminum scrap for melting | 511,899 | kg |
| Inert material and fill | 2,451,729 | kg |
Appendix D. Synthesis tables of ILCD and ReCiPe Impact Analysis
Table A13.
ILCD MidPoint 2011+ method results.
Table A13.
ILCD MidPoint 2011+ method results.
| GEO | GEO_AS | GEO_NA | W | PV | NEM | |
|---|---|---|---|---|---|---|
| Acidification (molc H+ eq) | 3,04E-03 | 1,92E-03 | 1,14E-02 | 6,30E-05 | 1,50E-04 | 2,34E-03 |
| Climate change (kg CO2 eq) | 4,77E-01 | 3,01E-01 | 4,59E-01 | 1,34E-02 | 2,66E-02 | 4,84E-01 |
| Freshwater ecotoxicity (CTUe) | 2,09E-03 | 2,50E-03 | 8,96E-04 | 7,41E-04 | 5,85E-03 | 5,14E-03 |
| Freshwater eutrophication (kg P eq) | 1,18E-05 | 1,41E-05 | 2,30E-06 | 2,88E-06 | 1,81E-05 | 9,04E-05 |
| Human toxicity, cancer effects (CTUh) | 6,58E-04 | 4,31E-04 | 2,38E-03 | 1,72E-05 | 6,49E-05 | 5,09E-04 |
| Human toxicity, non-cancer effects (CTUh) | 1,89E-03 | 2,26E-03 | 1,21E-03 | 8,09E-04 | 1,78E-02 | 7,62E-03 |
| Ionizing radiation E (interim) (CTUe) | 2,80E-02 | 3,26E-02 | 1,35E-02 | 7,33E-03 | 6,22E-02 | 1,05E-01 |
| Ionizing radiation HH (kBq U235 eq) | 2,31E-03 | 2,77E-03 | 2,53E-04 | 4,28E-04 | 1,64E-03 | 2,71E-03 |
| Land use (kg C deficit) | 1,74E-04 | 2,08E-04 | 4,60E-05 | 1,76E-04 | 2,33E-04 | 9,31E-04 |
| Marine eutrophication (kg N eq) | 2,71E-03 | 3,24E-03 | 1,19E-03 | 9,41E-04 | 7,45E-03 | 7,05E-03 |
| Mineral, fossil & ren resource depletion (kg Sb eq) | 1,13E-06 | 1,36E-06 | 1,85E-07 | 2,27E-07 | 1,50E-06 | 7,19E-06 |
| Ozone depletion (kg CFC-11 e) | 6,15E-03 | 7,37E-03 | 1,68E-03 | 5,17E-03 | 6,53E-03 | 1,47E-01 |
| Particulate matter (kg PM2.5 eq) | 1,97E-05 | 2,36E-05 | 1,42E-05 | 3,90E-05 | 1,79E-05 | 1,21E-05 |
| Photochemical ozone formation (kg NMVOC eq) | 2,41E-08 | 2,89E-08 | 4,00E-09 | 3,36E-09 | 8,91E-09 | 3,37E-07 |
| Terrestrial eutrophication (molvc N eq) | 9,10E-05 | 1,09E-04 | 4,92E-05 | 3,29E-05 | 8,03E-05 | 8,33E-04 |
| Water resource depletion (m3 water eq) | 9,22E-05 | 1,11E-04 | 5,00E-05 | 3,39E-05 | 8,41E-05 | 8,48E-04 |
Table A14.
ReCiPe 2016 method results at the midpoint level.
Table A14.
ReCiPe 2016 method results at the midpoint level.
| GEO | GEO_AS | GEO_NA | W | PV | NEM | |
|---|---|---|---|---|---|---|
| Terrestrial acidification (kg SO2 eq) | 2,27E-03 | 1,42E-03 | 8,58E-03 | 4,15E-05 | 9,68E-05 | 1,58E-03 |
| Global Warming (kg CO2 eq) | 4,77E-01 | 3,01E-01 | 4,59E-01 | 1,34E-02 | 2,66E-02 | 4,84E-01 |
| Freshwater ecotoxicity (kg 1,4-DB eq) | 2,09E-03 | 2,50E-03 | 8,96E-04 | 7,41E-04 | 5,85E-03 | 5,14E-03 |
| Freshwater eutrophication (kg P eq) | 1,18E-05 | 1,41E-05 | 2,30E-06 | 2,88E-06 | 1,81E-05 | 9,04E-05 |
| Fine particulate matter formation (kg PM2,5 eq) | 6,58E-04 | 4,31E-04 | 2,38E-03 | 1,72E-05 | 6,49E-05 | 5,09E-04 |
| Human toxicity carcinogenic (kg 1,4-DB eq) | 1,89E-03 | 2,26E-03 | 1,21E-03 | 8,09E-04 | 1,78E-02 | 7,62E-03 |
| Human toxicity non-carcinogenic (kg 1,4-DB eq) | 2,80E-02 | 3,26E-02 | 1,35E-02 | 7,33E-03 | 6,22E-02 | 1,05E-01 |
| Ionising radiation (kBq Co-60 eq) | 2,31E-03 | 2,77E-03 | 2,53E-04 | 4,28E-04 | 1,64E-03 | 2,71E-03 |
| Land use (m2 yr crop eq) | 1,74E-04 | 2,08E-04 | 4,60E-05 | 1,76E-04 | 2,33E-04 | 9,31E-04 |
| Marine ecotoxicity (kg 1,4-DB eq) | 2,71E-03 | 3,24E-03 | 1,19E-03 | 9,41E-04 | 7,45E-03 | 7,05E-03 |
| Marine eutrophication (kg N eq) | 1,13E-06 | 1,36E-06 | 1,85E-07 | 2,27E-07 | 1,50E-06 | 7,19E-06 |
| Fossil resource scarcity (kg oil eq) | 6,15E-03 | 7,37E-03 | 1,68E-03 | 5,17E-03 | 6,53E-03 | 1,47E-01 |
| Mineral resource scarcity (kg Cu eq) | 1,97E-05 | 2,36E-05 | 1,42E-05 | 3,90E-05 | 1,79E-05 | 1,21E-05 |
| Stratospheric Ozone depletion (kg CFC-11 eq) | 2,41E-08 | 2,89E-08 | 4,00E-09 | 3,36E-09 | 8,91E-09 | 3,37E-07 |
| Ozone formation, Human health (kg NOx eq) | 9,10E-05 | 1,09E-04 | 4,92E-05 | 3,29E-05 | 8,03E-05 | 8,33E-04 |
| Ozone formation, Terrestrial ecosystems (kg NOx eq) | 9,22E-05 | 1,11E-04 | 5,00E-05 | 3,39E-05 | 8,41E-05 | 8,48E-04 |
| Terrestrial ecotoxicity (kg 1,4-DB eq) | 2,10E-01 | 1,98E-01 | 2,67E-01 | 3,09E-02 | 1,82E-01 | 3,18E-01 |
| Water consumption (m3) | 1,60E-01 | 1,92E-01 | 3,38E-02 | 2,18E-02 | 1,90E-01 | 3,15E+00 |
References
- Uihlein, A. JRC Geothermal Power Plant Dataset—Documentation, EUR 29446 EN; JRC Technical Report; Publications Office of the European Union: Luxembourg, 2018. [Google Scholar]
- Di Pippo, R. (Ed.) Geothermal Power Generation; Elsevier Ltd.: Amsterdam, The Netherlands, 2016; ISBN 9780081003442. [Google Scholar]
- Anderson, A.; Rezaie, B. Geothermal technology: Trends and potential role in a sustainable future. Appl. Energy 2019, 248, 18–34. [Google Scholar] [CrossRef]
- Bertani, R. Geothermal power generation in the world 2010–2014 update report. Geothermics 2016, 60, 31–43. [Google Scholar] [CrossRef]
- Lund, J.W.; Boyd, T.L. Direct utilization of geothermal energy 2015 worldwide review. Geothermics 2016, 60, 66–93. [Google Scholar] [CrossRef]
- Trumpy, E.; Bertani, R.; Manzella, A.; Sander, M. The web-oriented framework of the world geothermal production database: A business intelligence platform for wide data distribution and analysis. Renew. Energy 2015, 74, 379–389. [Google Scholar] [CrossRef]
- Barbier, E. Geothermal energy technology and current status: An overview. Renew. Sustain. Energy Rev. 2002, 6, 3–65. [Google Scholar] [CrossRef]
- Lu, S.M. A global review of enhanced geothermal system (EGS). Renew. Sustain. Energy Rev. 2018, 81, 2902–2921. [Google Scholar] [CrossRef]
- Laboratory, I.N. The Future of Geothermal Energy The Future of Geothermal Energy; Massachusetts Institute of Technology All: Idaho Falls, ID, USA, 2006; ISBN 0615134386. [Google Scholar]
- Shortall, R.; Davidsdottir, B.; Axelsson, G. A sustainability assessment framework for geothermal energy projects: Development in Iceland, New Zealand and Kenya. Renew. Sustain. Energy Rev. 2015, 50, 372–407. [Google Scholar] [CrossRef]
- Ciriaco, A.E.; Zarrouq, S.J.; Sakeri, G. Geothermal resource and reserve assessment methodology: Overview, analysis and future directions. Renew. Sustain. Energy Rev. 2020, 119, 109515. [Google Scholar] [CrossRef]
- Sanner, B. Summary of EGC 2019 country update reports on geothermal energy in europe. In Proceedings of the European Geothermal Congress 2019, the Hague, the Netherlands, 11–14 June 2019; p. 18. [Google Scholar]
- Baldacci, A.; Mannari, M.; Sansone, F. Greening of geothermal power: An innovative technology for abatement of hydrogen sulphide and mercury emission. In Proceedings of the World Geothermal Congress 2005, Antalya, Turkey, 24–29 April 2005. [Google Scholar]
- Manzella, A.; Bonciani, R.; Allansdottir, A.; Botteghi, S.; Donato, A.; Giamberini, S.; Lenzi, A.; Paci, M.; Pellizzone, A.; Scrocca, D. Environmental and social aspects of geothermal energy in Italy. Geothermics 2018, 72, 232–248. [Google Scholar] [CrossRef]
- Gestore Servizi Energetici Rapporto Statistico 2017; Gestore Servizi Energetici: Rome, Italy, 2018.
- International Energy Agency. World Energy Outlook; International Energy Agency: Paris, France, 2018. [Google Scholar]
- Shortall, R.; Uihlein, A. Geothermal Energy Technology Development Report 2018, EUR 29917 EN; Publications Office of the European Union: Luxembourg, 2019. [Google Scholar]
- Shortall, R.; Uihlein, A.; Carrara, S. Geothermal Energy Technology Market Report 2018, EUR 29933 EN; Publications Office of the European Union: Luxembourg, 2019. [Google Scholar]
- International Organization for Standardization. ISO 14040:2006—Environmental Management—Life Cycle Assessment—Principles and Framework; ISO: Geneva, Switzerland, 2006. [Google Scholar]
- International Organization for Standardization. For ISO 14044:2006 Environmental Management—Life Cycle Assessment—Requirements and Guidelines; ISO: Geneva, Switzerland, 2006. [Google Scholar]
- Klopffer, W. Life cycle assessment—From the beginning to the current state. Environ. Sci. Pollut. Res. 1997, 4, 223–228. [Google Scholar] [CrossRef]
- European Commission. International Reference Life Cycle Data System (ILCD) Handbook: Framework and Requirements for Life Cycle Impact Assessment Models and Indicators; European Commission: Brussels, Belgium, 2010; ISBN 9789279175398. [Google Scholar]
- Spath, P.L.; Mann, M.K.; Kerr, D.R. Life Cycle Assessment of Coal-fired Power Production; National Renewable Energy Lab.: Golden, CO, USA, 1999.
- Spath, P.L.; Mann, M.K. Life Cycle Assessment of a Natural Gas Combined-Cycle Power Generation System—National Renewable Energy Laboratory—NREL/TP-570-27715; National Renewable Energy Lab.: Golden, CO, USA, 2000.
- Kannan, R.; Leong, K.C.; Osman, R.; Ho, H.K.; Tso, C.P. Gas fired combined cycle plant in Singapore: Energy use, GWP and cost-a life cycle approach. Energy Convers. Manag. 2005, 46, 2145–2157. [Google Scholar] [CrossRef]
- Kim, H.C.; Fthenakis, V.; Choi, J.K.; Turney, D.E. Life cycle greenhouse gas emissions of thin-film photovoltaic electricity generation: Systematic review and harmonization. J. Ind. Ecol. 2012, 16, S110–S121. [Google Scholar] [CrossRef]
- Gerbinet, S.; Belboom, S.; Léonard, A. Life Cycle Analysis (LCA) of photovoltaic panels: A review. Renew. Sustain. Energy Rev. 2014, 38, 747–753. [Google Scholar] [CrossRef]
- Stoppato, A. Life cycle assessment of photovoltaic electricity generation. Energy 2008, 33, 224–232. [Google Scholar] [CrossRef]
- Sherwani, A.F.; Usmani, J.A. Varun Life cycle assessment of solar PV based electricity generation systems: A review. Renew. Sustain. Energy Rev. 2010, 14, 540–544. [Google Scholar] [CrossRef]
- Jungbluth, N. Life cycle assessment of crystalline photovoltaics in the Swiss ecoinvent database. Prog. Photovolt. Res. Appl. 2005, 13, 429–446. [Google Scholar] [CrossRef]
- Koroneos, C.; Stylos, N.; Moussiopoulos, N. LCA of multicrystalline silicon photovoltaic systems. Part 1: Present situation and future perspectives. Int. J. Life Cycle Assess. 2006, 11, 129–136. [Google Scholar] [CrossRef]
- Koroneos, C.; Stylos, N.; Moussiopoulos, N. LCA of multicrystalline silicon photovoltaic systems: Part 2: Application on an island economy. Int. J. Life Cycle Assess. 2006, 11, 183–188. [Google Scholar] [CrossRef]
- Peng, J.; Lu, L.; Yang, H. Review on life cycle assessment of energy payback and greenhouse gas emission of solar photovoltaic systems. Renew. Sustain. Energy Rev. 2013, 19, 255–274. [Google Scholar] [CrossRef]
- Maranghi, S.; Parisi, M.L.; Basosi, R.; Sinicropi, A. Environmental profile of the manufacturing process of perovskite photovoltaics: Harmonization of life cycle assessment studies. Energies 2019, 12, 3746. [Google Scholar] [CrossRef]
- Muteri, V.; Cellura, M.; Curto, D.; Franzitta, V.; Longo, S.; Mistretta, M.; Parisi, M.L. Review on life cycle assessment of solar photovoltaic panels. Energies 2020, 13, 252. [Google Scholar] [CrossRef]
- Raugei, M.; Bargigli, S.; Ulgiati, S. Life cycle assessment and energy pay-back time of advanced photovoltaic modules: CdTe and CIS compared to poly-Si. Energy 2007, 32, 1310–1318. [Google Scholar] [CrossRef]
- Fthenakis, V.M.; Frischknecht, R.; Raugei, M.; Kim, H.C.; Alsema, E.; Held, M.; de Wild Scholten, M. Methodology Guidelines on Life Cycle Assessment of Photovoltaic Electricity; Vol. IEA PVPS T; National Renewable Energy Lab.: Golden, CO, USA, 2016; ISBN 978-3-906042-38-1.
- Raadal, H.L.; Gagnon, L.; Modahl, I.S.; Hanssen, O.J. Life cycle greenhouse gas (GHG) emissions from the generation of wind and hydro power. Renew. Sustain. Energy Rev. 2011, 15, 3417–3422. [Google Scholar] [CrossRef]
- Dolan, S.L.; Heath, G.A. Life cycle greenhouse gas emissions of utility-scale wind power: Systematic review and harmonization. J. Ind. Ecol. 2012, 16, 136–154. [Google Scholar] [CrossRef]
- Mendecka, B.; Lombardi, L. Life cycle environmental impacts of wind energy technologies: A review of simplified models and harmonization of the results. Renew. Sustain. Energy Rev. 2019, 111, 462–480. [Google Scholar] [CrossRef]
- Arvesen, A.; Hertwich, E.G. Assessing the life cycle environmental impacts of wind power: A review of present knowledge and research needs. Renew. Sustain. Energy Rev. 2012, 16, 5994–6006. [Google Scholar] [CrossRef]
- Garrett, P.; Rønde, K. Life cycle assessment of wind power: Comprehensive results from a state-of-the-art approach. Int. J. Life Cycle Assess. 2013, 18, 37–48. [Google Scholar] [CrossRef]
- Ardente, F.; Beccali, M.; Cellura, M.; Lo Brano, V. Energy performances and life cycle assessment of an Italian wind farm. Renew. Sustain. Energy Rev. 2008, 12, 200–217. [Google Scholar] [CrossRef]
- Tremeac, B.; Meunier, F. Life cycle analysis of 4.5 MW and 250 W wind turbines. Renew. Sustain. Energy Rev. 2009, 13, 2104–2110. [Google Scholar] [CrossRef]
- Weinzettel, J.; Reenaas, M.; Solli, C.; Hertwich, E.G. Life cycle assessment of a floating offshore wind turbine. Renew. Energy 2009, 34, 742–747. [Google Scholar] [CrossRef]
- Guezuraga, B.; Zauner, R.; Pölz, W. Life cycle assessment of two different 2 MW class wind turbines. Renew. Energy 2012, 37, 37–44. [Google Scholar] [CrossRef]
- Lacirignola, M.; Blanc, I. Environmental analysis of practical design options for enhanced geothermal systems (EGS) through life-cycle assessment. Renew. Energy 2013, 50, 901–914. [Google Scholar] [CrossRef]
- Sullivan, J.L.; Clark, C.E.; Han, J.; Wang, M. Life-Cycle Analysis Results of Geothermal Systems in Comparison to Other Power Systems; Argonne National Lab.: Argonne, IL, USA, 2010.
- Yu, T.; Looijen, J.M.; van der Meer, F.D.; Willemsen, N. A life cycle assessment based comparison of large & small scale geo-thermal electricity production systems. In Proceedings of the 5th Indonesia International Geothermal Convention & Exhibition, Jacarta, Indonesia, 2–4 August 2017; pp. 2–4. [Google Scholar]
- Bravi, M.; Basosi, R. Environmental impact of electricity from selected geothermal power plants in Italy. J. Clean. Prod. 2014, 66, 301–308. [Google Scholar] [CrossRef]
- Frick, S.; Kaltschmitt, M.; Schröder, G. Life cycle assessment of geothermal binary power plants using enhanced low-temperature reservoirs. Energy 2010, 35, 2281–2294. [Google Scholar] [CrossRef]
- Bayer, P.; Rybach, L.; Blum, P.; Brauchler, R. Review on life cycle environmental effects of geothermal power generation. Renew. Sustain. Energy Rev. 2013, 26, 446–463. [Google Scholar] [CrossRef]
- Ruzzenenti, F.; Bravi, M.; Tempesti, D.; Salvatici, E.; Manfrida, G.; Basosi, R. Evaluation of the environmental sustainability of a micro CHP system fueled by low-temperature geothermal and solar energy. Energy Convers. Manag. 2014, 78, 611–616. [Google Scholar] [CrossRef]
- Parisi, M.L.; Ferrara, N.; Torsello, L.; Basosi, R. Life cycle assessment of atmospheric emission profiles of the Italian geothermal power plants. J. Clean. Prod. 2019, 234, 881–894. [Google Scholar] [CrossRef]
- Eberle, A.; Heath, G.A.; Carpenter Petri, A.C.; Nicholson, S.R. Systematic Review of Life Cycle Greenhouse Gas Emissions from Geothermal Electricity; National Renewable Energy Lab.: Golden, CO, USA, 2017.
- Tomasini-Montenegro, C.; Santoyo-Castelazo, E.; Gujba, H.; Romero, R.J.; Santoyo, E. Life cycle assessment of geothermal power generation technologies: An updated review. Appl. Therm. Eng. 2017, 114, 1119–1136. [Google Scholar] [CrossRef]
- Atilgan, B.; Azapagic, A. Renewable electricity in Turkey: Life cycle environmental impacts. Renew. Energy 2016, 89, 649–657. [Google Scholar] [CrossRef]
- Marchand, M.; Blanc, I.; Marquand, A.; Beylot, A.; Bezelgues-Courtade, S.; Traineau, H. Life cycle assessment of high temperature geothermal energy systems. Proc. World Geotherm. Congr. 2015, 19–25. [Google Scholar]
- Asdrubali, F.; Baldinelli, G.; D’Alessandro, F.; Scrucca, F. Life cycle assessment of electricity production from renewable energies: Review and results harmonization. Renew. Sustain. Energy Rev. 2015, 42, 1113–1122. [Google Scholar] [CrossRef]
- Amponsah, N.Y.; Troldborg, M.; Kington, B.; Aalders, I.; Hough, R.L. Greenhouse gas emissions from renewable energy sources: A review of lifecycle considerations. Renew. Sustain. Energy Rev. 2014, 39, 461–475. [Google Scholar] [CrossRef]
- Pehnt, M. Dynamic life cycle assessment (LCA) of renewable energy technologies. Renew. Energy 2006, 31, 55–71. [Google Scholar] [CrossRef]
- Turconi, R.; Boldrin, A.; Astrup, T. Life cycle assessment (LCA) of electricity generation technologies: Overview, comparability and limitations. Renew. Sustain. Energy Rev. 2013, 28, 555–565. [Google Scholar] [CrossRef]
- Greendelta openLCA. Available online: https://www.greendelta.com/ (accessed on 5 February 2020).
- Ecoinvent. Available online: https://www.ecoinvent.org/ (accessed on 5 February 2020).
- Wernet, G.; Bauer, C.; Steubing, B.; Reinhard, J.; Moreno-Ruiz, E.; Weidema, B. The Ecoinvent Database version 3 (part I): Overview and Methodology. Int. J. Life Cycle Assess. 2016, 21, 1218–1230. [Google Scholar] [CrossRef]
- Huijbregts, M.; Steinmann, Z.J.N.; Elshout, P.M.F.M.; Stam, G.; Verones, F.; Vieira, M.D.M.; Zijp, M.; van Zelm, R. ReCiPe 2016—A harmonized life cycle impact assessment method at midpoint and endpoint level. Int. J. Life Cycle Assess. 2016, 22, 138–147. [Google Scholar] [CrossRef]
- European Commission. Characterisation Factors of the ILCD Recommended Life Cycle Impact Assessment Methods: Database and Supporting Information; European Commission: Brussels, Belgium, 2012; ISBN 9789279227271. [Google Scholar]
- Sala, S.; Benini, L.; Castellani, V.; Vidal Legaz, B.; De Laurentiis, V.; Pant, R. Suggestions for the Update of the Environmental Footprint Life Cycle Impact Assessment: Impacts Due to Resource Use, Water Use, land Use, and Particulate Matter; Publications Office of the European Union: Luxembourg, 2019; ISBN 9789279693359. [Google Scholar]
- Sala, S.; Cerutti, A.K.; Pant, R. Development of a weighting approach for the Environmental Footprint; Publications Office of the European Union: Luxembourg, 2018. [Google Scholar]
© 2020 by the authors. Licensee MDPI, Basel, Switzerland. This article is an open access article distributed under the terms and conditions of the Creative Commons Attribution (CC BY) license (http://creativecommons.org/licenses/by/4.0/).