The Spillover Effect of US Industrial Subsidies on China’s Exports


1
School of Management, Harbin Institute of Technology, Harbin 150001 China
2
Collaborative Innovation Center of China Pilot Free Trade Zone, Shanghai University of Finance and Economics, Shanghai 200433, China
*
Author to whom correspondence should be addressed.
Sustainability 2020, 12(7), 2938; https://doi.org/10.3390/su12072938
Submission received: 1 March 2020
/
Revised: 26 March 2020
/
Accepted: 28 March 2020
/
Published: 7 April 2020
(This article belongs to the Special Issue Economic Growth, Energy Consumption and Sustainable Development: The Case of Mediterranean Region)
Abstract
:This study systematically assessed the spillover effects of US industrial subsidy policies on China’s export by matching all related bills issued by the US federal and state governments since 2009 with the affected products exported from China. In general, the US subsidy policies created a significant obstacle for Chinese exporters entering the US market. In addition, the industry-level analysis indicated that the subsidy policy has the most significant negative spillover effect on mid- and high-tech products, and no significant impact on resource-based and low-tech export products. Furthermore, we explored the mechanism and found that the US subsidies lower the domestic export prices of the affected products, thereby having a larger negative impact on the entry of mid- and high-tech products entering the US market. The implementation of the US subsidy increased the export competitiveness of mid- and high-tech products in domestic market, which helped such US firms expand their international markets. Therefore, we offer targeted suggestions in order to create a fair and reasonable business environment for Chinese exporters.
1. Introduction
After the global financial crisis in 2008, the US government introduced a large-scale non-performing asset assistance bill that provided significant government loan assistance to the US steel and automobile manufacturing sectors. Since Donald Trump took office in 2017, the US government introduced a series of policy support measures, e.g., government subsidies, tax deductions, and localized incentives, in industries such as agriculture, computers, and communications equipment.
Although the US government’s industrial subsidy policy provides convenient conditions for the development and expansion of domestic industries, it has significant policy spillover effects on Chinese exporters. On the one hand, US domestic firms receive government subsidies and can obtain a price-based competitive advantage in the domestic markets over Chinese export firms. On the other hand, Chinese exporters face a more intense competitive environment and discriminatory market access barrier in the US [1,2]. Therefore, this study aimed at providing a systematic analysis of the characteristics of the US industrial subsidy policy, and its potential impact on China’s export trade with the US. It is of great practical significance for the Chinese government to take effective measures to respond to the US industry policy in time and create a good industrial development environment for its domestic firms. It is also of great significance for other countries to resist trade protectionism and promote multilateral trade liberalization.
Prior studies have evaluated industrial subsidy policies primarily from the perspective of local exporters and analyzed the mechanism and implementation effect. The effects of government subsidies on export trade have several positive and negative mechanisms. Government subsidies for export trade have three main positive incentive effects: overcoming the obstacle of fixed export costs, achieving economies of scale, and improving productivity. First, firms engaged in export trade need to invest resources to find suitable import trading partners, investigate their creditworthiness and goodwill, and at the same time bear the possible political risks, market fluctuation risks, and exchange rate fluctuation risks. Therefore, firms need to pay higher fixed costs to explore international markets. The government can provide firms with financial support or risk guarantees through subsidies, which can help firms reduce many fixed costs and transaction risks. Such subsidies can motivate firms to explore international markets [3,4,5,6,7,8]. Second, government subsidies for production activities can reduce production costs and help firms obtain cost advantages in the international market. In addition, firms can increase their international market share through export cost advantages, which can help them achieve economies of scale and reduce the average cost of exports, thereby further strengthening their international competitiveness [9,10,11,12,13]. Finally, subsidies for corporate innovation activities will help firms invest more resources in research and development (R&D), and increase training to develop new skills in their employees, which will improve production efficiency and enhance export competitiveness [14,15,16,17,18].
The negative suppression effect of government subsidies on export trade reflects mainly in the distortion of resource allocation, corporate rent-seeking behavior, subsidy dependence, and retaliation from the other party. First, due to the complexity of the subsidy allocation process, the government cannot obtain sufficient information beforehand, and it is difficult to determine which firms and industries are suitable for subsidies effectively. After firms receive subsidies, the information asymmetry makes it difficult for the government to carry out effective supervision, which ultimately leads to distortions in the allocation of market resources. Second, long-term government subsidies will provide firms with an additional source of profits, which allows them to survive in the market without improving their operating methods and efficiency. With the reliance on government subsidies, firms have less enthusiasm for engaging in R&D activities and a lower autonomous development ability. Third, the opacity of government subsidies makes such programs prone to corruption. Firms are likely to engage in rent-seeking behaviors to obtain subsidies, resulting in invalid expenditures, and may occupy some of the resources originally used for R&D and innovation activities, resulting in crowding out effects. Finally, long-term subsidies may also lead to retaliatory measures by other countries, which will increase the export barriers of domestic firms and decrease the export incentives of subsidies [19,20,21].
By summarizing the related literature on the effect of industrial subsidy policies, we can draw the following conclusions. First, for firms that enter the international export market, productive subsidies can help them alleviate financial constraints and expand their export scale [3,14,19,22]. Second, the existing research did not yet reach a consistent conclusion on whether government subsidies can lead to adjustments in business decisions and entry in the export market for firms that do not yet export. Manufacturing subsidies in the US, Ireland, Germany, and Colombia do not lead firms to change their export decisions [3,14,19,22]. Third, as government subsidies exist in a moderate range, high-intensity subsidies that exceed the upper limit of a specific range may strengthen firms’ rent-seeking behavior, thereby inhibiting corporate innovation and improving TFP [23].
The literature reviewed above mainly reports on the impact of government subsidies on local firms and products. If the government subsidy policy is properly designed and the incentive effect on local firms is greater than its negative effect, it may strengthen the market competitiveness of domestic firms, and adversely affect foreign firms entering the domestic market. However, few studies examine the spillover effects of government subsidies on foreign exporters. One paper shows that the Chinese government’s subsidies to the shipbuilding industry reduced the average cost of shipbuilding and increased the international competitiveness of China’s shipbuilding industry, which led to a decline in the international market share of Japanese firms [24]. Another paper analyzes the impact of global protectionist barriers on export trade [25]. Although the authors included subsidy policies by some relevant countries, their study has three problems. First, they used HS-4 quantile product data, which cannot provide accurate analysis results, instead of accurate HS-6 quantile product data. Second, the study does not address potential endogeneity problems in the model. Third, given the variety in the types of barriers in the text, the study contains no further analysis of the mechanism by which trade barriers affect export trade.
Our study analyzed the impact of US industrial subsidy policies on Chinese export products entering the US market. Compared to Henn et al. [25], we improved matching accuracy by using HS-6 product data and solved the potential endogeneity problem. In addition, we studied the mechanisms of the subsidy policy. A systematic review of all US economic and trade policy bills after the global financial crisis in 2008 reveals that the federal and state governments introduced a series of direct and indirect subsidy policies to support the development of their industries. These subsidy policies grew the economies scale of local firms more quickly by reducing the price of high-tech products in the domestic market. It not only helped to improve the export competitiveness of US mid- and high-tech industries and opened international export markets, but also had a negative effect on China’s mid- and high-tech products entering the US market.
This study offers several contributions to the existing literature. First, our analysis of industrial subsidy policies included not only the production and export subsidies mentioned in prior studies, but also the discriminatory implicit subsidies, such as government procurement and localization content requirements. Second, unlike the existing literature, which focuses on the export performance of local firms receiving government subsidies, we assessed the impact of US subsidy policies on Chinese export products entering the U.S. market, as well as the different effect on various industries. Third, we constructed instrumental variables of the industrial subsidy policy to address the potential endogeneity problem identified by [26]. Finally, we tested the transmission mechanism of policy spillover effects, making the analysis results more systematic and comprehensive.
2. Overview US Industrial Subsidy Policies During 2009–2018
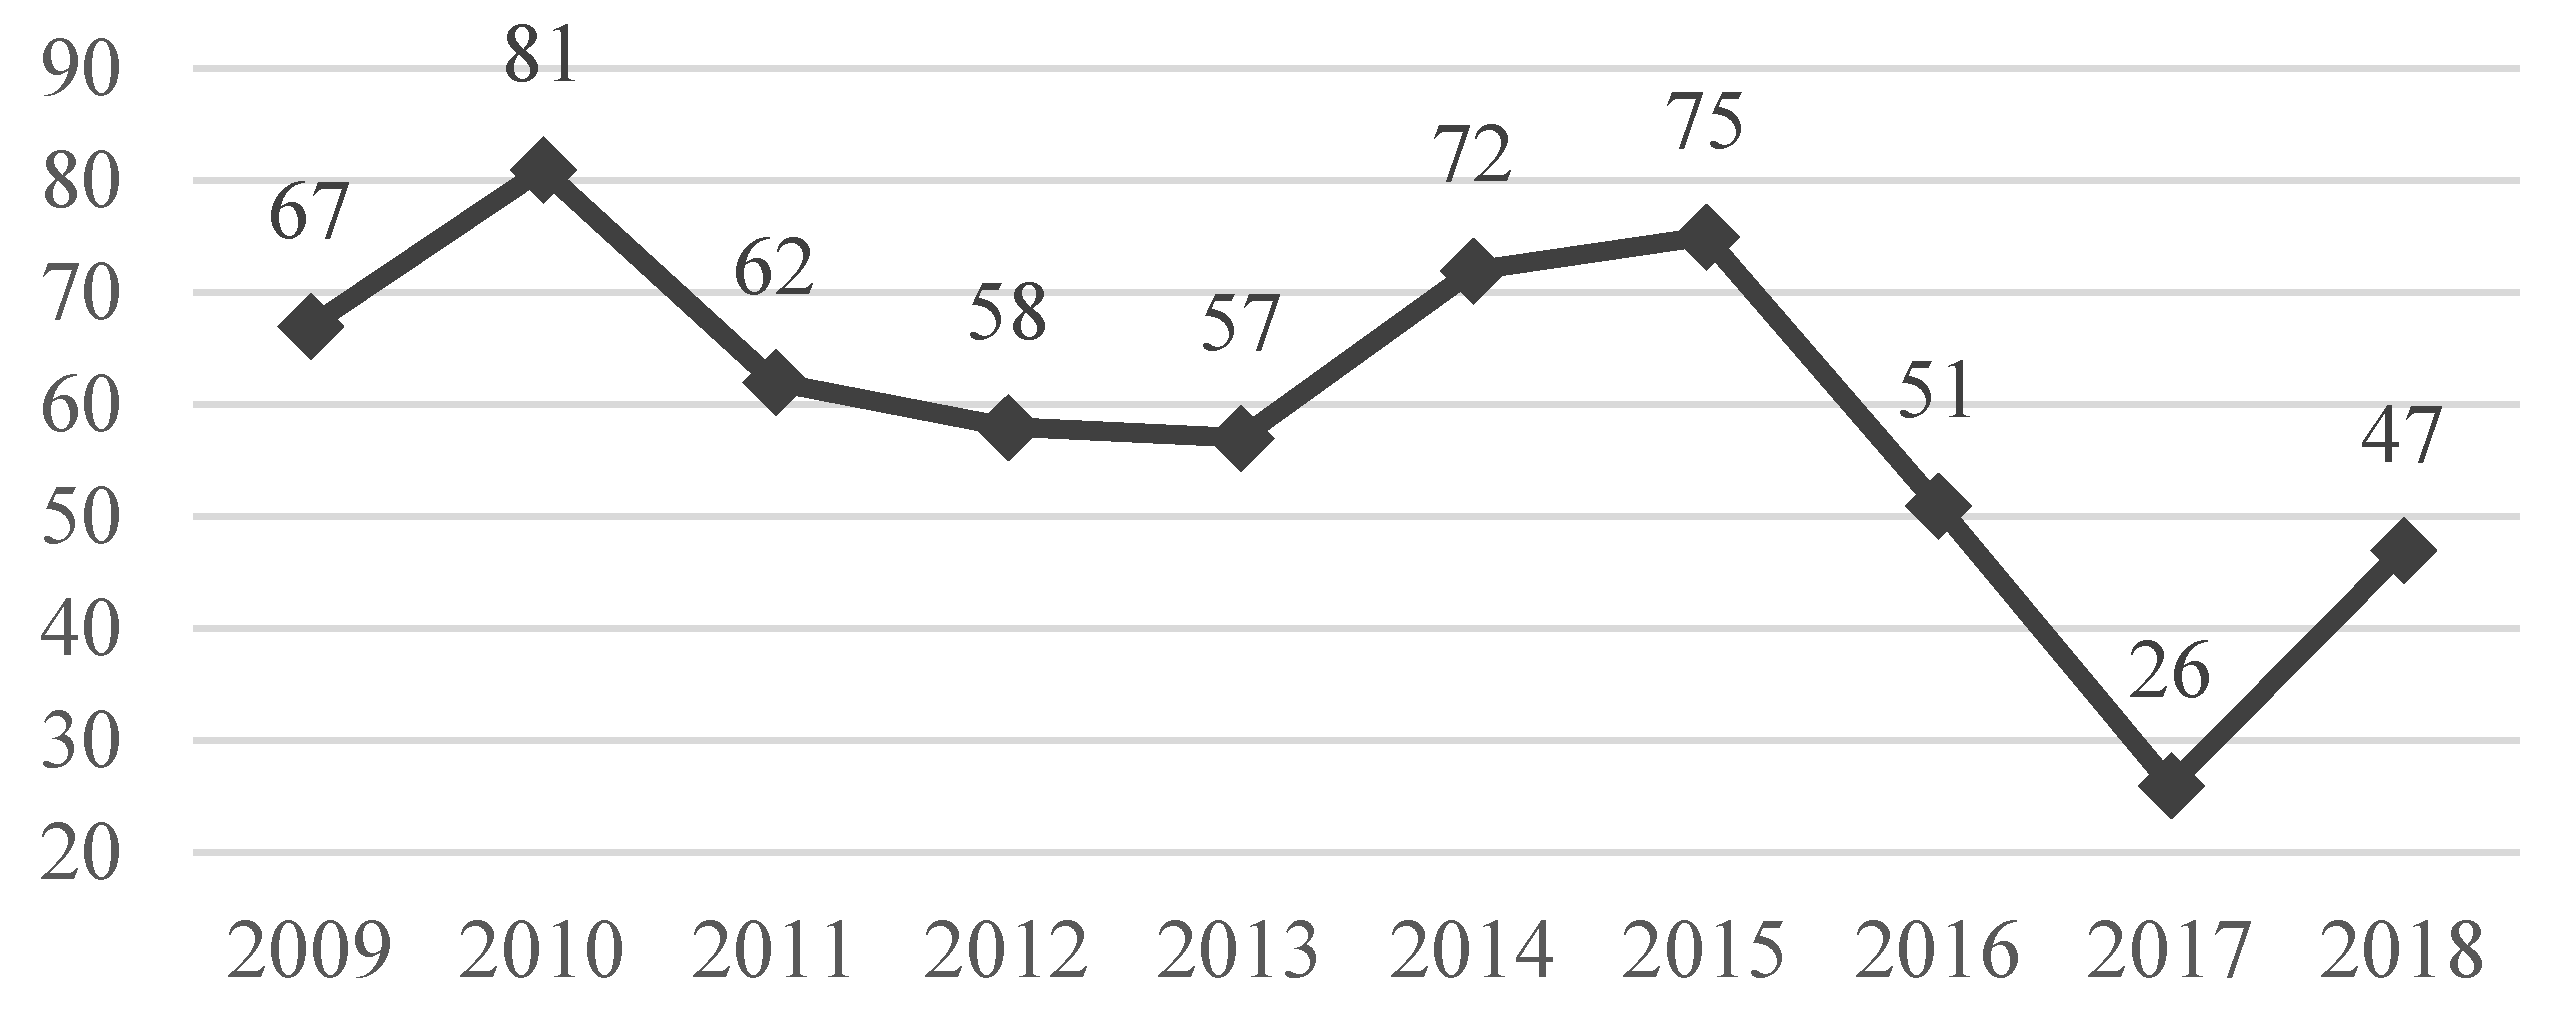
As the Figure 1 shows, the US government formally implemented 596 industrial subsidy policies during 2009–2018. After the global financial crisis in 2008, the US economy was hit hard, the stock market fell sharply, and the unemployment rate was high. To rescue the many US firms that were facing bankruptcy, boost the US economy, and increase employment opportunities for residents, the US federal and state governments introduced 67 industrial subsidy policy bills in 2009 to support the US economy during the recession. In 2010, 81 US subsidy policies came into effect. This was the highest number of subsidy measures implemented during the eight-year administration of US President Barack Obama. After Donald Trump took office in 2017, as the US economy gradually improved, the intensity of industrial subsidy policies weakened. However, since 2018, as the tide of internal protectionist sentiment in the US continued to spread and the government provoked trade disputes with China, the European Union, Turkey, and other countries had to introduce trade countermeasures against the US. The US government significantly increased the intensity of industrial subsidy policies to reduce the impact of the affected domestic industries. The US government introduced 47 measures in 2018 to support the development of domestic industries. These subsidized industries in the US can only benefit and become more competitive if other countries do not adopt similar policies to support domestic industries. However, once other countries take retaliatory policies, the benefits of subsidy policies will be offset [27,28].
As shown in Table 1, of the industrial subsidy policies implemented by the US between 2009 and 2018, 16 types of policies may adversely affect China’s export products entering the US market. The most frequently implemented measure is public procurement localization funding by the US federal and state governments, at a total of 335 items, followed by tax and social security deductions, government financial subsidies, and government loans and localized procurement measures. The top five subsidy policies account for 95.4% of all US subsidy policies.
3. Spillover Effects of US Industrial Subsidies on Chinese Exports
3.1. Data
Due to limited data availability, we could not obtain detailed data on China’s export trade to the US after 2018. Therefore, we used the data on HS-6 quantile subdivision products exported from China to the US from 2009 to 2017 to analyze the impact of US industrial subsidy policies on China’s export products entering the US market. We obtained the HS-6 export product data from the UNCTAD Database and the US export subsidy data from the Global Trade Alert Database. We obtained the final research data by combining the two databases based on the HS-6 quantile product classification.
3.2. The Model
We analyzed the impact of US industrial subsidy policy on Chinese exports to the US by constructing the following empirical model.
where the subscripts c, u, p, and t represent China, the US, products, and years, respectively. represents the logarithmic export value of the HS-6 quantile product from China to the US. is the key explanatory variable. It takes the value of 1 if the US provided direct or indirect subsidies to product p in year t, and 0 otherwise. indicates the set of time-varying control variables that affect China’s exports to the US, including the influence of business practices, history, and culture of industry between the two countries, which prior studies usually include in the trade gravity model. indicates the set of time-varying control variables that affect China’s exports to the US, such as the exchange rate between the two countries, the economic aggregate, and price changes. represents a random interference term.
3.3. Benchmark model
We first used a first-order difference model for the estimation to eliminate the influence of factors that do not change with time. We controlled variables that change with time by adding a year fixed-effect variable and the cross-term fixed effect of year and industry. The model is as follows:
where TVFE represents a fixed effect over time.
To address the potential endogeneity problems that may exist in the model, we also used the first-order difference of panel data and instrumental variables.
Table 2 presents the overall estimation results for the impact of the US industrial subsidy policy on Chinese export products entering the US market. Columns (1)–(3) report the results of the estimation using a first-order difference model including the year fixed-effect and year–industry cross-terms. The results indicate that the industrial subsidy policy had a significant negative effect on Chinese exports to the US. The coefficient of the industrial subsidy in Column (3) is −0.157, and is significantly negative at the 1% level of significance. This result indicates that, under other conditions, these policies led to a 14.5% reduction of China’s exports to the US on average (e−0.157−1).
We also introduced the tariff and non-tariff barriers implemented by the US as control variables, as the US not only imposed direct tariffs on Chinese exports and launched discriminatory anti-dumping and countervailing investigations, but also introduced several non-tariff protection measures, such as health inspections and quarantine measures, customs inspections, and technical barriers, which all affect China’s export trade to the US. We found that the US tariff protection measures had a very significant negative impact on China’s export trade to the US, although the impact of the non-tariff barriers are not obvious. After introducing these control variables, the spillover effects of US industrial subsidy measures are still significantly negative. The coefficients are very similar to the benchmark estimates, and they can pass the test at a significance level of 1%. The model results are very robust.
3.4. Robustness and Endogeneity
3.4.1. Robustness Checks
We used dummy variables to measure the US industrial subsidy in the benchmark estimation following Henn et al. [25]. Considering that the US introduced various forms of subsidy policies to support local industries, market access and barriers may differ by industry. Hence, we used the variable s to indicate whether China’s export products are subject to US subsidy policies (subsidy_num) in one year as a substitute to measure the intensity of US subsidies. The columns 1–2 of Table 3 again show that subsidies impose a very significant negative impact on China’s export products.
We also re-estimated the result using a fixed effects model. After adding the industry, year, and industry-year cross-fixed effects, the result is still a significantly negative coefficient of industrial subsidy policies. Therefore, the results of the model are robust.
3.4.2. Endogeneity
Given that exports from China place more competitive pressure on domestic US industries, the possibility that the US will introduce subsidies to support such industries is higher, as the US would need to enhance the international competitiveness of these industries. Therefore, there may be a two-way causal relationship between Chinese exports to the US and US subsidies, and the model thus has a potential endogeneity issue. Hence, we referred to Fontagné et al. [26] and introduced an instrumental variable (ivsubsidy) for the US industrial subsidy policy equal to 1 if the US subsidizes a certain industry while other countries also apply the same subsidy policy, and 0 otherwise. The relationship between ivsubsidy and subsidy is strong because, if China’s exports are highly competitive internationally and very important to the country, then the US and other countries may adopt similar subsidy measures to support domestic industries. However, the exports of Chinese products to the US may not affect the subsidy policies of other countries.
We addressed the problem of potential missing variables and two-way causality using a differential transformation to eliminate various time-invariant factors that may affect China’s export trade with the US, and introduced dummy variables for the year and year–industry to control the potential time-varying influence of these factors. Finally, we estimated the model using the two-stage least squares (2SLS) method. The fourth column of Table 3 shows that the coefficient of industrial subsidies is −0.267, which is significantly positive at the 5% level of significance. After adding the control variables for US tariffs and non-tariff barriers, the coefficient of industrial subsidies drops to −0.206, which is significant at the 10% level. The estimation result of the negative spillover effect of industrial subsidies is larger than the benchmark model. Therefore, neglecting the potential endogeneity will lead to underestimating the results for the negative impact of the US industrial subsidy policy on China’s export trade. The Kleibergen–Paaprk LM statistics show that the selected instrumental variables pass the under identification test, and the Wald F statistics show that the model passes the weak instrumental test.
4. Spillover Effects of US Industrial Subsidies on Chinese Exports: Estimates by Industry
Although the US subsidy policy has a significant negative impact on Chinese exports to the US, there are differences in the intensity of trade subsidies for each industry. From 2009 to 2017, the average subsidy coverage rate for resource-based industries in the US was only 2.4%, while that for manufactured goods reached 23.7%. Among manufactured products, 14.1% of low-tech, labor-intensive industries received preferential subsidies, while 28.9% of high-tech, capital- and knowledge-intensive industries received preferential subsidies. Therefore, we examined the differential impact of the negative spillover effect of US subsidy policies on Chinese exports entering the US market at the industry level.
Table 4 and Table 5 show that the US subsidy policies have negative spillover effects on China’s high-tech products and no significant negative impact on the resource-based and low-tech products.
The US has obvious advantages in resource-based industries, as it has more land and other factor resources per capita than China does. China’s primary products are generally at a disadvantage compared to those of the US, and China imports large quantities of agricultural products and other non-renewable resources from the US; that is, China is in a deficit with the US in the trade of resource-based products. As US resource-based products have strong international competitiveness, such products receive relatively low subsidies, leading to the relatively small on China’s primary products entering the US market. The tariff and non-tariff barriers in the US also have no significant impact on resource-based products.
The US has no comparative advantage in factor endowment for low-tech, labor-intensive industries, and has been transferring such industries to other countries for many years. As China has strong international competitiveness in low-tech industries, the US government subsidies for such industries would be very high, while also having very little effect and significance on improving the international competitiveness of its low-tech industries. In practice, the US introduced relatively low subsidies in this area. Therefore, China’s export of low-tech products did not suffer the significant negative impact of US subsidies. However, to alleviate the impact of Chinese labor-intensive products on local industries, the US implement tariffs and trade remedy measures to restrict China’s exports, and the negative effects of these policies are very significant.
High-tech, capital- and knowledge-intensive industries are critical for a country’s future development and required innovation and R&D. Designing a reasonable subsidy policy can help reduce the huge early R&D expenditures required, achieve economies of scale, and help the relevant industries grow rapidly. The US government provides direct and indirect subsidies in a variety of ways to support the development of its domestic high-tech industries. In recent years, China made rapid progress in some mid- and high-tech industries, and US subsidies create serious obstacles for Chinese mid- and high-tech products to enter the local market that inhibit these firms from expanding their market shares in the US.
5. The Mechanism of the Spillover Effect of US Subsidies on China
We next investigated why US subsidies have negative effect predominantly on the exports of China’s mid- and high-tech industries, but no significant negative impact on the exports of China’s resource-based and low-tech industries. A further analysis of this issue helped deepen the understanding of the spillover effects of industrial subsidy policies.
5.1. The Price Mechanism
We can analyze the mechanism of the effect of a subsidy policy from two channels. On the one hand, subsidies can directly reduce the production cost for subsidized products and help the subsidized industry achieve economies of scale. It would then reduce the average cost of production, which would lower the product price accordingly. On the other hand, if firms pay a significant rent-seeking cost to obtain the subsidies and rely on them, then the incentive for independent development would decrease and product prices may not decrease. Therefore, we analyzed the mechanism by which the US subsidies on industries that compete with Chinese exports entering the local market using the prices of US export products as an intermediary. We first examined the differing impacts of subsidy policies on the prices of export products in different industries in the US, and then analyzed the adjustment effect of export prices by introducing the cross-terms of prices and subsidies.
The results in Table 6 show that the US subsidy policy has no significant impact on the export prices of domestic resource-based products and low-tech products, but has a significant influence on mid- and high-tech manufactured products at the 10% level of significance. In addition, for resource-based products and low-tech products, the coefficient of subsidies and the cross term of prices and subsidies is not significant. For mid- and high-tech products, the coefficient of subsidies is significantly negative, and the coefficient of the cross term of prices and subsidies is significantly positive, which means that, with the decline in the price of high-tech products in the US, the subsidy policy has a more negative impact on China’s related products exported to the US. Therefore, the government subsidies helped to reduce the cost of R&D investment and promoted economies of scale in the US mid- and high-tech industries, thereby reducing the price of export products and enhancing international competitiveness. Therefore, US subsidies may help mid- and high-tech products develop international markets. This created unfairness for Chinese products entering the US market, and restrained China’s exports of high-tech products to the US.
5.2. Further Analysis
We next used a first-order difference model to analyze the impact of US subsidies on the exports of local products to the international market. The benchmark model is similar to Equation (2).
where represents the first-order difference of the logarithmic export value of the HS-6 quantile product from US to the China. TVFE represents a fixed effect over time. represents a random interference term.
Table 7 shows that US subsidies have no significant impact on the exports of domestic resource-based products and low-tech, labor-intensive products, but have a significant role in helping mid- and high-tech, capital- and knowledge-intensive products enter international markets. At a statistical level of 5%, an export subsidy policy can increase the average exports of mid- and high-tech products by about 9.86% (e0.094−1). The relevant conclusions are consistent with the test of the price mechanism of the US subsidy policy.
6. Conclusions
This study systematically examined the industrial subsidy policies implemented by the US between 2009 and 2017 by matching them with the affected Chinese HS-6 quantile subdivided export products. We systematically evaluated the impact of US subsidies on China’s products entering the US market using the panel first order difference and 2SLS methods. We drew the following conclusions. First, overall, the US subsidy policy has a significant negative spillover effect on the entry of Chinese exports in the US market. Second, US subsidies affect only China’s mid- and high-tech exports to the US. There is no significant negative impact on resource-based and low-tech products. Third, we examined the mechanism and found that subsidies reduce the export prices of mid- and high-tech products in the US, and the negative impact on China’s mid- and high-tech products entering the US market is greater due to the lower export prices of US products. Fourth, from the perspective of implementation effects, US subsidies further improved the export competitiveness of its domestic high-tech products, which helped US firms develop international export markets and achieve economies of scale.
The Chinese government should make full use of the differential treatment given to developing countries by the WTO, formulate subsidy policies in accordance with international rules, and create an optimal environment for industrial development. We note that government subsidies should not be specific, while avoiding the goal of export performance and industrial substitution, and reduce the risk of retaliation in other countries. On this basis, the Chinese government strives to incubate more high-tech enterprises in China by formulating an efficient and reasonable subsidy policy framework system, while accelerating the optimization and adjustment of the economic structure and its transformation and upgrading.
We studied the quantitative evaluations of subsidy policies, and further examined the robustness and endogeneity of the results. The study design can be applied to analyze the impacts of other trade policies. However, due to the lack of information on subsidy bills around the world, we have analyzed neither the spillover effects of US subsidies on other countries nor the responses of these countries to US. Besides. We also did not consider the heterogeneity of export firms. These important questions transcend our resources and are left for future work.
Author Contributions
Conceptualization, Y.L. and K.W.; methodology, K.W.; software, K.W.; validation, Y.L., Y.T. and K.W.; formal analysis, K.W.; investigation, Y.L.; resources, Y.T.; data curation, Y.L.; writing—original draft preparation, Y.L. and K.W.; writing—review and editing, Y.L. and K.W.; visualization, Y.L.; supervision, Y.T. All authors have read and agreed to the published version of the manuscript.
Funding
This research was funded by the MOE (Ministry of Education in China) Project of Humanities and Social Sciences (20YJC790043). The APC was funded by the fundamental research funds for the central universities.
Acknowledgments
We are grateful to the anonymous reviewers for their very helpful comments.
Conflicts of Interest
The authors declare no conflict of interest. The funders had no role in the design of the study; in the collection, analyses, or interpretation of data; in the writing of the manuscript, or in the decision to publish the results.
References
- Andrew, M.; Lihong, M.; Kiawu, J.; Do, U.S. Cotton Subsidies Affect Competing Exporters? An Analysis of Import Demand in China. J. Agric. Appl. Econ. 2012, 44, 235–249. [Google Scholar]
- Bown, C.; Rachel, M. U.S.-Japan and U.S.-China Trade Conflict: Export Growth, Reciprocity, and the International Trading System; World Bank Policy Research Working Papers No.5102; World Bank: Washington, DC, USA, 2009. [Google Scholar]
- Bernard, A.B.; Jensen, J.B. Why Some Firms Export. Rev. Econ. Stat. 2004, 86, 561–569. [Google Scholar] [CrossRef]
- Das, S.; Roberts, M.; Tybout, J. Market Entry Costs, Producer Heterogeneity, and Export Dynamics. Econometrica 2007, 75, 837–873. [Google Scholar] [CrossRef] [Green Version]
- Martincus, V.; Carballo, J. Is export promotion effective in developing countries? Firm-level evidence on the intensive and the extensive margins of exports. J. Int. Econ. 2008, 76, 89–106. [Google Scholar] [CrossRef] [Green Version]
- Pellegrini, G.; Muccigrosso, T. Do subsidized new firms survive longer? Evidence from a counterfactual approach. Reg. Stud. 2017, 51, 1–11. [Google Scholar] [CrossRef]
- Burger, A.; Rojec, M. Impotence of crisis-motivated subsidization of firms: The case of Slovenia. East. Eur. Econ. 2018, 56, 122–148. [Google Scholar] [CrossRef]
- Criscuolo, C.; Martin, R.; Overman, H.G.; Reenen, J.V. Some Causal Effects of an Industrial Policy. Am. Econ. Rev. 2019, 109, 48–85. [Google Scholar] [CrossRef] [Green Version]
- Schwartz, G.; Clements, B. Government Subsidies. J. Econ. Surv. 1999, 13, 119–148. [Google Scholar] [CrossRef]
- De Castris, M.; Pellegrini, G. Evaluation of spatial effects of capital subsidies in the south of Italy. Reg. Stud. 2012, 46, 525–538. [Google Scholar] [CrossRef]
- Cerqua, A.; Pellegrini, G. Do Subsidies to Private Capital Boost Firms’ Growth? A Multiple Regression Discontinuity Design Approach. J. Public Econ. 2014, 109, 114–126. [Google Scholar] [CrossRef]
- Cerqua, A.; Pellegrini, G. Industrial policy evaluation in the presence of spillovers. Small Bus. Econ. 2017, 49, 671–686. [Google Scholar] [CrossRef] [Green Version]
- Mariani, M.; Mealli, F. The effects of R&D subsidies to small and medium-sized enterprises. Evidence from a regional program. Ital. Econ. J. 2018, 4, 249–281. [Google Scholar]
- Görg, H.; Michael, H.; Strobl, E. Grant support and exporting activity. Rev. Econ. Stat. 2008, 90, 168–174. [Google Scholar] [CrossRef] [Green Version]
- Kirchweger, S.; Kantelhardt, J.; Leisch, F. Impacts of the government-supported investments on the economic farm performance in Austria. Agric. Econ. 2015, 61, 343–355. [Google Scholar] [CrossRef] [Green Version]
- Bertoni, F.; Martí, J.; Reverte, C. The impact of government-supported participative loans on the growth of entrepreneurial ventures. Res. Policy 2019, 48, 371–384. [Google Scholar] [CrossRef]
- Santos, A. Do selected firms show higher performance? The case of Portugal’s innovation subsidy. Struct. Chang. Econ. Dyn. 2019, 50, 39–50. [Google Scholar] [CrossRef]
- Nemethova, V.; Siranova, M.; Sipikal, M. Public support for firms in lagging regions—Evaluation of innovation subsidy in Slovakia. Sci. Public Policy 2019, 46, 173–183. [Google Scholar] [CrossRef]
- Helmers, C.; Trofimenko, N. The Use and Abuse of Export Subsidies: Evidence from Colombia. World Econ. 2013, 36, 465–486. [Google Scholar] [CrossRef]
- Karhunen, H.; Huovari, J. R&D subsidies and productivity in SMEs. Small Bus. Econ. 2015, 45, 805–823. [Google Scholar]
- Bernini, C.; Cerqua, A.; Pellegrini, G. Public subsidies, TFP and efficiency: A tale of complex relationships. Res. Policy 2017, 46, 751–767. [Google Scholar] [CrossRef] [Green Version]
- Girma, S.; Görg, H.; Wagner, W. Subsidies and Exports in Germany. First Evidence from Enterprise Panel Data. Appl. Econ. Q. 2009, 55, 179–195. [Google Scholar] [CrossRef]
- Bernini, C.; Pellegrini, G. How are growth and productivity in private firms affected by public subsidy? Evidence from a regional policy. Reg. Sci. Urban Econ. 2011, 41, 253–265. [Google Scholar] [CrossRef]
- Kalouptsidi, M. Detection and Impact of Industrial Subsidies: The Case of Chinese Shipbuilding. Rev. Econ. Stud. 2018, 85, 1111–1158. [Google Scholar] [CrossRef]
- Henn, C.; McDonald, B. Crisis Protectionism: The Observed Trade Impact. IMF Econ. Rev. 2014, 62, 77–118. [Google Scholar] [CrossRef]
- Fontagné, L.; Orefice, G. Let’s Try Next Door: Technical Barriers to Trade and Multi-destination Firms. Eur. Econ. Rev. 2018, 101, 643–663. [Google Scholar] [CrossRef] [Green Version]
- MccGwire, J. A Game Theory Analysis of Donald Trump’s Proposed Tariff on Chinese Exports. Stud. Econ. Rev. 2018, 31, 69–77. [Google Scholar]
- Fajgelbaum, P.D.; Goldberg, P.K.; Kennedy, P.J.; Khandelwal, A.K. The Return to Protectionism. Q. J. Econ. 2020, 135, 1–55. [Google Scholar] [CrossRef] [Green Version]
Figure 1.
US industrial subsidy measures from 2009 to 2018 (data source: Global Trade Alert Database).
Figure 1.
US industrial subsidy measures from 2009 to 2018 (data source: Global Trade Alert Database).


Table 1.
US Industrial Subsidy Policies between 2009 and 2018.
| Rank | Subsidy Type | Number | Rank | Subsidy Type | Number |
|---|---|---|---|---|---|
| 1 | Funding for localization of public procurement | 335 | 9 | Capital injection and equity acquisition | 3 |
| 2 | Tax or social insurance relief | 139 | 10 | loan guarantee | 3 |
| 3 | Financial grant | 87 | 11 | state assistance | 2 |
| 4 | State loan | 30 | 12 | production subsidy | 2 |
| 5 | Public procurement localization | 8 | 13 | Differential treatment in public procurement | 2 |
| 6 | Localization incentive | 5 | 14 | price support | 1 |
| 7 | Public procurement access | 5 | 15 | export subsidy | 1 |
| 8 | Physical support | 4 | 16 | Localized incentives for labor employment | 1 |
Data source: Global Trade Alert Database.
Table 2.
Impact of US Industrial Subsidies on Chinese Exports to the US Market: Overall Results.
| FD | FD | FD | FD | FD | |
|---|---|---|---|---|---|
| ln(cn_export) | ln(cn_export) | ln(cn_export) | ln(cn_export) | ln(cn_export) | |
| subsidy | −0.034 | −0.137 *** | −0.157 *** | −0.158 *** | −0.158 *** |
| (0.027) | (0.029) | (0.050) | (0.049) | (0.049) | |
| tariff | −0.181 *** | −0.179 *** | |||
| (0.050) | (0.050) | ||||
| non-tariff | −0.145 | ||||
| (0.131) | |||||
| year | no | yes | yes | yes | yes |
| industry*year | no | no | yes | yes | yes |
| N | 24,248 | 24,248 | 24,248 | 24,248 | 24,248 |
| R2(%) | 0.00 | 2.16 | 7.32 | 7.37 | 7.37 |
Note. *, **, and *** indicate significance at the 1%, 5%, and 10% levels, respectively.
Table 3.
Impact of US Industrial Subsidies on Chinese Exports to the US Market: Robustness and Endogeneity Tests.
Table 3.
Impact of US Industrial Subsidies on Chinese Exports to the US Market: Robustness and Endogeneity Tests.
| FD | FD | FE | 2SLS-FD | 2SLS-FD | |
|---|---|---|---|---|---|
| ln(cn_export) | ln(cn_export) | ln(cn_export) | ln(cn_export) | ln(cn_export) | |
| subsidy_num | −0.138 *** | −0.137 *** | −0.117 *** | ||
| (0.045) | (0.045) | (0.037) | |||
| subsidy | −0.267 ** | −0.206 * | |||
| (0.123) | (0.122) | ||||
| tariff | −0.176 *** | −0.251 *** | −0.179 *** | ||
| (0.050) | (0.071) | (0.050) | |||
| non-tariff | 0.045 | 0.159 | −0.045 | ||
| (0.131) | (0.184) | (0.129) | |||
| first stage estimation | |||||
| ivsubsidy | 0.525 *** | 0.536 *** | |||
| (0.028) | (0.027) | ||||
| product | no | no | yes | no | no |
| year | yes | yes | yes | yes | yes |
| industry*year | yes | yes | yes | yes | yes |
| Underidentification test | 172.46 *** | 173.33 *** | |||
| Weak identification test | 349.80 *** | 382.72 *** | |||
| N | 24,248 | 24,248 | 24,060 | 24,248 | 24,248 |
| R2(%) | 7.34 | 7.39 | 92.34 | 7.30 | 7.36 |
Note. *, **, and *** indicate significance at the 1%, 5%, and 10% levels, respectively.
Table 4.
Impact of US Subsidies on Chinese Exports to the U.S. Market: Estimates by Industry.
| FD | FD | FD | FD | |
|---|---|---|---|---|
| resource | manufacture | low-tech | mid-high tech | |
| cn_export | cn_export | cn_export | cn_export | |
| subsidy | −0.295 | −0.152 *** | −0.031 | −0.175 *** |
| (0.480) | (0.048) | (0.055) | (0.056) | |
| tariff | −0.124 | −0.192 *** | −0.205 ** | −0.182 *** |
| (0.165) | (0.053) | (0.090) | (0.064) | |
| nontariff | −0.074 | −0.147 | −0.070 | −0.405 |
| (0.208) | (0.173) | (0.154) | (0.545) | |
| year | yes | yes | yes | yes |
| industry*year | yes | yes | yes | yes |
| N | 3117 | 21131 | 7391 | 13740 |
| R2(%) | 13.45 | 6.25 | 6.94 | 5.98 |
Note. *, **, and *** indicate significance at the 1%, 5%, and 10% levels, respectively.
Table 5.
Impact of US Subsidies on Chinese Exports to the US Market: Robustness and Endogenous Tests.
Table 5.
Impact of US Subsidies on Chinese Exports to the US Market: Robustness and Endogenous Tests.
| FD | FD | FD | FD | 2SLS−FD | 2SLS−FD | 2SLS−FD | 2SLS−FD | |
|---|---|---|---|---|---|---|---|---|
| resource | manufacture | low tech | mid−high tech | resource | manufacture | low tech | mid−high tech | |
| cn_export | cn_export | cn_export | cn_export | cn_export | cn_export | cn_export | cn_export | |
| subsidy | −1.465 | −0.137 | 0.435 | −0.206 * | ||||
| (1.205) | (0.110) | (0.387) | (0.115) | |||||
| subsidy_num | −0.365 | −0.130 *** | −0.032 | −0.153 *** | ||||
| (0.429) | (0.045) | (0.047) | (0.050) | |||||
| tariff | −0.124 | −0.189 *** | −0.206 ** | −0.178 *** | −0.131 | −0.191 *** | −0.208 ** | −0.183 *** |
| (0.165) | (0.053) | (0.090) | (0.063) | (0.161) | (0.052) | (0.088) | (0.063) | |
| nontariff | −0.074 | −0.146 | −0.070 | −0.404 | −0.079 | −0.146 | −0.070 | −0.406 |
| (0.208) | (0.173) | (0.154) | (0.544) | (0.199) | (0.171) | (0.151) | (0.541) | |
| first stage estimation | ||||||||
| ivsubsidy | 0.658 *** | 0.532 *** | 0.289 *** | 0.592 *** | ||||
| (0.105) | (0.028) | (0.066) | (0.030) | |||||
| year | yes | yes | yes | yes | yes | yes | yes | yes |
| industry*year | yes | yes | yes | yes | yes | yes | yes | yes |
| Underidentification test | 11.87 *** | 162.55 *** | 13.48 *** | 150.48 *** | ||||
| Weak identification test | 39.21 *** | 360.43 *** | 18.92 *** | 383.69 *** | ||||
| N | 3117 | 21,131 | 7391 | 13,740 | 3117 | 21,131 | 7391 | 13,740 |
| R2(%) | 13.49 | 6.27 | 6.94 | 6.02 | 12.90 | 6.25 | 6.72 | 5.98 |
Note. *, **, and *** indicate significance at the 1%, 5%, and 10% levels, respectively.
Table 6.
The Impact of US Subsidies on Chinese Exports to the US Market: Price Mechanism.
| FD | FD | FD | FD | 2SLS-FD | 2SLS-FD | 2SLS-FD | 2SLS-FD | |
|---|---|---|---|---|---|---|---|---|
| resource | manufacture | low-tech | mid–high tech | resource | manufacture product | low-tech | mid–high tech | |
| us_price | us_price | us_price | us_price | cn_export | cn_export | cn_export | cn_export | |
| Subsidy | −0.001 | −0.098 * | 0.000 | −0.119 * | 0.125 | −0.178 | 0.015 | −0.243 ** |
| (0.000) | (0.055) | (0.000) | (0.067) | (0.225) | (0.116) | (2.815) | (0.122) | |
| Price*Subsidy | 2.087 | 0.004 ** | −3.996 | 0.004 ** | ||||
| (3.750) | (0.002) | (35.919) | (0.002) | |||||
| Tariff | −0.000 | −0.228 *** | −0.229 *** | −0.230 *** | ||||
| (0.000) | (0.059) | (0.089) | (0.079) | |||||
| Nontariff | −0.000 | −0.204 | −0.078 | −0.863 | ||||
| (0.000) | (0.199) | (0.154) | (0.917) | |||||
| Year | yes | yes | yes | yes | yes | yes | yes | yes |
| Industry*Year | yes | yes | yes | yes | yes | yes | yes | yes |
| Underidentification test | 1.23 | 148.04 *** | 13.07 *** | 136.43 *** | ||||
| Weak identification test | 3.08 *** | 173.98 *** | 9.32 *** | 188.75 *** | ||||
| N | 2699 | 16775 | 6750 | 10025 | 2699 | 16775 | 6750 | 10025 |
| R2(%) | 3.36 | 0.69 | 6.25 | 0.70 | 12.90 | 6.83 | 7.05 | 6.68 |
Note. *, **, and *** indicate significance at the 1%, 5%, and 10% levels, respectively.
Table 7.
Impact of US Subsidies on US Products Entering International Export Markets.
| FD | FD | FD | FD | FD | FD | FD | FD | |
|---|---|---|---|---|---|---|---|---|
| resource | manufacture | low-tech | mid–high tech | resource | manufacture | low tech | mid–high tech | |
| us_export | us_export | us_export | us_export | us_export | us_export | us_export | us_export | |
| Subsidy | −0.246 | 0.087 ** | 0.049 | 0.094 ** | ||||
| (0.179) | (0.040) | (0.073) | (0.045) | |||||
| Subsidy_num | −0.123 | 0.064 *** | 0.023 | 0.081 ** | ||||
| (0.090) | (0.024) | (0.032) | (0.031) | |||||
| Year | yes | yes | yes | yes | yes | yes | yes | yes |
| Industry*year | yes | yes | yes | yes | yes | yes | yes | yes |
| N | 2770 | 18,043 | 6945 | 11,098 | 2770 | 18,043 | 6945 | 11,098 |
| R2(%) | 17.62 | 10.45 | 14.50 | 8.82 | 17.62 | 10.46 | 14.50 | 8.84 |
Note. *, **, and *** indicate significance at the 1%, 5%, and 10% levels, respectively.
© 2020 by the authors. Licensee MDPI, Basel, Switzerland. This article is an open access article distributed under the terms and conditions of the Creative Commons Attribution (CC BY) license (http://creativecommons.org/licenses/by/4.0/).
Share and Cite
MDPI and ACS Style
Lou, Y.; Tian, Y.; Wang, K. The Spillover Effect of US Industrial Subsidies on China’s Exports. Sustainability 2020, 12, 2938. https://doi.org/10.3390/su12072938
AMA Style
Lou Y, Tian Y, Wang K. The Spillover Effect of US Industrial Subsidies on China’s Exports. Sustainability. 2020; 12(7):2938. https://doi.org/10.3390/su12072938
Chicago/Turabian StyleLou, Yanfeng, Yezhuang Tian, and Kai Wang. 2020. "The Spillover Effect of US Industrial Subsidies on China’s Exports" Sustainability 12, no. 7: 2938. https://doi.org/10.3390/su12072938
Note that from the first issue of 2016, this journal uses article numbers instead of page numbers. See further details here.