1. Introduction
The World Health Organization [
1,
2] classifies smoking as a chronic, progressive disease which is also “contagious” and considered as a neurobiotic addiction. More than 4.9 million people die every year due to diseases resulting from cigarette smoking and the use of tobacco-based products, as well as from passive smoking [
1,
2,
3,
4].
More recently, the focus on smoking-related health problems and neurocognitive deficits has expanded to include the study of “second-hand smoking” (also known as “passive smoking”—wherein a person who does not smoke, inhales tobacco smoke either via side-stream smoke or via smoke being blown directly into the face). Research in this area has focused on the exposure to second-hand smoke of those who have never smoked and examined a range of health problems associated with direct smokers. These include lung cancer, cardiovascular disease, as well as deficits in neurocognitive function. Second-hand smoke (SHS) contains at least 250 chemicals that are toxic or carcinogenic and, therefore, is considered as a human carcinogen [
5,
6,
7]. Worldwide, about 600 thousand people die annually as a result of exposure to SHS [
2]. More precisely, SHS exposure is estimated to be responsible for 3000 deaths from lung cancer in nonsmokers annually and 35,000 deaths from coronary heart disease, respiratory infections, asthma, sudden infant death syndrome, and other illnesses in children in the United States, annually [
7,
8]. When second-hand smoke (SHS) occurs outdoors, it is called outdoor tobacco smoke (OTS) [
9]. Where indoor smoking is not allowed, many smokers move outdoors to smoke and usually stay and smoke near building entrances. This means that people entering or exiting buildings may be exposed to smoke [
10]. OTS is just as dangerous as indoor SHS, depending on the amount of smoke, the proximity to smokers and the weather conditions (e.g., wind speed, wind direction, temperature) [
9]. In the United States, many colleges, universities, and health care campuses have addressed the health threat of OTS by implementing tobacco-free campus policies [
11,
12]. In the case of passive smokers, the risk of the occurrence of chronic obstructive pulmonary disease is significantly higher. By 2030, this disease is probably going to be one of the top three causes of mortality [
13,
14].
Passive smoking increases the risk for exposed people to develop cardiovascular diseases. Environmental tobacco smoke (ETS) is defined as tobacco smoke produced by an active smoker which is inhaled by nonsmokers [
15]. ETS contributes to endothelial function impairment and increases the oxidative stress [
16]. As demonstrated, significant exposure to ETS is associated with the presence of an increased level of C-reactive protein (CRP) which, in turn, explains the relationship between SHS and death due to cardiovascular reasons [
17,
18]. For instance, it affects the heart and blood vessels, increasing the risk of heart attack and stroke in nonsmokers. Some studies have linked SHS to mental and emotional changes, too. Workplaces are a major source of SHS exposure for many adults.
Using a nationwide network of monitoring sites, the U.S. Environmental Protection Agency (EPA) has developed ambient air quality trends for particulate matter (PM) [
19]. Under the Clean Air Act, the EPA sets and reviews national air quality standards for PM, such as PM10, PM2.5, PM1 and PM0.1, which correspond to the fraction of particles with aerodynamic diameters that are smaller than 10, 2.5, 1 and 0.1 µm, respectively. In comparison, the average diameter of a human hair equals 50–70 µm [
9]. The guideline value of PM10 recommended by the World Health Organization (WHO) [
20] to avoid increasing the risk of chronic respiratory diseases is 20 μg m
-3 on annual mean and 50 μg m
−3 on a 24 h mean.
The Occupational Safety and Health Administration (OSHA) and the National Institute for Occupational Safety and Health (NIOSH), i.e., federal agencies responsible for health and safety in workplaces, recognize that there are no known safe levels of SHS and recommend that exposures should be reduced to the lowest possible levels. Everyone can be exposed to SHS in public places where smoking is allowed, such as some restaurants, shopping centers, public transportation, parks, and schools according to the American Lung Association. However, to evaluate each particular condition of exposure, it is fundamental to understand the incidence of other sources of contamination, including PM2.5 produced by emissions from heating and road traffic [
21,
22,
23].
To evaluate the magnitude of this issue, this paper presents a study that was carried out within a university campus of a medium-sized university (around 10,000 students) located in northern Italy, where the exposure of students to passive smoking in outdoor areas of the campus was estimated. The survey was carried out within the university’s sustainability assessment program, which refers to the Italian Network of Universities for Sustainable Development (RUS). The goal was to study the concentrations of PM generated by cigarette smoke, which can cause damage to the health of students and staff of the university. The study was carried out near the entrances of the buildings, often used by students during breaks to take a breath of air and, for smokers, to light a cigarette.
Inside the campus there is an absolute smoking prohibition in all indoor environments, but there is no restriction outdoors, as in fact happens in all Italian campuses and in many places where indoor smoking is not allowed. In these cases, smokers often stay near the entrance of buildings, both because these points constitute the closest point with respect to the interior of the building, and because at the entrances there are often containers for waste and ashtrays. The entrances are often equipped with covers or canopies to protect the entrance from the rain. The purpose of this study was to demonstrate that, in these conditions, the exposure from OTS is extremely high and that it is necessary to introduce internal rules on the campuses that limit the density of smokers near the entrances of the buildings.
2. Materials and Methods
2.1. Study Area
The area of study is located in the city of Varese (northern Italy) in the Campus Bizzozero, a public area dedicated to the offices, study rooms and classrooms of the university. In particular, the research was carried out near the entrance of a building (Morselli Pavillion) usually characterized by a high density of people. The external area near the entrance is covered by a canopy.
2.2. Analytical Equipment
A light scattering micro dust analyzer (Dust Monitor 1.108, GRIMM Aerosol Technik Ainring GmbH & Co. KG, Germany) was used for the analysis of the particles. The instrument calculates the number of particles that pass through the sampled air and measures the quantity, giving the mass concentration per cubic meter of incoming air as output. In particular, the instrument analyzes the PM10, PM2.5 and PM1 fractions. The gravimetric coefficient used for the analyses is 1; no corrective factors have been made to the measurements given by the instrument. The instrument was calibrated in the laboratory by the supplier of the instrument in order to be able to compare the data collected with other reference data, such as the WHO guideline for daily mean PM10 concentration.
2.3. Sampling Methodology
The study was carried out in the morning, during the lunch break or coffee break, approximately between 10:00 a.m. and 2:00 p.m., for a total time of about 45 min for each campaign. A total of four sampling campaigns were carried out, three in dry weather conditions and one in rainy conditions. The experiments were carried out over nine different days. A total of 17 static, 8 dynamic, and 9 background samplings were available for analysis.
Some students (about a dozen) collaborated on the first analysis; they presented themselves for the analysis to “smoke a cigarette” and therefore to contribute to the research. It should be noted that the students showed up non-continuously in the time necessary for the analysis, and contributed in part to the surveys (often smoking a cigarette takes less than 2 min). The data collected during the campaign in which the volunteers are present were useful for comparing the values relating to a large number of smokers with respect to conditions in which the number of smokers is variable and random.
The study was not carried out with a planned number of smokers in order to evaluate PM concentrations under real conditions. The samplings were carried out with a minimum number of smokers of 2 and a maximum of 10 at the same time. The number was calculated in terms of the presence of active smokers below the covered area without taking into account their distance from the position of the instrument. It is assumed that such variability in the number of smokers would be representative of real-world conditions during normal days at the university.
Measurements were made for a maximum duration of 3 min, collecting the concentration values every 6 s. The start and end of each measurement session never coincided univocally with the start and end of the detections. The distance of smokers was always more than 1.5 m from the dust analyzer and the exhaled smoke has never been conveyed directly to the instrument nozzle.
The dust analyzer was fed by its battery and remained on the right shoulder of a 1.80 m tall operator at a height of not less than 1.50 m. Cigarettes were not discriminated by type, and e-cigarette smokers were also sometimes included in the number of smokers. This choice is supported by the occasional presence of e-cigarette smokers during the surveys and by the fact that the exhalation of e-cigarette smoke represents a non-negligible source of PM2.5, polycyclic aromatic hydrocarbons, volatile organic compounds, metals and ultrafine particles [
24].
The results obtained were analyzed in terms of average, minimum and maximum concentration, evaluating the influence of the maximum number of smokers present during the sampling. The most important value relates to the average concentration, as it represents the factor that can be compared to the guideline value of 50 µg m
−3 for the 24 h mean PM10 concentration provided by the WHO [
20]. It is important to consider that the exposure episodes investigated in this paper only contribute to the average daily exposure of the participants, since such episodes occur for short periods of time and could not be considered as representative of the whole daily exposure of the participants. However, acute exposure to PM concentrations is expected to cause both respiratory [
25] and cardiovascular issues [
26].
During the days with dry weather, the average temperature was 17 ± 2 °C, in the absence of wind. The relative humidity was 63% ± 3%, and the atmospheric pressure was equal to 1019 ± 1 mbar. During the rainy day, the temperature was 11.8 °C, with a 77% relative humidity. The wind speed was 3.2 km h−1, with a daily precipitation of 4.3 mm. The test was carried out during a rainfall episode.
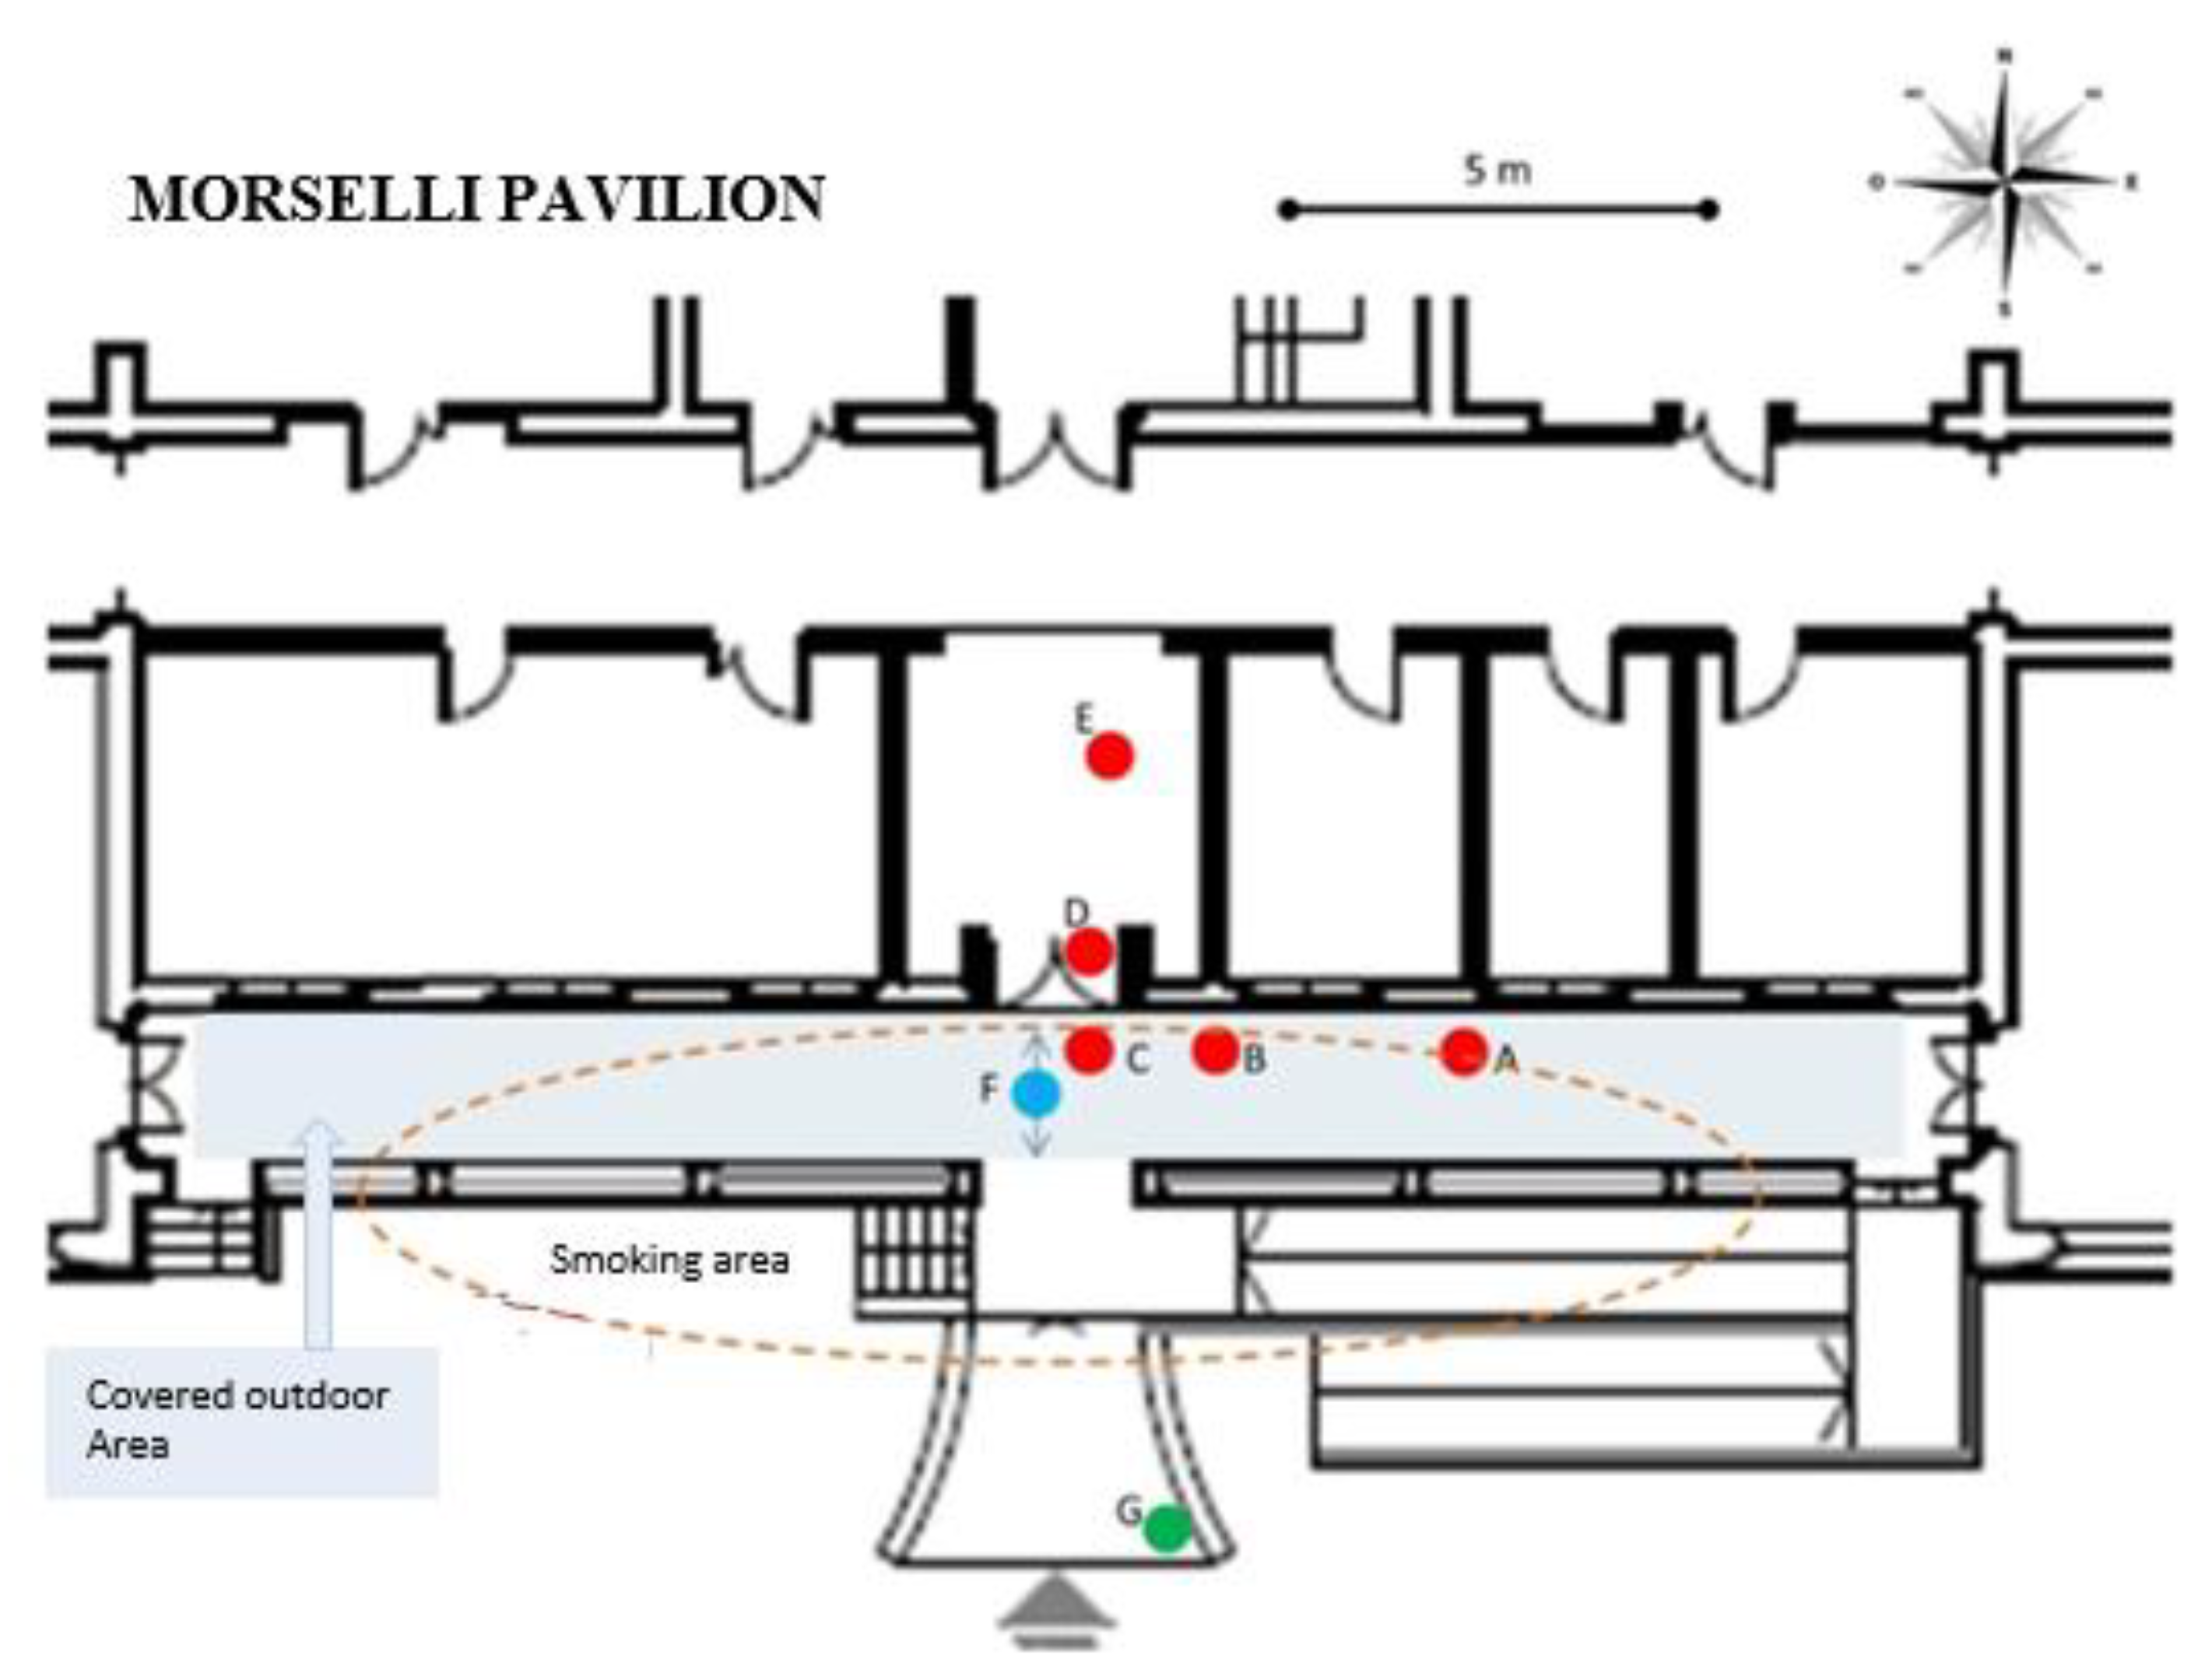
During each campaign, lasting between 2 and 5 min, a total of 7 sampling points were set (
Figure 1):
the first point (A) was set at a distance of about 4–5 m from the entrance, laterally from the entrance door;
the second point (B) at a distance of about 2 m from the entrance, always laterally from the entrance door and under the canopy;
the third point (C) was set out immediately in front of the entrance, leaving room for passage;
the fourth point (D) was located in the area between the two entrance doors of the building (semi-internal area), where smoking is forbidden;
the fifth point (E) was located inside the building, about 4 m from the entrance, with the doors kept open;
the sixth measurement session (F), unlike the previous ones, was performed in motion, at about one step per second, in front of the entrance, under the canopy and between the smokers;
the last point G was chosen to represent the environmental background, i.e., the measurement of PM10 and PM2.5 was carried out in the area outside the canopy (about 5 m away), with no smokers within 4–5 m. This last analysis is important as it allows obtaining a reference value to estimate how much the results recorded by the analyzer deviated from the background value of the environment.
Finally, an analysis was carried out in an indoor area free from smokers (office and corridors). These data are considered as data of reference for the smoke-free indoor area, in order to evaluate normal situations of PM10 concentrations in closed areas and they were evaluated by the same instrument in the same environmental conditions as the sampling date.
3. Results and Discussion
The experiments were carried out over 9 different days. A total of 17 static, 8 dynamic, and 9 background samplings were available for analysis. The mean level of PM2.5 observed in the presence of smokers was significantly higher than the background level (p = 0.0037). The geometric mean of PM2.5 in the background condition was 8.7 (GSD = 1.8) μg m−3. The geometric mean of the PM2.5 level in the static and dynamic measurements were 15.9 (GSD = 1.8) μg m−3, and 10.6 (GSD = 1.8) μg m−3, respectively.
The data obtained are grouped for each type of sampling. The environmental conditions, as specified in the methods, are the same for the three measurement campaigns (dry weather conditions) while they are different for the fourth (rainy weather conditions). Therefore, the comparison between the first three tests allows considering as variable only the number of smokers present. The fourth test was performed to evaluate if climatic conditions influence PM10 concentrations in the covered outdoor area.
Figure 2 shows the results related to the average PM10 concentrations in the environment during the four campaigns. A shown in
Figure 2, during the campaign that took place during the rainy day, PM10 concentrations are significantly lower. This can be attributed to the so-called washout effect, which is an important mechanism of pollutant removal in the atmosphere [
27]. Similarly, Feng and Wang [
28] found that particulate matter is lower in rainy days and attributed this to the wet deposition, which caused PM precipitation and removal from the atmosphere.
Background concentrations are influenced by local direct sources (road traffic, household heating and industrial activities), secondary PM formation and long-range transport of dust from the metropolitan area of Milan and the Po valley.
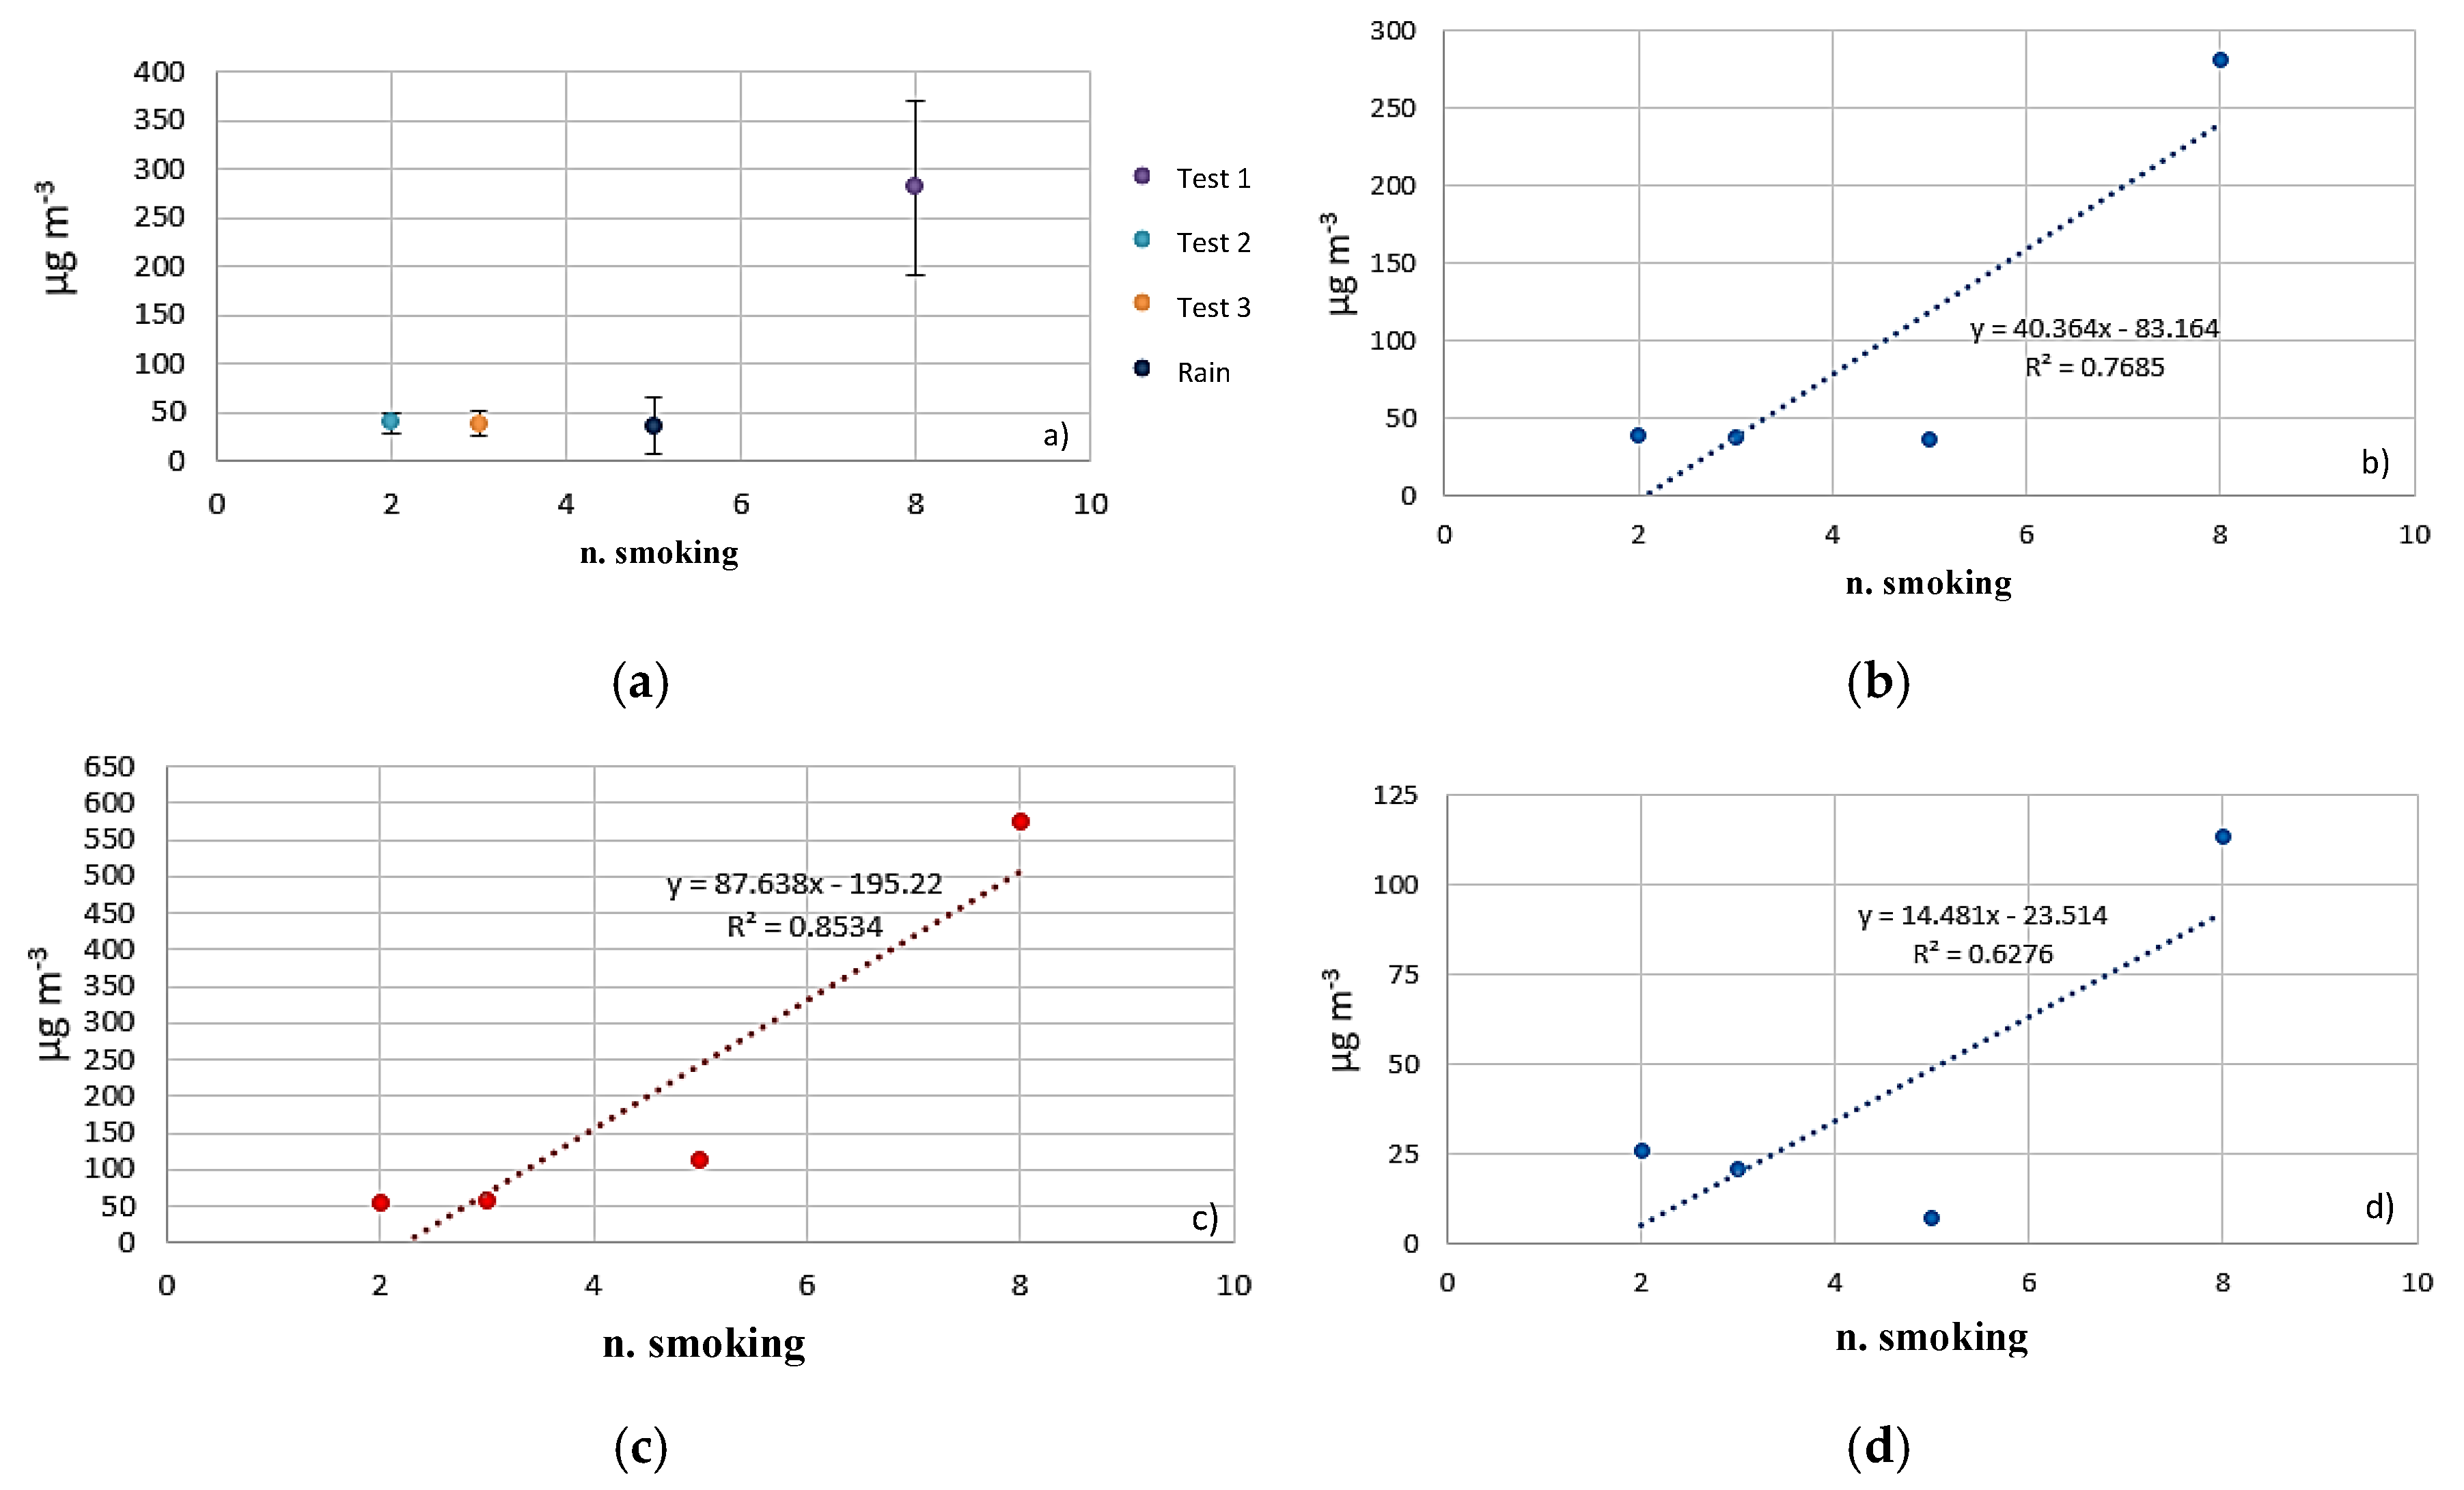
The results of the sampling carried out at point A, about 5 m from the entrance of the structure, are shown in
Figure 3. The average concentrations are always <50 µg m
-3 (
Figure 3a) even if an increasing trend with the number of smokers is visible (
Figure 3b). In particular, the PM10 concentrations caused by the smoking activity appear to be influenced by the climatic conditions. This can be proven by comparing the average PM10 values during rainy weather with the conditions in dry weather. This is more evident by comparing the minimum measured values of PM10 (
Figure 3d), which during the rainy weather were five times higher (average equal to about 32 µg m
−3) than the environmental conditions (average equal to approximately 6 µg m
−3). The minimum and maximum values seem not to depend on the number of smokers present below the structure, and therefore there may be a dependence on the distance from the analysis tool.
When approaching the front door, the conditions vary, even slightly, with an increase in PM10 concentrations compared to the previous case (
Figure 4a). In this case, PM10 concentrations exceed 50 µg m
−3, with a trend always positive as the number of smokers below the canopy increases (
Figure 4b). Furthermore, even in this case, during the rainy weather there is a significant increase in the minimum concentrations of PM10 (average equal to about 28 µg m
−3), which are five times higher than the background concentrations, even if they are lower than the WHO guideline value for the 24 h average (
Figure 4d).
In front of the entrance, PM10 concentrations were found to be higher than in the two previous cases (
Figure 5a), with average concentrations >100 µg m
−3. This concentration is considered to correspond to PM10 concentrations measured in the atmosphere of the center of big cities, such as in Athens. Chaloulakou et al. [
29] measured, for example, an average PM10 concentration of 75 μg m
−3. The values measured in the present study show the severity of the atmospheric environment near the building entrances if smoking is allowed exactly outside the building. The higher concentrations near the building entrances can be attributed to the allocation of the baskets for the collection of cigarette butts, located exactly in front of the entrance of the building. Similar to these findings are the results reported by Sureda et al. [
30] who measured PM2.5 at various indoor and outdoor locations, in which smoking is prohibited inside but allowed exactly outside the building.
Furthermore, the graph in
Figure 5d shows that the minimum concentrations were significantly higher in unstable weather conditions (average equal to about 42 µg m
−3), and seven times higher than background levels. In analogy with the previous sampling points, the trend was determined by the number of smokers near the covered outdoor area. Finally, the maximum concentrations were considerably high, even >250 µg m
−3, and in any case always >50 µg m
−3 (
Figure 5c).
Values similar to the previous case were measured inside the building, just beyond the entrance door (
Figure 6). This is a critical area as it is affected by the air flow entering the building and by the small width of the corridor, which do not allow the air to recirculate.
Figure 6a shows that the average concentrations increased considerably (even exceeding 200 µg m
−3) with a significant number of smokers around, indicating that SHS from outdoors drifts to the adjacent indoors, as also reported by Sureda et al. [
30]. As in the previous cases, an increasing trend of concentrations with the number of smokers is visible (
Figure 6b). Particularly serious was the condition in which 10 smokers were simultaneously present. In this case, the minimum concentrations were > 60 µg m
−3 (
Figure 6d), and the maximum concentrations exceeded 600 µg m
−3 (
Figure 6c). In this test, the smoking students were all near the baskets for the collection of cigarette butts and near the entrance, causing an increment of the PM10 concentrations near the instrument.
In the area just outside the entrance, PM10 concentrations data were collected in a dynamic manner. The results are comparable to those obtained at point D in the semi-closed area beyond the entrance door. The average concentrations were always close to 50 µg m
−3, with concentrations >250 µg m
−3 with a number of smokers equal to 8 (
Figure 7a). In particular, in test 1 smokers were standing around the entrance and the dynamic analysis was carried out by walking in the middle of the 8 smokers. In this last case, maximum (
Figure 7c) and minimum (
Figure 7d) concentrations were >550 µg m
-3 and >100 µg m
−3, respectively. However, even in the remaining cases, the maximum concentrations were >50 µg m
-3 (
Figure 7c) and up to 110 µg m
−3 in the case with 5 participants (rainy day).
Finally,
Figure 8 shows the PM10 concentrations measured at the end of the entrance corridor (point E). In this case, PM10 concentrations were not affected by weather conditions, and this aspect should be considered as even more significant, since the background concentrations are significantly reduced thanks to rain (
Figure 8a). In fact, the increase in PM10 concentrations with respect to the environmental background is higher than in the previous cases. In addition, during the first three campaigns, the doors were kept open, while, in the fourth campaign, the doors were only opened during the passage of the students.
To compare the results with the outdoor measurement campaigns, PM10 concentrations were also measured inside the building, by placing the instrument inside an office and in the corridors of the building. In the office, the average PM10 concentrations measured were 5.1 ± 1.2 µg m
-3 (maximum and minimum values of 7.7 and 1.7 µg m
-3, respectively) while in the corridor the concentrations were 45 ± 3.3 µg m
−3 (maximum and minimum values of 50 and 3.9 µg m
-3, respectively), in a similar manner by Sureda et al., 2011 [
30] found a correlated of concentrations in halls with concentration in the main entrances (outdoors) for PM 2.5. The high PM10 concentrations inside the corridors can be justified by the presence of dust caused by the passage of students and by the use of chalks on classroom blackboards. However, a qualitative analysis on the composition of the PM collected on the filter of the dust analyzer would clarify the origin of the aerosol sampled. For instance, as reported by a study carried out in French schools [
31], the significant presence of calcium on PM10 by an elemental analysis may suggest the use of chalks as a dominant source of PM.
Compared to the data obtained at the entrance, the average concentrations are two to three times higher than the levels found in the corridors, and about ten to fifteen times higher when compared to an office (
Figure 8a).
Figure 8b shows that there is a positive trend between the number of smokers in the covered area near the entrance and the PM10 concentration, even in rainy conditions. This result is particularly significant, as it allows quantifying the persistence of PM that is pushed inside the building. Furthermore, in the third test an average value of PM10 equal to 132 µg m
−3 was found, i.e., almost three times higher than the average concentration found in the corridors. Finally, it is worth noting that the minimum concentration (
Figure 8d) is higher than the average levels found in the corridors and that the maximum concentration is even twice as high (
Figure 8c). The proximity of smokers to the front door seems to be crucial, because it causes sharp increases in PM10 concentrations in the internal areas. This is also in agreement with the review study by Sureda et al. [
32].
Similar observations and measurements are reported also in the study of Ruprecht et al. 2016 [
33], who studied the particulate matter concentrations in pedestrian streets where many people smoke. They measured PM10 values similar to those reported in the present study and, compared to values measured in high traffic roads, they found that at certain times of the day (i.e., from 12:00 p.m. to 6:00 p.m.) PM10 values were even higher than in high traffic roads. They therefore concluded that air quality is worse in a pedestrian area frequented by smokers compared with a high-traffic zone. These arguments and the results of the present study confirm that OTS must be prohibited in order to protect the population entering and exiting smoke-free buildings. This is especially noticeable concerning the test carried out during the rainy period, in which the doors were kept closed. During this test, PM10 concentrations were close to normal values, not being subject to variations due to the presence of smokers. Therefore, door opening and closing is a fundamental aspect to consider.


