Application of Fuzzy and Rough Sets to Environmental Zonation for Concrete Durability: A Case Study of Shaanxi Province, China

1
State Key Laboratory of Green Building in Western China, Xi’an University of Architecture and Technology, Xi’an 710055, China
2
School of Civil Engineering, Xi’an University of Architecture and Technology, Xi’an 710055, China
3
College of Materials Science and Engineering, Xi’an University of Architecture and Technology, Xi’an 710055, China
*
Author to whom correspondence should be addressed.
Sustainability 2020, 12(8), 3128; https://doi.org/10.3390/su12083128
Submission received: 13 March 2020
/
Revised: 6 April 2020
/
Accepted: 6 April 2020
/
Published: 13 April 2020
(This article belongs to the Special Issue Sustainable Construction II)
Abstract
:The durability of concrete structures is influenced by various factors, and the durability damage mechanism is different when the structure is in different environmental conditions. This will have implications for improving the durability of concrete structures and extending its service life if the special environmental condition is taken into account in the durability design. Aimed at the environmental zonation for concrete durability, this paper investigated the durability factors influencing concrete structures in Shaanxi Province, China, including atmospheric temperature, precipitation, corrosive gas, and acid rain. The variations of the above-mentioned factors were analyzed and the indexes of environmental zonation were proposed. According to the zoning principle, the weights of zoning indexes calculated using fuzzy rough sets were used to divide Shaanxi Province into three first-level zones, namely the Freeze-Thaw Cycle Zone, the Neutralization–Freeze-Thaw Interaction Zone, and the Neutralization Zone. These three zones were then subdivided into nine second-level zones. The main mechanism of concrete deterioration and the environmental characteristics of all zones were then analyzed. The method proposed in this paper puts forward clear zoning indexes and quantifies them, which can improve the quality and accuracy of the zoning results. Moreover, the research achievements are helpful for engineers to reduce the impact of the environment on structure and the maintenance cost during the structural service life to a certain extent.
1. Introduction
The design, construction, operation, and management of concrete structures are affected by its in-service environment to varying degrees [1]. Due to the various environmental conditions of concrete structures, the mechanism of durability deterioration is complex. For instance, carbonization [2], freeze-thaw damage [3,4,5], acid rain [6,7], and ion erosion [8,9,10,11,12] can directly affect the durability of concrete structures. It is necessary to take into account the in-service environmental condition when it comes to the design of new concrete structures and the evaluation and maintenance of existing concrete structures.
Durability environmental zonation is to divide a country or region into different zones according to the environmental conditions and their influence on the durability of concrete structures. Some durability design codes and standards, such as the Code for Design of Concrete Structures (GB 50010-2010) [13], the Standard for Design of Concrete Structure Durability (GB/T 50476-2019) [14], and the Eurocode 2: Design of concrete Structures (EN 1992-1-1:2004) [15], classify the service environment of concrete structures into different categories. However, some of the above-mentioned codes and most of the studies pay more attention to the measures of concrete durability, while not much attention is paid to the differences in the environment of different regions and the damage degree of the structure under the corrosive environment. In view of this, some scholars have studied the environmental zonation of concrete structures and acquired some achievements [16,17], or the economic impacts of sustainable vertical extension methods for existing underground spaces [18]. However, these studies did not select appropriate zoning indexes nor quantify them in the process of durability zonation. They mainly focused on the qualitative zonation according to the impact of the environment on the durability of concrete structures, which is subjective and insufficient to reflect the actual situation. If the durability design can be carried out according to the local environmental conditions and durability damage forms, the service life of the building can be prolonged, the maintenance cost can be reduced, and the life-cycle construction cost can be saved.
Taking Shaanxi Province in Northwest China for example, the influence of various environmental factors on the durability of concrete structures is analyzed, and the index of environmental zonation is determined on the basis of investigating and analyzing the environmental conditions and durability status of concrete structures. Based on fuzzy rough sets, the influence of environmental factors on structural durability will be obtained, and the environmental zoning map of Shaanxi Province for concrete durability will be achieved.
2. Analysis of Durability Environmental Conditions in Shaanxi Province
Shaanxi Province, located in Northwest China, is a long and narrow region with a varied topography. From north to south, it can be divided into three geomorphic areas: Northern Shaanxi, Guanzhong, and Southern Shaanxi. Southern Shaanxi has a sub-tropical and humid climate, Guanzhong and parts of Northern Shaanxi have a warm temperate and semi-humid climate, and Northern Shaanxi has a mid-temperate and semi-arid climate along the Great Wall [19].
The environmental factors affecting the durability of concrete structures in Shaanxi Province can be divided into two categories: (1) climatic conditions, namely atmospheric temperature, atmospheric humidity, etc., which are closely related to concrete carbonization and the freeze-thaw cycle; (2) erosion medium, including various corrosive gases in the atmosphere and ions dissolved in water. With the rapid economic development of Shaanxi Province, the acid rain is becoming more frequent and may be the most important erosion medium during the service period of the concrete structures.
This paper selected meteorological data of 93 counties and cities in Shaanxi Province, among which, 28 are in Southern Shaanxi, 40 in Guanzhong, and 25 in Northern Shaanxi. For the missing data of some counties and cities, the data of the surrounding counties and cities with similar environmental conditions were used. The developing trend of ambient temperature, relative humidity, corrosive gases, and acid rain were analyzed.
2.1. Atmospheric Temperature
2.1.1. Annual Average Temperature
The annual average temperature of Shaanxi Province is 13.7 °C, varying from south to north and east to west: 7~12 °C in Northern Shaanxi, 12~14 °C in Guanzhong, and 14~16 °C in Southern Shaanxi. In the last half century, the average annual temperature in Northern Shaanxi, Guanzhong, and Southern Shaanxi have shown a fluctuating upward trend (Figure 1), and its variation coefficient is between 0.03 and 0.07 (Table 1) [20]. For Northern Shaanxi, the annual average temperature peaked in 1998 (10.63 °C), and the minimum value is in 1967 (7.97 °C). For Guanzhong, the annual average temperature reached the highest value (13.31 °C) in 2016 and the lowest value (11.13 °C) in 1984. For Southern Shaanxi, the annual average temperature showed its highest value (14.61 °C) in 1998, and its lowest value (12.25 °C) in 1967. The variations of the annual average temperature of Northern Shaanxi, Guanzhong, and Southern Shaanxi were highest in the early 21st century, while Northern Shaanxi reached the lowest in the 1960s and the other two regions hit a record low in the 1980s.
In order to present the regional distribution of annual average temperature, the annual average temperature is divided into 4 levels, as shown in Figure 2. It can be seen that the annual average temperature of most counties and districts in Northern Shaanxi is below 10 °C, and that of Guanzhong and Southern Shaanxi is 12~14 °C and above 12 °C, respectively.
2.1.2. Average Monthly Temperature
As can be seen from the monthly average temperature distribution in the three regions of Shaanxi Province (Figure 3) [20]. The average temperature in January, February, and December in Northern Shaanxi was below 0 °C, while that in other months was above 0 °C and it is the highest in July reaching 22.28 °C. For Guanzhong, the average monthly temperature in January and December was below 0 °C, and that in July was the highest (24.88 °C), followed by June (23.18 °C) and August (23.58 °C). The average temperature in Southern Shaanxi is above 0 °C every month, with the lowest value in January (1.83 °C) and the highest value in July (25.01 °C). On the whole, the temperature changes in Northern Shaanxi, Guanzhong, and Southern Shaanxi are generally the same.
2.2. Precipitation
Shaanxi Province is located in mid-latitude, and the Qinling mountains traverse the south-central part of it. The climate in the south of Qinling mountains is humid, while that in the north is dry. The annual precipitation in Shaanxi has a significant regional characteristic, and it shows a fluctuating downward trend in the three regions (Figure 4) [20]. In Northern Shaanxi, the annual precipitation fluctuated greatly in 1960s, with the maximum value (746.3 mm) in 1964 and the minimum value (293.7 mm) in 1965. In Guanzhong and Southern Shaanxi, the annual precipitation fluctuated greatly from the 1970s to the 1980s, and reached its maximum value in 1983 (Guanzhong: 899.7 mm; South Shaanxi: 1273.7 mm) and the minimum value in 1997 (Guanzhong: 360.3 mm; Southern Shaanxi: 577.6 mm). In general, all regions suffered a downward trend in annual precipitation, with Southern Shaanxi experiencing the largest decline and Northern Shaanxi the smallest. The average decline of the whole province is 2.08 mm·a−1.
In order to demonstrate the spatial distribution of precipitation in Shaanxi Province, the annual precipitation was divided into three levels: 200~400 mm, 400~800 mm, and 800~1600 mm. As can be seen from Figure 5, the average annual precipitation in Southern Shaanxi is more than 800 mm, while that in Guanzhong and Northern Shaanxi is mostly between 400 and 800 mm, and in some counties and cities in Northern Shaanxi is less than 400 mm. In general, the annual average precipitation in Shaanxi Province varies from place to place, with more in the south and less in the north. This difference is mainly related to the topography and geomorphology of Shaanxi Province. The water vapor in the atmosphere of Shaanxi Province mainly comes from the Western Pacific Ocean and the Bay of Bengal, and it is blocked by the Qinling mountains, resulting in strong precipitation in its southern slope. Therefore, the precipitation in Southern Shaanxi is higher than that in Guanzhong and Northern Shaanxi.
2.3. Corrosive Gases in the Atmosphere
The investigation shows that atmospheric pollution in Shaanxi Province is mainly soot pollution. The exhaust gas from fuel combustion and production processes accounts for 74 percent and 20 percent of the total industrial exhaust gas respectively. The major pollutants in Shaanxi are sulfur dioxide, smoke, nitrogen oxides, and carbon monoxide, which tend to dissolve in water to form acid rain and affects the durability of buildings [21].
2.3.1. Carbon Dioxide
CO2 is one of the main causes of concrete carbonization and steel corrosion [22]. Shaanxi Province has witnessed rapid economic development in recent years, and overdependence on fossil energy has led to a continuous increase of carbon emissions. According to Figure 6, the annual growth rate of GDP of Shaanxi Province from 1995 to 2017 was 11.6%, and the carbon dioxide emissions increased year by year, from 7.544 × 10⁷ t in 1995 to 30.212 × 10⁷ t in 2017, with an annual growth rate of 6.8% [21]. The trend of carbon emissions and the growth of Gross Domestic Product (GDP) of Shaanxi are roughly the same. However, due to the high mobility of air and the absorption of vegetation, the atmospheric CO2 concentration does not increase significantly in spite of the increase of carbon emissions, and the province-wide variation of the CO2 concentration is relatively small.
2.3.2. Sulfur Dioxide and Nitrogen Dioxide
Sulfur dioxide (SO2) and nitrogen dioxide (NOx) in the air mainly come from industrial production processes, the burning of fossil fuels, and chemical decomposition in the soil [23,24]. In recent years, the rural industry with large biomass fuel consumption in Shaanxi Province is developing rapidly, while pollution control measures are relatively backward, leading to high corrosive gases emissions. If SO2 and NOx emissions exceed the environment’s capacity, acid rain may occur. Based on the data of the State Environmental Protection Administration shown in Figure 6 [21], the regional difference among the corrosive gas emissions are closely related to economic development and environmental governance. Before 2011, the SO2 and NOx emissions show an upward trend with a small fluctuation, and this is consistent with the rapid development of the Shaanxi economy. Thanks to the improvement of environmental protection measures and the governance technology, the corrosive gas emissions have been significantly reduced since 2011.
In terms of geographical distribution, the air pollution in large and medium-sized cities in Guanzhong is serious, with average SO2 emissions over 3.5 t/km2, among which, Xi’an, Weinan, Baoji, Xianyang, and Tongchuan are the major air pollution areas. The average SO2 emissions in Northern Shaanxi were 0.3~3.5 t/km2, and those in Southern Shaanxi were less than 0.3 t/km2. In addition, Yanchang in Northern Shaanxi is located in the basin valley, so the pollutants are not easy to spread. As for Yulin, the air quality is also poor due to the cold climate and long heating period.
2.4. Acid Rain
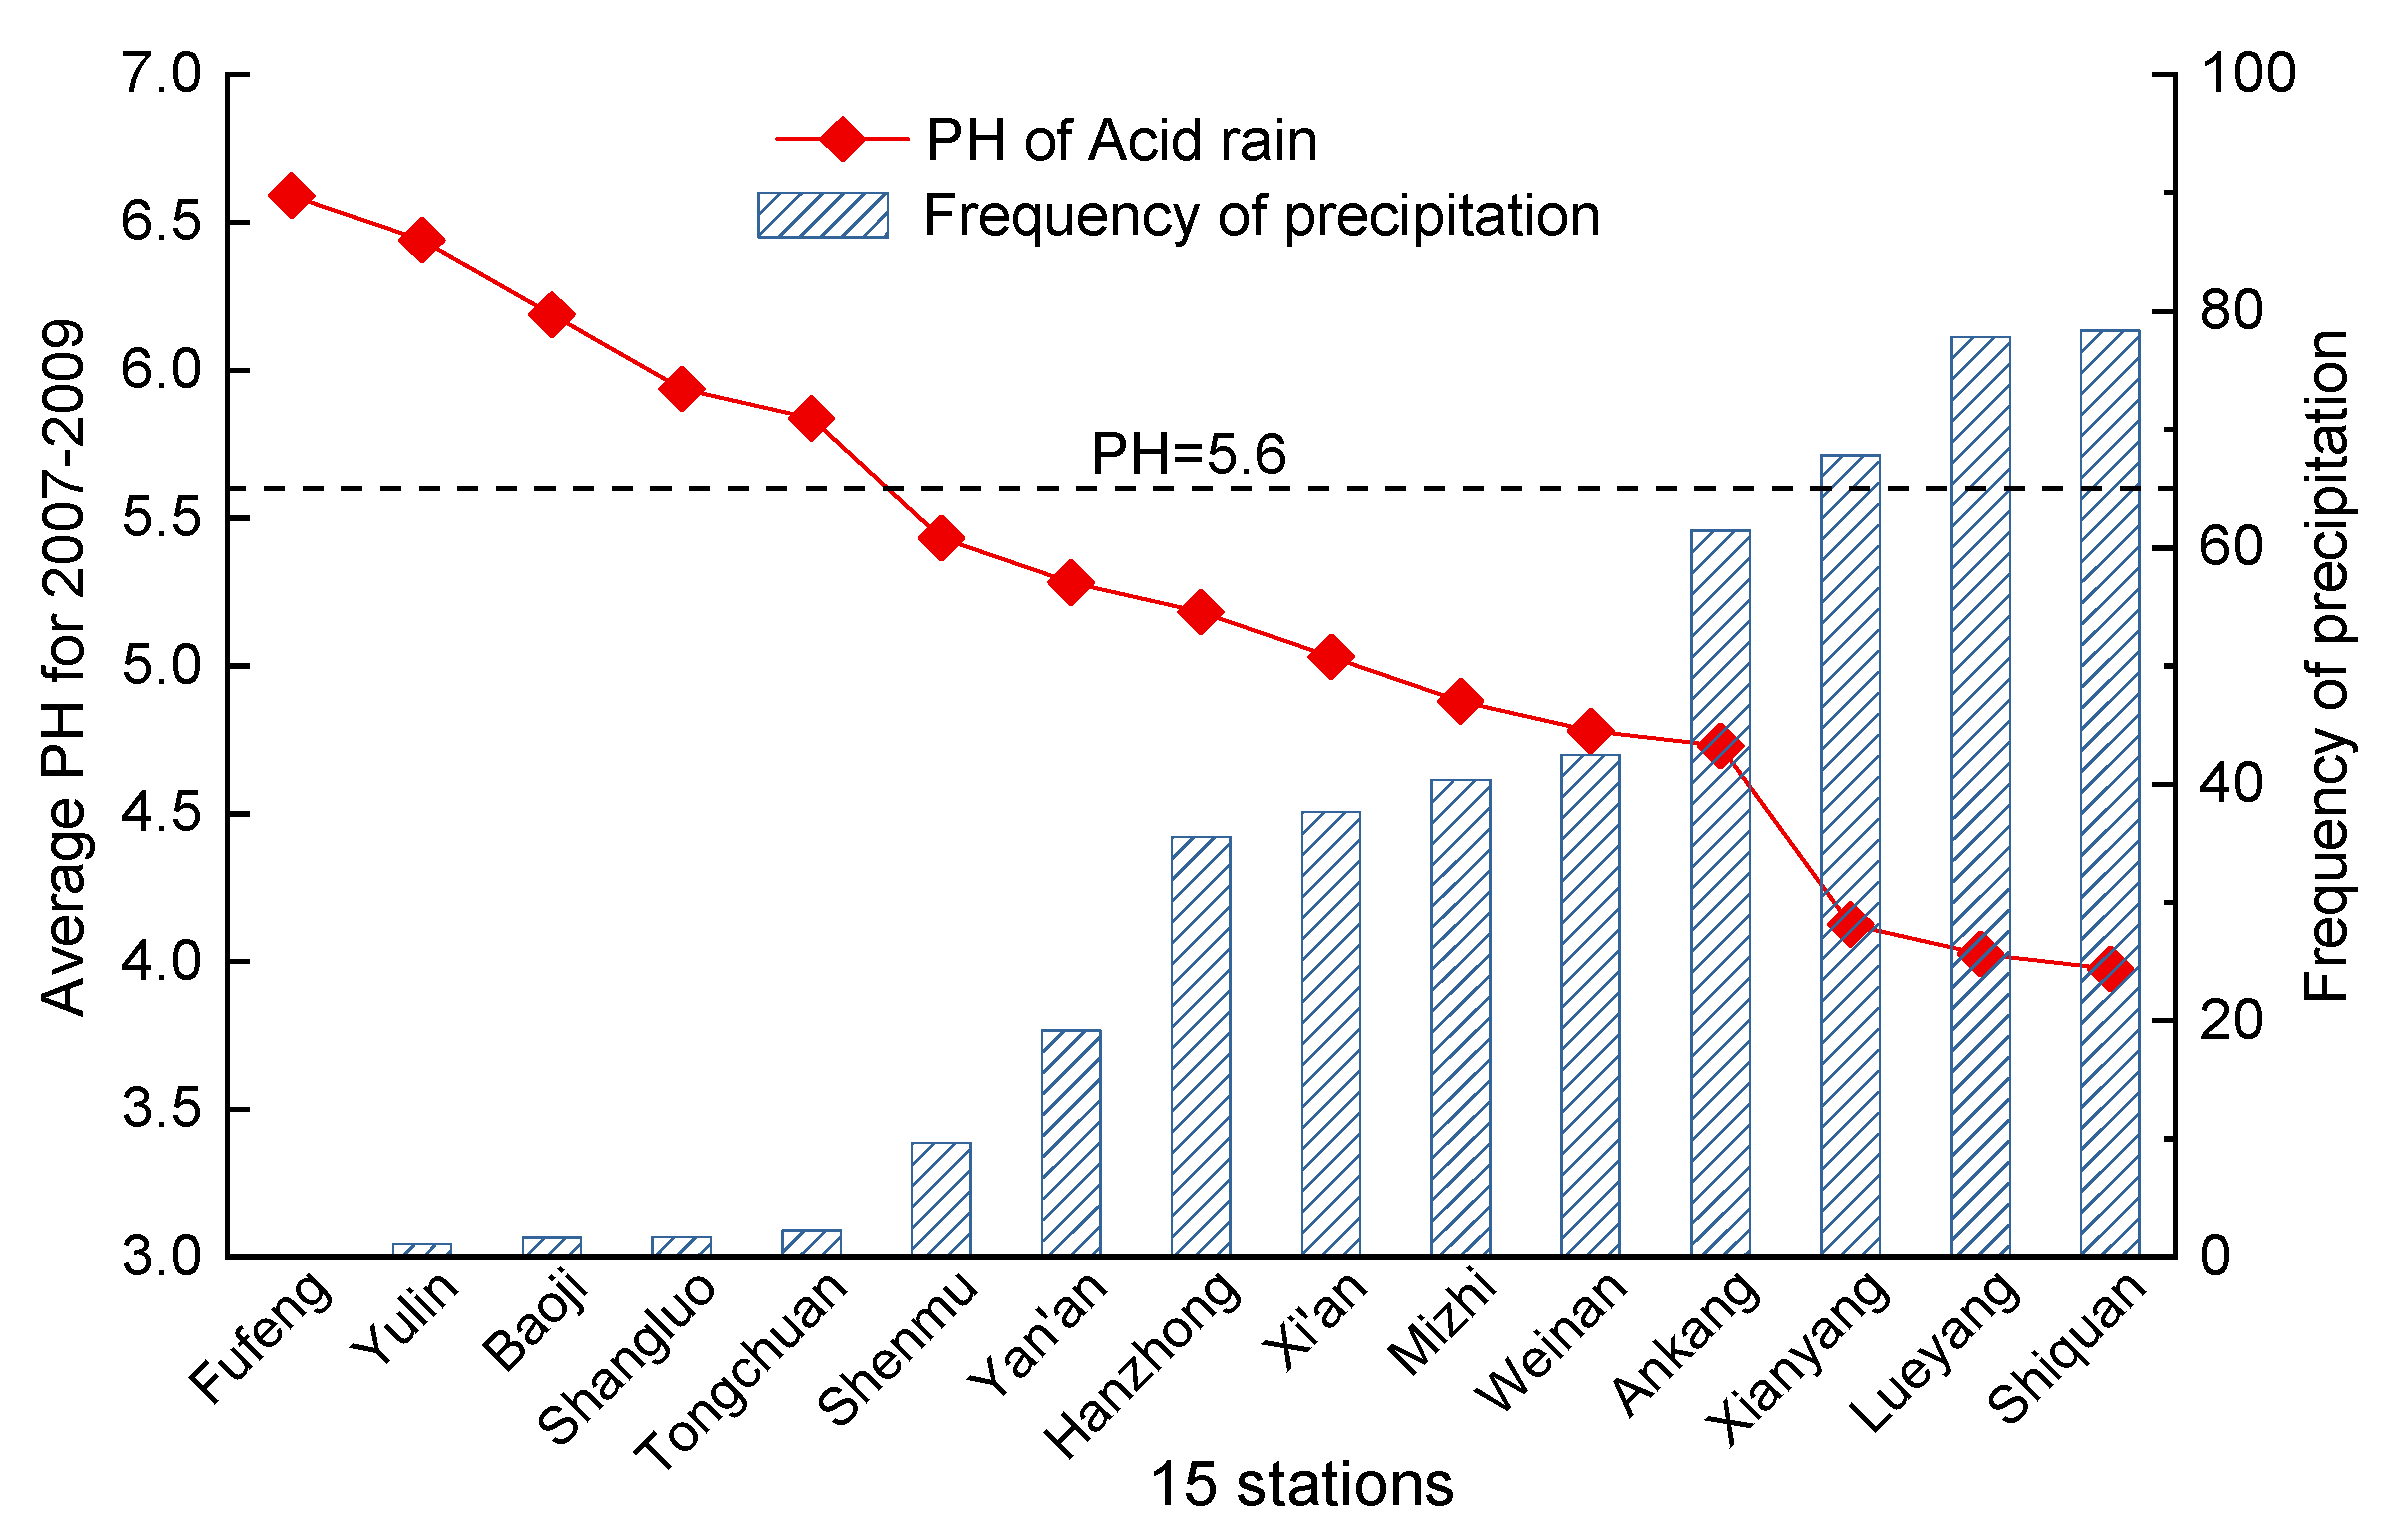
Precipitation acidity is affected by many factors. In addition to acid substances such as sulfuric acid and nitric acid, soil particles, industrial dust, and natural nitrogen also play an important role [25]. Due to fossil fuel-based energy consumption structure and combustion inefficiency, the acid rain in Shaanxi Province has a high frequency and intensity, and the acid rain distribution has significant regional characteristics: mild in the north and severe in the south, less in the west and more in the east (Figure 7 and Figure 8) [20,21]. The climate in Northern Shaanxi and Guanzhong is dry and rainless, and there are more suspended particles in the air than those in Southern Shaanxi. Meanwhile, the soil particles are neutral or slightly alkaline, which can neutralize the acidic raindrops to some extent. In contrast, the pH value of precipitation in Southern Shaanxi is relatively low since the acidic soil particles and acid corrosive gas in the air can be easily eluted by rainwater.
3. Environmental Zonation for Concrete Durability in Shaanxi Province
3.1. Principles of Environmental Zonation for Concrete Durability
The durability design, construction, and management of concrete structures are different due to the different environments in different regions [26,27,28]. Based on a comprehensive analysis of regional environmental conditions and the durability of concrete structures in Shaanxi Province, the regions with the same or similar climate environments will fall into the same environmental zones. The boundary line of each region is mainly determined by the calculation results, and the road divisions and administrative divisions are also taken into account. The zoning results are convenient to standardize the durability design of concrete structures and to implement the urban construction standards.
3.2. Indexes of Environmental Zonation
The field test results show that the durability damage of concrete structures in Shaanxi Province is mainly caused by concrete neutralization or freeze-thaw damage, and the external environmental factors affecting the durability of concrete mainly include temperature, relative humidity, CO2 concentration, and acid rain.
Although the concentration of CO2 in Shaanxi Province has been increasing in recent years, its concentration gradient is small in the whole province [21], so the CO2 concentration will not be selected as the zoning index. The ambient temperature and relative humidity vary greatly in different regions, resulting in different climatic characteristics in Shaanxi Province [21]. Moreover, the relative humidity has a positive correlation with the precipitation, so the annual precipitation will be selected as the zoning index.
It is generally believed that January is the coldest month in Northern China, and the diurnal temperature range in January determines whether the concrete structure is damaged by freezing and thawing or not, while July is the hottest month, with the highest rate of carbonization and steel corrosion [22]. Therefore, the annual freeze-thaw cycles and the average temperature in July are selected as the zoning indexes.
Due to the different degree of industrialization, the annual emissions of acid gases such as SO2, CO2, and NOx are different, resulting in different acid rainfall in each region. Therefore, the annual acid rainfall, known as the product of annual average precipitation and acid rain frequency [29], is selected as the zoning index.
3.3. Environmental Zonation for Concrete Durability
In the environmental zonation for concrete durability, the weight of the zoning index reflects the degree of its influence on concrete durability, and its rationality is directly related to the accuracy of zoning. In order to quantitatively zone the in-service environment of concrete structures in Shaanxi Province, this paper adopts the weight distribution method based on fuzzy and rough sets, which converts the weight determination problem into the attribute evaluation problem of rough sets, and the subjective influence of factor selection and weight determination can be avoided.
3.3.1. Fuzzy Cluster Analysis and the Theory of the Rough Set
Fuzzy Cluster Analysis
The traditional clustering analysis method is used to strictly divide each object into a certain category, but the attributes of objective things are usually not very clear and their categories are relatively vague, so it is effective to use the fuzzy clustering analysis to deal with the above-mentioned ambiguous objects. Fuzzy cluster analysis can obtain the degree of uncertainty of samples belonging to each category, and establish the uncertainty description, which can more objectively reflect the field situation [30].
For environmental zonation, let X = {x1, x2, …, xn} be the buildings to be tested, and these buildings will be divided into different categories according to their durability deterioration mechanism. Each sample xi = {xi1, xi2, …, xim} consists of m measured value of the durability influencing factors. The raw n × m data matrix can then be obtained.
Step 1. Data standardization. In order to compare different testing values with different dimensions, the measured data should be standardized by Standard Deviation Transformation or Range Transformation.
where μj and sj is the mean value and the standard deviation of xij, respectively, and i = 1, 2, …, n, j = 1, 2, …, m.
Step 2. Establish the fuzzy similar matrix R. The similar coefficient rij = R(xi, xj) between xi and xj can be calculated by using standardized data and the fuzzy similar matrix can be established.
Step 3. Establish the fuzzy equivalent matrix R*. Fuzzy similar matrix R is usually non-transitive, but reflexive and symmetrical. The equivalent matrix R* can be calculated by using the transitive closure method. Stepwise calculate R2, R4, …, until Rk = R2k = R2.
Step 4. Clustering. Choose different confidence levels λ ∈ [0, 1] and gradually merge the rows and columns of the fuzzy equivalent matrix R* obtained in Step 3 to obtain different clustering results. When rij ≥ λ, xi and xj are considered close enough to be the same category. For environmental zonation, it is considered that the influencing factors of concrete structure durability are similar. The larger the λ is, the higher the stability of sample elements is and the more details are distinguished. Therefore, the classification results are different when the confidence level is different. In view of this, the F-statistics method is used to determine the optimum threshold λ [31].
In the process of clustering analysis, the center vector can be obtained through a raw data matrix.
where is the center vector of the sample space.
Assume that the number of cluster is r when the confidence level is λ, and the j-th cluster has nj samples, which are , ,…, . Thus, the center vector of the j-th cluster is , where is the average value of the k-th durability factor.
The value of F-statistic is
where is the distance between and , and is the distance between and center vector in the j-th class. The molecular of the F-statistic represents the distance between categories, and the denominator represents the distance between samples in the same category. Therefore, the larger the value of the F-statistic becomes, the greater the distance between categories is, and the better the cluster result will be.
Rough Set theory
Rough set theory, proposed by Z. Pawlak, a Polish mathematician in 1982, is a theoretical method for studying the expression, learning, and induction of incomplete, uncertain knowledge and data. Its main idea is to make determination or zonation through knowledge reduction while maintaining the same distinguishing ability. Rough set theory has been widely used in data mining, pattern recognition, machine learning, and intelligent control because it can solve problems without prior knowledge [33,34].
The in-service environment of concrete structures usually has no detailed description, so it is impossible to obtain the weight of each index by statistical analysis. In view of this, rough set theory is introduced to determine the significance of environmental factors affecting the durability of concrete structures from rough description [35,36].
Definition 1.
The knowledge representation system is defined as follows:
where U is the set of samples; A = C ∪ D is the set of attributes, and C and D are the conditional attributes and decision attributes of the samples respectively; is the set of attribute values; f: U × (C ∪ D) → V is an information function that specifies the attribute values of each sample in U. Each attribute subset determines a binary indiscernible relationship IND (R):
S = (U, A, V, f)
Definition 2.
Given the knowledge representation system S = (U, A, V, f), for each subset
and indiscernible relation
, the upper and lower approximation sets of X are defined as follows:
Definition 3.
The dependence between the two attribute sets C and D is defined as
where , and |U| is the number of the element of U.
Definition 4.
Attribute a∈ C, the significance of attribute a for D is defined as
where represents the dependence of conditional attributes on the decision attributes after removing attribute a from C.
3.3.2. Weight Distribution of the Index of Environmental Zonation for Concrete Durability
Before doing environmental zonation, the weight distribution of various indexes should be determined. Using rough set theory to determine the importance of each zoning index is to calculate the weight of each index by attribute reduction under the premise of maintaining the classification ability. Firstly, the zoning index is fuzzy clustered, and the best classification can be obtained. The index ci is then successively deleted from the classification and the remaining indexes are clustered with the same method. The significance of the index was defined by the change of the whole system after deleting the index. That is, the more significant the index is, the more important it is to maintain the stability of the whole system, and the greater its weight becomes. The specific steps are as follows:
Step 1. Take all test samples as the universe U = {x1, x2, …, xn}, the index of environmental zonation (ci1, ci2, …, cim) as conditional attributes, and the durability grade of structure or component (d1, d2, …, dm) as the decision attribute. The raw data matrix can then be obtained:
Step 2. Determine the optimal confidence level λ by the F-statistics method, and then divide the equivalent classification of the tested buildings according to the zoning index and durability damage level, respectively, to find the best classification:
where Yi is an equivalent set, which is a set of equivalent relations corresponding to a certain durability damage level.
Y = {Y1, Y2, …, Ys}
Step 3. Delete the index ci (i = 1, 2, …, m) and use the aforementioned method to process the remaining matrix, and a new classification set after removing the index ci can then be achieved.
where Ei = {, , …, } is the equivalent set obtained after removing the i-th zoning index. For different i, k may be different. (1 ≤ l ≤ k) is the l-th equivalent set obtained after removing the i-th zoning index.
E = {E1, E2, …, Em}
Step 4. The importance of each index is obtained by rough set theory. According to Definition 2, the union of the lower approximation set of each equivalent set for each durability damage level is obtained.
For each zoning index ci, the dependence of durability damage level D on zoning index set C and zoning index set C − {ci} can be calculated by Definition 3 of rough set theory.
The significance SGF(ci, C, D) of zoning index ci can then be calculated by Definition 4 of rough set theory.
Step 5. According to the significance of each zoning index, the weight of each index is normalized to get more intuitive results.
To summarize, the knowledge system is established through the establishment of a relational data model and the characterization of an attribute value, and the factor weight is then calculated by analyzing the support degree and significance of the evaluation object under the data driven. This is a weight assignment method of the index of environmental zonation proposed in this study.
3.3.3. Environmental Zonation for Concrete Durability in Shaanxi Province
A large number of buildings have been built in Shaanxi Province in recent years. However, due to the insufficient understanding of the durability of concrete structures in the early years, durability problems of concrete structures are quite common. This study tested the durability influencing factors of 989 existing concrete structures in Shaanxi Province and assessed the durability damage levels of them by taking into account different construction years, structural types, and geographical locations. Take Yulin as an example to illustrate the weight calculation. Twenty test samples are selected as the universe U = {1, 2, …, 20}. The conditional attribute set includes annual freeze-thaw cycles, annual precipitation, the average temperature in July, and the annual acid rainfall. The decision attribute set is the durability damage level of sample components, which can be calculated according to the Standard for Durability Assessment of Existing Concrete Structures (GB/T 51355-2019) [37]. In the decision attribute set, Durability Damage Level 1 indicates that the component has no durability damage, Level 2 indicates that the component has slight mechanical damage or durability damage, Level 3 indicates that the component has more serious durability damage, and Level 4 indicates that the component has very serious durability damage. The test data are shown in Table 2.
(1) Establish fuzzy similarity matrix
The detecting data are then standardized by standard deviation to eliminate the influence of dimension, and the standardization matrix R is obtained.
Use the Euler distance method to establish similarity matrix R,
To ensure 0 ≤ rij ≤ 1, let C = 0.125 and the fuzzy similarity matrix R can be obtained.
(2) Clustering
Use the square method to find the transitive closure, and the fuzzy equivalent matrix R* can be obtained:
Use the F-statistics method to determine the optimal threshold value of λ = 0.915 and classify the samples. The classification results of the conditional attribute and the decision attribute are as follows:
U/IND(C)= {{1},{2},{3},{4},{5},{6},{7,16},{8,11,15},{9},{10},{12,14},{13,19},{17},{18},{20}};
U/IND(D)= {{13,16},{7,12,14,19},{2,3,5,9,10,18,20},{1,4,6,8,11,15,17}}.
Similarly, after removing the ci conditional attributes, the fuzzy clustering method is used to classify the remaining conditional attributes, and the best classifications are as follows:
U/IND(C−{c1}) = {{1},{2,4,8,11,15},{3,20},{5},{6,17},{7,16},{9},{10},{12,14},{13,19},{18}};
U/IND(C−{c2}) = {{1},{2},{3,12,14},{4,8,11,15},{5},{6},{7,16},{9},{10},{13,19},{17},{18},{20}};
U/IND(C−{c3}) = {{1,8,11,15},{2,18},{3},{4},{5,6,20},{7},{9},{10},{12},{13,19},{14},{16},{17}}.
U/IND(C−{c4}) = {{1},{2,8,11,15},{3},{4},{5},{6},{7,16},{9},{10},{12,14},{13,19},{17},{18},{20}}.
Calculate the importance of each conditional attribute to the decision attribute:
Calculate the significance SGF(ci, C, D) of each zoning index ci through the dependence degree of durability damage level D on the zoning index set C and the zoning index set C−ci.
Finally, the weight of each zoning index is obtained after normalizing the significance.
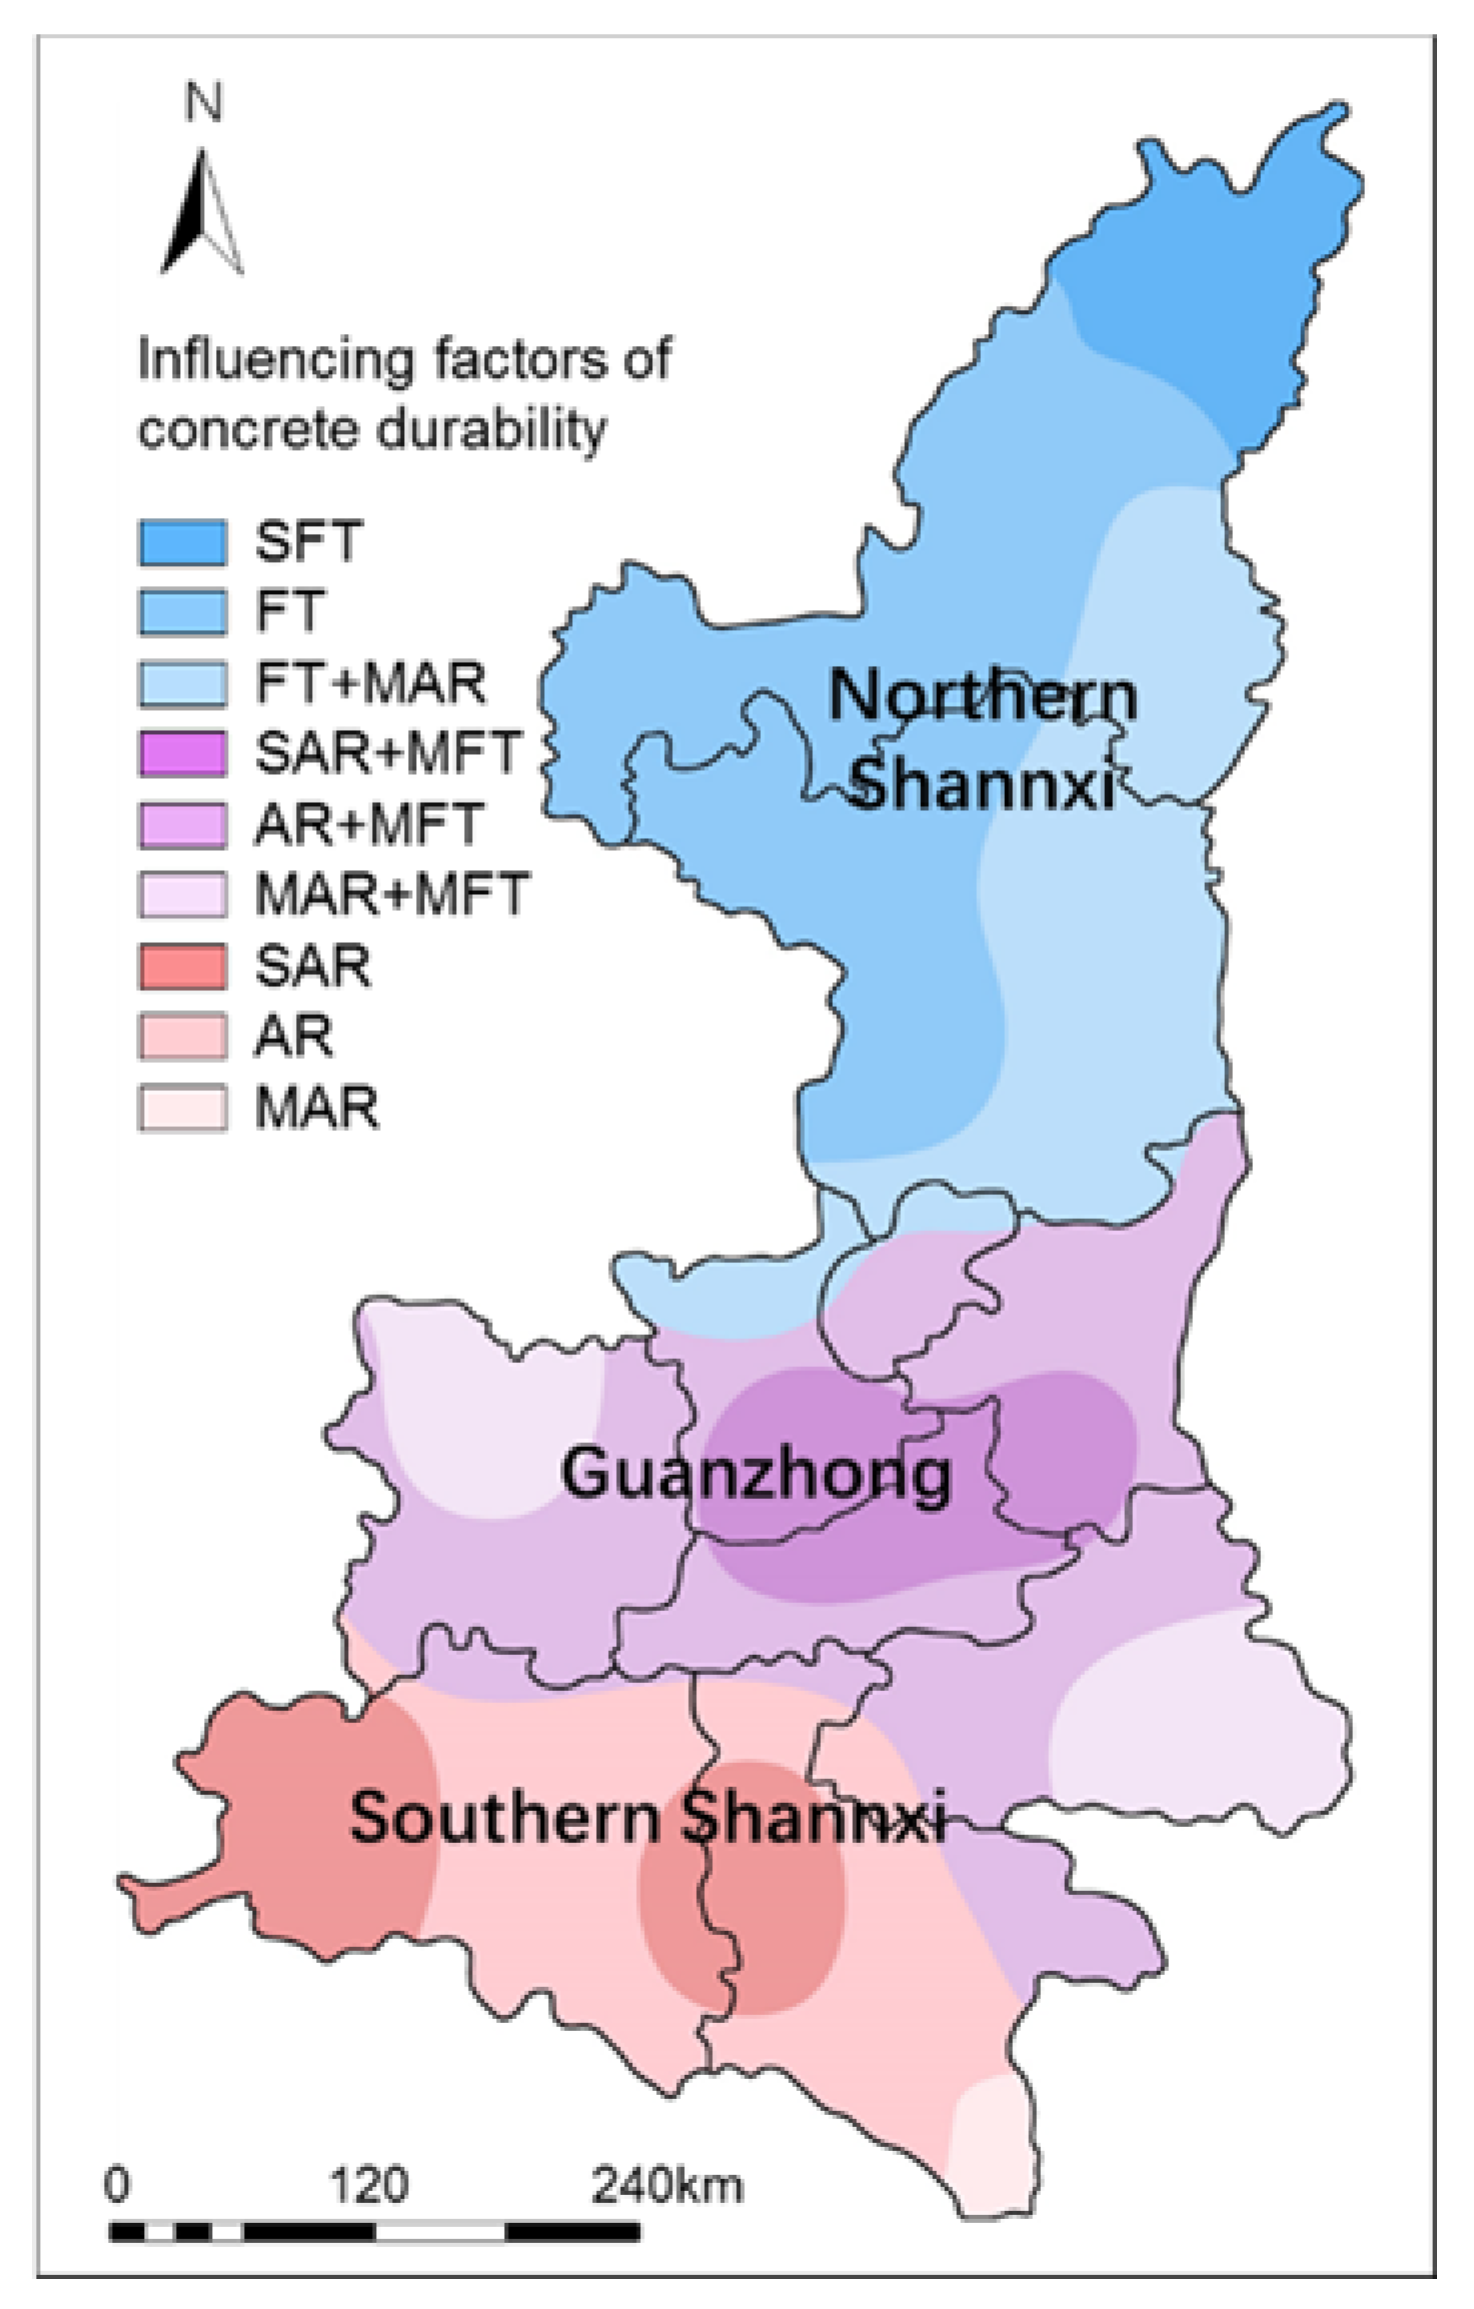
It can be seen that, among the factors affecting the durability of concrete structures in Yulin, the annual freeze-thaw cycles has the greatest impact on the durability of concrete, followed by annual acid rain and annual precipitation. The average temperature in July has a relatively small impact. Based on the above methods, the factors affecting the durability of 989 existing concrete buildings in typical cities of Shaanxi Province were analyzed, and their durability statuses were assessed. The weight of each factor and the durability damage level of the buildings were obtained. Considering the practicability of the zoning results, the environmental zonation was carried out by taking into account the landform, the road network, the administrative division, and the durability deterioration mechanism of each zone in Shaanxi Province. Based on the principle of a smaller difference within the region, a larger difference between regions and regional conjugation [38], Shaanxi Province was divided into three first-level zones and subdivided into nine second-level zones by the weight of zoning indexes. Detailed zoning result is shown in Table 3. According to the zoning result, the durability zoning map of concrete structures in Shaanxi Province can be plotted as Figure 9.
3.3.4. Environmental Conditions of Each Zone
Table 3 and Figure 9 show that, from the Freeze-Thaw Cycle Zone (Zone I) to the Neutralization Zone (Zone III), the influence of the freeze-thaw cycle on the durability of existing concrete structures is gradually weakened, while the influence of neutralization gradually becomes strong. Based on this, the environmental factors and their effects on the durability of concrete structures in different zones are comprehensively analyzed.
Freeze-Thaw Cycle Zone (Zone I)
Zone I includes Yulin, Yan’an, Northern Xianyang, and Northern Tongchuan. It has a long and cold winter with an annual average temperature of 6.5–8.7 °C, annual precipitation of 330–700 mm, and annual sunshine duration of 1550–2820 h. In this zone, the average temperature in January is −10.5–−5.0 °C, and the minimum temperature is −20–−30 °C, while the average temperature in July is 17.0–23.8 °C, and the maximum temperature is 35–44 °C. The annual frost-free period is 140–160 d, and the relative humidity in June–August is 58–76%. The annual range of air temperature can reach 26–34 °C, and the annual average daily range of air temperature is 7–14 °C. Acid rain occasionally falls in the southeast of this zone, with a frequency of less than 10%, and the maximum frozen soil depth is less than 1.2 m.
Concrete structures located in Zone I suffer from freeze-thaw cycles in winter and carbonization all year. The coupling effect of freeze-thaw and carbonization should be considered in the durability design of concrete structures. Moreover, in the southeast of this zone, the impact of occasional acid rain should be taken into account in the durability design of the building’s external components.
Neutralization–Freeze-Thaw Interaction Zone (Zone II)
Zone II includes Baoji, Xi’an, Weinan, most of Shangluo, south of Xianyang and Tongchuan, and northeast of Ankang. The average annual temperature in this zone is 8.8~14.0 °C, and the average temperature in January and July are −7.7~−0.8 °C and 14.8~27.5 °C, respectively. This zone enjoys 154~235 annual frost-free days and 1300~2600 h annual sunshine duration. The annual precipitation in this zone is 450~1400 mm, and the relative humidity in June-August is 60~83%.
Concrete structures located in this zone are mainly subjected to neutralization and occasional freeze-thaw damage. In Zone IIc, such as Fengxiang, the frequency of acid rain is relatively low, so in this zone it is not suitable to take acid rain as a key factor in durability design. The acid rain frequency in Xi’an, Weinan, Tongchuan, and other places located in Zone IIa is more than 30%, or even up to 50~80% in Xi’an and Xianyang. The erosion of acid rain should be considered as a key factor in the durability design of concrete structures in this zone.
Neutralization Zone (Zone III)
Zone III mainly includes Hanzhong and most of Ankang. The average annual temperature in this zone is 14.2~16.3 °C, with a small daily range of temperature. The annual precipitation is 800~1100 mm, and the annual sunshine duration is 1550~1700 h. In most of the zone, it is sultry in summer but wet and cold in winter, with an average temperature of 25.0~27.5 °C in July and −0.7~−0.6 °C in January, respectively. The annual frost-free period is 231~253 d, and the relative humidity from June to August is 74~80%. The annual number of rainfall days is about 150 d, and some areas can exceed 200 d, and the annual snowfall days is 1~14 d.
In Zone III, the frequency of acid rain is over 30%. The durability of concrete structures in this zone is less affected by freeze-thaw cycles. The durability damage of concrete structures is mainly caused by concrete neutralization and becomes serious when the concrete components suffer from acid rain erosion. Zone IIIa, represented by Ningqiang and Lueyang, is a typical acid rain disaster zone whose acid rain frequency is up to 80%. Serious acid rain can accelerate the neutralization of concrete, destroy the passive film on the surface of reinforcing bars, make the reinforcing bars rust prematurely, and cause structural damage.
4. Discussion
The environmental zonation for concrete durability is a complex problem of multi-index evaluation [39]. In order to quantitatively solve this problem, the fuzzy clustering analysis and rough set theory are involved, and the quantitative calculation method of the weight of the zoning index is proposed. Compared with the existing research results [16,17,18], the method proposed in this paper puts forward clear zoning indexes and quantifies them, which can avoid the subjectivity of the selection and evaluation of the zoning indexes, and improve the quality and accuracy of the zoning results. Meanwhile, the method proposed can scientifically zone the building environment of a specific region, and can comprehensively reflect the influence degree of durability factors.
Based on the method established in this paper, this study takes Shaanxi Province as an example and zones its environment, and the zoning results are well consistent with the durability deterioration of concrete structures, which proves the rationality, effectiveness, and practicability of this method. Thus, it can provide a scientific basis for the durability design and maintenance of reinforced concrete structures.
However, due to the complexity of the environment affecting the durability of concrete structures, the meteorological data and durability data collected are not sufficient, and the soil environment, water environment, and special corrosive environment are not analyzed. For a specific situation, a specific analysis is needed. For instance, the steel corrosion caused by chloride ion erosion should be considered in a coastal or deicing salt environment, and the influence of an alkali-aggregate reaction, delayed ettringite formation, and soft water erosion on durability should be considered when the concrete structures are chronically wet or exposed to water.
With the accumulation of data and the change of environment, zonation may change dynamically and become more precise. The follow-up research can establish the durability database to collect, arrange, systematize, and standardize the data, which is conducive to the durability design, evaluation, and life prediction of concrete structures.
5. Conclusions
Based on the investigation and analysis of the environmental conditions and the durability status of concrete structures in Shaanxi Province, this paper puts forward the zoning indexes and carries out the environmental zonation for concrete durability. The main conclusions are as follows:
- (1)
- The environmental conditions of concrete structures in Shaanxi Province were investigated, including atmospheric temperature, precipitation, corrosive gases in the atmosphere, and acid rain. Generally speaking, the annual average temperature in Shaanxi Province is higher in the south and lower in the north, which has increased slightly in the past half century. The annual precipitation is more in the south than that in the north, and has decreased slightly in recent years. The corrosive gas emissions show an upward trend before 2011 and a downward trend after 2011, which is closely related to economic development and environmental governance.
- (2)
- According to the survey results of durability of existing industrial buildings, residential buildings, roads, and bridges in Shaanxi Province, the main factors affecting the durability of concrete structures are freeze-thaw cycles and the concrete neutralization caused by carbonation and acid rain erosion. According to the deterioration mechanism of concrete durability, the zoning indexes are determined as annual freeze-thaw cycles, annual precipitation, average temperature in July, and annual acid rainfall.
- (3)
- Fuzzy clustering analysis and rough set theory were introduced into the environmental zonation for concrete durability, and the weights of durability zoning indexes were calculated. Based on this, Shaanxi Province was zoned into three first-level zones, namely the Freeze-Thaw Cycle Zone, the Neutralization–Freeze-Thaw Interaction Zone, and the Neutralization Zone, and these three zones were then subdivided into nine second-level zones. The main reasons for durability deterioration of concrete structures were analyzed according to the environmental characteristics of each zone in the zoning map.
The method proposed in this paper can improve the quality and accuracy of environmental zonation. It can scientifically classify the environmental conditions of specific provinces, cities, or regions, and demonstrate the influence of durability factors in different regions. The zoning results can provide a scientific basis for durability design and maintenance of reinforced concrete structures.
Author Contributions
Conceptualization: D.L. and Y.W.; methodology: D.L. and Y.W.; software: D.L. and Y.W.; validation: D.L. and Y.W.; formal analysis: D.L. and S.Z.; investigation: S.Z.; resources: D.N.; data curation: D.L., Y.W., and S.Z.; writing—original draft preparation: D.L.; writing—review and editing: D.N.; visualization: D.L. and Y.W.; supervision: D.N.; project administration: D.L. and Y.W.; funding acquisition: D.L. and Y.W. All authors have read and agreed to the published version of the manuscript.
Funding
This work was financially supported by the National Natural Science Foundation of China (Grant No. 51808438 and No. 51878549) and by the Independent Research and Development project of the State Key Laboratory of Green Buildings in Western China (Grant No. LSZZ202016).
Acknowledgments
This work presented herein was conducted in the State Key Laboratory of Green Buildings in Western China at Xi’an University of Architecture & Technology. The authors gratefully acknowledge the support that has made this laboratory and its operation possible.
Conflicts of Interest
The authors declare that there is no conflict of interest.
References
- Andersson, D.E.; Andersson, A.E. Sustainability and the Built Environment: The Role of Durability. Sustainability-Basel 2019, 11, 4926. [Google Scholar] [CrossRef] [Green Version]
- Ashraf, W. Carbonation of cement-based materials: Challenges and opportunities. Constr. Build. Mater. 2016, 120, 558–570. [Google Scholar] [CrossRef]
- Liu, H.; Luo, G.; Wang, L.; Gong, Y. Strength Time-Varying and Freeze-Thaw Durability of Sustainable Pervious Concrete Pavement Material Containing Waste Fly Ash. Sustainability-Basel 2019, 11, 176. [Google Scholar] [CrossRef] [Green Version]
- Kessler, S.; Thiel, C.; Grosse, C.U.; Gehlen, C. Effect of freeze-thaw damage on chloride ingress into concrete. Mater. Struct. 2017, 50, 121. [Google Scholar] [CrossRef]
- Gong, F.; Maekawa, K. Multi-scale simulation of freeze-thaw damage to RC column and its restoring force characteristics. Eng. Struct. 2018, 156, 522–536. [Google Scholar] [CrossRef]
- Chen, M.; Wang, K.; Xie, L. Deterioration mechanism of cementitious materials under acid rain attack. Eng Fail Anal 2013, 27, 272–285. [Google Scholar] [CrossRef]
- Kim, T.H.; Chae, C.U. Environmental impact analysis of acidification and eutrophication due to emissions from the production of concrete. Sustainability-Basel 2016, 8, 578. [Google Scholar] [CrossRef] [Green Version]
- Zhang, P.; Wittmann, F.H.; Vogel, M.; Müller, H.S.; Zhao, T. Influence of freeze-thaw cycles on capillary absorption and chloride penetration into concrete. Cem. Concr. Res. 2017, 100, 60–67. [Google Scholar] [CrossRef]
- Otieno, M.; Beushausen, H.; Alexander, M. Chloride-induced corrosion of steel in cracked concrete—Part I: Experimental studies under accelerated and natural marine environments. Cem. Concr. Res. 2016, 79, 373–385. [Google Scholar] [CrossRef]
- Cheng, Y.; Zhang, Y.; Tan, G.; Jiao, Y. Effect of Crack on Durability of RC Material under the Chloride Aggressive Environment. Sustainability-Basel 2018, 10, 430. [Google Scholar] [CrossRef] [Green Version]
- Müllauer, W.; Beddoe, R.E.; Heinz, D. Sulfate attack expansion mechanisms. Cem. Concr. Res. 2013, 52, 208–215. [Google Scholar] [CrossRef]
- Ortega, J.M.; Esteban, M.D.; Williams, M.; Sánchez, I.; Climent, M.Á. Short-term performance of sustainable silica fume mortars exposed to sulfate attack. Sustainability-Basel 2018, 10, 2517. [Google Scholar] [CrossRef] [Green Version]
- Ministry of Construction of the PRC. GB 50010-2010, Code for Design of Concrete Structures; China Architecture & Building Press: Beijing, China, 2015.
- Ministry of Construction of the PRC. GB/T50476-2019. Standard for Design of Concrete Structure Durability; China Architecture & Building Press: Beijing, China, 2019.
- European Committee for Standardization (CEN). EN 1992-1-1, Euro-code 2: Design for Concrete Structures-Part 1-1: General Rules and Rules for Buildings; CEN: London, UK, 2004. [Google Scholar]
- Jin, W.; Lv, Q. Durability zonation standard of concrete structure design. J. Southeast Univ. Engl. Ed. 2007, 23, 98–104. [Google Scholar]
- Wu, H.; Jin, W.; Yan, Y.; Xia, J. Environmental zonation and life prediction of concrete in frost environments. J. Zhejiang Univ. Eng. Sci. 2012, 46, 650–657. [Google Scholar]
- Seo, S.; Lee, B.; Won, J. Comparative Analysis of Economic Impacts of Sustainable Vertical Extension Methods for Existing Underground Spaces. Sustainability-Basel 2020, 12, 975. [Google Scholar] [CrossRef] [Green Version]
- Li, F.; Zhou, M.; Hu, M. Climate change in different geographical units and its impact on land production potential: A case study of Shaanxi Province, China. Env. Sci. Pollut. Res. 2019, 26, 22273–22283. [Google Scholar]
- National Meteorological Information Center. China Meteorological Data Sharing Service System. Available online: http://data.cma.cn/ (accessed on 25 February 2020).
- Compilation Committee of Local Chronicles of Shaanxi Province. Shaanxi Statistical Yearbook. Available online: http://www.sxsdq.cn/sqzlk/sxnj/ (accessed on 25 February 2020).
- Papadakis, V.G.; Vayenas, C.G.; Fardis, M.N. Experimental investigation and mathematical modeling of the concrete carbonation problem. Chem. Eng. Sci. 1991, 46, 1333–1338. [Google Scholar] [CrossRef]
- Chen, T.; Kuschner, W.G.; Gokhale, J.; Shofer, S. Outdoor air pollution: Nitrogen dioxide, sulfur dioxide, and carbon monoxide health effects. Am. J. Med Sci. 2007, 333, 249–256. [Google Scholar] [CrossRef]
- Khan, R.R.; Siddiqui, M. Review on effects of particulates; sulfur dioxide and nitrogen dioxide on human health. Int. Res. J. Env. Sci. 2014, 3, 70–73. [Google Scholar]
- Burns, D.A.; Aherne, J.; Gay, D.A.; Lehmann, C.M. Acid rain and its environmental effects: Recent scientific advances. Atmos. Environ. 2016, 146, 1–4. [Google Scholar] [CrossRef] [Green Version]
- Müller, H.S.; Haist, M.; Vogel, M. Assessment of the sustainability potential of concrete and concrete structures considering their environmental impact, performance and lifetime. Constr. Build. Mater. 2014, 67, 321–337. [Google Scholar] [CrossRef]
- Hooton, R.D.; Bickley, J.A. Design for durability: The key to improving concrete sustainability. Constr. Build. Mater. 2014, 67, 422–430. [Google Scholar] [CrossRef]
- Alexander, M.; Bentur, A.; Mindess, S. Durability of Concrete: Design and Construction. CRC Press Taylor& Francis Group: Boca Raton, FA, USA, 2017; Volume 20, pp. 1–324. [Google Scholar]
- Menz, F.C.; Seip, H.M. Acid rain in Europe and the United States: An update. Env. Sci. Policy 2004, 7, 253–265. [Google Scholar] [CrossRef]
- Timm, H.; Borgelt, C.; Döring, C.; Kruse, R. An extension to possibilistic fuzzy cluster analysis. Fuzzy Set Syst. 2004, 147, 3–16. [Google Scholar] [CrossRef]
- Xie, J.; Ping, C. Fuzzy Mathematics Method and Applications, 4th ed.; Huazhong University of Science & Technology Press: Wuhan, China, 2013; pp. 81–118. [Google Scholar]
- Miyamoto, S.; Ichihashi, H.; Honda, K.; Ichihashi, H. Algorithms for Fuzzy Clustering; Springer, 2008; pp. 9–12. [Google Scholar]
- Pawlak, Z. Rough sets and intelligent data analysis. Inf. Sci. 2002, 147, 1–12. [Google Scholar] [CrossRef] [Green Version]
- Pawlak, Z. Rough set theory and its applications to data analysis. Cybern. Syst. 1998, 29, 661–688. [Google Scholar] [CrossRef]
- Swiniarski, R.W.; Skowron, A. Rough set methods in feature selection and recognition. Pattern Recogn. Lett. 2003, 24, 833–849. [Google Scholar] [CrossRef] [Green Version]
- Yao, Y.; Zhao, Y. Attribute reduction in decision-theoretic rough set models. Inf. Sci. 2008, 178, 3356–3373. [Google Scholar] [CrossRef] [Green Version]
- Ministry of Construction of the PRC. GB/T 51355-2019, Standard for Durability Assessment of Existing Concrete Structures; China Building Industry Press: Beijing, China, 2019.
- Sjors, H. The background: Geology, climate and zonation. Acta Phytogeogr. Suec. 1999, 84, 5–14. [Google Scholar]
- Alexander, M.G.; Ballim, Y.; Stanish, K. A framework for use of durability indexes in performance-based design and specifications for reinforced concrete structures. Mater. Struct. 2008, 41, 921–936. [Google Scholar] [CrossRef]
Figure 1.
Annual average temperature in Shaanxi Province in the last half century.
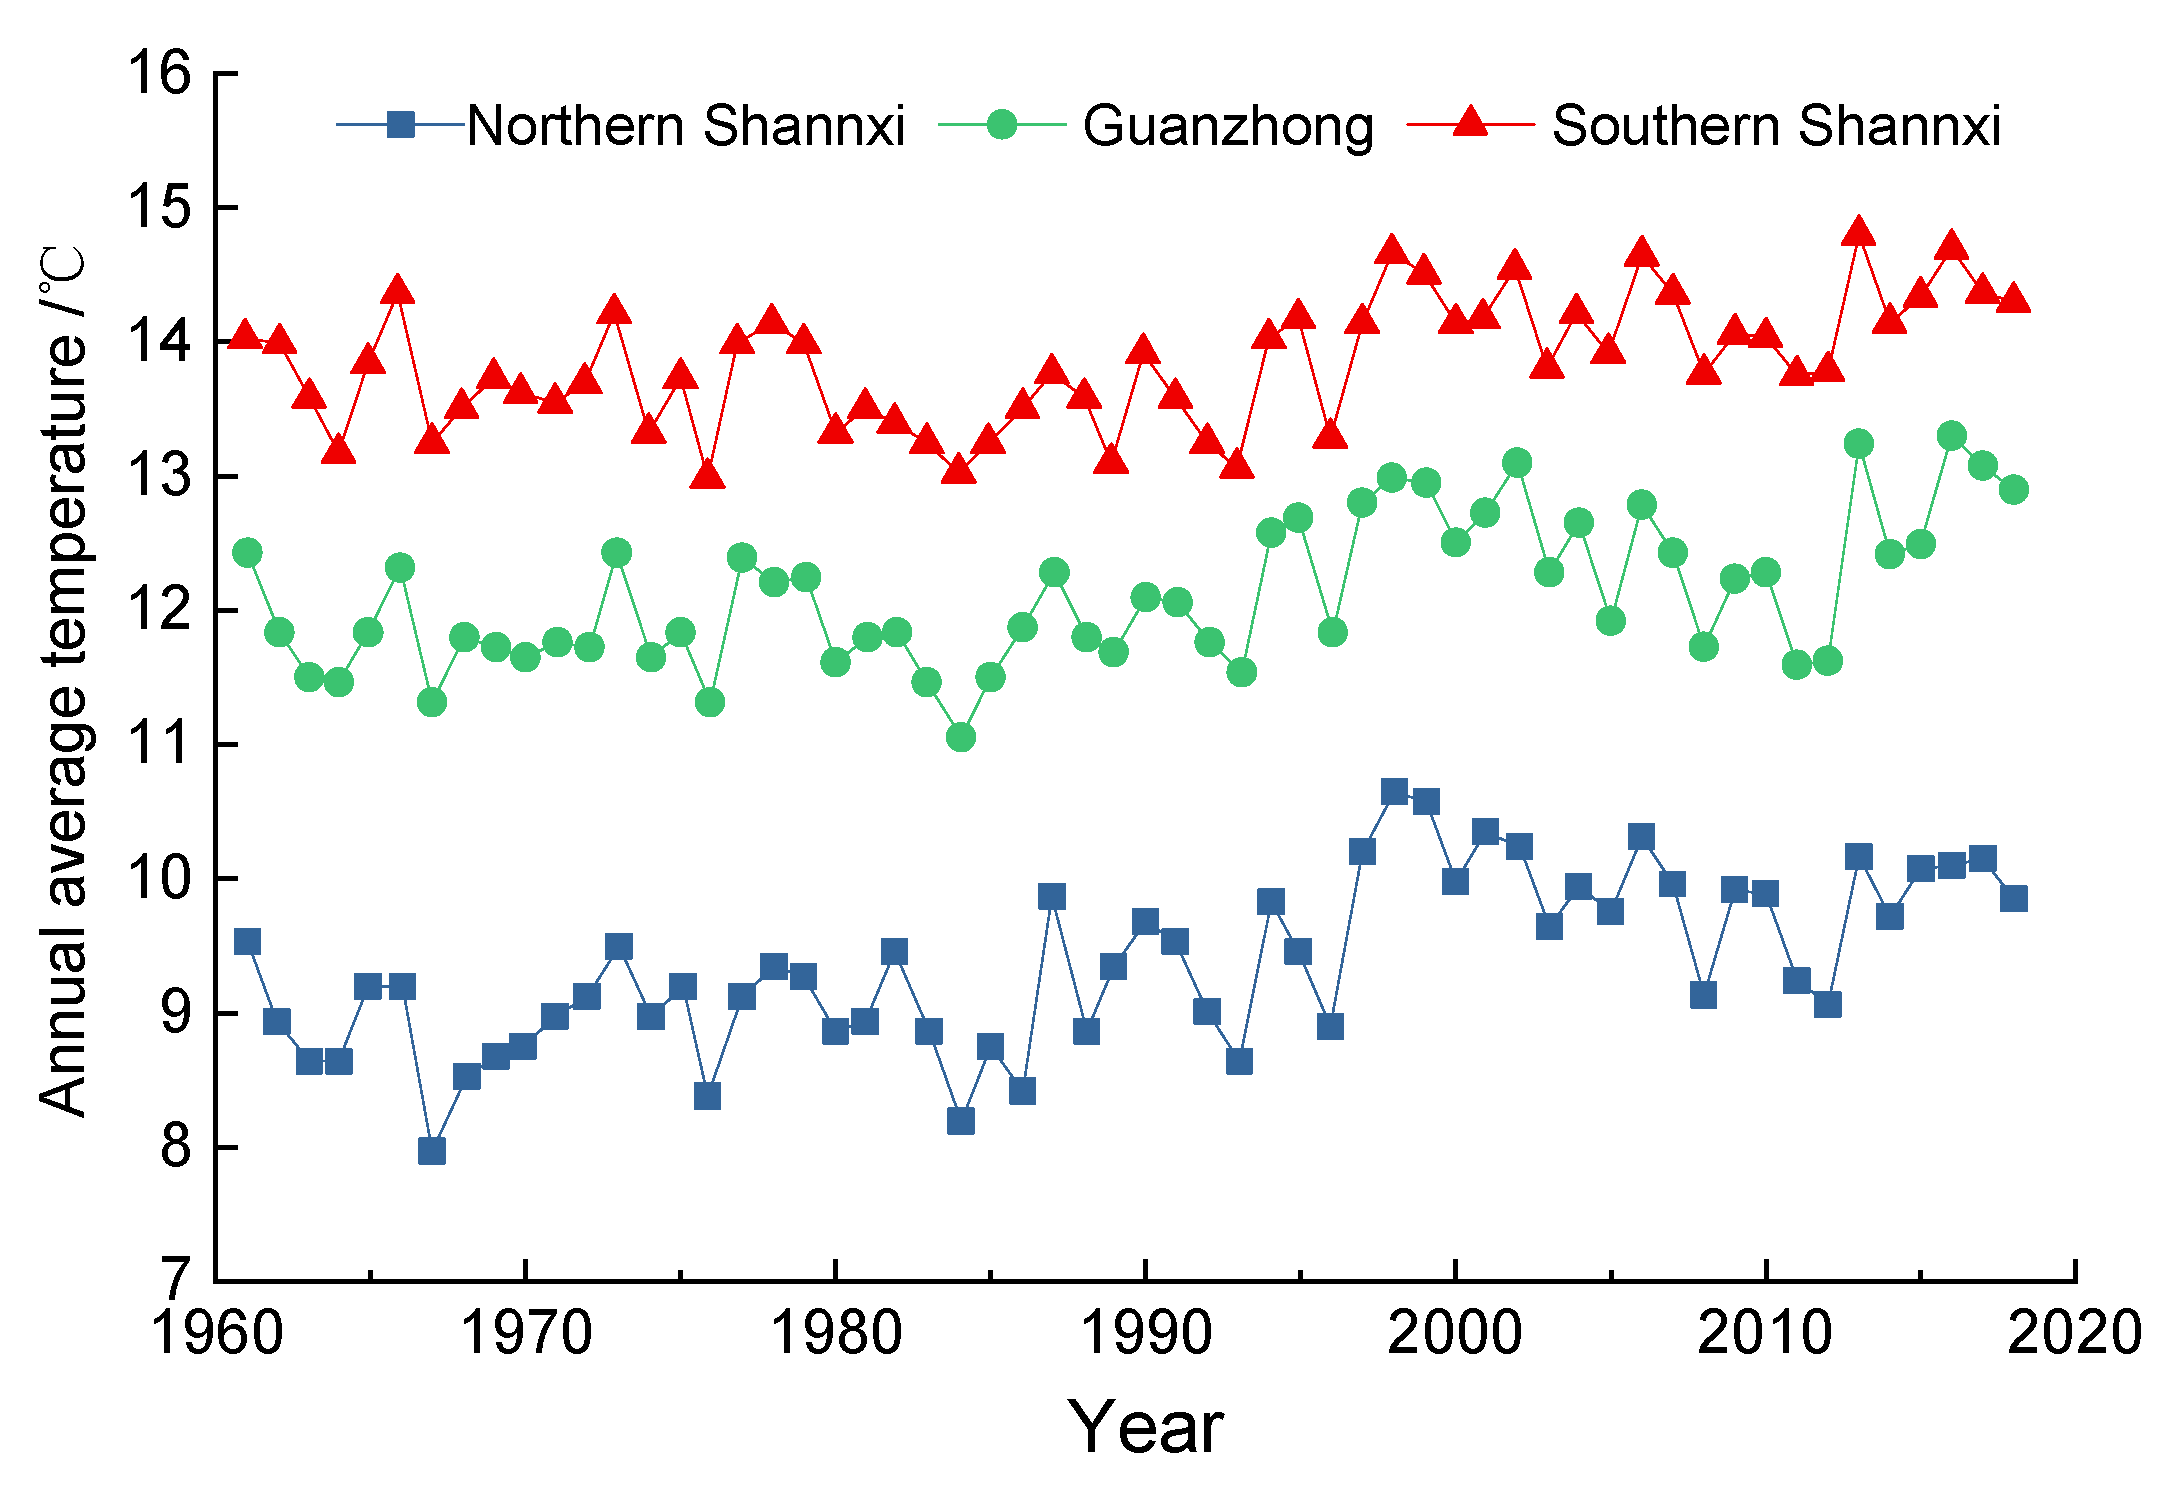
Figure 2.
Annual average temperature of Shaanxi Province.
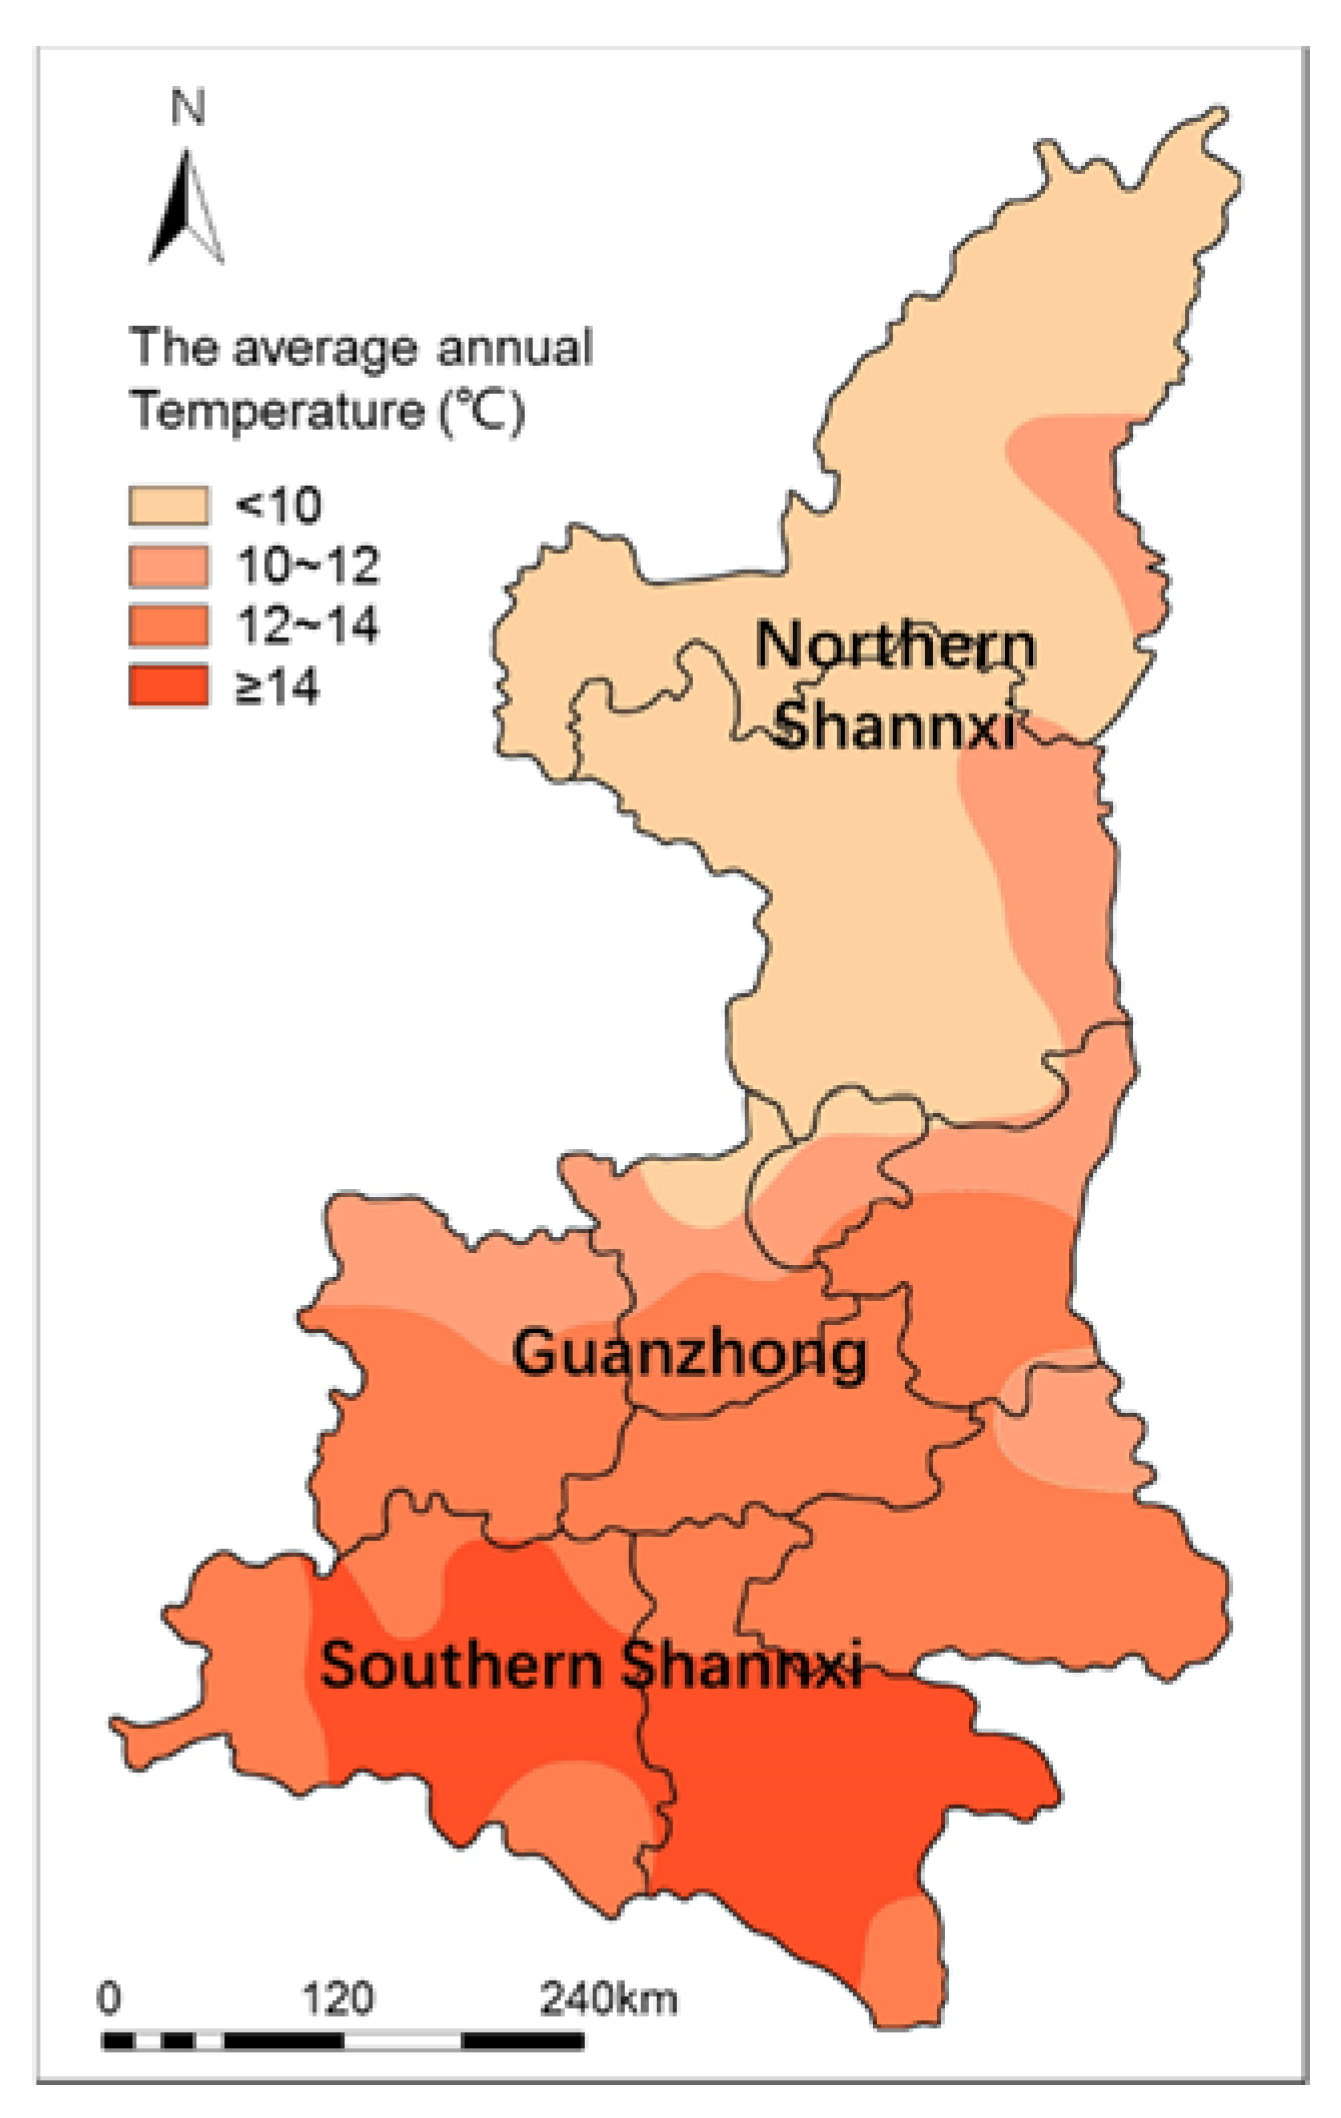
Figure 3.
Average monthly temperature distribution in Shaanxi Province.
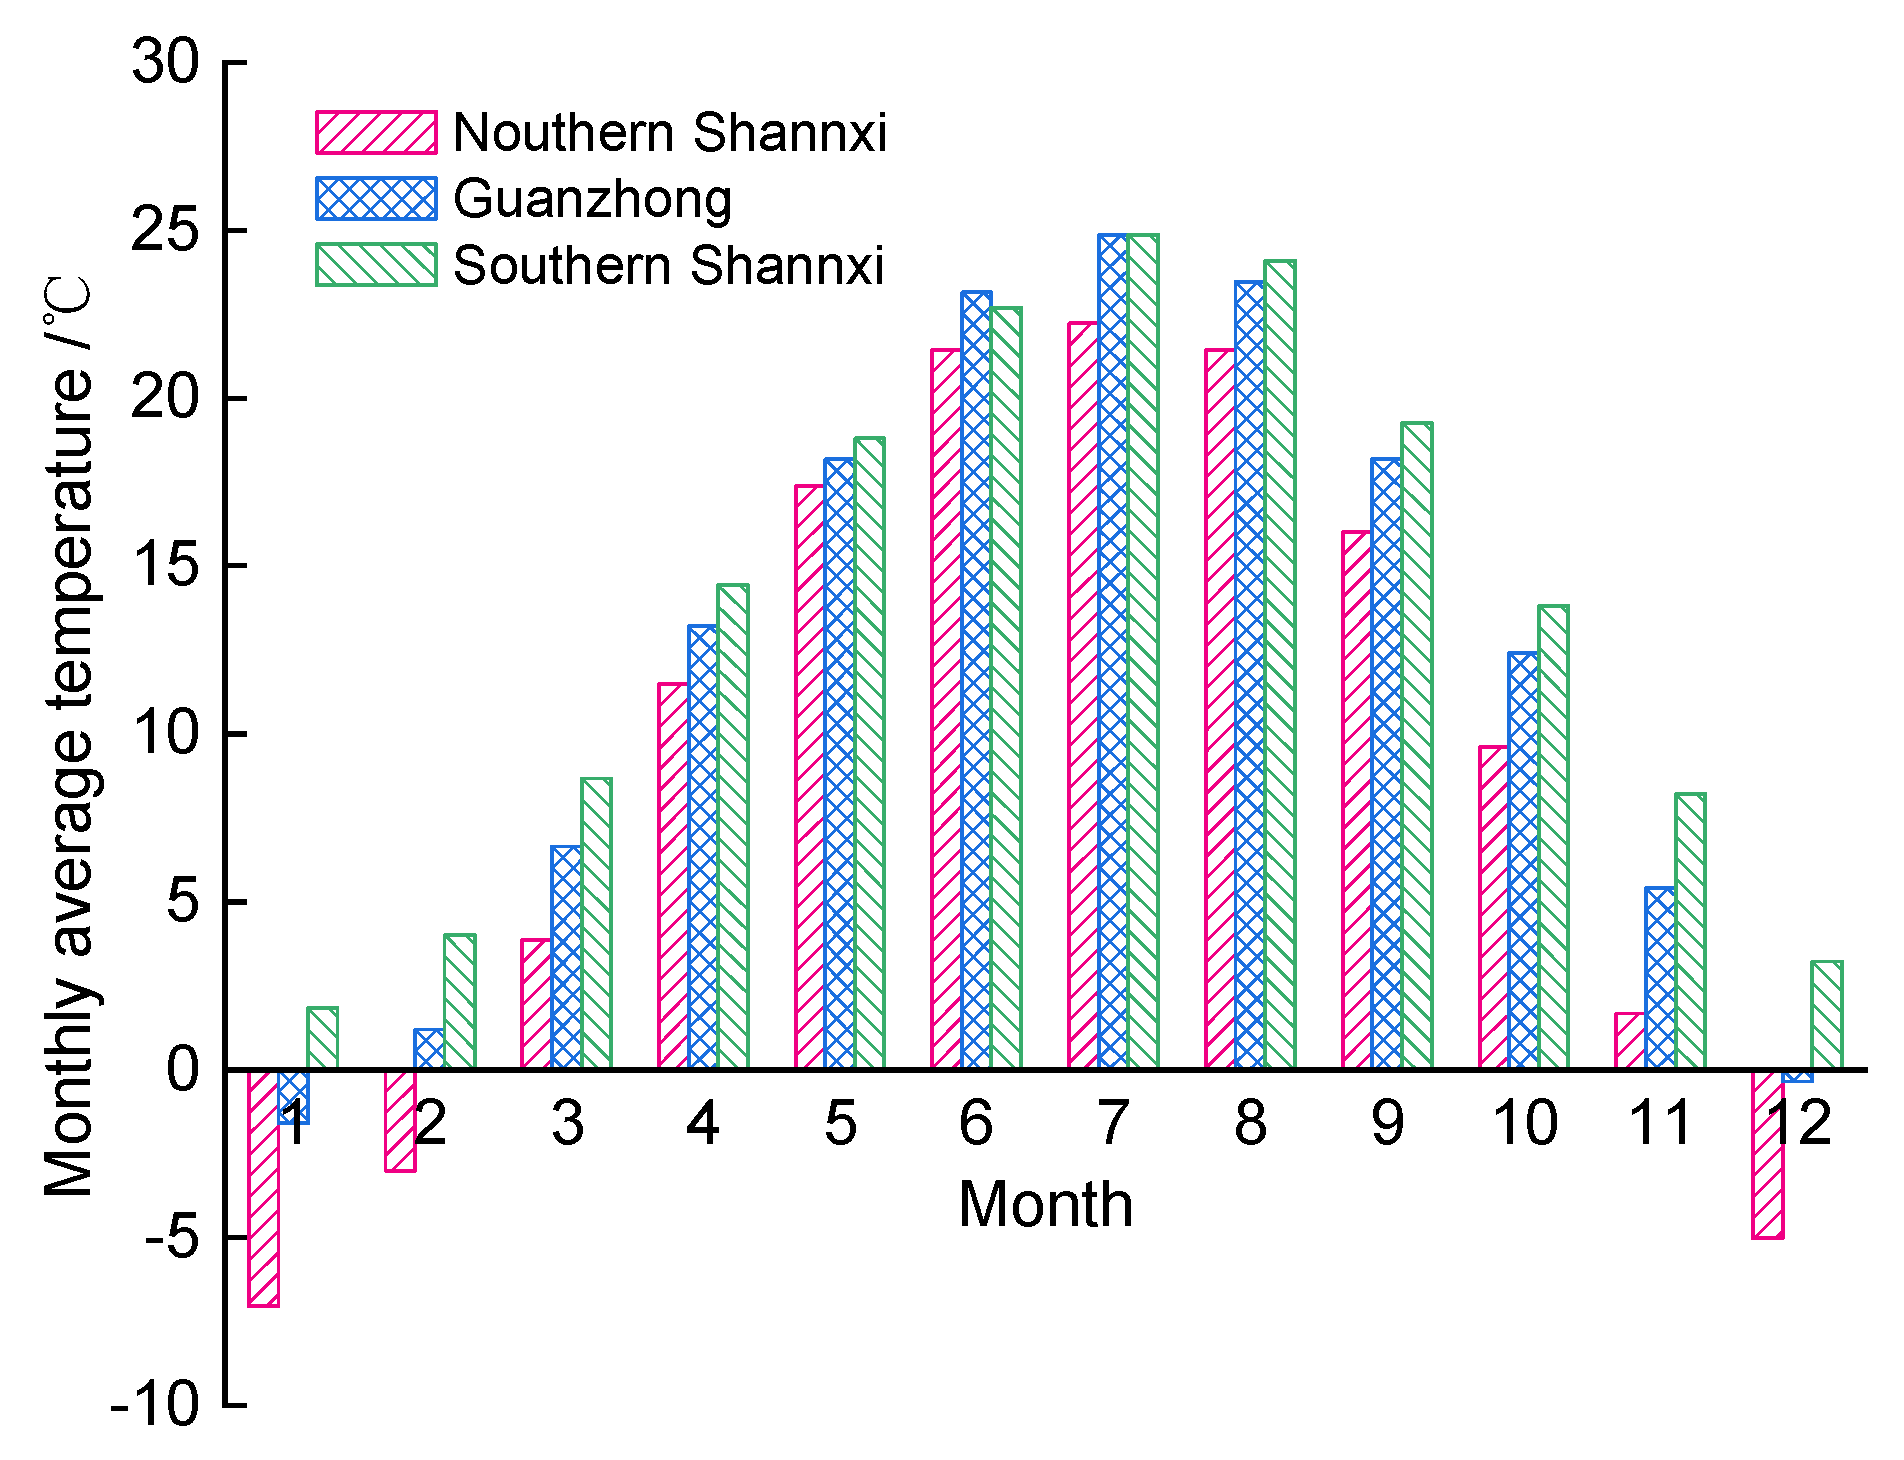
Figure 4.
Annual average precipitation in Shaanxi Province from 1961 to 2016.
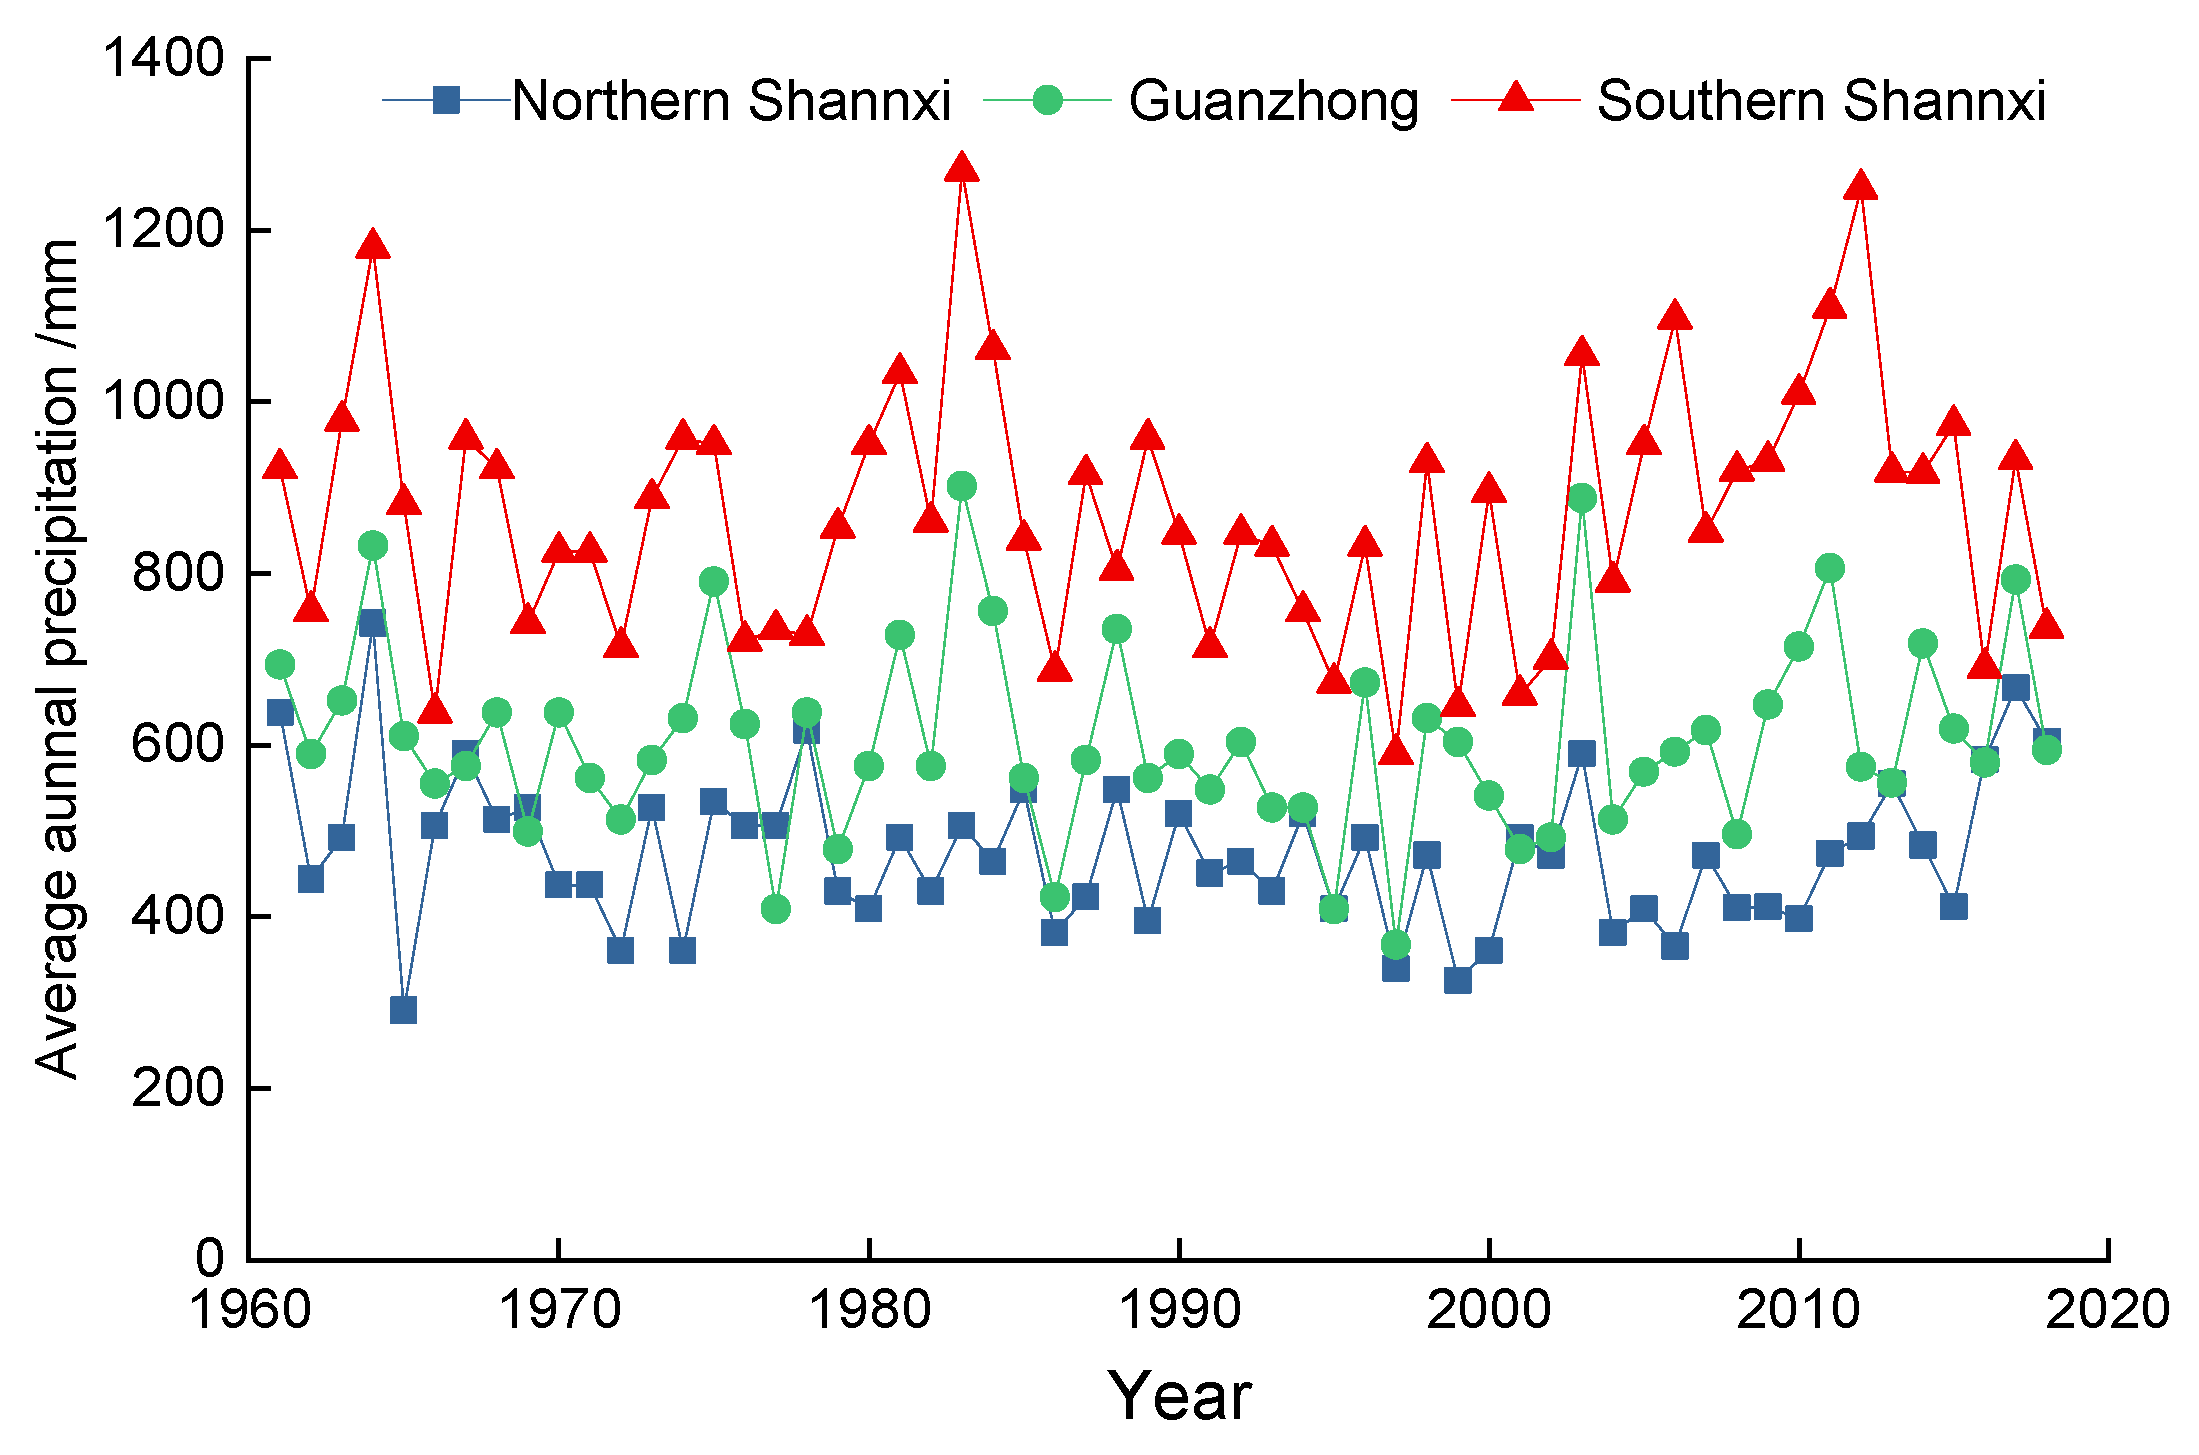
Figure 5.
Average annual precipitation in Shaanxi Province.
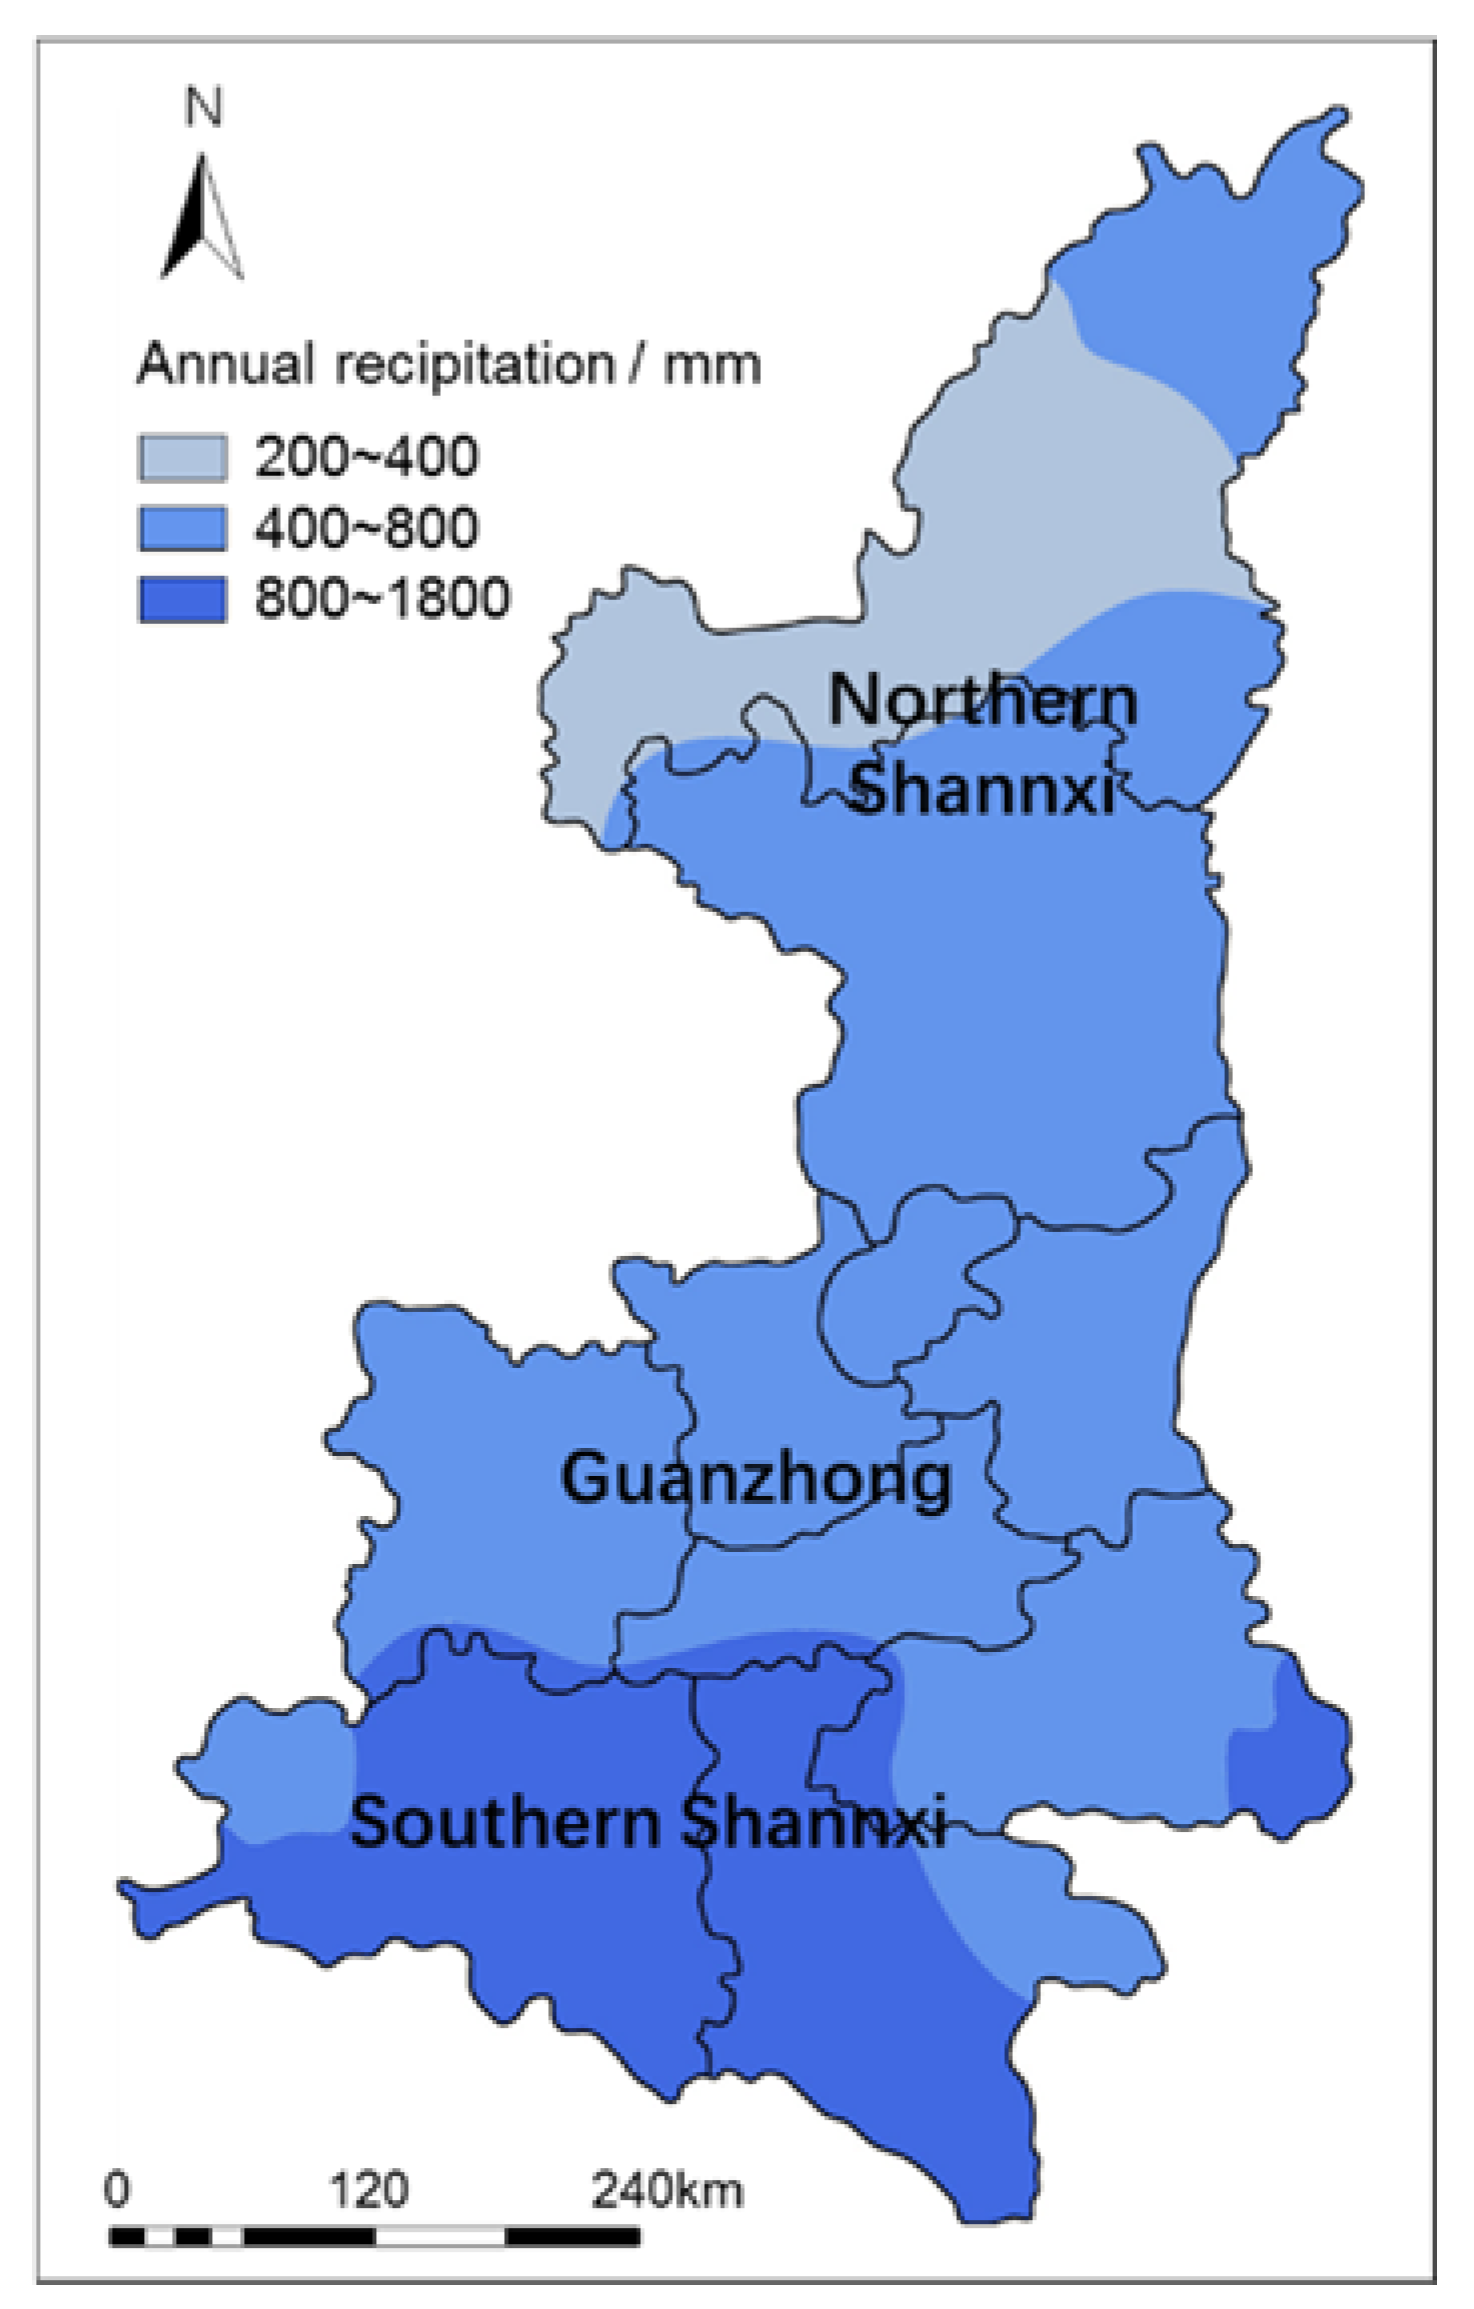
Figure 6.
Corrosive gases emissions and economic growth in Shaanxi Province in the last two decades.
Figure 6.
Corrosive gases emissions and economic growth in Shaanxi Province in the last two decades.
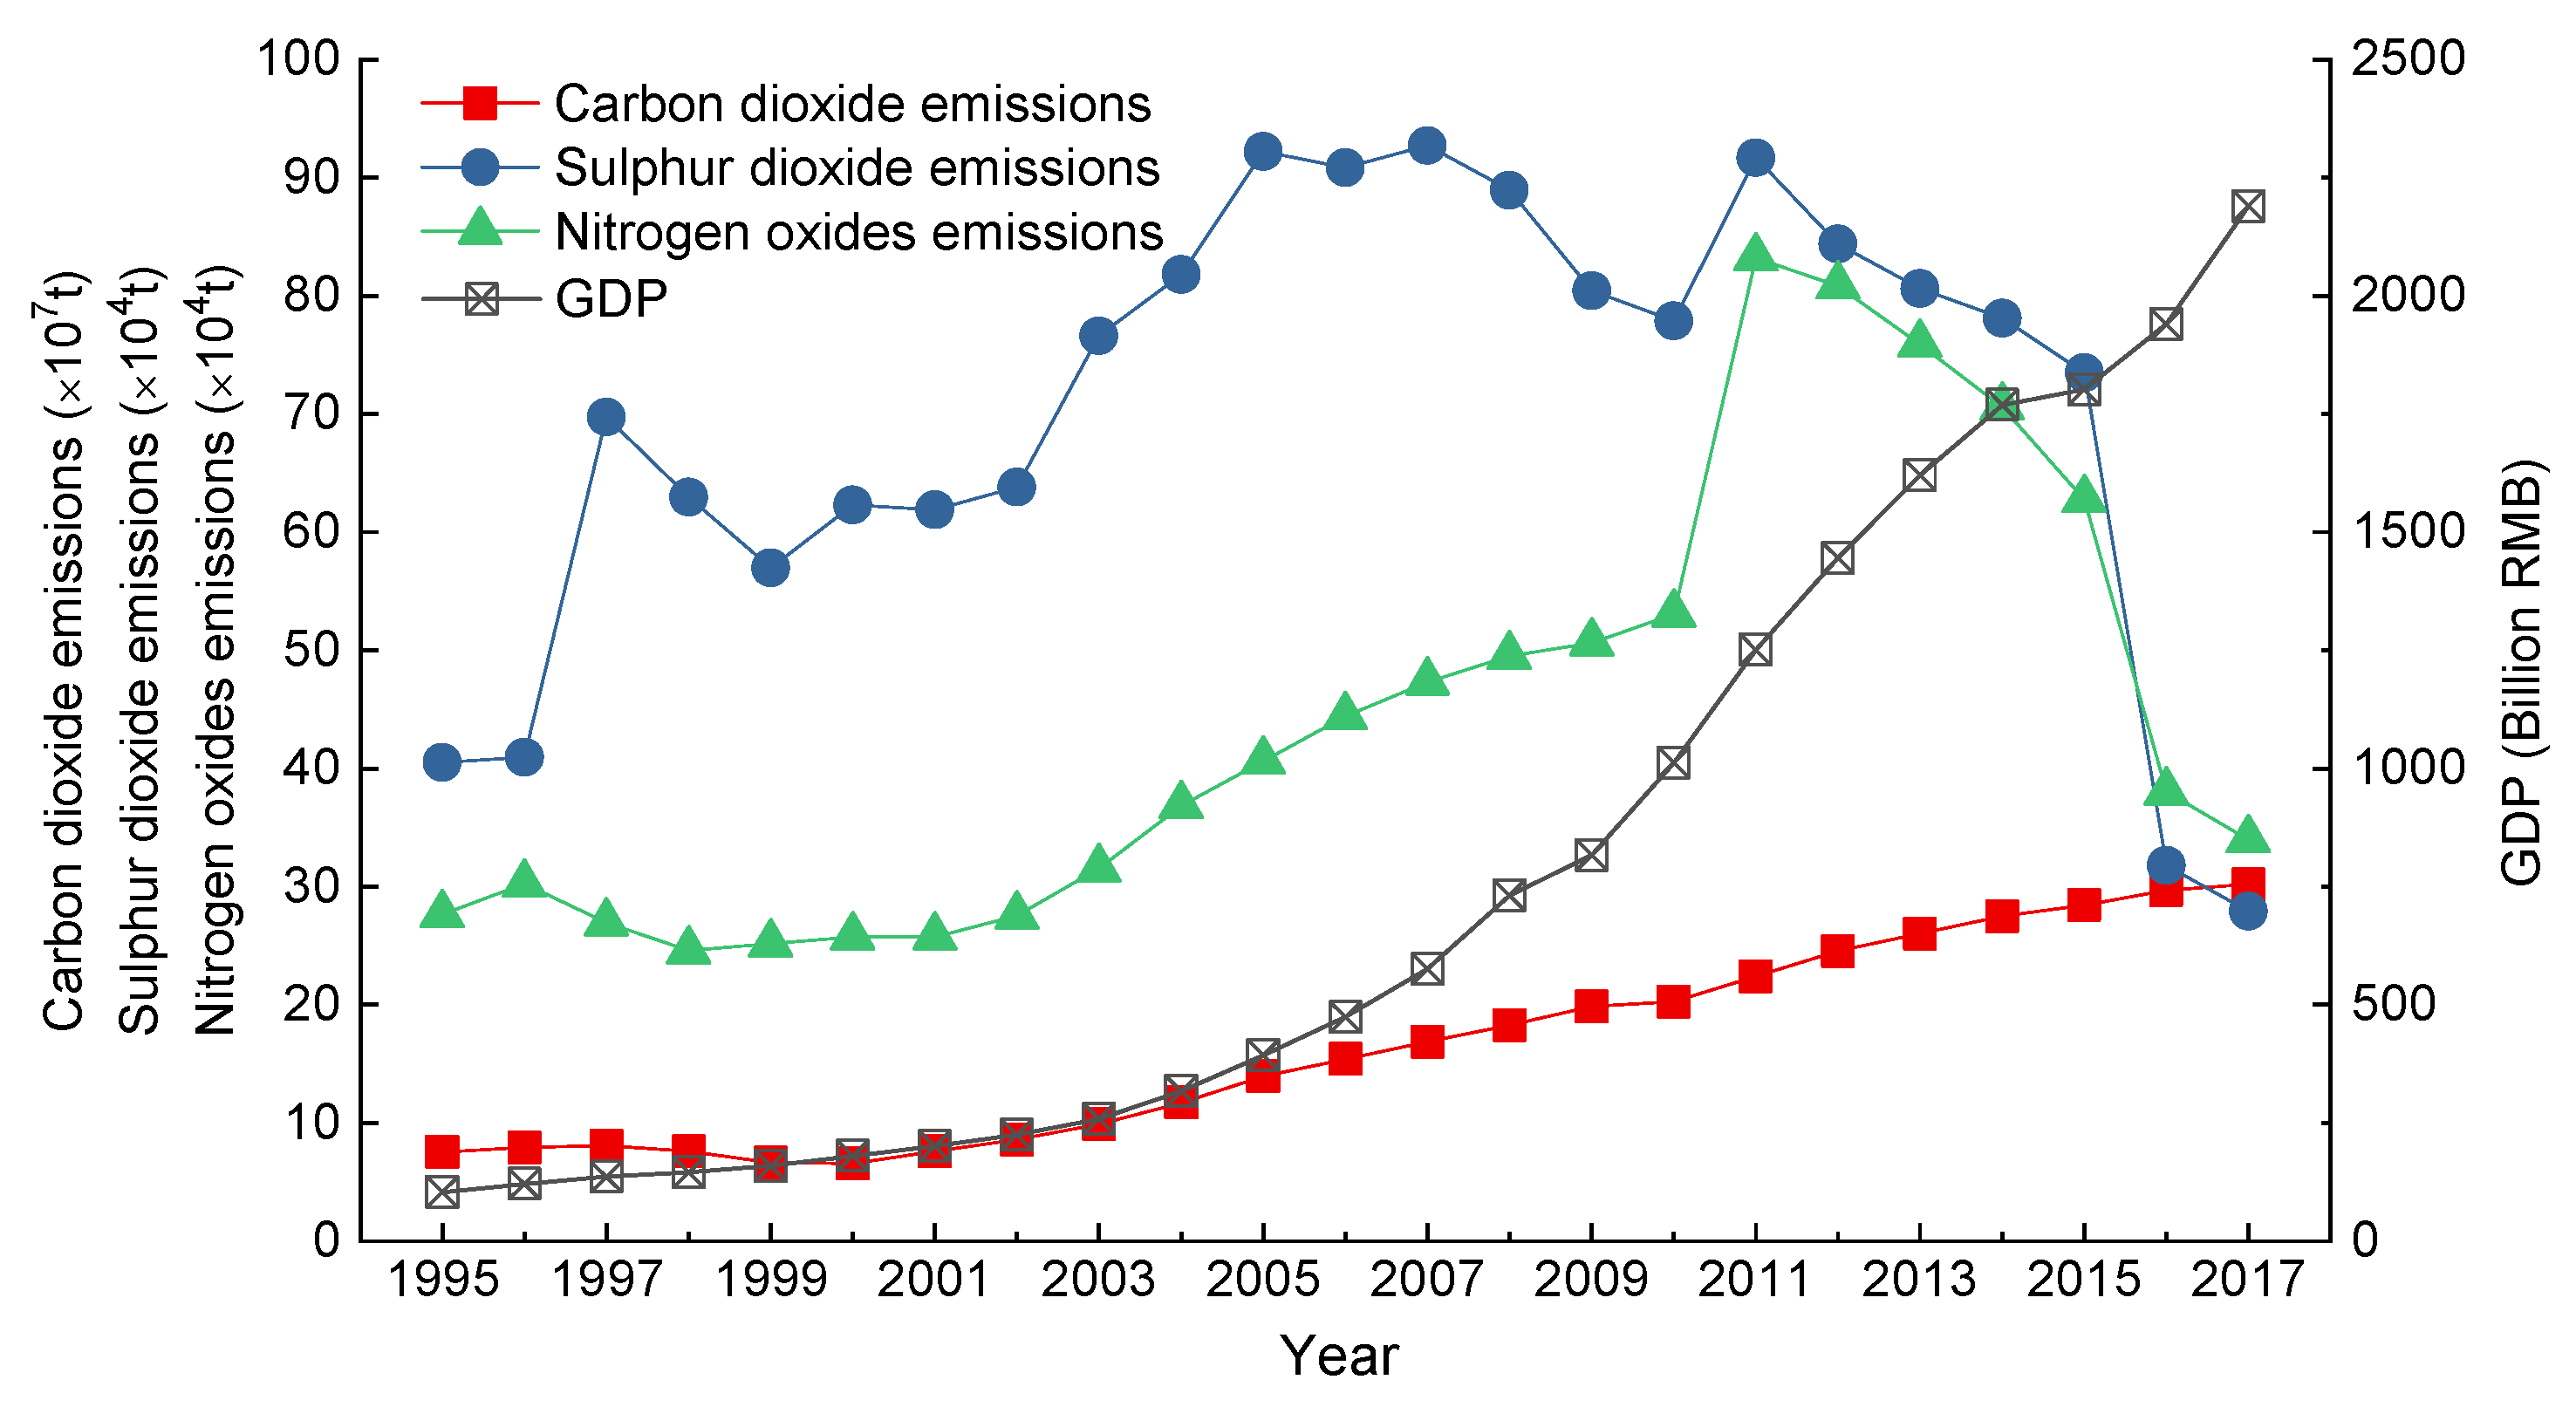
Figure 7.
Average pH and frequency of precipitation in 15 stations from 2007 to 2019.

Figure 8.
Distribution map of acid rain in Shaanxi Province.
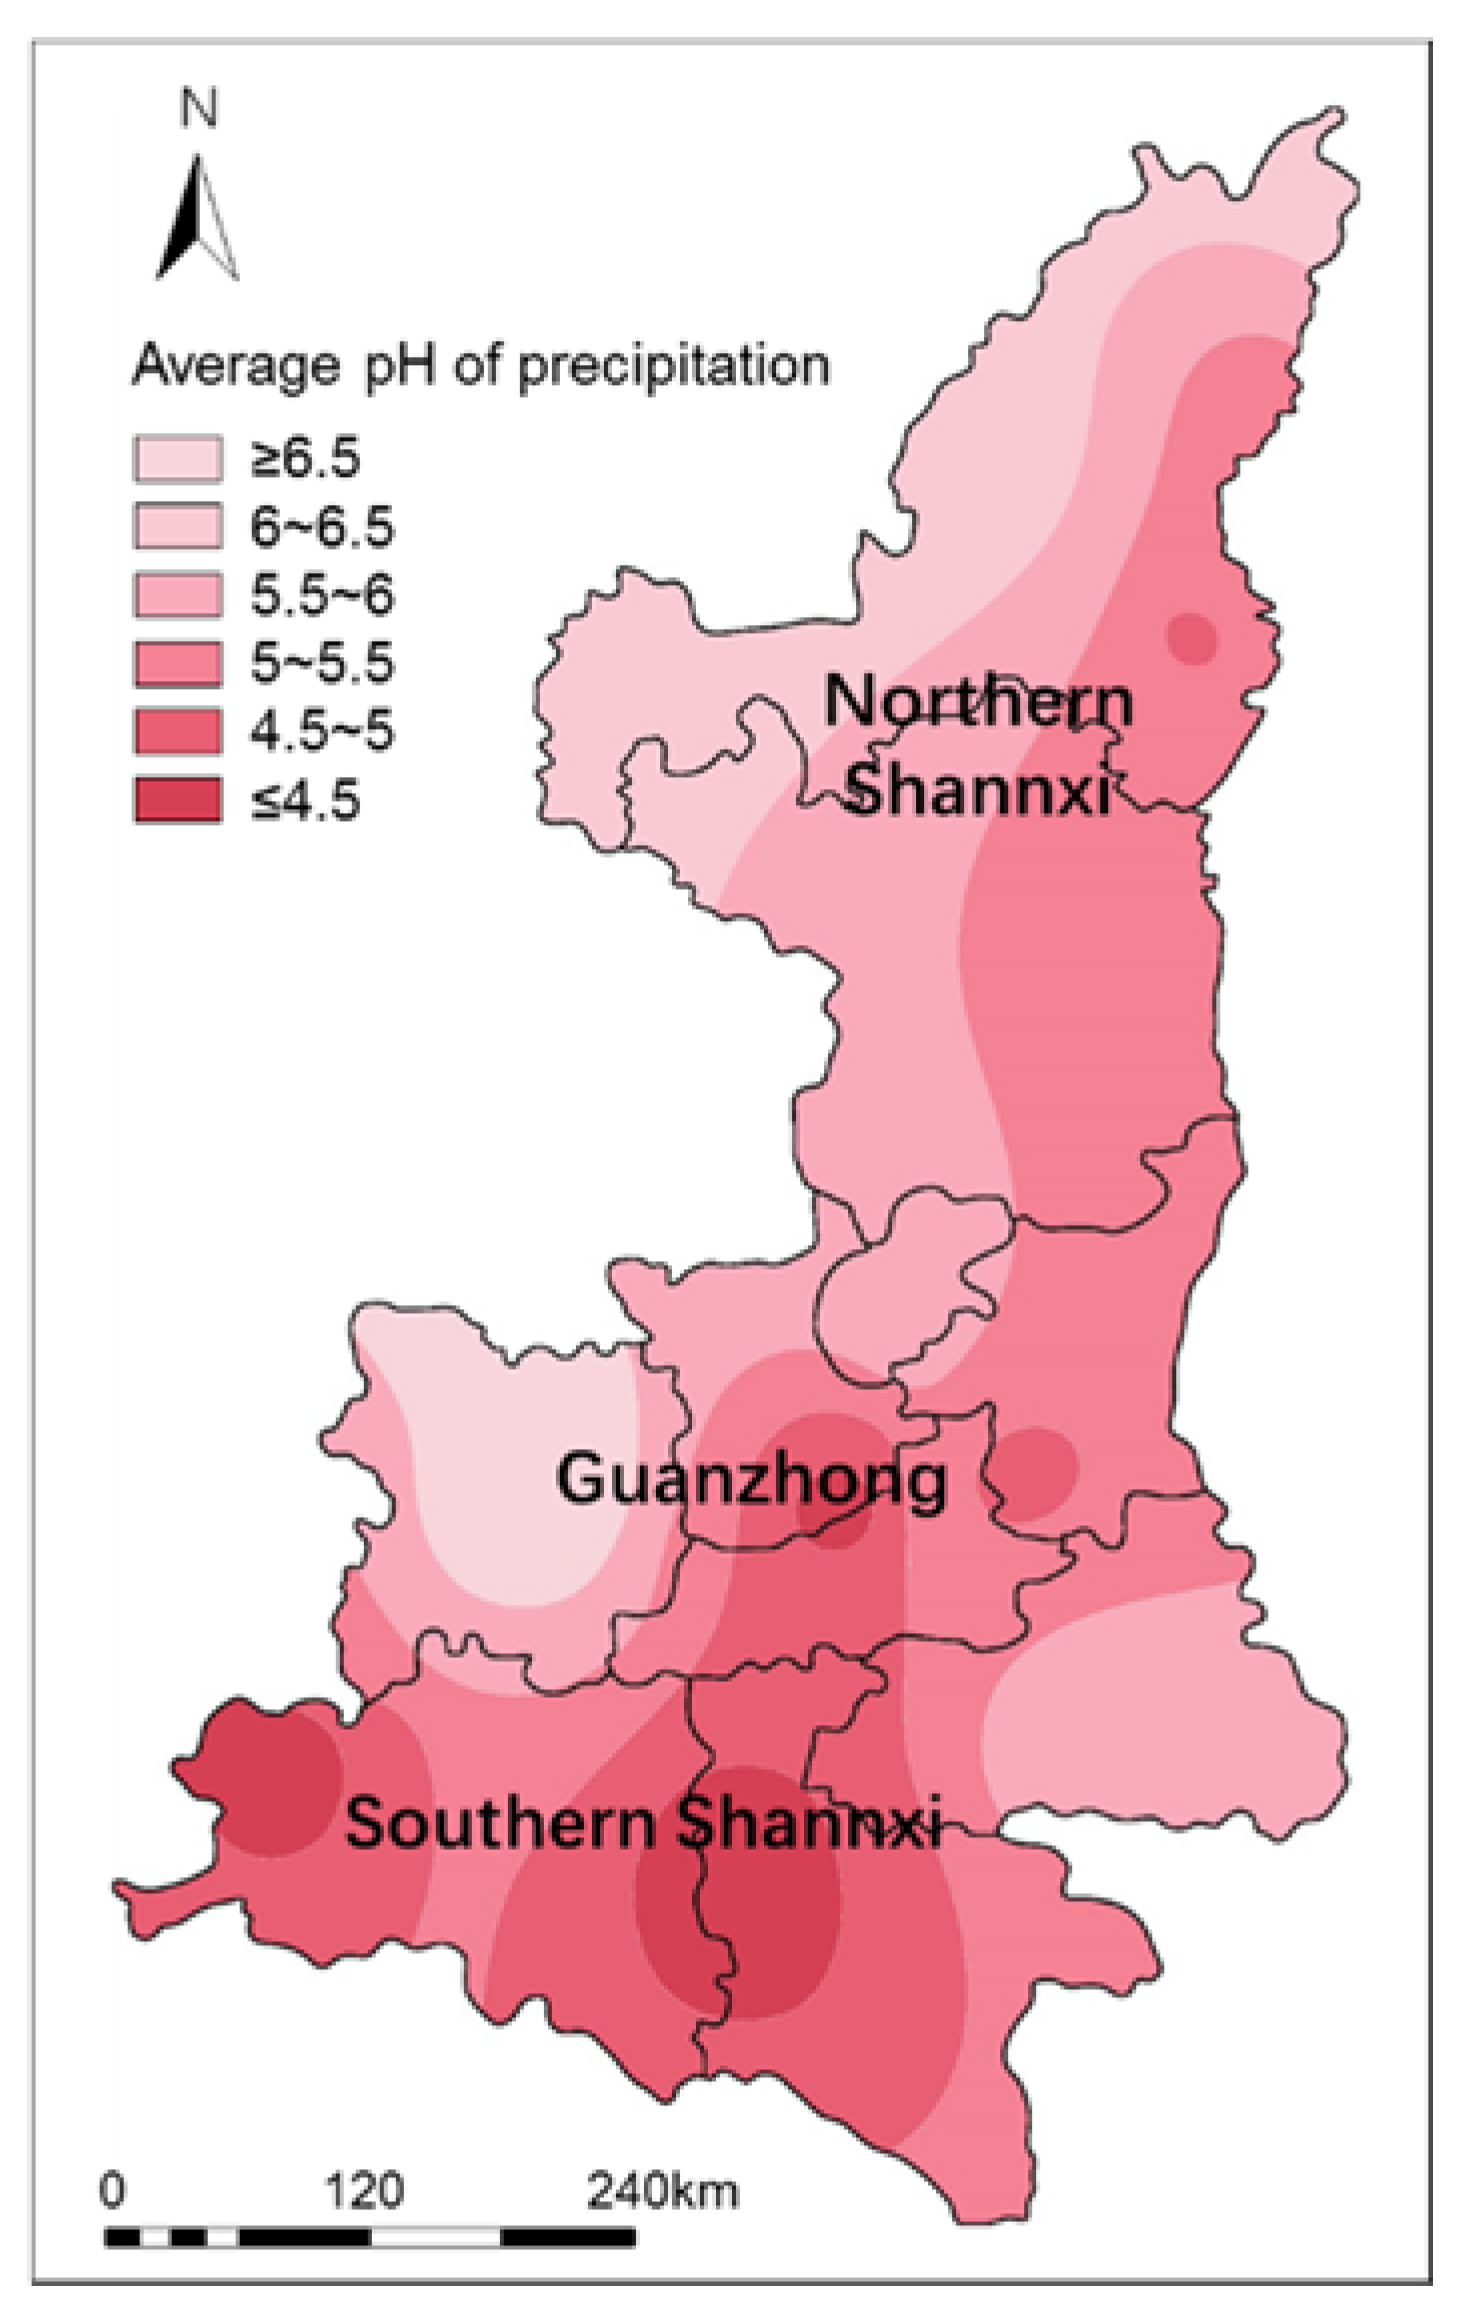
Figure 9.
Durability zoning map of concrete structures in Shaanxi Province, SFT, FT, MFT, SAR, AR, MAR = severe freeze-thaw, moderate freeze-thaw, mild freeze-thaw, severe acid rain, moderate acid rain, and mild acid rain.
Figure 9.
Durability zoning map of concrete structures in Shaanxi Province, SFT, FT, MFT, SAR, AR, MAR = severe freeze-thaw, moderate freeze-thaw, mild freeze-thaw, severe acid rain, moderate acid rain, and mild acid rain.

Table 1.
Statistical characteristics of annual average temperature in Shaanxi Province (°C).
| Region | Mean Value | Standard Deviation | Skewness Coefficient | Kurtosis Coefficient | Range of Variation | Range | Variation Coefficient |
|---|---|---|---|---|---|---|---|
| Northern Shaanxi | 9.24 | 0.62 | 0.374 | −0.245 | 7.97~10.63 | 2.66 | 0.07 |
| Guanzhong | 12.08 | 0.49 | 0.383 | −0.633 | 11.13~13.15 | 2.02 | 0.04 |
| Southern Shaanxi | 13.70 | 0.44 | 0.183 | −0.807 | 12.97~14.61 | 1.64 | 0.03 |
Table 2.
Detecting data of concrete structures (extract).
| Sample Number | Indexes of Environmental Zonation for Concrete Durability | ||||
|---|---|---|---|---|---|
| Annual Freeze-Thaw Cycles | Annual Precipitation (mm) | Average Temperature in July (°C) | Annual Acid Rainfall (mm) | Durability Damage Level | |
| 1 | 113 | 574.9 | 23.9 | 91.9 | 4 |
| 2 | 110 | 562.2 | 23.5 | 101.1 | 3 |
| 3 | 106 | 538.9 | 23.3 | 106.1 | 3 |
| 4 | 117 | 567.1 | 23.5 | 97.4 | 4 |
| 5 | 114 | 542.2 | 23.8 | 103.7 | 3 |
| 6 | 114 | 547.6 | 23.5 | 105.1 | 4 |
| 7 | 103 | 515.2 | 23.1 | 113.7 | 2 |
| 8 | 113 | 572.0 | 23.5 | 95.5 | 4 |
| 9 | 108 | 544.7 | 22.8 | 107.2 | 3 |
| 10 | 109 | 546.1 | 24.2 | 102.0 | 3 |
| 11 | 112 | 570.2 | 23.4 | 94.3 | 4 |
| 12 | 106 | 521.3 | 23.3 | 107.6 | 2 |
| 13 | 107 | 505.5 | 23.7 | 112.0 | 1 |
| 14 | 105 | 517.7 | 23.4 | 110.6 | 2 |
| 15 | 115 | 578.5 | 23.6 | 95.3 | 4 |
| 16 | 104 | 505.1 | 23.0 | 111.3 | 1 |
| 17 | 116 | 543.5 | 23.5 | 101.9 | 4 |
| 18 | 108 | 566.8 | 23.2 | 100.8 | 3 |
| 19 | 108 | 510.3 | 23.6 | 111.3 | 2 |
| 20 | 115 | 545.6 | 23.3 | 106.7 | 3 |
| 110 | 543.8 | 23.4 | 103.8 | 3 | |
| 4.37 | 23.69 | 0.30 | 6.33 | 0.97 | |
Table 3.
Result of environmental zonation for concrete durability in Shaanxi Province.
| Zones | Weight of the Indexes for Environmental Zonation | Typical City | ||||
|---|---|---|---|---|---|---|
| Annual Freeze-Thaw Cycles | Annual Precipitation | Average Temperature in July | Annual Acid Rainfall | |||
| Freeze-Thaw Cycle Zone (Zone I) | Severe freeze-thaw (Zone Ia) 1 | 0.4231~0.5170 | 0.1722~0.2358 | 0.1152~0.1875 | 0.0202~0.2003 | Fugu, Shenmu |
| Moderate freeze-thaw (Zone Ib) | 0.3076~0.4611 | 0.1361~0.2404 | 0.0221~0.1813 | 0.1018~0.2384 | Yulin, Hengshan, Jingbian, Dingbian, Wuqi, Zhidan, Ansai, Ganquan, Fuxian | |
| Moderate freeze-thaw with mild acid rain (Zone Ic) | 0.2845~0.4212 | 0.1533~0.2398 | 0.1421~0.1943 | 0.1592~0.2822 | Suide, Mizhi, Jiaxian, Wubao, Qingjian, Zizhou, Zichang, Yanchuan, Yanchang, Yan’an, Yichuan, Luochuan, Huanglong, Huangling, Changwu, Xunyi, Yijun, Binxian. | |
| Neutralization–Freeze-Thaw Interaction Zone (Zone II) | Severe acid rain with mild freeze-thaw (Zone IIa) | 0.1462~0.2572 | 0.2082~0.2810 | 0.0576~0.1652 | 0.3512~0.4675 | Xi’an, Xianyang, Xingping, Tongchuan, Weinan, Gaoling, Zhouzhi, Huxian, Lantian, Sanyuan, Jingyang, Qianxian, Liquan, Huaxian, Fuping. |
| Moderate acid rain with mild freeze-thaw (Zone IIb) | 0.2195~0.3023 | 0.2124~0.2708 | 0.1199~0.2124 | 0.2764~0.3743 | Baoji, Taibai, Wugong, Qishan, Fufeng, Meixian, Yongshou, Chunhua, Hancheng, Heyang, Dali, Pucheng, Baishui, Chengcheng, Huayin, Tongguan, Xunyang, Baihe, Shangluo, Zhen’an, Zhashui, Luonan, Danfeng, Shanyang. | |
| Mild acid rain with mild freeze-thaw (Zone IIc) | 0.2023~0.2863 | 0.2129~0.2545 | 0.1741~0.2318 | 0.2036~0.3201 | Longxian, Qianyang, Fengxiang, Linyou, Fengxian, Shangnan. | |
| Neutralization Zone (Zone III) | Severe acid rain (Zone IIIa) | 0.1097~0.1948 | 0.1245~0.2941 | 0.0785~0.1088 | 0.4425~0.5249 | Ningqiang, Lueyang, Mianxian, Hanyin, Shiquan, Ningshan. |
| Moderate acid rain (Zone IIIb) | 0.1362~0.2316 | 0.2198~0.3753 | 0.1856~0.2851 | 0.3518~0.4699 | Hanzhong, Liuba, Nanzheng, Chenggu, Yangxian, Xixiang, Zhenba, Foping, Ankang, Ziyang, Langao, Pingli | |
| Mild acid rain (Zone IIIc) | 0.1037~0.1232 | 0.3495~0.3772 | 0.2433~0.2678 | 0.3247~0.4012 | Zhenping | |
1 Each first-level zone is subdivided into three second-level zones, namely Ia, Ib, Ic, etc.
© 2020 by the authors. Licensee MDPI, Basel, Switzerland. This article is an open access article distributed under the terms and conditions of the Creative Commons Attribution (CC BY) license (http://creativecommons.org/licenses/by/4.0/).
Share and Cite
MDPI and ACS Style
Luo, D.; Wang, Y.; Zhang, S.; Niu, D. Application of Fuzzy and Rough Sets to Environmental Zonation for Concrete Durability: A Case Study of Shaanxi Province, China. Sustainability 2020, 12, 3128. https://doi.org/10.3390/su12083128
AMA Style
Luo D, Wang Y, Zhang S, Niu D. Application of Fuzzy and Rough Sets to Environmental Zonation for Concrete Durability: A Case Study of Shaanxi Province, China. Sustainability. 2020; 12(8):3128. https://doi.org/10.3390/su12083128
Chicago/Turabian StyleLuo, Daming, Yan Wang, Shaohui Zhang, and Ditao Niu. 2020. "Application of Fuzzy and Rough Sets to Environmental Zonation for Concrete Durability: A Case Study of Shaanxi Province, China" Sustainability 12, no. 8: 3128. https://doi.org/10.3390/su12083128
Note that from the first issue of 2016, this journal uses article numbers instead of page numbers. See further details here.