Article

Characterization and Evaluation of MODIS-Derived Crop Water Stress Index (CWSI) for Monitoring Drought from 2001 to 2017 over Inner Mongolia

1
School of Geography and Tourism, Anhui Normal University, Wuhu 241002, China
2
State Key Laboratory of Surface Process and Resource Ecology, Beijing Normal University, Beijing 100875, China
3
Academy of Disaster Reduction and Emergency Management, Faculty of Geographical Science, Beijing Normal University, Beijing 100875, China
*
Authors to whom correspondence should be addressed.
Sustainability 2021, 13(2), 916; https://doi.org/10.3390/su13020916
Submission received: 26 December 2020 / Revised: 10 January 2021 / Accepted: 14 January 2021 / Published: 18 January 2021
(This article belongs to the Section Air, Climate Change and Sustainability)

Abstract

:
Inner Mongolia is one of the main green production bases of agricultural and animal husbandry products. Due to factors such as natural geographical location, drought occurs frequently in Inner Mongolia. Based on the MOD16 product and the method of crop water stress index (CWSI) combined with multi-year precipitation and temperature data, the spatial and temporal distribution characteristics and major influencing factors of drought in Inner Mongolia from 2001 to 2017 were analyzed. In order to provide effective scientific basis for drought control and drought resistance in Inner Mongolia for decision. The results showed that: (1) during 2001–2017, the average annual CWSI in Inner Mongolia had a strong spatial heterogeneity, which showed a trend of gradual increase from northeast to southwest. The annual average CWSI was 0.7787 and showed a fluctuating downward trend for Inner Mongolia. (2) The CWSI of every 8d during one year in Inner Mongolia showed the double-peak trend, reaching its maximum of 0.9043 in the 121st day. In addition, the average CWSI of every 8d was 0.6749. (3) In Inner Mongolia, the average CWSI of different land-use types showed little difference and ranged from small to large: woodland (0.5954) < cropland (0.7733) < built-up land (0.8126) < grassland (0.8147) < unused land (0.8392). (4) The average correlation coefficients between CWSI and precipitation, temperature respectively were −0.53 and 0.18, which indicated that CWSI was highly correlated with precipitation in Inner Mongolia.

1. Introduction

Drought is a recurring natural disaster that frequently occurs and lasts for a long time and has an important impact on economic development and ecological environment construction, especially on agricultural production [1,2]. Drought is generally divided into four types: meteorological drought, agricultural drought, hydrological drought and socio-economic drought [3]. At present, the main research fields are meteorological drought and agricultural drought but agricultural drought is more complex. Daily, monthly and annual weather and climate disturbances in agricultural region have a significant impact on local and regional scales [4].
With the development of remote sensing technology, many scholars had used satellite land observation data to monitor the dynamic changes of various land surface [5,6,7]. Compared with traditional observation methods, remote sensing monitoring provides continuous temporal and spatial monitoring of vegetation cover, soil moisture level and drought severity [8]. Therefore, drought indices derived from remote sensing-based measurements have been widely applied to monitor agricultural drought conditions, including temperature vegetation drought Index (TVDI), anomaly vegetation index (AVI), Vegetation condition index, VCI), crop water stress index (CWSI), perpendicular drought index (PDI), et al. [9,10,11]. The crop water stress index (CWSI) is based on the surface energy balance theory, which has high measurement accuracy and clear physical definition [12]. It is an important factor that is superior to other drought indices. In addition, the CWSI also considers the effects of wind speed, water vapor pressure, sunshine hours and temperature [11]. However, its calculation is complex and requires the participation of conventional meteorological data and ground observation data, which limits the application of CWSI [13]. In 2011, the National Aeronautics and Space Administration (NASA) research team made significant advance in evapotranspiration (ET) retrieval from moderate MODIS data based on the Penman-Monteith (P-M) equation [14,15] and the global MOD16 data were released with high temporal-spatial resolution and free access [16]. It provides a new idea for the calculation of CWSI. At present, many scholars have validated MOD16 products, which shows that the data has a wide range of applications and high reliability. In addition, it had been widely applied in some field such as water use efficiency, monitoring of wet and dry patterns, estimating actual evapotranspiration and water deficit footprint and some scholars made significant progress [17,18,19]. Hence, MOD16 data has more extensive application value in drought monitoring.
The Inner Mongolia is one of the major producing areas of agricultural and animal husbandry products in China. However, the frequent occurrences of droughts pose a significant threat to agricultural and animal husbandry production in the region. Therefore, in order to perform drought monitoring and research for the Inner Mongolia, the development of the appropriate drought monitoring model to analyze the spatial-temporal evolution and severity of droughts has great importance to agricultural, animal husbandry production and economic development. In this study, CWSI was used to analyze the spatial-temporal changes of drought in Inner Mongolia from 2001 to 2017 and the major influencing factors of drought in Inner Mongolia were discussed. The purpose of this study was to evaluate CWSI in the Inner Mongolia area of drought monitoring effectiveness, provide scientific basis for drought control and drought resistance decision.

2. Materials and Methods

2.1. Study Area

The Inner Mongolia (37°24′ N–53°23′ N, 97°12′ E–126°04′ E) is located in the northern frontier of China. With 1,183,000 km2 in size, it is about 13% of the total area of the China. It spans the northeast, north and northwest regions of the China, adjacent to eight provinces in China and adjacent to Mongolia and Russia (Figure 1). The climate in the area, which gradually transits from humid and semi-humid areas to semi-arid and arid areas from east to west, is mainly temperate continental monsoon climate, with annual precipitation between 46 mm to 489 mm. However, annual average evaporation is between 942 and 4138 mm and the degree of drought is more serious [20]. Geomorphological types are complex and diverse, mainly in plateau, with an average elevation of more than 1000 m. Due to the obvious spatial differences in climate, the vegetation types from east to West are forest, grassland and desert in turn. Because of the special geographical location, topography and climatic conditions, the ecological environment in this area is extremely fragile, grassland degradation, serious soil erosion and unbalanced distribution of water resources [21,22,23,24,25]. Drought is one of the most serious natural disasters in the study area.

2.2. Data Sources and Processing

The data used in this paper include land use data, meteorological data, remote sensing data and relative soil moisture data (Table 1).
(1)
Land use data
The land use data used in this study are the standard grid data products with 1 km resolution provided by Resource and Environment Science Data Center of Chinese Academy of Sciences, including 2000, 2005, 2010 and 2015. Using ENVI and ArcGIS, the land cover data in China were cut and reclassified and classified into six first-class land types: cropland, woodland, grassland, water body, built-up land and unused land (Figure 1). The spatial resolution of the data is consistent with that of MOD16.
(2)
Meteorological data
Meteorological data (temperature, precipitation) of 44 weather stations in Inner Mongolia from 2001 to 2017 were provided by the China meteorological data sharing network. The basic information and the specific geographical location of 44 meteorological stations is shown in Table 2 and Figure 1. Based on the longitude and latitude data of weather stations in this study area, the spatial distribution of meteorological elements was realized by Kriging interpolation under the ArcGIS and the grid data of meteorological elements were obtained and the spatial resolution was consistent with MOD16 data. The time series of annual average precipitation and temperature in this study area were calculated.
(3)
Remote sensing data
MOD16 products synthesized in 8 days from 2001 to 2017 were provided by NASA. The satellite orbital number is h25v03/h25v04/h25v05/h26v03/h26v04/h26v05/h27v04, including actual evapotranspiration (MOD16ET) and potential evapotranspiration (MOD16PET) data. With the help of MRT software provided by NASA, the original HDF format was transformed into GeoTiff format and the SIN projection was transformed into the WGS~1984/Geographic longitude and latitude coordinate system, which was mosaic and clipping. According to the data usage instructions provided by the website, the invalid values in the data were eliminated and the real values were restored. The ET/PET data of 8D were weighted averagely to obtain the ET and PET values of each year, month in this study area.
(4)
Relative soil moisture data
The data set of crop growth and development in China provided by China Meteorological Data Network is based on the ten-day monthly Agrometeorological data reported by China Agrometeorological Stations since 1991 (http://data.cma.cn/data/). There were 31 observatories in Inner Mongolia with sampling depths of 10, 20, 50, 70 and 100 cm and the observation time was every ten days. Due to the influence of weather, man-made, instruments and other factors, some stations lack data integrity. Therefore, based on the comprehensive consideration of data integrity, month continuity and 20 cm relative soil moisture as the drought classification standard of the National Meteorological Administration, 16 stations with complete data were finally screened out, including 2003–2009 and April–September 2011 (After thawing and before freezing) 10-day 20 cm relative soil moisture data, according to the climatic conditions in this study area, the abnormal values were eliminated and the 10-day data were weighted averagely to synthesize monthly relative soil moisture data. The basic information and the specific 16 agrometeorological stations is shown in Table 3 and Figure 1.

2.3. Methods

2.3.1. Crop Water Stress Index

Crop water stress index (CWSI), based on the principle of surface energy balance, has high measurement accuracy and clear physical significance, which is one reason why it is superior to other drought indexes. In addition, CWSI does not need to consider that the study area has all land use types, moreover, factors such as the vegetation cover of the underlying surface, wind speed, water vapor pressure, sunshine duration and air temperature are fully considered [25,26]. Jackson et al. studied CWSI and defined CWSI as [27,28]:
C W S I = 1 E T P E T ,
where ET is the actual evapotranspiration, PET is the potential evapotranspiration, CWSI is between 0 and 1, the larger the value is, the more arid and water-deficient the region is. Conversely, the smaller the value, the wetter it is.

2.3.2. Linear Tendency Estimation

The temporal linear propensity ratio of CWSI for each pixel from 2001 to 2017 is calculated by using linear tendency estimation. The calculation formula is as follows:
slop = n i = 0 n ( t i × C W S I i ) - i = 0 n t i i = 0 n C W S I i n i = 0 n t i 2 - ( i = 0 n t i ) 2 ,
where slope is linear tendency rate; ti = 2001, 2002, ……, 2017; n is the total length of the annual sequence (n = 17); CWSIi is the cumulative value of annual CWSI of the ith year; When slope > 0, with the increase of time, CWSI tends to increase, whereas CWSI tends to decrease. According to the significance test and linear tendency estimation of correlation coefficient, the change trend of CWSI was divided into seven grades (Table 4).

2.3.3. Correlation Coefficient Method

The correlation between CWSI of each pixel in Inner Mongolia and precipitation, temperature is calculated. The simple correlation coefficient is used to express the correlation. The formula is as follows:
r = i = 0 n [ ( C W S I i C W S I ¯ ) ( x i x ¯ ) ] ( C W S I i C W S I ¯ ) 2 i = 0 n ( x i x ¯ ) 2 ,
where r is a simple correlation coefficient between the two variables; C W S I ¯ is the average value of CWSI from 2001 to 2017; xi is the precipitation or temperature value of the ith year; x ¯ is the average value of precipitation or temperature from 2001 to 2017; other quantities have the same meaning as before. Moreover, the proportion of area, correlation between CWSI and precipitation, temperature positively and negatively, was calculated by ENVI statistical analysis function.

2.3.4. Drought Suitability Evaluation and Classification Standard

China Meteorological Administration takes the relative soil moisture at 20 cm as the grading standard for drought [29]. Therefore, scholars tested the accuracy of drought monitoring by analyzing the correlation between CWSI and relative soil moisture at 20 cm. While the degree of drought was divided by the linear regression equation between CWSI and relative soil moisture at 20 cm [8,11].

3. Results

3.1. Drought Monitoring Results Test

In order to ensure the accuracy of CWSI drought monitoring results in this study area, the CWSI calculated based on MOD16 products was tested. The results showed that relative soil moisture at 20 cm can effectively reflect the accuracy of CWSI drought detection. Therefore, CWSI is used as a drought monitoring index.
Figure 2 shows the correlation between monthly CWSI and relative soil moisture at 20 cm in 16 stations from 2003 to 2009 and from April to September 2011. The results showed that the correlation coefficient between CWSI and relative soil moisture at 20 cm is −0.86, which indicated that the CWSI calculated by MOD16 has good validation accuracy and applicability in Inner Mongolia and can be used for drought monitoring in this area.
In addition, the results show that the linear regression equation between CWSI and relative soil moisture (RSM) at 20 cm is y = −0.0063x + 1.1505, where y is CWSI and X is soil relative humidity. Finally, the classification standard for drought is determined. The classification is as shown in Table 5.

3.2. Interannual Spatio-Temporal Distribution Characteristics of CWSI

According to the interannual variation of evapotranspiration and crop water shortage index in Inner Mongolia (Figure 3), ET and PET fluctuated little. Among them, the range of ET fluctuation is 211–282 mm, the average ET for many years is 246 mm. In addition, the range of PET fluctuation is 1024–1210 mm, the average PET for many years is 1110 mm. The range of the difference between PET and ET is 742–981 mm and the average difference for many years is 864 mm. ET is increasing slowly, PET is decreasing slowly, DET is decreasing obviously, CWSI is decreasing obviously, indicating that the difference between PET and ET is increasing slowly. The trend of drought in Mongolia has slowed down. The average CWSI for many years is 0.7787. The maximum value appears in 2001 (0.8189) and the minimum value in 2016 (0.7243). As a whole, Inner Mongolia is in a mild state of drought.
Statistical results of CWSI of Inner Mongolia cities (Figure 4) show that the CWSI of each League City in Inner Mongolia region shows a downward trend as a whole from 2001 to 2017. The average values of CWSI of each city are quite different for many years. The order from small to large is Hulunbeier (0.6007) < Hinggan League (0.6837) < Chifeng City (0.7684) < Tongliao City (0.7698) < Hohhot City (0.8286) < Xilin Gol League (0.8296) < Ulanchab City (0.8487) < Ordos City (0.8851) < Baotou City (0.8862) < Bayan Nur (0.8918) < Alxa League (0.9129) < Wuhai City (0.9256). Among them, Hulunbeier, Hinggan League, Chifeng City and Tongliao City are in a drought-free state; Hohhot City and Xilin Gol League are in a mild drought state; Ulanchab City, Ordos City, Baotou City and Bayan Nur are in a moderate drought state; Alxa League and Wuhai City are in a serious drought state. The main reason why the drought degree of Wuhai City is greater than that of Alxa League is that most of the Alxa League area is desert, there is no data, only a small amount of data in its southeastern direction, so it is not enough to reflect the actual situation of the League.
From 2001 to 2017, the spatial distribution of ET, PET and CWSI on the surface of Inner Mongolia has obvious differences (Figure 5a–c). ET shows a strip-like change in the east, the middle and the West on the whole, while PET and CWSI shows a trend of change in the west, the middle and the East on the whole. The trend of CWSI and ET is opposite, which is consistent with that of PET. The annual average ET fluctuation ranges from 39 mm to 677 mm, PET fluctuation ranges from 375 mm to 1874 mm and CWSI fluctuation ranges from 0.3312 to 0.9991. The ET in the Great Hinggan Mountains and the forest-steppe ecotone in eastern Inner Mongolia are significantly higher than those in other regions, while the PET and CWSI values are significantly lower than those in other regions and the annual average CWSI values are below 0.7725 and there is no drought. The ETs of Hunshandake sandy land at the southern end of Xilinguole grassland in central Inner Mongolia and Yinshan Mountain range in Hetao plain of the Yellow River are relatively low, while the PET and CWSI are relatively high and the multi-year average CWSI is above 0.8985, which is characterized by severe drought and extreme drought.
The variation trend of CWSI is opposite with that of ET but it is same as PET. This can be explained by related theory analysis that evapotranspiration is complementary and the definition of CWSI [30]. When the underlying surface is wet enough, ET is equal to PET and CWSI = 0. When the water content is insufficient, the ET decreases and the interaction between the land surface and the atmosphere results in the increase of PET and the increase of CWSI; when there is no water supply, there is basically no evapotranspiration and chamaephyte will wither or die and CWSI equals to 1. In the eastern part of Inner Mongolia, the vegetation coverage and precipitation are higher in the Da Hinggan Mountains and the interlaced areas of woodland and grassland. The lower average annual temperature makes the ET value and PET value larger, so the CWSI is smaller in this area. The Hunshandak sandy land at the southern end of the Xilin Gol Prairie in the central part and the Yinshan Mountains in the Hetao plain of the Yellow River has higher solar radiation, longer sunshine hours, less precipitation, higher temperature and insufficient water supply on the underlying surface, resulting in a lower ET value and a larger PET value, so CWSI is larger here.
The change trends of ET, PET and CWSI from 2001 to 2017 were calculated by Formula (2), the results are shown in Figure 6a–c. According to Table 4, the change trend of CWSI is divided and the results are shown in Figure 6d. The Figure 6a shows that from 2001 to 2017, the annual spatial change rate of ET ranged from −31.39 to 37.92 mm/a, with an average annual change rate of 3.75 mm/a. Among the annual rate of change, 55.84% of the area shows a significant change. Among them, the area with a negative change trend only accounts for 1.62% and the area with a positive change trend is as high as 98.38% and the area larger than 8 mm/a accounts for 7.23%, mainly distributed in the woodland and grassland ecotone and the area with relatively dense farmland (Figure 1). Most of the areas in Hulunbeir failed to pass the significance test, which indicates that the trend of change is obscure.
The annual change rate of PET space is between −104.08 and 86.11 mm/a, the annual change rate is −3.95 mm/a and there is a significant change in the area of 33.08% of the annual rate of change. The area with positive change trend only accounts for 1.99%. The area with a negative change trend is as high as 98.01% and the area smaller than −10 mm/a accounts for 85.57%. It is mainly distributed in the low hilly area in the southeast of Xilin Gol League and the meadow steppe area in the east, while most other areas do not pass the significance test and the change trend is obscure (Figure 6b).
The annual change rate of CWSI space is between −0.0296 and 0.0195, the annual change rate is −0.0047 and there is a significant change in the area of 79.81% of the annual rate of change. The area with positive change trend only accounts for 0.08%. The area with a negative change trend is as high as 99.92% and the area smaller than 0.0089 accounts for 11.65%. The range of variation gradually decreases from east to west and the drought mitigation trend is obvious in the meadow steppe in the east of Xilin Gol League but not in the Yinshan Mountain range and Hunshandak sandy land (Figure 6c–d).

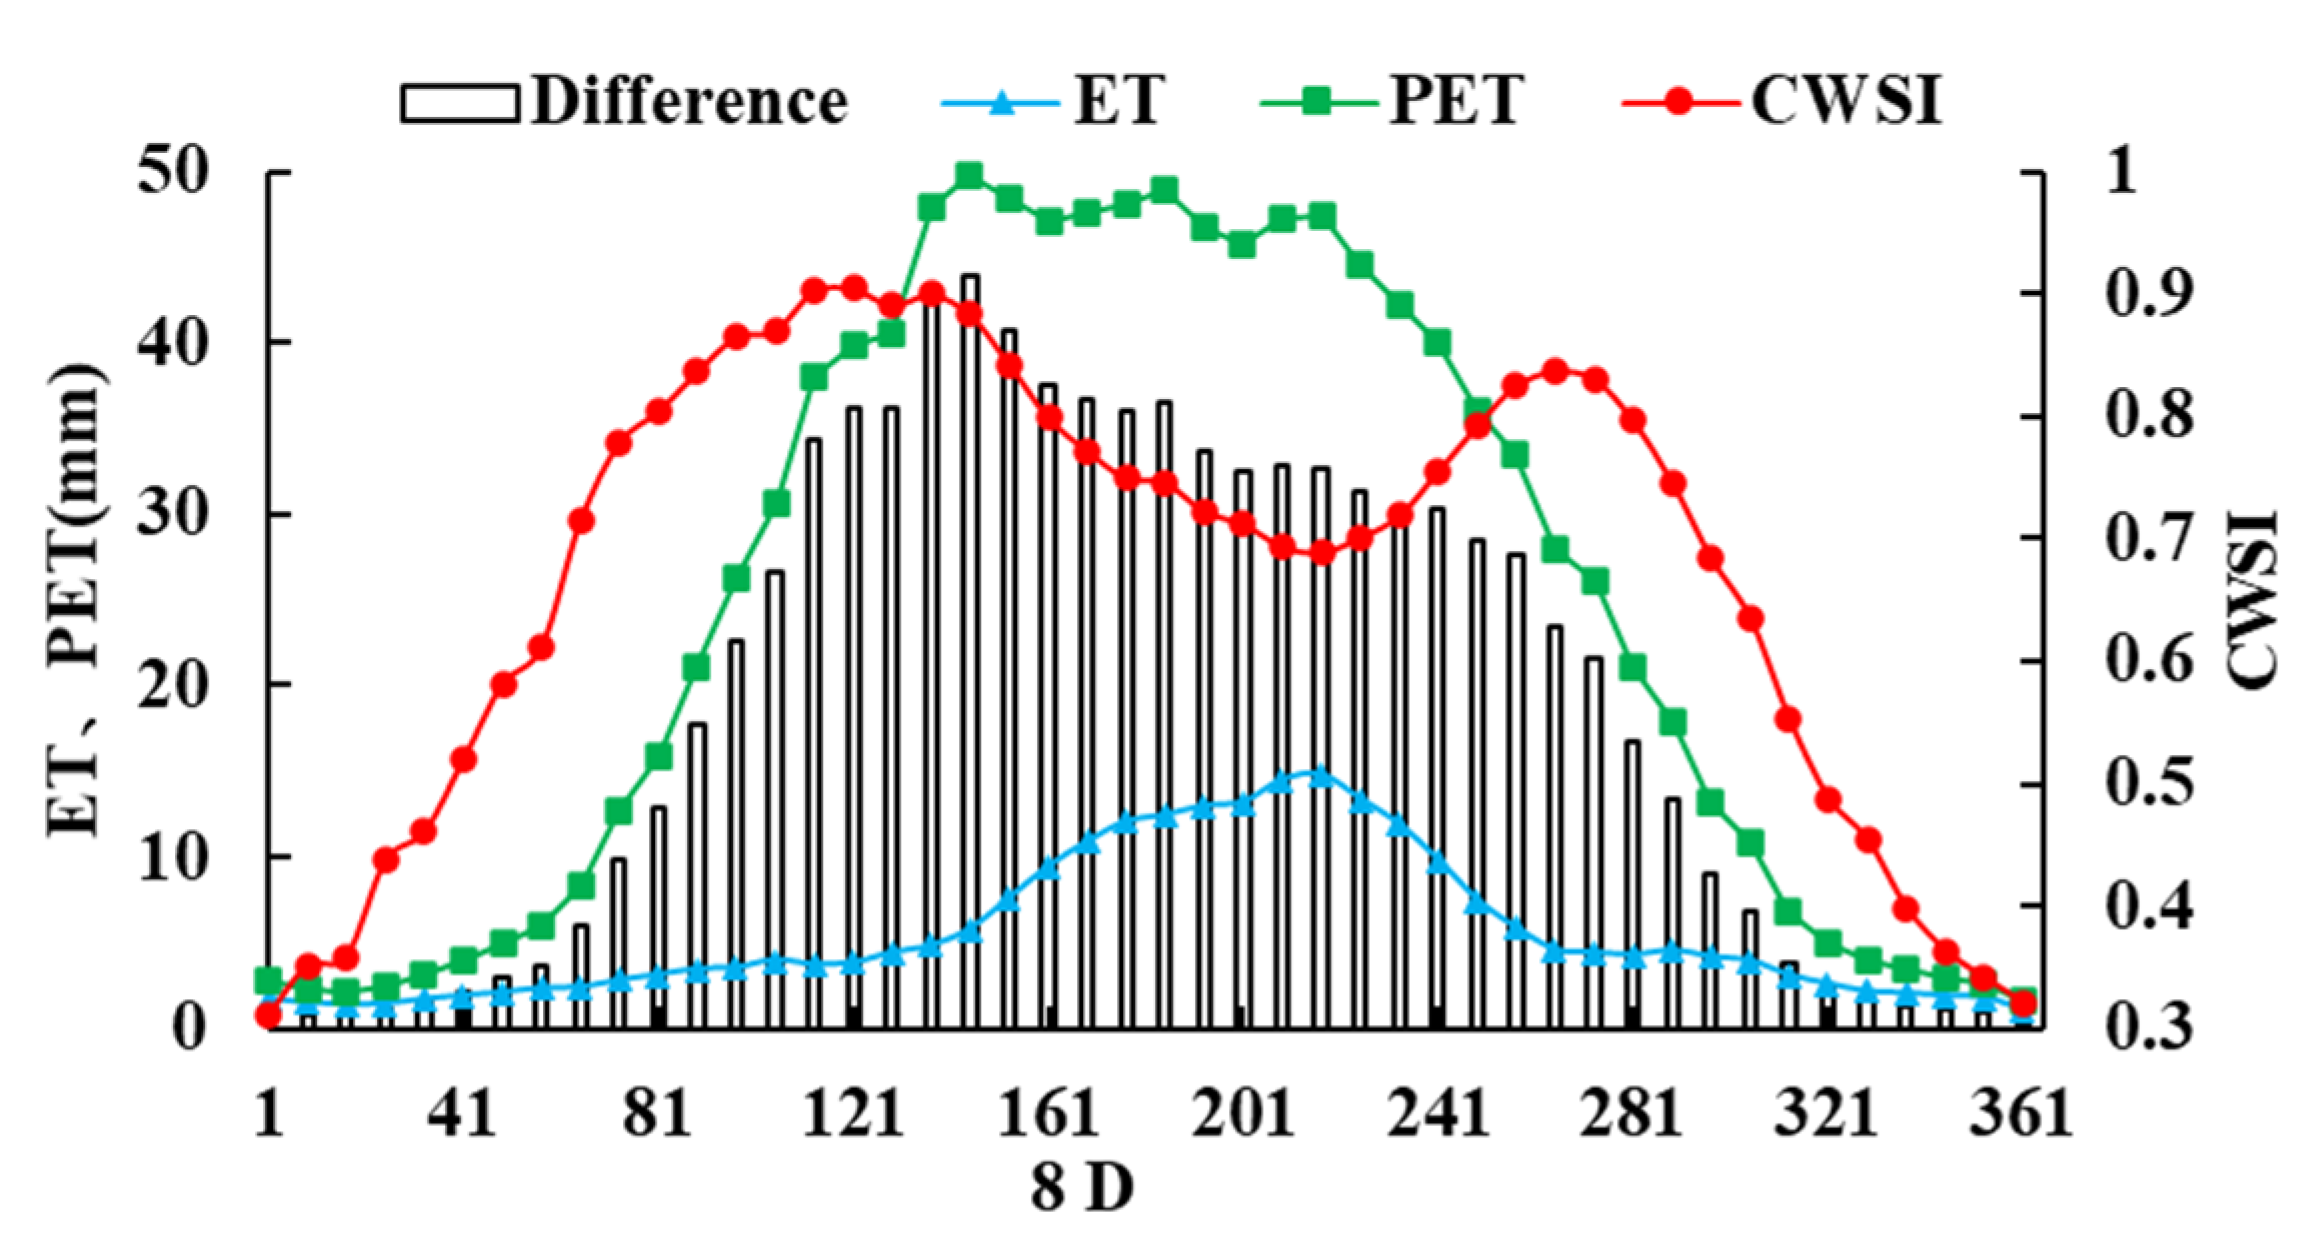
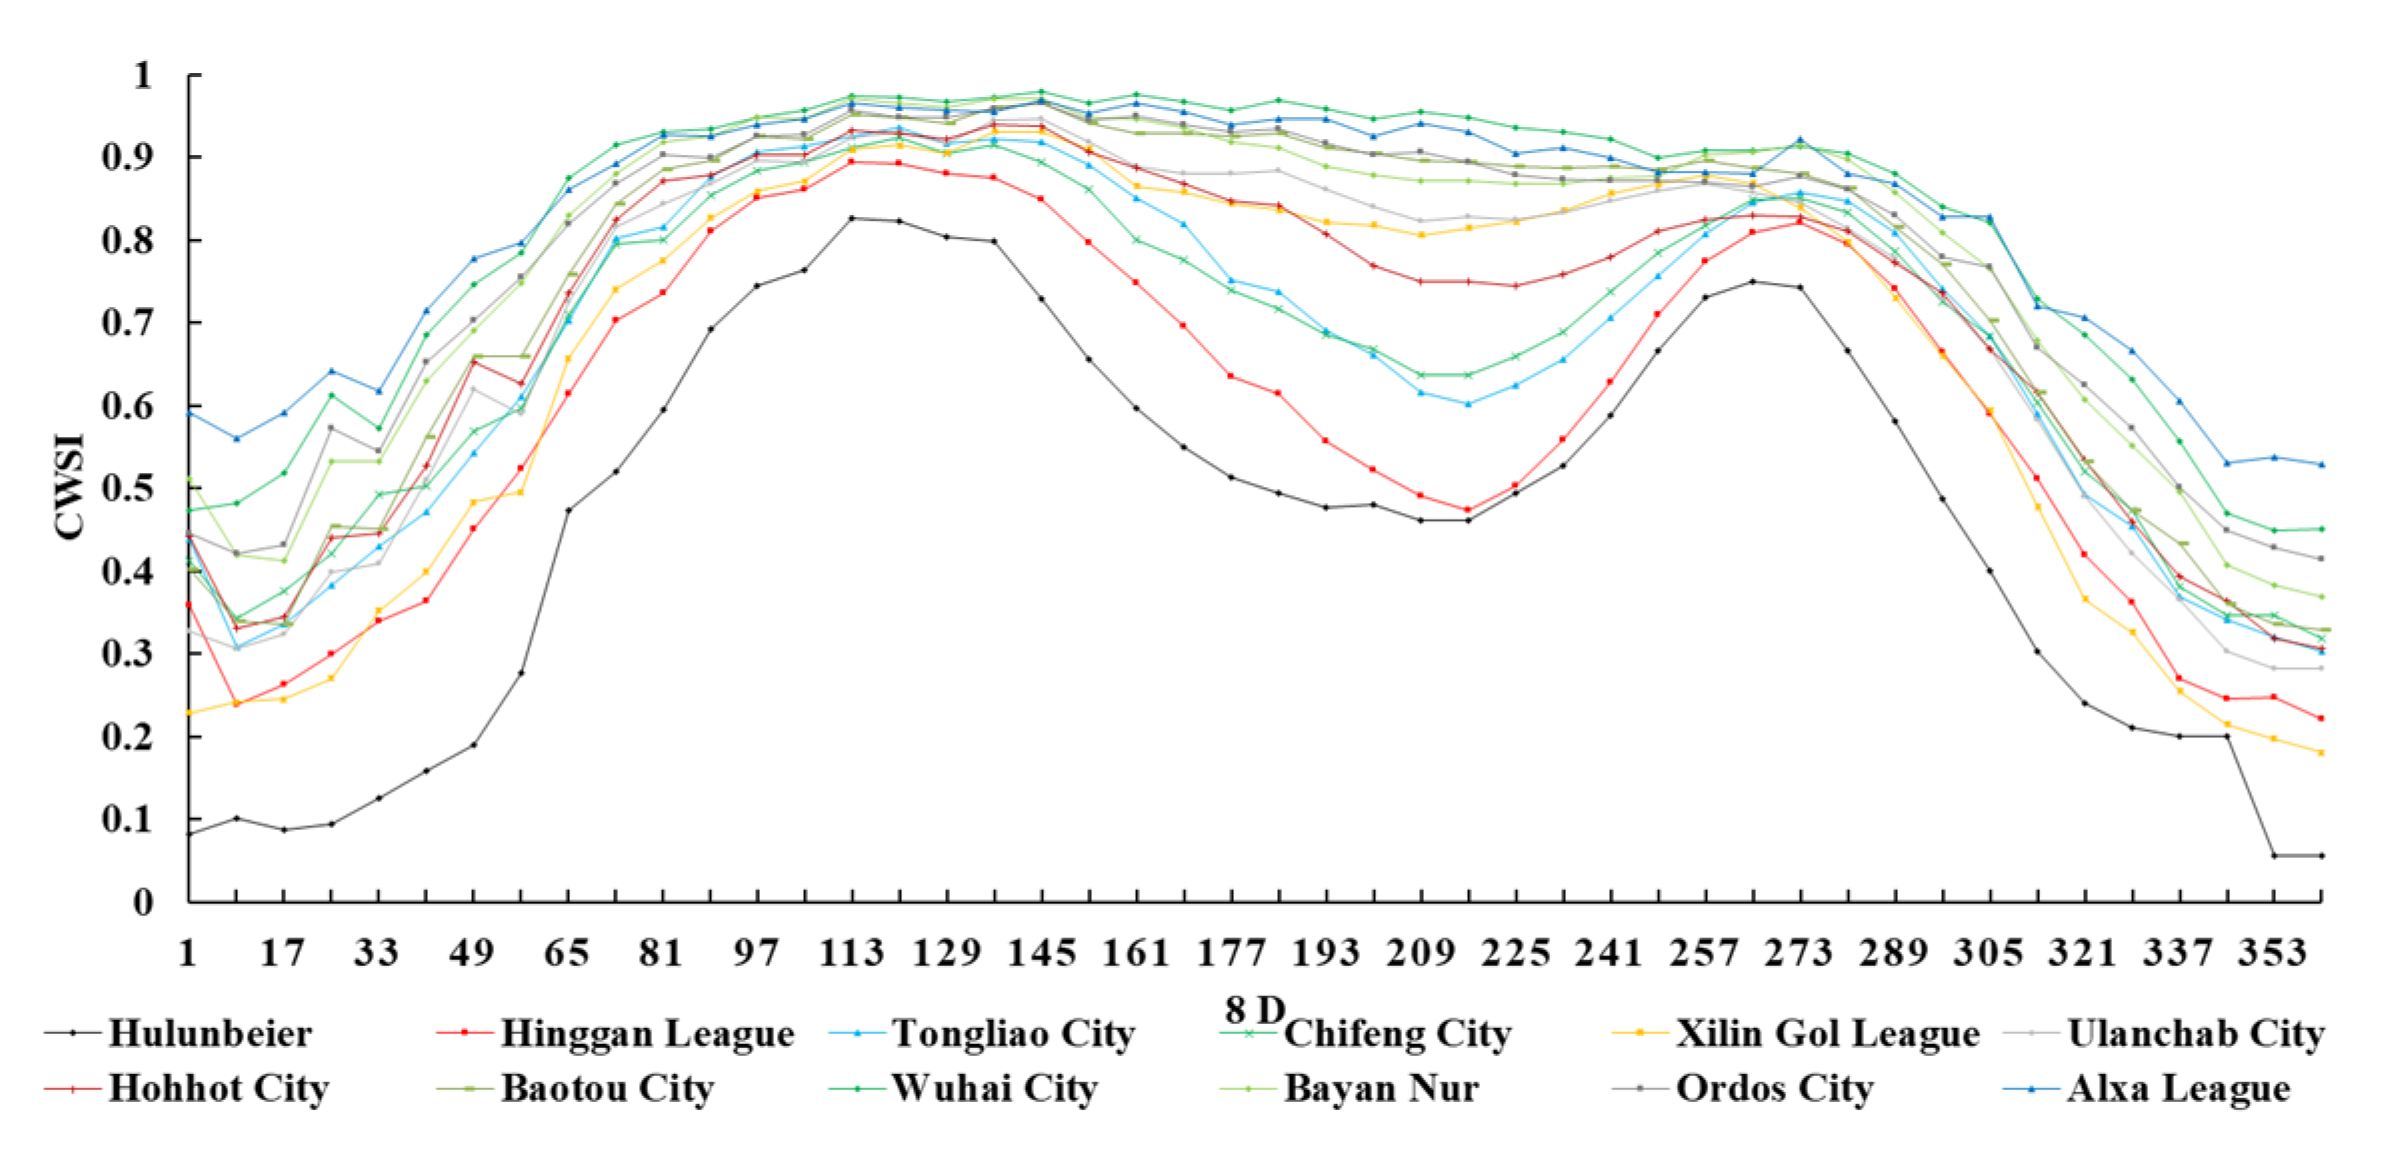
3.3. Spatial-Temporal Distribution Characteristics of CWSI in the Year

Figure 7 shows the annual average change of ET, PET and CWSI in 8 d Mongolia from 2001 to 2017 and as shown in the graph, we can see that the yearly variation of ET in Inner Mongolia area is a single peak curve and the maximum occurs on day 217 (at summer) (14.77 mm); the yearly change of PET also shows a single peak pattern but during day 145 to 217 (late spring to summer), the PET fluctuates slightly and the large value appeared on the 145th day (late spring) (49.75 mm). For specific explanation is that CWSI shows no drought on day 1 to 72 (winter, early spring), day 169 to 248 (summer, early autumn) and day 289 to 365 (366 days a year) (late autumn, winter), which may be caused by the lowest temperature and the lesser potential evapotranspiration on day 1 to 72 (winter, early spring) and day 289 to 365 (366 days a year) (late autumn, winter). But in the period of day 169 to 248, the temperature is higher, the evapotranspiration is stronger and the precipitation is abundant, so the surface water can be replenished in time. CWSI had different degrees of drought on 73 to 168 and day 249 to 288 and on day 113 to 144, it appears to be severe drought. The main reason may be that it is in the spring snow melt period, the temperature rises and the appropriate temperature and moisture are used for forage returning to green, so there is no enough temperature and moisture for evapotranspiration [31,32,33]. While during day 249 to 288, it is in the autumn vegetation withering period, the temperature begins to decrease and the evapotranspiration of vegetation weakens [34]. Therefore, in this period, the overall situation of Inner Mongolia is drought.
In Inner Mongolia, CWSI fluctuates obviously in the year (Figure 8). In the eastern and central regions (except Baotou city), the changes to the Bayannur city and the whole region are basically the same. However, the CWSI in Baotou city and western region (except Bayannur city) shows trapezoidal curves with no obvious bottom value, which increase rapidly in day 1 to 112, stabilize between 0.8648 and 0.9801 in day 113–280 and decrease rapidly in day 281–365 (366 days a year). This may be due to the lower precipitation, higher temperature, weaker actual evapotranspiration and stronger potential evapotranspiration in these areas during the rainy season, in turn, the value of CWSI does not fluctuate significantly at 113–280 days.

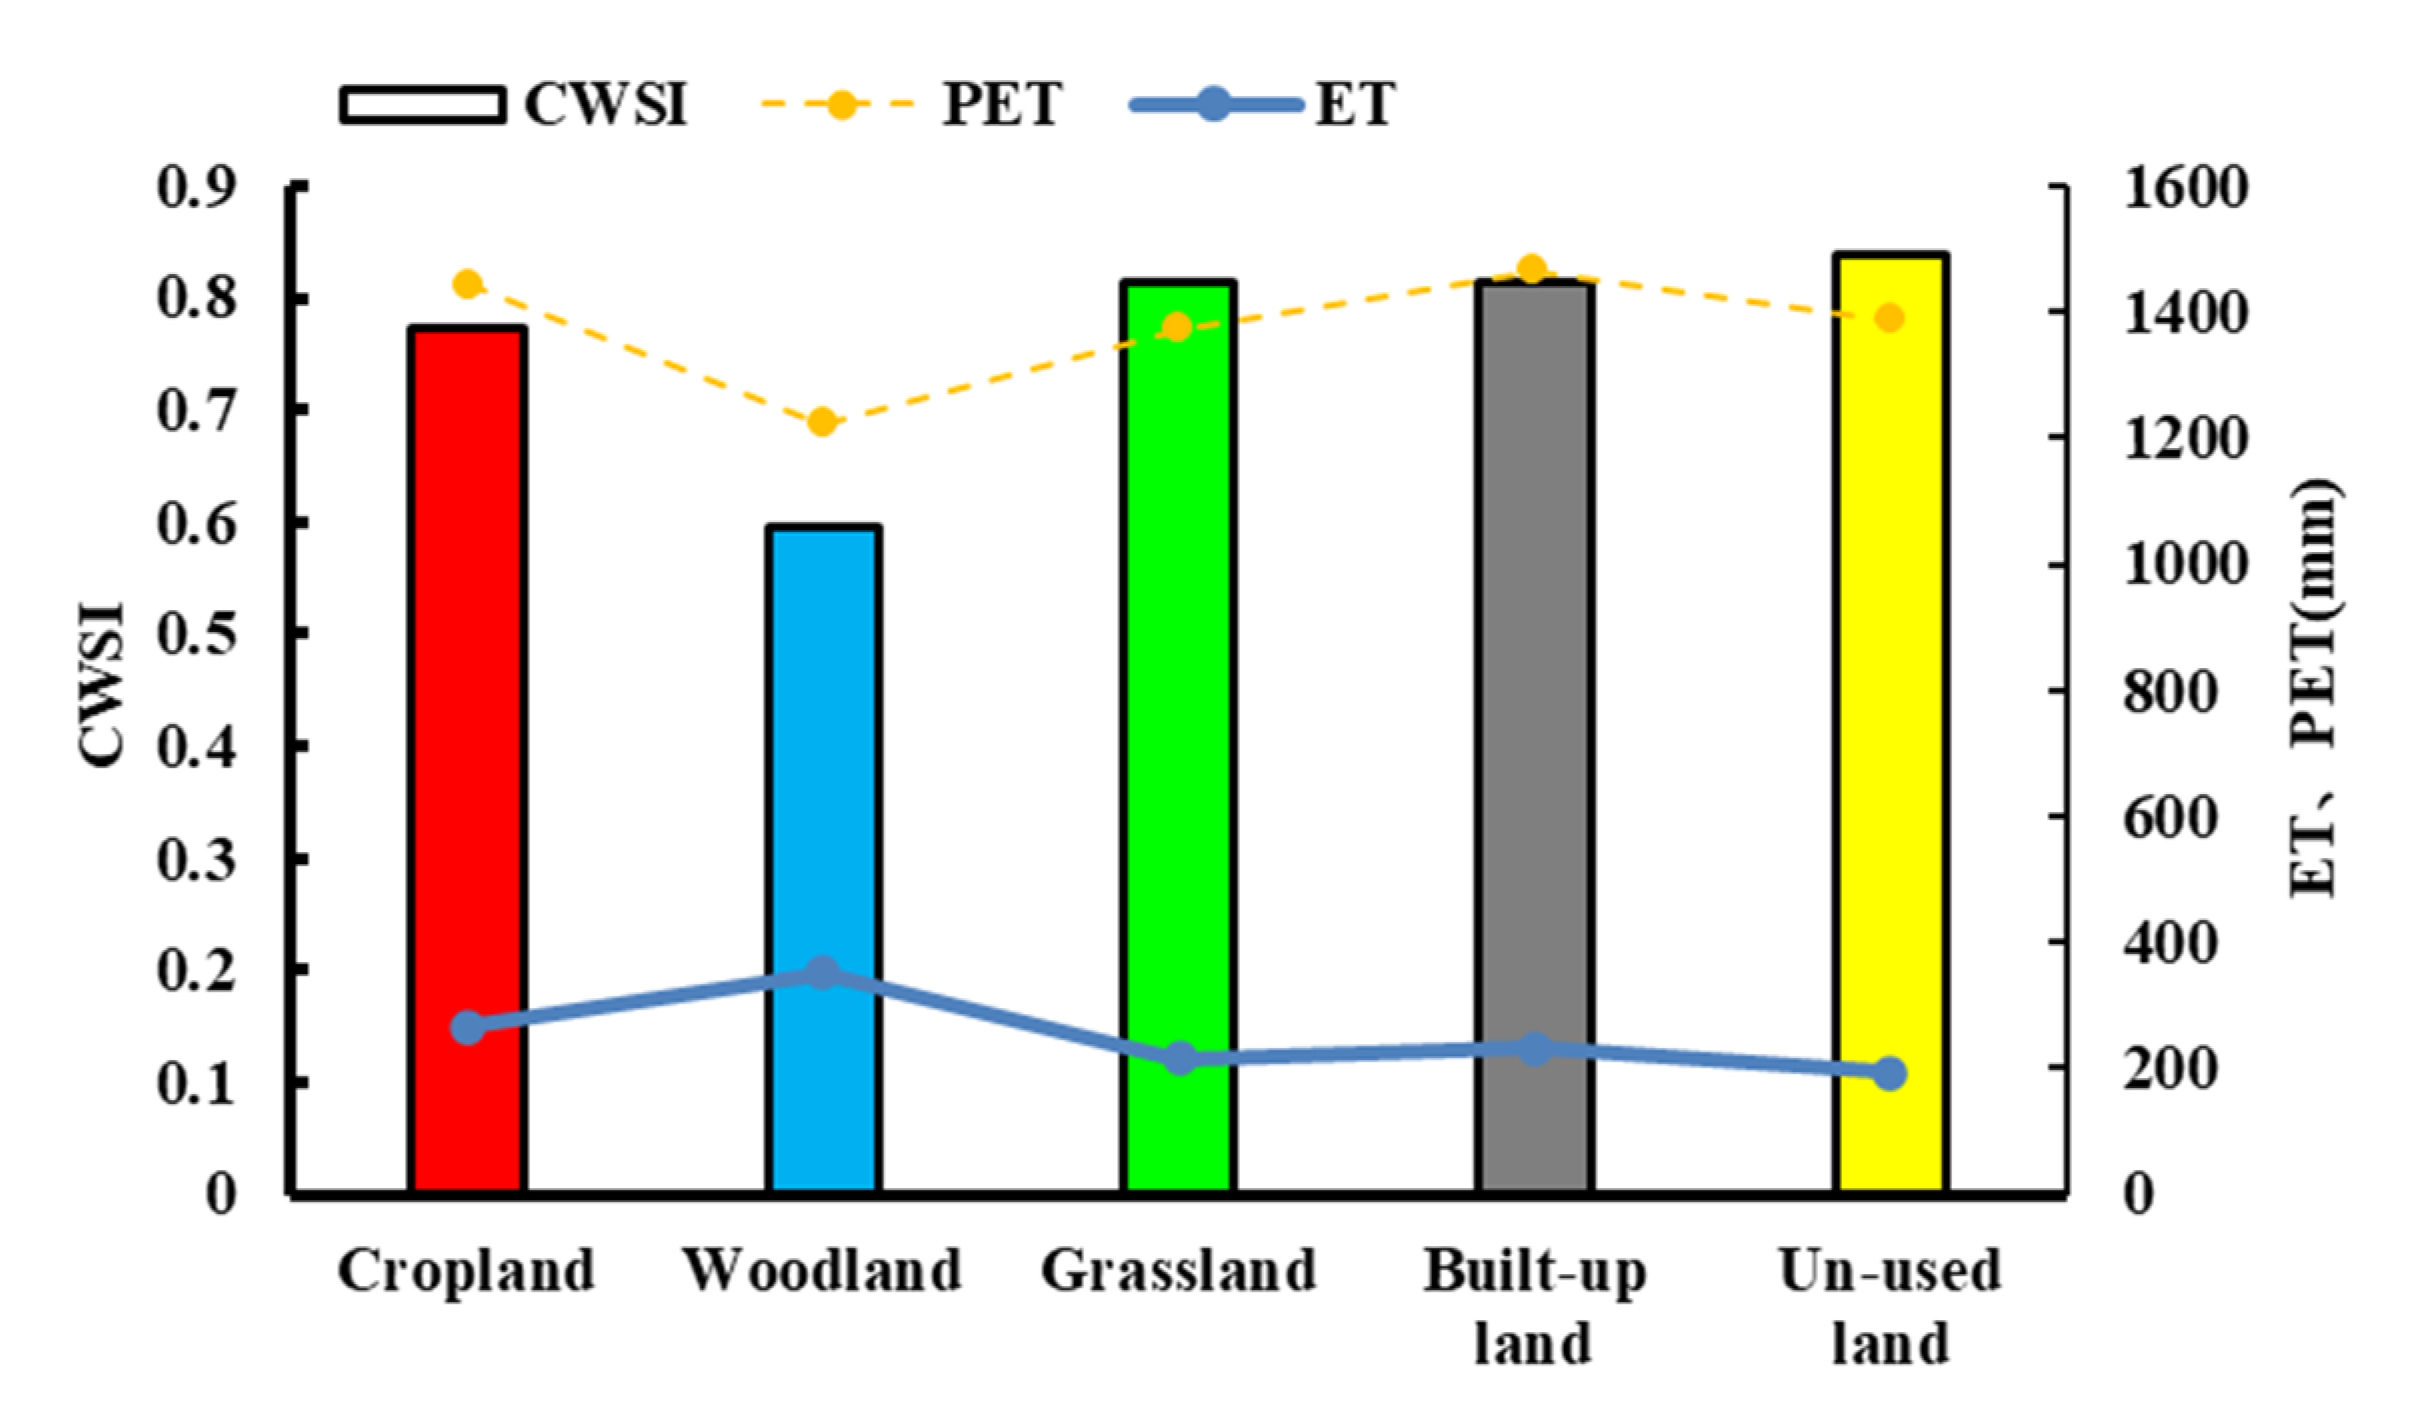
3.4. Characteristics of CWSI Changes in Different Land Use Types

The overall difference in CWSI of different land use types is small (Figure 9). The annual average of CWSI is from small to large: woodland (0.5954) < cropland (0.7733) < built-up land (0.8126) < grassland (0.8147) < unused land (0.8392); the annual mean values of ET for different land use types were: woodland (352.03 mm) > cropland (266.84 mm) > built-up land (231.22 mm) > grassland (214.55 mm) and > unused land (192.07 mm).The annual average of PET is in the order of woodland (870.01 mm) < grassland (1157.61 mm) < cropland (1176.88 mm) < unused land (1194.58 mm) < built-up land (1233.70 mm).
Surface drought is mainly related to land use type, geographical location and climate. For Inner Mongolia, most of the woodland are located in the Da Hinggan Mountains, with abundant rainfall, lower temperature and better water conservation ability. The ET value is higher and PET value is lower here, thus the CWSI value is lower, which shows that this area has the strongest drought resistance capability and the lowest risk of drought. Cropland plants artificial vegetation and has irrigation water supply, plus the ET value is higher, so the CWSI value is low. The vegetation cover of built-up land is less and because of the heat island effect and canyon effect, the temperature here is higher than that of surrounding area and strong wind is easier to happen in partial urban town and the largest PET value indicates that the risk of drought in built-up land is high; because the grassland are small, short and dense, evapotranspiration makes it consume more water, while unused land is mostly desert and sandy land, vegetation coverage is low, precipitation is rare and evapotranspiration results in faster water loss, thus the risk of drought is higher in grassland and unused land.

3.5. Correlation between CWSI and Climate Factors

The spatial distribution of meteorological elements in Inner Mongolia is as follows: The precipitation gradually decreases from northeast to southwest and the high value region appears in the Da Hinggan Mountains. The precipitation gradually decreased from northeast to southwest and the high value region appeared in the Da Hinggan Mountains (Figure 10). Correlation coefficient analysis is used to analyze the spatial distribution of the correlation between the annual average CWSI value and the annual average precipitation and the annual mean temperature on the pixel scale from 2001 to 2017, as shown in Figure 11 Through statistical analysis, the average correlation coefficient r of CWSI with precipitation and temperature is −0.53 and 0.18, respectively. Comparatively, the correlation between CWSI and precipitation is stronger.
The Correlation between CWSI and precipitation, temperature from 2001 to 2017 are calculated by Formula (3). The results are shown in Figure 11. Statistical results shows that there is a negative correlation between CWSI and precipitation as a whole, which indicating that CWSI decreases with the increase of precipitation; the statistical results show that the area with negative correlation is 96.58% and the area of 65.95% is significantly negative correlation at the significant level of 0.05, which is concentrated in the steppe area; And only 0.02% of the area is positively correlated, that is mainly because CWSI is affected by vegetation coverage, temperature, sunshine hours, solar radiation, slope, elevation, wind speed and other factors. There is a positive correlation between CWSI and temperature, which indicating that CWSI increases with the increase of temperature. Among them, the area with positive correlation accounted for 82.04% of the total area, while at the significant level of 0.05 it only accounted for 5.65% of the total area. It is concentrated in Chen Barhu Banner, Chifeng City, Ulanchab City, Hohhot City and Baotou City. It shows that these regions are greatly affected by temperature. According to the analysis above, CWSI is closely related to rainfall and temperature, the increase of precipitation makes the relative soil moisture increase and the water supply is sufficient. In addition, the lower temperature reduces evapotranspiration and decreases the rate of water loss, which is beneficial to the growth of vegetation. Therefore, in the regions with more precipitation and lower temperature, the vegetation cover degree is higher, the CWSI value is smaller and the drought degree is less.

4. Discussion

The existing research on the temporal and spatial variation of drought in Inner Mongolia is mainly focused on the long-term meteorological observation data, such as the analysis of the characteristics and causes of temporal and spatial changes of SPEI and SPI.
Based on the Penmen-Monteith formula and meteorological data, Zhang Xuting and others analyzed the temporal and spatial variation characteristics of drought in Inner Mongolia from 1960 to 2015 by calculating SPEI in different time scales combined with various statistical methods, and the relationship between drought characteristics and Pacific Interdecadal Oscillation Index is discussed [34]. An Qiang and others analyzed the temporal and spatial variation characteristics of drought in Inner Mongolia from 1958 to 2019 by calculating SPEI in different time scales and combined with the influence of continuous drought, the comprehensive evaluation index of drought intensity was put forward [35]. Liu Jiyao and others used monthly observational meteorology data, combined with linear trend analysis and SPI analysis to study the spatial and temporal variations of drought in Inner Mongolia from 1961 to 2013 [36]. These studies illustrate in detail the variation of drought in Inner Mongolia on a certain scale and have important practical significance in drought monitoring and decision making but they may be confined to the “point” scale or the lack of large-scale and long-term continuous observation data, therefore they lack a general understanding of the drought situation in the whole research area. In this paper, based on the analysis of the temporal and spatial variation characteristics of ET, PET, CWSI, we use high-resolution remote sensing products and meteorological observation data of continuous time period to further discuss the variation trend of CWSI over the years, which reflects the spatial and temporal distribution of drought in the region. The results can reflect more information of surface drought characteristics. Moreover, it can provide a new method for large scale inhomogeneous drought monitor.
Compared to meteorological data, MOD16 data has a shorter time scale, which is only after 2000. What’s more, due to the influence of cloud, shadow and vegetation cover on MOD16 data, some pixels have no value phenomenon, especially in winter, which is difficulty to study the drought in winter.
The relationship between ET, PET and CWSI in different land use types is discussed in this paper: forest land ET is the largest, PET is the smallest and CWSI is the smallest, which shows that the ability of forest land to resist drought is the strongest and it is of great significance to regional water conservation. The author has reclassified the land use data of 1 km resolution provided by the Chinese Academy of Sciences and the 30 m resolution land use data provided by Tsinghua University according to the unified standard and the CWSI extracted from different land use types were compared separately (Figure 12). It can be seen from the figure that the results obtained from the two data sources are basically the same and the average absolute error is only −0.0034, which indicates that the reliability of CWSI extracted from 1 km land use data provided by the Chinese Academy of Sciences is higher; this paper may underestimate the drought resistance of woodland and construction land, the possibility of drought risk on bare land and overestimate the drought resistance of cropland and grassland.
This paper discusses the correlation between CWSI and precipitation and temperature and CWSI in Inner Mongolia has a significant correlation with precipitation, indicating that precipitation has a greater impact on CWSI, which is consistent with Park and others view that precipitation is the main cause of drought [37]. However, the process of CWSI change is very complex, which is influenced by many meteorological factors, such as altitude, slope, slope direction and vegetation coverage and the influence mechanism of these factors on different regions is different [38]. Therefore, according to the actual situation of the surface of the study area, in order to strengthen the ability of drought prevention and drought resistance and improve the regional climate environment, the focus of further research is the contribution of different factors to CWSI.

5. Conclusions

In this paper, MOD16 data are used to calculate crop water shortage index (CWSI) and the spatial and temporal variation characteristics of meteorological factors are analyzed, possible reasons of droughts were discussed and explored. The correlation between CWSI and the measured relative soil moisture data (p < 0. 05, r = −0.86) was negative. It is shown that the CWSI calculated by MOD16 products can be used for drought monitoring in Inner Mongolia. The conclusions are as follows:
(1)
Droughts in 2001–2017 showed a significant decreasing trend (p < 0.05) at the interannual scale in terms of CWSI monitoring and the study area showed mild drought. The eight days variation characteristics of CWSI indicates that severe droughts occurred mainly during 113 to 144 days, this time are also the key period of natural forage regreening period. Therefore, frequent droughts will affect grassland productivity. It is suggested that the local government should pay more attention to drought resistance during the regreening period.
(2)
The annual change of droughts indicates that droughts occurred mainly in Ulanchab City, Ordos City, Baotou City, Bayan Nur, Alxa League and Wuhai City. While the drought intensity of Hulunbeier, Hinggan League, Chifeng City and Tongliao City were relatively weak. Spatially, more crops can be observed mainly in northern Ordos, southern Baotou and southern Ulanchab. These areas are also the key regions of severe drought and moderate drought. Frequent droughts will definitely affect crop yields. It is suggested that the local government should strengthen the use of irrigation water in crop growth period to prevent the economic losses caused by drought.
(3)
The annual average of droughts in different land use/cover types indicates that woodland (0.5954) < cropland (0.7733) < built-up land (0.8126) < grassland (0.8147) < unused land (0.8392). Hence, the ability of woodland to resist drought is the strongest and the possibility of drought in unused land is the highest. Therefore, the possibility of drought in Inner Mongolia can be reduced through afforestation, closing hillsides for afforestation.
(4)
The average correlation coefficients between CWSI and precipitation, temperature are −0.53 and 0.18. This indicates that CWSI is more sensitive to precipitation. Spatially, droughts of grassland and cropland will definitely be more sensitive to precipitation, while droughts of woodland is little or no affected by precipitation. Droughts of Chen Barhu Banner, Chifeng City, Ulanchab City, Hohhot City and Baotou City will definitely be more sensitive to temperature, while droughts of other areas is little or no affected by temperature. Therefore, precipitation has a certain indicative effect on drought monitoring of grassland and crops in the study area, while temperature also has a certain indicative effect on drought monitoring of Chen Barhu banner, Chifeng City, Ulanchab City, Hohhot City and Baotou city.
The results of this study may provide some practical reference for the aim to prevent drought and maintain grassland productivity in a warming climate.

Author Contributions

Conceptualization, Z.-C.M., P.S. and Q.Z.; methodology, Z.-C.M., P.S. and Q.Z. and W.J. and Y.-Q.H.; validation, Z.-C.M., P.S. and Q.Z.; formal analysis, Z.-C.M., P.S. and Q.Z. and W.J.; writing—original draft preparation, Z.-C.M., P.S. and Q.Z. and W.J. and Y.-Q.H.; writing—review and editing, Z.-C.M., P.S. and Q.Z. and W.J.; visualization, Z.-C.M., P.S. and Q.Z. and W.J.; supervision, Z.-C.M., P.S. and Q.Z.; funding acquisition, P.S. and Q.Z. All authors have read and agreed to the published version of the manuscript.

Funding

This research was funded by China National Key R&D Program, grant number: 2019YFA0606900”; National Natural Science Foundation of China, grant number: 41601023; The University Synergy Innovation Program of Anhui Province: GXXT 2019047; Natural Science Foundation of Anhui province, grant number: 1808085QD117; Nature Science Foundation of Anhui province of China, grant number: 1908085QD165; The Open Fund of State Laboratory of Information Engineering in Surveying, Mapping and Remote Sensing, Wuhan University, grant number:20I04; The key research and development project of Wuhu city, grant number:2020ms1-3; Action project of academician helping Chuzhou, grant number: 2019 1/S002.

Institutional Review Board Statement

Not applicable for studies not involving humans or animals.

Informed Consent Statement

Not applicable for studies not involving humans.

Data Availability Statement

The data used to support the findings of this study are available from the corresponding author upon request.

Conflicts of Interest

The authors declare no conflict of interest.

References

  1. Tfwalaa, C.M.; van Rensburg, L.D.; Schall, R. Drought dynamics and interannual rainfall variability on the Ghaap plateau, South Africa, 1918–2014. Phys. Chem. Earth 2018. [Google Scholar] [CrossRef]
  2. Gao, X.; Zhao, Q.; Zhao, X. Temporal and spatial evolution of the standardized precipitation evapotranspiration index (SPEI) in the Loess Plateau under climate change from 2001 to 2050. Sci. Total Environ. 2017, 595, 191–200. [Google Scholar] [CrossRef] [PubMed]
  3. Wilhite, D.A.; Glantzl, M.H. Understanding the drought phenomenon: The role of definitions. Water Int. 1985, 10, 111–120. [Google Scholar] [CrossRef] [Green Version]
  4. Zambreski, Z.T.; Lin, X.; Aiken, R.M.; Kluitenberg, G.J.; Pielke, R.A. Identification of hydroclimate subregions for seasonal drought monitoring in the U.S. Great Plains. J. Hydrol. 2018, 567, 370–381. [Google Scholar] [CrossRef]
  5. Anyamba, A.; Tucker, C.J. Analysis of Sahelian vegetation dynamics using NOAA-AVHRR NDVI data from 1981–2003. J. Arid Environ. 2005, 63. [Google Scholar] [CrossRef]
  6. Xiang, Q.; Yin, R.; Xu, J.; Deng, X. Modeling the Driving Forces of the Land Use and Land Cover Changes Along the Upper Yangtze River. Environ. Manag. 2010, 45, 454–465. [Google Scholar] [CrossRef]
  7. Ranagalage, M.; Estoque, R.C.; Zhang, X.; Murayama, Y. Spatial Changes of Urban Heat Island Formation in the Colombo District, Sri Lanka: Implications for Sustainability Planning. Sustainability 2018, 10, 1367. [Google Scholar] [CrossRef] [Green Version]
  8. Bai, J.; Yuan, Y.; Di, L. Comparison between TVDI and CWSI for drought monitoring in the Guanzhong Plain, China. Sci. Direct 2017, 16, 389–397. [Google Scholar] [CrossRef] [Green Version]
  9. Zormand, S.; Jafari, R.; Koupaei, S.S. Assessment of PDI, MPDI and TVDI drought indices derived from MODIS Aqua/Terra Level 1B data in natural lands. Nat. Hazards 2017, 86, 757–777. [Google Scholar] [CrossRef]
  10. Yu, Y.; Wang, J.; Li, X. Monitoring the Occurrence of Drought in Central Yunnan Province Based on MODIS Data. J. Irrig. Drain. 2018, 37, 91–98. (In Chinese) [Google Scholar]
  11. Tian, G.; Wu, Y.; Liang, Y. Drought monitoring and timeliness based on evapotranspiration model. Arid Land Geogr. 2016, 39, 721–729. (In Chinese) [Google Scholar]
  12. Ru, C.; Hu, X.; Wang, W.; Ran, H.; Song, T.; Guo, Y. Evaluation of the Crop Water Stress Index as an Indicator for the Diagnosis of Grapevine Water Deficiency in Greenhouses. Horticulturae 2020, 6, 86. [Google Scholar] [CrossRef]
  13. Wang, X.; Guo, N. Some Research Advances and Methods on Drought Monitoring by Remote Sensing. Arid Meteorol. 2003, 18, 76–81. (In Chinese) [Google Scholar]
  14. Mu, Q.Z.; Heinsch, F.A.; Zhao, M.S. Development of a global evapotranspiration algorithm based on MODIS and global meteorology data. Remote Sens. Environ. 2007, 111, 519–536. [Google Scholar] [CrossRef]
  15. Mu, Q.Z.; Zhao, M.S.; Running, S.W. Improvements to a MODIS global terrestrial evapotranspiration algorithm. Remote Sens. Environ. 2011, 115, 1781–1800. [Google Scholar] [CrossRef]
  16. Wu, G.; Liu, Y.; Zhao, X.; Ye, C. Spatio-temporal variations of evapotranspiration in Poyang Lake Basin using MOD16 products. Geogr. Res. 2013, 32, 617–627. (In Chinese) [Google Scholar]
  17. Liaqat, U.W.; Choi, M. Accuracy comparison of remotely sensed evapotranspiration products and their associated water stress footprints under different land cover types in Korean peninsula. J. Clean. Prod. 2016, 155, 93–104. [Google Scholar] [CrossRef]
  18. Zhang, T.; Peng, J.; Liang, W.; Yang, Y.; Liu, Y. Spatial–temporal patterns of water use efficiency and climate controls in China’s Loess Plateau during 2000–2010. Sci. Total Environ. 2016, 565, 105–122. [Google Scholar] [CrossRef]
  19. Zolotokrylin, A.N.; Titkova, T.B.; Brito-Castillo, L. Wet and dry patterns associated with ENSO events in the Sonoran Desert from, 2000–2015. J. Arid Environ. 2016, 134, 21–32. [Google Scholar] [CrossRef]
  20. Li, H.; Ma, L.; Liu, T. Change and relationship of temperature and precipitation in Inner Mongolia during 1951–2014. J. Glaciol. Geocryol. 2017, 39, 1098–1112. (In Chinese) [Google Scholar]
  21. Pei, Z.; Fang, S.; Wang, L.; Yang, W. Comparative Analysis of Drought Indicated by the SPI and SPEI at Various Timescales in Inner Mongolia, China. Water 2020, 12, 1925. [Google Scholar] [CrossRef]
  22. Elaine, W.; Suren, K. Environmental Sustainability of Agriculture Stressed by Changing Extremes of Drought and Excess Moisture: A Conceptual Review. Sustainability 2017, 9, 970. [Google Scholar] [CrossRef] [Green Version]
  23. Zheng, Y.; Liu, H.; Liu, D.; Zhuo, Y.; Qing, H.; Wen, L.; Wang, L. Spatial Distribution Pattern and Dynamic Change of Wetlands in Inner Mongolia. Environ. Sci. Technol. 2016, 39, 1–6. (In Chinese) [Google Scholar]
  24. Miao, B.L.; Liang, C.Z.; Han, F.; Liang, M.; Zhang, Z. Responses of phenology to climate change over the major grassland types. Acta Ecol. Sin. 2016, 36, 7689–7701. (In Chinese) [Google Scholar]
  25. Liu, W.; Sun, F.; Sun, S.; Guo, L.; Wang, H.; Cui, H. Multi-scale assessment of eco-hydrological resilience to drought in China over the last three decades. Sci. Total Environ. 2019, 672, 201–211. [Google Scholar] [CrossRef] [PubMed]
  26. Wang, Z.; Wang, F.; Zhang, Y. Spatio-temporal Distribution Characteristics and Influencing Factors of Drought in Anhui Province Based on CWSI. J. Nat. Resour. 2018, 33, 853–866. (In Chinese) [Google Scholar]
  27. Jackson, R.D.; Idso, S.B.; Reginato, R.J.; Pinter, P.J., Jr. Canopy temperature as a crop water stress indicator. Water Resour. Res. 1981, 17, 1133–1138. [Google Scholar] [CrossRef]
  28. Jackson, R.; Kustas, W.; Choudhury, B. A reexamination of the crop water stress index. Irrig. Sci. 1988, 9, 309–317. [Google Scholar] [CrossRef]
  29. Zhang, Q.; Zou, X.K.; Xiao, F.J. The Grade of Meteorological Drought; GB/T 20481-2006; China Standard Press: Beijing, China, 2006. (In Chinese) [Google Scholar]
  30. Wufu, A.; Rusuli, Y.; Kadeer, R.; Jiang, H. Spatio-temporal distribution and evolution trend of evapotranspiration in Xinjiang based on MOD16 data. Geogr. Res. 2017, 36, 1245–1256. (In Chinese) [Google Scholar]
  31. Zhang, W.; Bao, G.; Bao, Y. Vegetation SOS dynamic monitoring in Inner Mongolia from 1982 to 2013 and Its responses to climatic changes. China Agric. Inf. 2018, 30, 63–75. (In Chinese) [Google Scholar]
  32. Bao, G.; Bao, Y.; Tuya, A. Spatio-temporal Dynamics of Vegetation Phenology in the Mongolian Plateau during 1982~2011. Remote Sens. Technol. Appl. 2017, 32, 866–874. (In Chinese) [Google Scholar]
  33. Li, J.; Yang, X.; Xu, B.; Cao, Y.; Qin, Z.; Jin, Y.; Zhao, L. Snow Monitoring Using MODIS and AMSR-E in Six Main Pastoral Areas of China. Sci. Geogr. Sin. 2011, 31, 1097–1104. (In Chinese) [Google Scholar]
  34. Zhang, X.; Pan, X.; Xu, L.; Wei, P.; Yin, Z.; Shao, C. Analysis of spatio-temporal distribution of drought characteristics based on SPEI in Inner Mongolia during 1960–2015. Trans. Chin. Soc. Agric. Eng. 2017, 33, 190–199. (In Chinese) [Google Scholar]
  35. An, Q.; He, H.; Nie, Q.; Cui, Y.; Gao, J.; Wei, C.; You, J. Spatial and Temporal Variations of Drought in Inner Mongolia, China. Water 2020, 12, 1715. [Google Scholar] [CrossRef]
  36. Liu, J.; Chun, X.; Liang, W. Dryness Temporal-Spatial Distribution Based on Standardized Precipitation Index in Inner Mongolia. J. Inn. Mong. Norm. Univ. (Nat. Sci. Ed.) 2016, 45, 533–539. (In Chinese) [Google Scholar]
  37. Park, J.; Lim, Y.J.; Kim, B.J.; Sung, J.H. Appraisal of drought characteristics of representative drought indices using meteorological variables. KSCE J. Civ. Eng. 2017. [Google Scholar] [CrossRef]
  38. Peña-Gallardo, M.; Vicente-Serrano, S.M.; Hannaford, J.; Lorenzo-Lacruz, J.; Svoboda, M.; Domínguez-Castro, F.; El Kenawy, A. Complex influences of meteorological drought time-scales on hydrological droughts in natural basins of the contiguous Unites States. J. Hydrol. 2019, 568, 611–625. [Google Scholar] [CrossRef] [Green Version]
Figure 1. The spatial distribution of land use/cover in 2015 and meteorological stations across the study area.
Sustainability 13 00916 g001
Figure 2. The correlation between crop water stress index and relative soil moisture from April to September in 2003–2009 and 2011.
Sustainability 13 00916 g002
Figure 3. Annual variations of evapotranspiration (ET), potential evapotranspiration (PET) and crop water stress index (CWSI) in Inner Mongolia during 2001–2017.
Sustainability 13 00916 g003
Figure 4. Annual variations of CWSI of cities in Inner Mongolia during 2001–2017.
Sustainability 13 00916 g004
Figure 5. The spatial distribution of ET and PET in annual scale from 2001 to 2017.
Sustainability 13 00916 g005
Figure 6. The change trend of annual ET, PET and CWSI in Inner Mongolia during 2001~2017.
Sustainability 13 00916 g006
Figure 7. Changes of 8d of ET, PET and CWSI in Inner Mongolia from 2001 to 2017.
Sustainability 13 00916 g007
Figure 8. Changes of 8d average CWSI of cities in Inner Mongolia from 2001 to 2017.
Sustainability 13 00916 g008
Figure 9. Annual variations of ET, PET and CWSI of different land use types.
Sustainability 13 00916 g009
Figure 10. Spatial distributions of annual average precipitation and temperature in Inner Mongolia during 2001~2017.
Sustainability 13 00916 g010
Figure 11. Correlation coefficients of CWSI and precipitation, temperature in Inner Mongolia during 2001~2017.
Sustainability 13 00916 g011
Figure 12. Comparison of CWSI of 1 km resolution and 30 m resolution land cover data in 2015.
Sustainability 13 00916 g012
Table 1. Detailed information of data source and usage.
DataData Content and CharacteristicsData UsageData Source
land use/coverContent: Types of land use
Spatial resolution: 1 km
Time resolution: Year
Time: 2000, 2005, 2010 and 2015
Obtaining surface coverage information(http://www.resdc.cn)
meteorological dataContent: Precipitation and temperature
Time resolution: month
Time: From 1957 to 2017
Number of stations: 44
Getting grid data of precipitation and temperature(http://data.cma.cn/data/)
Remote sensing dataContent: evapotranspiration and potential evapotranspiration
Spatial resolution: 500 m
Time resolution: 8 days
Time: From 2001 to 2017
Evapotranspiration and potential evapotranspiration were obtained and used to calculate crop water stress index (CWSI)(https://ladsweb.modaps.eosdis.nasa.gov)
Relative soil moistureContent: 20 cm relative soil moisture
Time resolution: 10 days
Time: From April to September in 2003–2009 and 2011
Number of stations: 17
Used to verify the applicability of CWSI(http://data.cma.cn/data/)
Table 2. Information of meteorological stations.
NumberName of StationsLongitudeLatitudeAverage of Precipitation (mm)Average of Temperature (°C)
1Ergun City120.1150.15343−2
2Turi121.4150.29431−4
3Hailar119.4249.153300
4Xiaoergou123.4349.124931
5New Barag Right Banner116.4948.41972
6New Barag Left Banner118.1648.132711
7Bugt121.9248.774720
8Zhalantun122.44484954
9Arshan119.5647.1441−2
10Sauron121.1346.364623
11Dong Ujimqin116.5845.312313
12Ejin Banner101.0741.953310
13Gaizihu102.3741.374710
14Bayan Nuoer104.840.171298
15Ayouqi101.6839.2212310
16Erenhot111.5643.381245
17Na Renbaolige114.0944.371952
18Mandula110.0842.321746
19Abag Banner114.5744.012303
20Sonid left banner113.6343.871794
21Zhu Rihe112.942.42006
22Wulate Middle Banner 108.3141.342216
23Damao Banner110.2641.422595
24Siziwang Banner111.4141.322984
25Huade11441.543214
26Baotou City109.5340.322988
27Hohhot111.3440.514048
28Tsining113.0441.023545
29Girantai105.7539.7810110
30Linhe107.2240.441379
31Otog Banner107.5839.052738
32Dongsheng County109.5939.53877
33Azuo banner105.6738.832209
34Xi Ujimqin117.3644.352932
35Jarud Banner120.5444.343468
36Baarin Left Banner119.2443.593417
37Xilin Hot116.0743.572613
38Linxi County118.0243.383325
39Kailu County121.1743.363097
40Tongliao122.1643.363478
41Duolun County116.2842.113603
42Ongniud Banner119.0142.563077
43Chifeng118.542.183598
44Baoguotu120.4242.23728
Table 3. Information of agrometeorological stations.
NumberName of StationsLongitudeLatitudeRelative Soil MoistureCWSI
1Ergun City120.1150.150.520.76
2Zhalantun122.44480.580.76
3Bayar tuhushuo120.3345.070.530.80
4Tuquan121.5545.40.600.78
5Bordered Yellow Banner113.8342.230.430.90
6Wuchuan County111.4541.10.450.87
7Chayou Middle Banner112.6241.270.450.87
8Chayou Behind Banner111.3841.450.390.89
9Xilingole105.3839.080.300.95
10Linhe107.2240.440.560.83
11Xilin Hot116.0743.570.460.87
12Tongliao122.1643.360.510.84
13Ongniud Banner119.0142.560.640.75
14Chifeng118.542.180.670.73
15Neyman120.6542.850.560.81
16Taipusi Banner115.2741.880.570.81
Table 4. Classification standard of drought change trend.
CWS I slope .   |P|
|P| > 0.100.05 < |P| ≤ 0.100.01 < |P| ≤ 0.05|P| < 0.01
Slope ≤ 0StableSlight wetwetSignificantly wet
Slope > 0StableSlight drydrySignificantly dry
Table 5. Classification standard for drought.
DegreeRSMCWSIDegree of Drought
1RSM > 0.600~0.77No drought
20.50 < RSM ≤ 0.600.77~0.84Mild drought
30.40 < RSM ≤ 0.500.84~0.90Moderate drought
40.30 < RSM ≤ 0.400.90~0.96Severe drought
5RSM ≤ 0.300.96~1Extreme drought
Publisher’s Note: MDPI stays neutral with regard to jurisdictional claims in published maps and institutional affiliations.

