
Analysis of the Repair Time of Finishing Works Using a Probabilistic Approach for Efficient Residential Buildings Maintenance Strategies


Abstract
:1. Introduction
2. Background
2.1. Literature Review
2.2. Monte Carlo Simulation
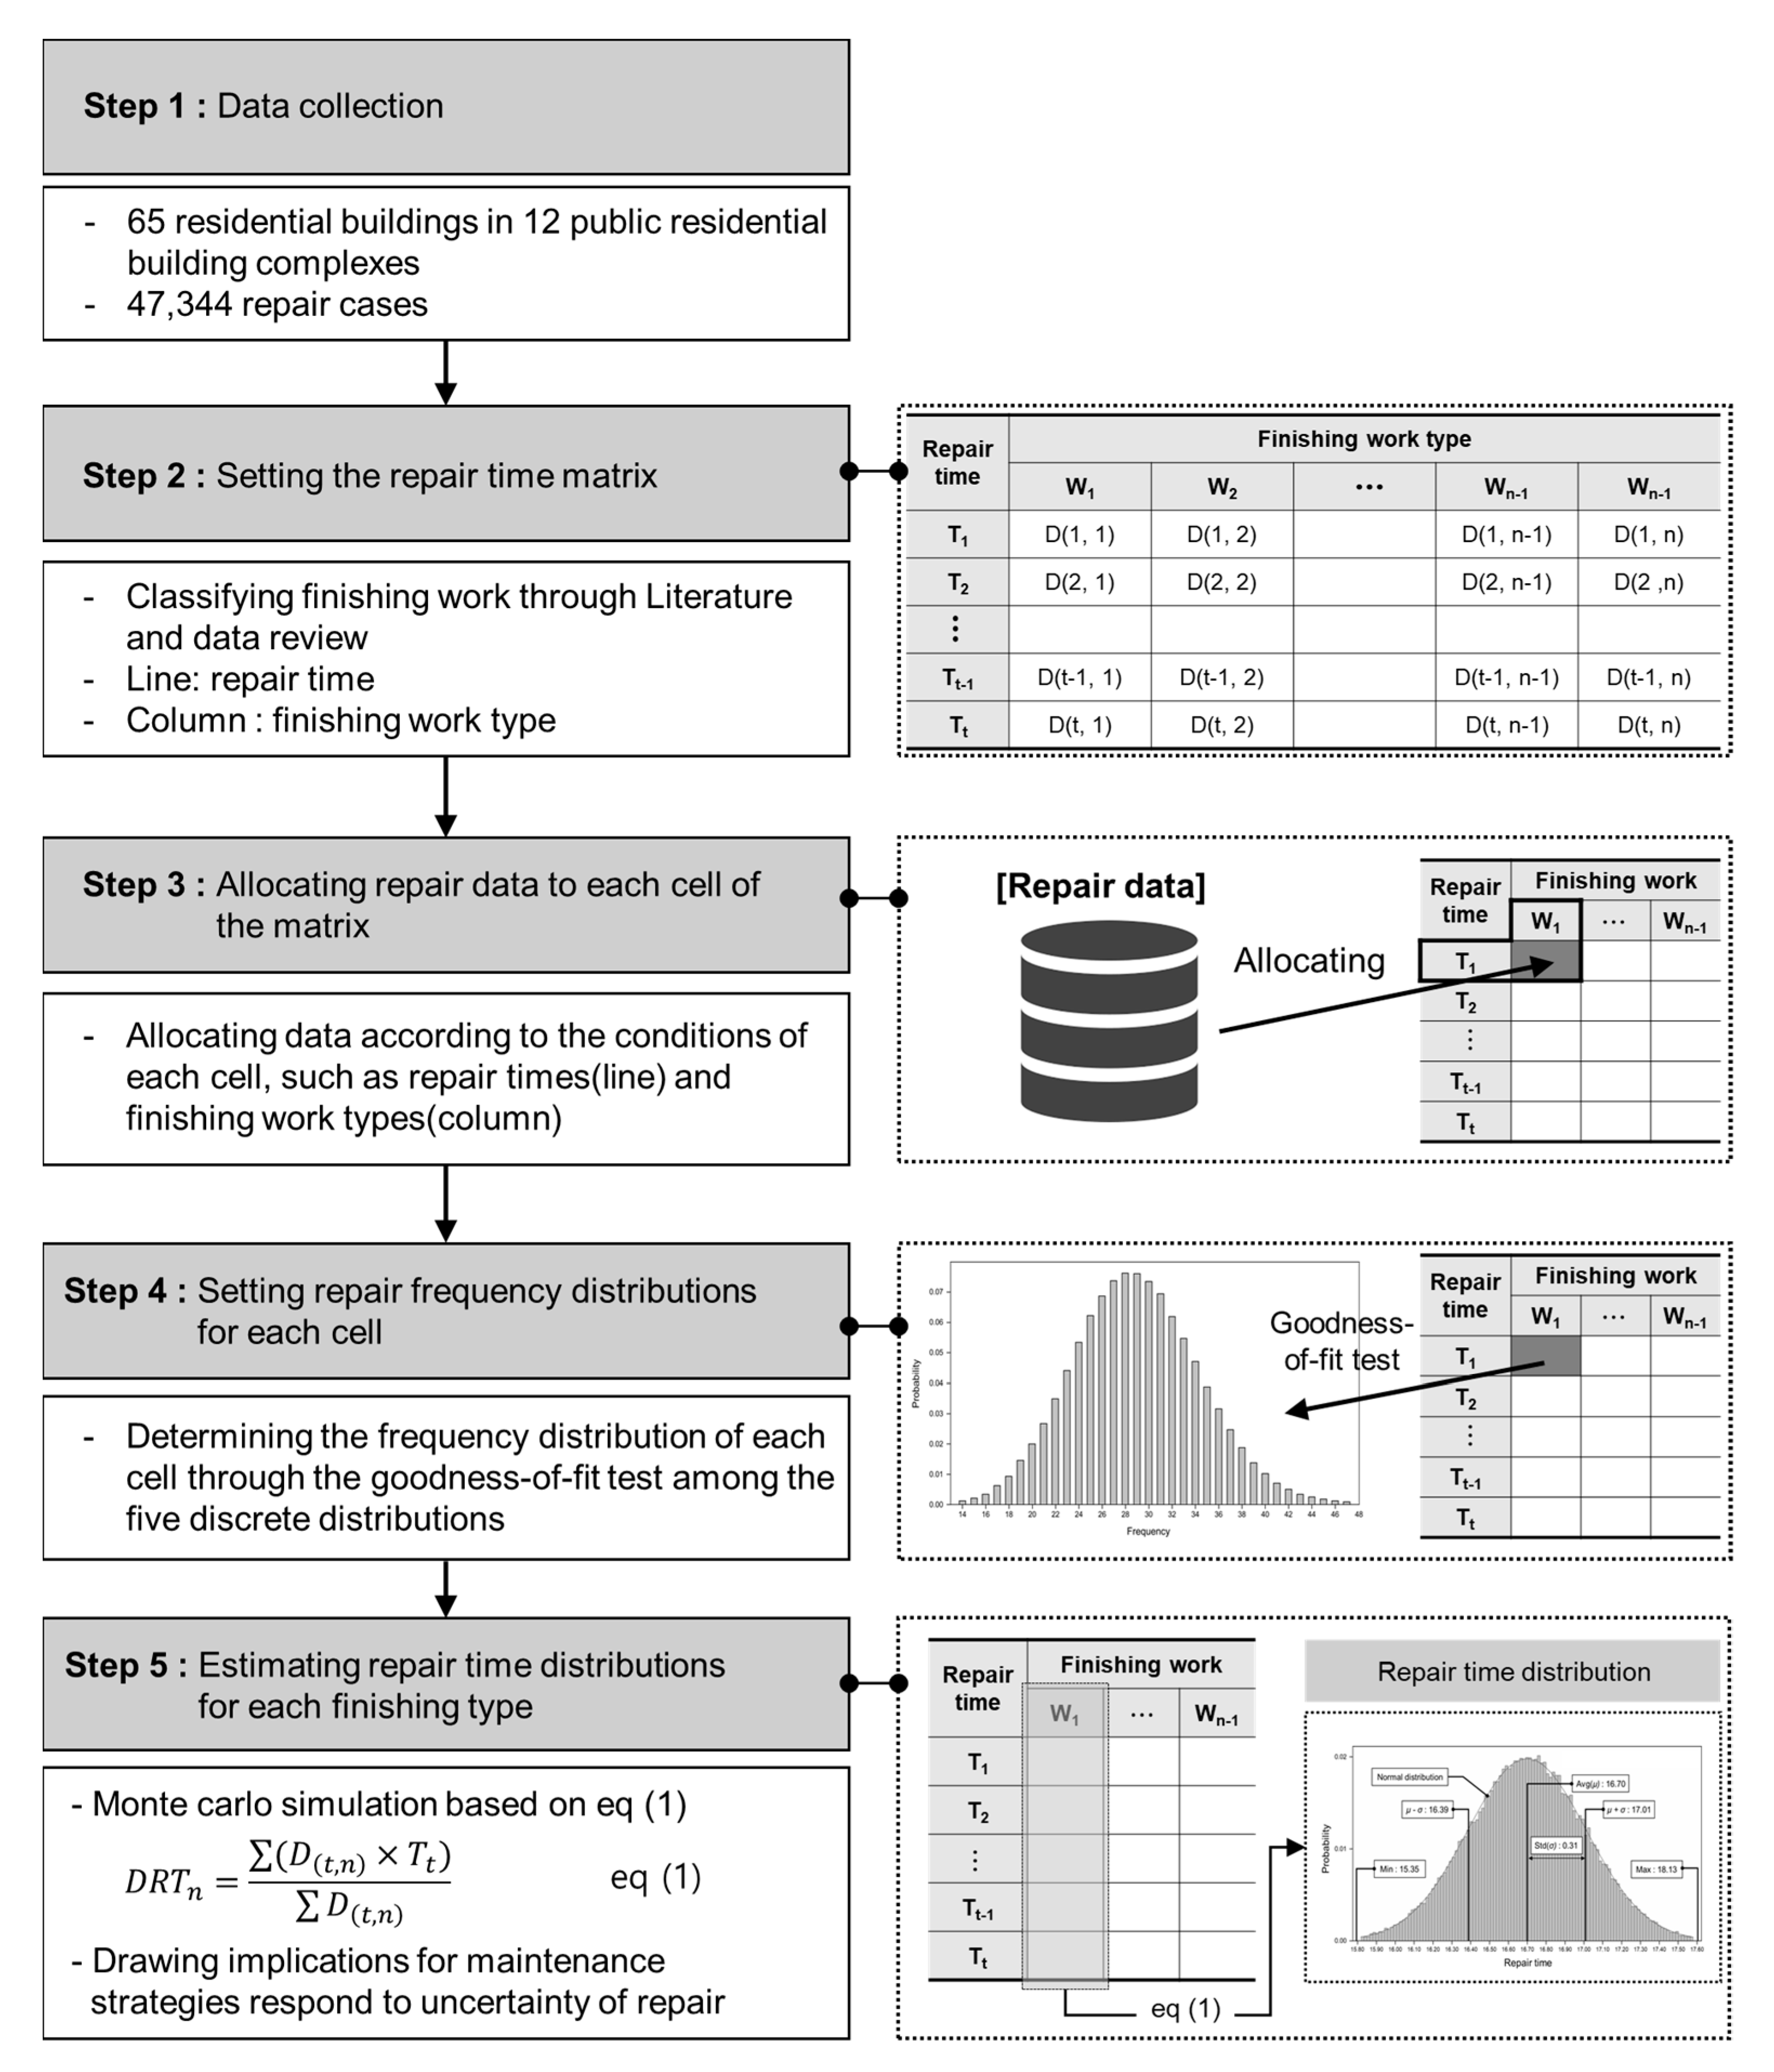
- Step 1, an equation for simulation is developed.
- Step 2, the evaluation data are inputted, and the probability distribution that fits the data set is identified to generate random inputs.
- Step 3, several iterations are performed to evaluate the model. The number of iterations should allow the output’s convergence to be satisfactory for the analysis.
3. Theoretical Framework
4. Results
4.1. Data Collection and Setting the Repair Time Matrix
4.2. Setting Repair Frequency Distributions for Each Cell
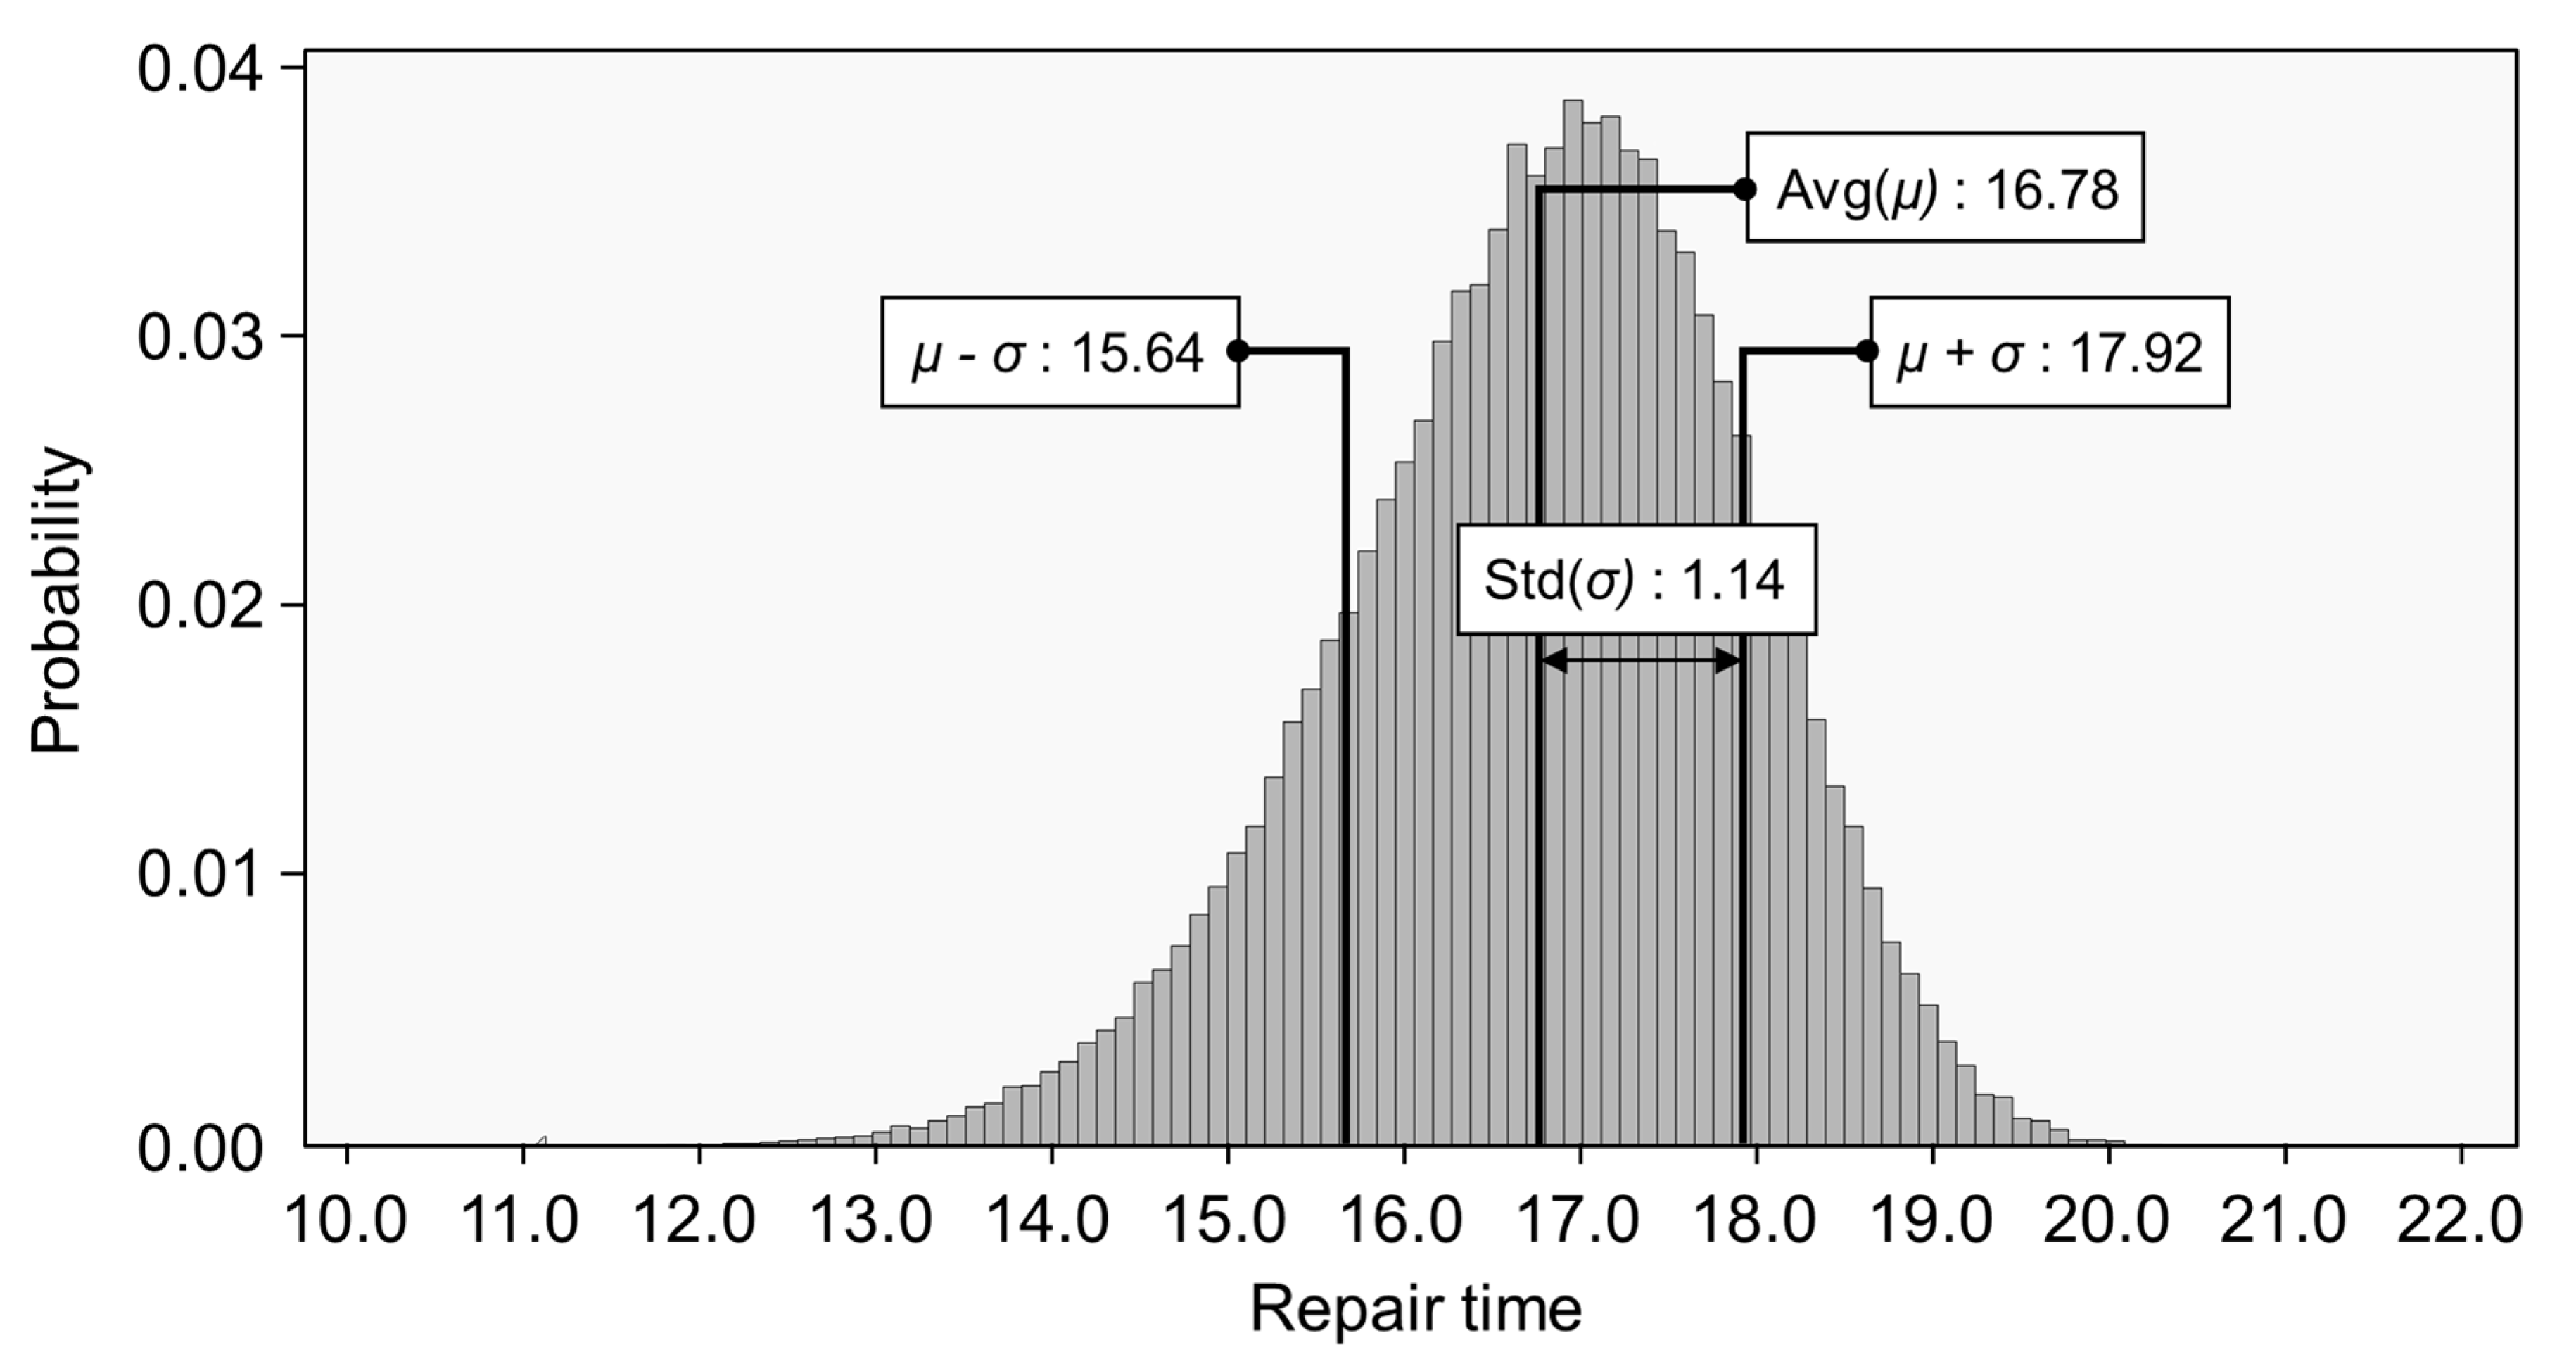
4.3. Estimating Repair Time Distributions for Each Finishing Type
5. Discussion and Conclusions
Author Contributions
Funding
Institutional Review Board Statement
Informed Consent Statement
Data Availability Statement
Acknowledgments
Conflicts of Interest
References
- Desa, U.N. Transforming Our World: The 2030 Agenda for Sustainable Development; UN DESA: New York, NY, USA, 2015. [Google Scholar]
- McKenzie, S. Social Sustainability: Towards Some Definitions; University of South Australia: Adelaide, Australia, 2004. [Google Scholar]
- Vallance, S.; Perkins, H.C.; Dixon, J.E. What is social sustainability? A clarification of concepts. Geoforum 2011, 42, 342–348. [Google Scholar] [CrossRef]
- Lee, R.; Wordsworth, P. Lee’s Building Maintenance Management, 4th ed.; Blackwell Science Ltd.: Oxford, UK, 2001. [Google Scholar]
- Flores-Colen, I.; de Brito, J.; Freitas, V. Discussion of criteria for prioritization of predictive maintenance of building façades: Survey of 30 experts. J. Perform. Constr. Facil. 2010, 24, 337–344. [Google Scholar] [CrossRef]
- Horner, R.M.W.; El-Haram, M.A.; Munns, A.K. Building maintenance strategy: A new management approach. J. Qual. Maint. Eng. 1997, 3, 273–280. [Google Scholar] [CrossRef]
- Van-Winden, C.; Dekker, R. Rationalization of building maintenance by Markov decision models: A pilot case study. J. Oper. Res. Soc. 1998, 49, 928–935. [Google Scholar] [CrossRef]
- Underwood, J.; Alshawi, M. Towards an integrated application for forecasting building element maintenance. Int. J. Comput. Integr. Design Constr. 1999, 1, 39–48. [Google Scholar]
- Shohet, I.M.; Puterman, M.; Gilboa, E. Deterioration patterns of building cladding components for maintenance management. Constr. Manag. Econ. 2002, 20, 305–314. [Google Scholar] [CrossRef]
- Lee, S.; Ahn, Y. Analyzing the long-term service life of MEP using the probabilistic approach in residential buildings. Sustainability 2018, 10, 3803. [Google Scholar] [CrossRef] [Green Version]
- Cotts, D.; Roper, K.; Payant, R. The Facility Management Handbook; AMACOM: New York, NY, USA, 2009. [Google Scholar]
- Syan, C.S.; Ramsoobag, G. Maintenance applications of multi-criteria optimization: A review. Reliab. Eng. Syst. Saf. 2019, 190, 106520. [Google Scholar] [CrossRef]
- Kayan, B.A. Conservation plan and “green maintenance” from sustainable repair perspectives. Smart Sustain. Built Environ. 2015, 4, 25–44. [Google Scholar] [CrossRef] [Green Version]
- Bucon, R.; Czarnigowska, A. A model to support long-term building maintenance planning for multifamily housing. J. Build. Eng. 2021, 44, 103000. [Google Scholar] [CrossRef]
- Flores-Colen, I.; de Brito, J. A systematic approach for maintenance budgeting of buildings façades based on predictive and preventive strategies. Constr. Build. Mater. 2010, 24, 1718–1729. [Google Scholar] [CrossRef]
- Riley, M.; Cotgrave, A. Construction Technology 3: The Technology of Refurbishment and Maintenance; Macmillan Palgrave: London, UK, 2005. [Google Scholar]
- Lee, J.; Ahn, Y.; Lee, S. Post-handover defect risk profile of residential buildings using loss distribution approach. J. Manag. Eng. 2020, 36, 04020021. [Google Scholar] [CrossRef]
- Manrique, J.D.; Al-Hussein, M.; Telyas, A.; Funston, G. Case study-based challenges of quality concrete finishing for architecturally complex structures. J. Constr. Eng. Manag. 2007, 133, 208–216. [Google Scholar] [CrossRef]
- Brodetskaia, I.; Sacks, R.; Shapira, A. Stabilizing production flow of interior and finishing works with reentrant flow in building construction. J. Constr. Eng. Manag. 2013, 139, 665–674. [Google Scholar] [CrossRef]
- Belmonte, I.M.; Saorin, F.J.B.; Costa, C.P.; Paya, M.V. Quality of the surface finish of self-compacting concrete. J. Build. Eng. 2020, 28, 101068. [Google Scholar] [CrossRef]
- Yoon, S.; Son, S.; Kim, S. Design, Construction, and curing integrated management of defects in finishing works of apartment buildings. Sustainability 2021, 13, 5382. [Google Scholar] [CrossRef]
- Kliukas, R.; Kudzys, A. Probabilistic durability prediction of existing building elements. J. Civ. Eng. Manag. 2004, 10, 107–112. [Google Scholar] [CrossRef]
- Kim, S.; Frangopol, D.M.; Zhu, B. Probabilistic optimum inspection/repair planning to extend lifetime of deteriorating structures. J. Perform. Constr. Facil. 2011, 25, 534–544. [Google Scholar] [CrossRef]
- Kim, S.; Frangopol, D.M.; Soliman, M. Generalized probabilistic framework for optimum inspection and maintenance planning. J. Struct. Eng. 2013, 139, 435–447. [Google Scholar] [CrossRef]
- Silva, A.; Neves, L.C.; Gaspar, P.L.; de Brito, J. Probabilistic transition of condition: Render facades. Build. Res. Inf. 2016, 44, 301–318. [Google Scholar] [CrossRef]
- Pudleiner, D.; Colton, J. Using sensitivity analysis to improve the efficiency of a Net-Zero Energy vaccine warehouse design. Build. Environ. 2015, 87, 302–314. [Google Scholar] [CrossRef] [Green Version]
- Kaewunruen, S.; Rungskunroch, P.; Welsh, J. A Digital-Twin Evaluation of Net Zero Energy Building for Existing Buildings. Sustainability 2018, 11, 159. [Google Scholar] [CrossRef] [Green Version]
- Abdou, N.; Mghourchi, Y.E.; Hamdaoui, S.; Asri, N.E.; Mouqallid, M. Multi-objective optimization of passive energy efficiency measures for net-zero energy building in Morocco. Build. Environ. 2021, 204, 108141. [Google Scholar] [CrossRef]
- Meex, E.; Hollberg, A.; Knapen, E.; Hildebrand, L.; Verbeeck, G. Requirements for applying LCA-based environmental impact assessment tools in the early stages of building design. Build. Environ. 2018, 133, 228–236. [Google Scholar] [CrossRef]
- Hay, R.; Ostertag, C.P. Life cycle assessment (LCA) of double-skin façade (DSF) system with fiber-reinforced concrete for sustainable and energy-efficient buildings in the tropics. Build. Environ. 2018, 142, 327–341. [Google Scholar] [CrossRef]
- Decorte, Y.; Steeman, M.; Bossche, N.V.D. Effect of a one-dimensional approach in LCA on the environmental life cycle impact of buildings: Multi-family case study in Flanders. Build. Environ. 2021, 206, 108381. [Google Scholar] [CrossRef]
- Wolbring, G.; Rybchinski, T. Social Sustainability and Its Indicators through a Disability Studies and Ability Studies Lens. Sustainability 2013, 5, 4889–4907. [Google Scholar] [CrossRef] [Green Version]
- Au-Yong, C.P.; Ali, A.S.; Ahmad, F. Significant Characteristics of Scheduled and Condition-Based Maintenance in Office Buildings. J. Perform. Constr. Facil. 2014, 28, 257–263. [Google Scholar] [CrossRef] [Green Version]
- Kim, J.; Han, S.; Hyun, C. Minimizing fluctuation of the maintenance, repair, and rehabilitation cost profile of a building. J. Perform. Constr. Facil. 2016, 30, 04015034. [Google Scholar] [CrossRef]
- Cavalcante, C.A.V.; Alencar, M.H.; Lopes, R.S. Multicriteria model to support maintenance planning in residential complexes under warranty. J. Constr. Eng. Manag. 2017, 143, 04016110. [Google Scholar] [CrossRef]
- Alani, A.M.; Tattersall, R.P.; Okoroh, M.I. Quantitative models for building repair and maintenance: A comparative case-study. Facilities 2002, 20, 176–189. [Google Scholar] [CrossRef]
- Tirpude, N.P.; Jain, K.K.; Bhattacharjee, B. Decision model for repair prioritization of reinforced-concrete structures. J. Perform. Constr. Facil. 2014, 28, 250–256. [Google Scholar] [CrossRef]
- Park, S.; Kwon, N.; Ahn, Y. Forecasting repair schedule for building components based on case-based reasoning and fuzzy-AHP. Sustainability 2019, 11, 7181. [Google Scholar] [CrossRef] [Green Version]
- Kwon, N.; Ahn, Y.; Son, B.S.; Moon, H. Developing a machine learning-based building repair time estimation model considering weight assigning methods. J. Build. Eng. 2021, 43, 102627. [Google Scholar] [CrossRef]
- Asmar, M.E.; Hanna, A.S.; Chang, C.K. Monte Carlo simulation approach to support alliance team selection. J. Constr. Eng. Manag. 2009, 135, 1087–1095. [Google Scholar] [CrossRef]
- Alenander, C. Operational Risk: Regulation, Analysis and Management; Prentice Hall: Upper Saddle River, NJ, USA, 2007. [Google Scholar]
- Warszawski, A.; Rosenfeld, Y. Robot for interior-finishing works in building: Feasibility analysis. J. Constr. Eng. Manag. 1994, 120, 132–151. [Google Scholar] [CrossRef]
- Chong, W.K.; Low, S.P. Latent building defects: Causes and design strategies to prevent them. J. Perform. Constr. Facil. 2006, 20, 213–221. [Google Scholar] [CrossRef] [Green Version]
- Forcada, N.; Macarulla, M.; Love, P.E.D. Assessment of residential defects at post-handover. J. Constr. Eng. and Manag. 2013, 139, 372–378. [Google Scholar] [CrossRef]
- Rotimi, F.E.; Tookey, J.; Rotimi, J.O. Evaluating Defect reporting in new residential building in New Zealand. Buildings 2015, 5, 39–55. [Google Scholar] [CrossRef]
- Roh, S.; Tae, S.; Suk, S.J.; Ford, G. Evaluating the embodied environmental impacts of major building tasks and materials of apartment building in Korea. Renew. Sustain. Energy Rev. 2017, 73, 135–144. [Google Scholar] [CrossRef]


| Complex | Number of Buildings | Year Completed (Year) | Total Floor Area (m2) | Number of Households |
|---|---|---|---|---|
| A | 5 | 2000 | 52,434 | 598 |
| B | 3 | 2001 | 12,678 | 191 |
| C | 4 | 2000 | 48,000 | 510 |
| D | 4 | 2000 | 49,084 | 698 |
| E | 4 | 2001 | 43,508 | 500 |
| F | 5 | 1997 | 47,208 | 660 |
| G | 8 | 1996 | 69,017 | 1432 |
| H | 2 | 1996 | 19,850 | 335 |
| I | 8 | 1991 | 73,357 | 1623 |
| J | 4 | 1994 | 45,092 | 1000 |
| K | 7 | 1991 | 84,189 | 1807 |
| L | 11 | 1991 | 125,080 | 2619 |
| Classification | Researcher | |||||
|---|---|---|---|---|---|---|
| Yoon et al. [21] | Warszawski et al. [42] | Chong et al. [43] | Forcada et al. [44] | Rotimi et al [45] | Rho et al. [46] | |
| interior (I) | O | O | O | O | ||
| doors and windows (DW) | O | O | O | O | ||
| painting (P) | O | O | O | O | O | O |
| tiling (T) | O | O | O | O | O | O |
| front door (FD) | O | O | ||||
| furniture (F) | O | O | ||||
| waterproofing (W) | O | O | O | |||
| plastering (PL) | O | O | O | O | ||
| carpentry (CA) | O | |||||
| Classification | Subcategory |
|---|---|
| interior (I) | wall (I1), floor (I2), ceiling (I3), molding (I4) |
| doors and windows (DW) | wood (DW1), steel (DW2), plastic (DW3), aluminum (DW4), window screen (DW5) |
| painting (P) | water paint (P1), oil paint (P2), anti-sweating paint (P3) |
| tiling (T) | wall (T1), floor (T2) |
| front door (FD) | body (FD1), doorframe (FD2), components (FD3) |
| furniture (F) | general (F1), kitchen (F2) |
| waterproofing (W) | membrane waterproofing (W1), liquid waterproofing cement (W2), sheet waterproofing (W3), caulking (W4) |
| plastering (PL) | - |
| carpentry (CA) | - |
| Repair Time (Year) | Finishing Work | ||||||||||||
|---|---|---|---|---|---|---|---|---|---|---|---|---|---|
| I | DW | P | |||||||||||
| 1 | 2 | 3 | 4 | 1 | 2 | 3 | 4 | 5 | 1 | 2 | 3 | ||
| 7 | D(1,1) | D(1,2) | D(1,3) | D(1,4) | D(1,5) | D(1,6) | D(1,7) | D(1,8) | D(1,9) | D(1,10) | D(1,11) | D(1,12) | |
| 8 | D(2,1) | D(2,2) | D(2,3) | D(2,4) | D(2,5) | D(2,6) | D(2,7) | D(2,8) | D(2,9) | D(2,10) | D(2,11) | D(2,12) | |
| 9 | D(3,1) | D(3,2) | D(3,3) | D(3,4) | D(3,5) | D(3,6) | D(3,7) | D(3,8) | D(3,9) | D(3,10) | D(3,11) | D(3,12) | |
| 10 | D(4,1) | D(4,2) | D(4,3) | D(4,4) | D(4,5) | D(4,6) | D(4,7) | D(4,8) | D(4,9) | D(4,10) | D(4,11) | D(4,12) | |
| 11 | D(5,1) | D(5,2) | D(5,3) | D(5,4) | D(5,5) | D(5,6) | D(5,7) | D(5,8) | D(5,9) | D(5,10) | D(5,11) | D(5,12) | |
| 12 | D(6,1) | D(6,2) | D(6,3) | D(6,4) | D(6,5) | D(6,6) | D(6,7) | D(6,8) | D(6,9) | D(6,10) | D(6,11) | D(6,12) | |
| 13 | D(7,1) | D(7,2) | D(7,3) | D(7,4) | D(7,5) | D(7,6) | D(7,7) | D(7,8) | D(7,9) | D(7,10) | D(7,11) | D(7,12) | |
| 14 | D(8,1) | D(8,2) | D(8,3) | D(8,4) | D(8,5) | D(8,6) | D(8,7) | D(8,8) | D(8,9) | D(8,10) | D(8,11) | D(8,12) | |
| 15 | D(9,1) | D(9,2) | D(9,3) | D(9,4) | D(9,5) | D(9,6) | D(9,7) | D(9,8) | D(9,9) | D(9,10) | D(9,11) | D(9,12) | |
| 16 | D(10,1) | D(10,2) | D(10,3) | D(10,4) | D(10,5) | D(10,6) | D(10,7) | D(10,8) | D(10,9) | D(10,10) | D(10,11) | D(10,12) | |
| 17 | D(11,1) | D(11,2) | D(11,3) | D(11,4) | D(11,5) | D(11,6) | D(11,7) | D(11,8) | D(11,9) | D(11,10) | D(11,11) | D(11,12) | |
| 18 | D(12,1) | D(21,2) | D(12,3) | D(12,4) | D(12,5) | D(12,6) | D(12,7) | D(12,8) | D(12,9) | D(12,10) | D(12,11) | D(12,12) | |
| 19 | D(13,1) | D(13,2) | D(13,3) | D(13,4) | D(13,5) | D(13,6) | D(13,7) | D(13,8) | D(13,9) | D(13,10) | D(13,11) | D(13,12) | |
| 20 | D(14,1) | D(14,2) | D(14,3) | D(14,4) | D(14,5) | D(14,6) | D(14,7) | D(14,8) | D(14,9) | D(14,10) | D(14,11) | D(14,12) | |
| 21 | D(15,1) | D(15,2) | D(15,3) | D(15,4) | D(15,5) | D(15,6) | D(15,7) | D(15,8) | D(15,9) | D(15,10) | D(15,11) | D(15,12) | |
| 22 | D(16,1) | D(16,2) | D(16,3) | D(16,4) | D(16,5) | D(16,6) | D(16,7) | D(16,8) | D(16,9) | D(16,10) | D(16,11) | D(16,12) | |
| 23 | D(17,1) | D(17,2) | D(17,3) | D(17,4) | D(17,5) | D(17,6) | D(17,7) | D(17,8) | D(17,9) | D(17,10) | D(17,11) | D(17,12) | |
| 24 | D(18,1) | D(18,2) | D(18,3) | D(18,4) | D(18,5) | D(18,6) | D(18,7) | D(18,8) | D(18,9) | D(18,10) | D(18,11) | D(18,12) | |
| 25 | D(19,1) | D(19,2) | D(19,3) | D(19,4) | D(19,5) | D(19,6) | D(19,7) | D(19,8) | D(19,9) | D(19,10) | D(19,11) | D(19,12) | |
| 26 | D(20,1) | D(20,2) | D(20,3) | D(20,4) | D(20,5) | D(20,6) | D(20,7) | D(20,8) | D(20,9) | D(20,10) | D(20,11) | D(20,12) | |
| Repair Time (Year) | Finishing Work | ||||||||||||
| T | FD | F | W | PL | CA | ||||||||
| 1 | 2 | 1 | 2 | 3 | 1 | 2 | 1 | 2 | 3 | 4 | |||
| 7 | D(1,13) | D(1,14) | D(1,15) | D(1,16) | D(1,17) | D(1,18) | D(1,19) | D(1,20) | D(1,21) | D(1,22) | D(1,23) | D(1,24) | D(1,25) |
| 8 | D(2,13) | D(2,14) | D(2,15) | D(2,16) | D(2,17) | D(2,18) | D(2,19) | D(2,20) | D(2,21) | D(2,22) | D(2,23) | D(2,24) | D(2,25) |
| 9 | D(3,13) | D(3,14) | D(3,15) | D(3,16) | D(3,17) | D(3,18) | D(3,19) | D(3,20) | D(3,21) | D(3,22) | D(3,23) | D(3,24) | D(3,25) |
| 10 | D(4,13) | D(4,14) | D(4,15) | D(4,16) | D(4,17) | D(4,18) | D(4,19) | D(4,20) | D(4,21) | D(4,22) | D(4,23) | D(4,24) | D(4,25) |
| 11 | D(5,13) | D(5,14) | D(5,15) | D(5,16) | D(5,17) | D(5,18) | D(5,19) | D(5,20) | D(5,21) | D(5,22) | D(5,23) | D(5,24) | D(5,25) |
| 12 | D(6,13) | D(6,14) | D(6,15) | D(6,16) | D(6,17) | D(6,18) | D(6,19) | D(6,20) | D(6,21) | D(6,22) | D(6,23) | D(6,24) | D(6,25) |
| 13 | D(7,13) | D(7,14) | D(7,15) | D(7,16) | D(7,17) | D(7,18) | D(7,19) | D(7,20) | D(7,21) | D(7,22) | D(7,23) | D(7,24) | D(7,25) |
| 14 | D(8,13) | D(8,14) | D(8,15) | D(8,16) | D(8,17) | D(8,18) | D(8,19) | D(8,20) | D(8,21) | D(8,22) | D(8,23) | D(8,24) | D(8,25) |
| 15 | D(9,13) | D(9,14) | D(9,15) | D(9,16) | D(9,17) | D(9,18) | D(9,19) | D(9,20) | D(9,21) | D(9,22) | D(9,23) | D(9,24) | D(9,25) |
| 16 | D(10,13) | D(10,14) | D(10,15) | D(10,16) | D(10,17) | D(10,18) | D(10,19) | D(10,20) | D(10,21) | D(10,22) | D(10,23) | D(10,24) | D(10,25) |
| 17 | D(11,13) | D(11,14) | D(11,15) | D(11,16) | D(11,17) | D(11,18) | D(11,19) | D(11,20) | D(11,21) | D(11,22) | D(11,23) | D(11,24) | D(11,25) |
| 18 | D(12,13) | D(12,14) | D(12,15) | D(12,16) | D(12,17) | D(12,18) | D(12,19) | D(12,20) | D(12,21) | D(12,22) | D(12,23) | D(12,24) | D(12,25) |
| 19 | D(13,13) | D(13,14) | D(13,15) | D(13,16) | D(13,17) | D(13,18) | D(13,19) | D(13,20) | D(13,21) | D(13,22) | D(13,23) | D(13,24) | D(13,25) |
| 20 | D(14,13) | D(14,14) | D(14,15) | D(14,16) | D(14,17) | D(14,18) | D(14,19) | D(14,20) | D(14,21) | D(14,22) | D(14,23) | D(14,24) | D(14,25) |
| 21 | D(15,13) | D(15,14) | D(15,15) | D(15,16) | D(15,17) | D(15,18) | D(15,19) | D(15,20) | D(15,21) | D(15,22) | D(15,23) | D(15,24) | D(15,25) |
| 22 | D(16,13) | D(16,14) | D(16,15) | D(16,16) | D(16,17) | D(16,18) | D(16,19) | D(16,20) | D(16,21) | D(16,22) | D(16,23) | D(16,24) | D(16,25) |
| 23 | D(17,13) | D(17,14) | D(17,15) | D(17,16) | D(17,17) | D(17,18) | D(17,19) | D(17,20) | D(17,21) | D(17,22) | D(17,23) | D(17,24) | D(17,25) |
| 24 | D(18,13) | D(18,14) | D(18,15) | D(18,16) | D(18,17) | D(18,18) | D(18,19) | D(18,20) | D(18,21) | D(18,22) | D(18,23) | D(18,24) | D(18,25) |
| 25 | D(19,13) | D(19,14) | D(19,15) | D(19,16) | D(19,17) | D(19,18) | D(19,19) | D(19,20) | D(19,21) | D(19,22) | D(19,23) | D(19,24) | D(19,25) |
| 26 | D(20,13) | D(20,14) | D(20,15) | D(20,16) | D(20,17) | D(20,18) | D(20,19) | D(20,20) | D(20,21) | D(20,22) | D(20,23) | D(20,24) | D(20,25) |
| Classification | Subcategory | Case |
|---|---|---|
| interior (I) | wall (I1) | 12,406 (25.4%) |
| floor (I2) | 5991 (12.7%) | |
| ceiling (I3) | 972 (2.1%) | |
| molding (I4) | 95 (0.2%) | |
| doors and windows (DW) | wood (DW1) | 1997 (4.2%) |
| steel (DW2) | 163 (0.3%) | |
| plastic (DW3) | 3965 (8.4%) | |
| aluminum (DW4) | 196 (0.4%) | |
| window screen (DW5) | 1049 (2.2%) | |
| painting (P) | water paint (P1) | 3443 (7.3%) |
| oil paint (P2) | 1006 (2.1%) | |
| anti-sweating paint (P3) | 300 (0.6%) | |
| tiling (T) | wall (T1) | 2967 (6.3%) |
| floor (T2) | 1482 (3.1%) | |
| front door (FD) | body (FD1) | 1885 (4.0%) |
| doorframe (FD2) | 710 (1.5%) | |
| components (FD3) | 1006 (2.1%) | |
| furniture (F) | general (F1) | 292 (0.6%) |
| kitchen (F2) | 3914 (8.3%) | |
| waterproofing (W) | membrane waterproofing (W1) | 116 (0.2%) |
| liquid waterproofing cement (W2) | 2214 (4.7%) | |
| sheet waterproofing (W3) | 78 (0.2%) | |
| caulking (W4) | 794 (1.7%) | |
| plastering (PL) | - | 349 (0.7%) |
| carpentry (CA) | - | 314 (0.7%) |
| Total | 47,344 (100.0%) | |
| Repair Time (Year) | Finishing Work | ||||||||||||||||||||||||
|---|---|---|---|---|---|---|---|---|---|---|---|---|---|---|---|---|---|---|---|---|---|---|---|---|---|
| I | DW | P | T | FD | F | W | PL | CA | |||||||||||||||||
| 1 | 2 | 3 | 4 | 1 | 2 | 3 | 4 | 5 | 1 | 2 | 3 | 1 | 2 | 1 | 2 | 3 | 1 | 2 | 1 | 2 | 3 | 4 | |||
| 7 | 162 | 163 | - | 1 | - | - | 3 | - | - | 16 | - | - | 10 | 2 | - | - | - | - | 6 | 1 | 2 | - | 2 | - | - |
| 8 | 816 | 799 | 17 | 1 | 25 | - | 17 | 3 | 6 | 57 | 9 | - | 34 | 9 | 5 | 2 | 4 | - | 87 | 5 | 28 | - | 7 | 1 | - |
| 9 | 297 | 245 | 5 | - | 54 | 4 | 688 | 10 | 10 | 95 | 56 | - | 52 | 19 | 15 | 9 | 14 | 8 | 152 | 5 | 15 | 1 | 15 | 1 | 4 |
| 10 | 642 | 564 | 11 | - | 29 | 1 | 42 | 8 | 8 | 122 | 49 | 1 | 79 | 20 | 19 | 10 | 15 | 24 | 196 | 2 | 19 | 1 | 14 | 3 | 13 |
| 11 | 269 | 191 | 2 | 5 | 8 | - | 18 | 1 | 6 | 106 | 60 | - | 98 | 32 | 11 | 1 | 6 | 9 | 107 | 6 | 39 | 1 | 26 | - | 24 |
| 12 | 412 | 210 | 17 | - | 32 | 12 | 1734 | 9 | 8 | 146 | 99 | - | 119 | 28 | 28 | 6 | 39 | 9 | 165 | 9 | 19 | - | 10 | 8 | 30 |
| 13 | 575 | 334 | 23 | 7 | 54 | 9 | 64 | 6 | 16 | 305 | 106 | - | 210 | 59 | 58 | 12 | 45 | 14 | 124 | 6 | 50 | 3 | 18 | 8 | 25 |
| 14 | 477 | 414 | 26 | 5 | 30 | 3 | 67 | 3 | 10 | 155 | 88 | 5 | 259 | 44 | 46 | 1 | 40 | 2 | 98 | 2 | 69 | - | 23 | 1 | 1 |
| 15 | 386 | 199 | 34 | 2 | 38 | 16 | 72 | 14 | 11 | 112 | 70 | 1 | 597 | 31 | 74 | 3 | 47 | 8 | 293 | 5 | 67 | 8 | 13 | 6 | 4 |
| 16 | 1564 | 821 | 47 | 8 | 98 | 15 | 130 | 11 | 121 | 165 | 34 | 1 | 271 | 63 | 85 | 8 | 46 | 30 | 212 | 3 | 89 | 4 | 13 | 15 | 6 |
| 17 | 530 | 195 | 50 | 5 | 87 | 11 | 132 | 19 | 85 | 129 | 11 | 2 | 253 | 87 | 60 | 9 | 45 | 12 | 66 | 17 | 146 | 7 | 36 | 12 | 8 |
| 18 | 555 | 304 | 94 | 4 | 201 | 19 | 142 | 39 | 123 | 183 | 51 | 1 | 164 | 174 | 213 | 167 | 200 | 32 | 109 | 8 | 187 | 17 | 42 | 36 | 25 |
| 19 | 774 | 398 | 115 | 3 | 263 | 18 | 187 | 27 | 93 | 219 | 59 | 1 | 164 | 150 | 322 | 249 | 175 | 20 | 196 | 8 | 247 | 13 | 58 | 28 | 27 |
| 20 | 889 | 218 | 95 | 10 | 191 | 17 | 198 | 15 | 122 | 301 | 50 | 3 | 141 | 176 | 130 | 92 | 57 | 21 | 408 | 2 | 193 | 3 | 35 | 17 | 21 |
| 21 | 547 | 227 | 95 | 10 | 193 | 4 | 106 | 12 | 81 | 262 | 42 | 28 | 133 | 127 | 93 | 28 | 45 | 18 | 143 | 4 | 268 | 7 | 78 | 41 | 10 |
| 22 | 730 | 145 | 92 | 8 | 175 | 3 | 105 | 3 | 71 | 286 | 123 | 61 | 80 | 147 | 115 | 63 | 33 | 9 | 328 | 2 | 231 | 4 | 86 | 60 | 18 |
| 23 | 1103 | 254 | 115 | 8 | 235 | 5 | 128 | 2 | 83 | 478 | 30 | 94 | 95 | 109 | 187 | 11 | 13 | 21 | 383 | 16 | 267 | 5 | 173 | 69 | 67 |
| 24 | 714 | 147 | 65 | 8 | 138 | 5 | 65 | 7 | 90 | 168 | 44 | 17 | 95 | 85 | 157 | 25 | 58 | 34 | 394 | 8 | 84 | - | 51 | 20 | 26 |
| 25 | 347 | 105 | 44 | 6 | 64 | 2 | 47 | 6 | 59 | 76 | 14 | 18 | 57 | 53 | 146 | 10 | 71 | 14 | 277 | 3 | 77 | 2 | 45 | 17 | 2 |
| 26 | 257 | 58 | 25 | 4 | 82 | 19 | 20 | 1 | 46 | 62 | 11 | 67 | 56 | 67 | 121 | 4 | 53 | 7 | 170 | 4 | 117 | 2 | 49 | 6 | 3 |
| Total | 12,046 | 5991 | 972 | 95 | 1997 | 163 | 3965 | 196 | 1049 | 3443 | 1006 | 300 | 2967 | 1482 | 1885 | 710 | 1006 | 292 | 3914 | 116 | 2214 | 78 | 794 | 349 | 314 |
| Repair Time (Year) | Finishing Work | ||||||||||||
|---|---|---|---|---|---|---|---|---|---|---|---|---|---|
| I | DW | P | |||||||||||
| 1 | 2 | 3 | 4 | 1 | 2 | 3 | 4 | 5 | 1 | 2 | 3 | ||
| 7 | Bi(11.45) | Bi(13.03) | - | Po(0.000) | - | - | Po(0.000) | - | - | Po(12.98) | - | - | |
| 8 | Nb(0.173) | Nb(0.170) | Po(8.504) | Po(0.000) | Bi(0.690) | - | Po(2.434) | Po(0.000) | Po(2.639) | Nb(0.231) | Po(2.282) | - | |
| 9 | Nb(0.030) | Po(0.800) | Po(0.000) | - | Ge(0.075) | Po(0.000) | Ge(17.87) | Po(0.158) | Po(0.732) | Nb(0.309) | Ge(8.895) | - | |
| 10 | Nb(0.452) | Ge(4.849) | Po(0.141) | - | Po(0.870) | Po(0.000) | Ge(1.615) | Po(0.144) | Po(1.630) | Ge(6.176) | Ge(4.300) | Po(0.000) | |
| 11 | Ge(3.499) | Nb(5.012) | Po(0.000) | Po(0.000) | Po(0.233) | - | Po(1.122) | Po(0.000) | Po(1.361) | Ge(3.224) | Ge(12.07) | - | |
| 12 | Ge(5.090) | Nb(4.244) | Po(3.606) | - | Po(9.308) | Po(5.261) | Ge(77.97) | Po(2.525) | Po(0.233) | Ge(19.59) | Ge(26.53) | - | |
| 13 | Ge(1.070) | Ge(6.615) | Po(1.183) | Po(0.370) | Bi(1.401) | Po(0.650) | Ge(3.254) | Po(0.066) | Po(0.145) | Ge(10.44) | Ge(26.55) | - | |
| 14 | Ge(8.208) | Ge(5.880) | Po(6.283) | Po(0.000) | Po(6.989) | Po(0.000) | Ge(8.216) | Po(0.000) | Po(0.005) | Nb(2.082) | Ge(8.912) | Po(0.000) | |
| 15 | Ge(2.878) | Nb(5.071) | Po(9.432) | Po(0.000) | Bi(0.113) | Po(3.016) | Ge(5.271) | Po(0.929) | Po(1.778) | Ge(2.400) | Ge(11.96) | Po(0.000) | |
| 16 | Ge(21.50) | Ge(77.24) | Po(20.21) | Po(0.030) | Ge(8.956) | Po(1.692) | Ge(9.122) | Po(0.469) | Ge(19.43) | Ge(18.78) | Po(16.70) | Po(0.000) | |
| 17 | Ge(20.69) | Ge(14.05) | Po(17.00) | Po(0.000) | Ge(7.837) | Po(0.112) | Ge(14.70) | Po(3.214) | Ge(17.55) | Ge(12.41) | Po(1.924) | Po(0.000) | |
| 18 | Nb(2.116) | Ge(2.360) | Ge(8.500) | Po(0.000) | Ge(1.966) | Po(1.992) | Ge(3.702) | Po(8.586) | Ge(4.171) | Nb(4.174) | Ge(12.71) | Po(0.000) | |
| 19 | Nb(2.579) | Ge(10.97) | Ge(12.25) | Po(0.000) | Nb(5.954) | Po(1.007) | Nb(1.370) | Po(4.694) | Ge(5.209) | Ge(1.155) | Ge(0.215) | Po(0.000) | |
| 20 | Ge(1.815) | Ge(3.912) | Ge(18.57) | Po(0.130) | Ge(6.990) | Po(3.908) | Nb(3.754) | Po(3.625) | Ge(6.290) | Nb(11.89) | Ge(0.000) | Po(0.000) | |
| 21 | Nb(10.60) | Ge(9.964) | Ge(4.801) | Po(1.177) | Nb(5.482) | Po(0.000) | Ge(1.804) | Po(1.476) | Ge(12.04) | Ge(31.39) | Ge(0.000) | Po(7.835) | |
| 22 | Nb(2.917) | Nb(0.445) | Ge(0.952) | Po(0.760) | Nb(0.047) | Po(0.000) | Nb(1.160) | Po(0.000) | Ge(0.973) | Nb(2.406) | Ge(20.92) | Ge(2.392) | |
| 23 | Nb(7.984) | Ge(8.744) | Ge(5.622) | Po(0.194) | Ge(1.012) | Po(0.000) | Ge(4.828) | Po(0.000) | Ge(1.226) | Nb(9.062) | Po(12.23) | Ge(15.28) | |
| 24 | Nb(0.899) | Ge(2.299) | Ge(2.942) | Po(0.703) | Ge(2.137) | Po(0.000) | Ge(1.180) | Po(0.974) | Ge(5.868) | Ge(12.24) | Ge(0.426) | Po(3.091) | |
| 25 | Nb(7.990) | Ge(7.282) | Po(4.838) | Po(0.030) | Bi(0.868) | Po(0.000) | Po(1.733) | Po(0.097) | Ge(5.872) | Ge(3.424) | Po(2.316) | Po(0.609) | |
| 26 | Ge(0.968) | Ge(0.477) | Po(4.223) | Po(0.000) | Ge(6.770) | Po(0.036) | Po(0.590) | Po(0.000) | Ge(0.266) | Nb(0.966) | Po(0.660) | Ge(10.96) | |
| Repair Time (Year) | Finishing Work | ||||||||||||
| T | FD | F | W | PL | CA | ||||||||
| 1 | 2 | 1 | 2 | 3 | 1 | 2 | 1 | 2 | 3 | 4 | |||
| 7 | Po(3.137) | Po(0.000) | - | - | - | - | Po(1.242) | Po(0.000) | Po(0.000) | - | Po(0.000) | - | - |
| 8 | Ge(0.315) | Po(3.904) | Po(0.000) | Po(0.000) | Po(0.000) | - | Ge(1.480) | Po(0.000) | Ge(1.805) | - | Po(0.197) | Po(0.000) | - |
| 9 | Ge(5.951) | Po(1.082) | Po(1.307) | Po(0.337) | Po(0.856) | Po(0.575) | Po(3.325) | Po(0.000) | Po(2.532) | Po(0.000) | Po(2.532) | Po(0.000) | Po(0.000) |
| 10 | Ge(18.77) | Po(5.376) | Po(1.759) | Po(0.279) | Po(0.265) | Po(15.14) | Ge(10.18) | Po(0.000) | Po(4.528) | Po(0.000) | Po(1.208) | Po(0.000) | Po(2.840) |
| 11 | Ge(21.39) | Po(10.67) | Po(0.300) | Po(0.000) | Po(0.493) | Po(0.611) | Ge(9.059) | Po(2.658) | Po(12.39) | Po(0.000) | Po(8.121) | - | Po(16.06) |
| 12 | Ge(27.80) | Po(6.878) | Po(6.878) | Po(0.051) | Ge(0.000) | Po(0.611) | Ge(10.65) | Po(0.611) | Po(0.324) | - | Po(0.075) | Po(0.814) | Po(18.16) |
| 13 | Ge(13.25) | Ge(0.564) | Ge(0.576) | Po(0.715) | Po(6.465) | Po(0.378) | Nb(6.538) | Po(1.376) | Po(8.644) | Po(0.000) | Po(2.148) | Po(0.846) | Po(20.37) |
| 14 | Ge(18.28) | Ge(0.000) | Ge(1.867) | Po(0.000) | Po(1.949) | Po(0.000) | Ge(1.866) | Po(0.000) | Ge(10.23) | - | Po(4.219) | Po(0.000) | Po(0.000) |
| 15 | Ge(45.94) | Po(14.76) | Ge(4.516) | Po(0.000) | Po(5.089) | Po(0.258) | Ge(13.18) | Po(0.000) | Ge(3.204) | Po(0.846) | Po(0.000) | Po(0.040) | Po(0.000) |
| 16 | Ge(39.12) | Ge(8.028) | Ge(16.25) | Po(0.030) | Po(9.483) | Po(13.05) | Ge(38.42) | Po(0.000) | Ge(8.974) | Po(0.000) | Po(3.396) | Po(0.967) | Po(0.091) |
| 17 | Ge(41.58) | Ge(12.77) | Ge(23.12) | Po(0.012) | Po(12.50) | Po(0.360) | Ge(3.343) | Po(1.207) | Ge(20.33) | Po(0.055) | Po(9.041) | Po(0.067) | Po(0.321) |
| 18 | Nb(9.760) | Nb(6.335) | Nb(1.630) | Ge(23.06) | Ge(7.194) | Po(1.500) | Ge(6.152) | Po(0.288) | Po(4.661) | Po(1.782) | Po(10.69) | Po(0.767) | Po(1.589) |
| 19 | Ge(9.953) | Nb(13.95) | Ge(2.336) | Ge(58.22) | Ge(7.710) | Po(0.957) | Nb(31.37) | Po(0.073) | Po(2.350) | Po(0.060) | Ge(1.085) | Po(1.656) | Po(4.694) |
| 20 | Ge(9.149) | Ge(7.233) | Po(6.880) | Ge(10.41) | Ge(0.030) | Po(0.735) | Ge(9.549) | Po(0.000) | Ge(1.987) | Po(0.000) | Po(5.122) | Po(0.003) | Po(3.176) |
| 21 | Ge(6.625) | Nb(8.999) | Po(15.96) | Po(2.686) | Po(5.818) | Po(3.267) | Ge(21.75) | Po(0.000) | Ge(10.87) | Po(0.375) | Ge(6.601) | Po(13.40) | Po(0.104) |
| 22 | Ge(6.992) | Ge(9.500) | Nb(1.987) | Ge(11.54) | Po(3.059) | Po(2.475) | Ge(2.209) | Po(0.000) | Ge(4.988) | Po(0.000) | Ge(6.006) | Po(6.356) | Po(2.769) |
| 23 | Nb(11.97) | Nb(2.013) | Ge(18.26) | Po(1.613) | Po(4.503) | Po(2.244) | Ge(1.199) | Po(2.662) | Ge(2.305) | Po(0.000) | Ge(6.006) | Ge(6.671) | Ge(14.74) |
| 24 | Ge(4.646) | Ge(3.521) | Un(3.000) | Po(7.420) | Ge(7.038) | Po(2.369) | Ge(8.786) | Po(1.646) | Nb(0.786) | - | Ge(0.585) | Po(7.476) | Po(13.53) |
| 25 | Ge(9.642) | Ge(4.260) | Nb(0.669) | Po(0.016) | Po(10.59) | Po(1.263) | Ge(4.022) | Po(0.000) | Po(17.87) | Po(0.000) | Ge(0.617) | Po(1.865) | Po(0.000) |
| 26 | Ge(3.765) | Ge(1.135) | Po(6.761) | Po(0.000) | Ge(4.493) | Po(0.276) | Ge(2.343) | Po(0.000) | Ge(3.509) | Po(0.000) | Ge(1.783) | Po(0.097) | Po(0.000) |
| Repair Time (Year) | Finishing Work | ||||||||||||||||||||||||
|---|---|---|---|---|---|---|---|---|---|---|---|---|---|---|---|---|---|---|---|---|---|---|---|---|---|
| I | DW | P | T | FD | F | W | PL | CA | |||||||||||||||||
| 1 | 2 | 3 | 4 | 1 | 2 | 3 | 4 | 5 | 1 | 2 | 3 | 1 | 2 | 1 | 2 | 3 | 1 | 2 | 1 | 2 | 3 | 4 | |||
| 7 | 8.10 (2.00) | 8.15 (2.06) | - (-) | 0.05 (0.22) | - (-) | - (-) | 0.15 (0.39) | - (-) | - (-) | 0.80 (0.89) | - (-) | - (-) | 0.50 (0.71) | 0.10 (0.32) | - (-) | - (-) | - (-) | - (-) | 0.30 (0.55) | 0.05 (0.22) | 0.10 (0.32) | - (-) | 0.10 (0.32) | - (-) | - (-) |
| 8 | 40.8 (40.3) | 40.0 (39.5) | 0.85 (0.92) | 0.05 (0.22) | 1.25 (0.68) | - (-) | 0.85 (0.92) | 0.15 (0.39) | 0.30 (0.55) | 2.85 (2.30) | 0.45 (0.67) | - (-) | 1.70 (1.09) | 0.45 (0.67) | 0.25 (0.50) | 0.10 (0.32) | 0.20 (0.45) | - (-) | 4.35 (3.82) | 0.25 (0.50) | 1.40 (0.75) | - (-) | 0.35 (0.59) | 0.05 (0.22) | - (-) |
| 9 | 14.9 (7.66) | 12.3 (3.50) | 0.25 (0.50) | - (-) | 2.70 (2.14) | 0.20 (0.45) | 34.4 (33.9) | 0.50 (0.71) | 0.50 (0.71) | 4.75 (4.22) | 2.80 (2.24) | - (-) | 2.60 (2.04) | 0.95 (0.97) | 0.75 (0.87) | 0.45 (0.67) | 0.70 (0.84) | 0.40 (0.63) | 7.60 (2.76) | 0.25 (0.50) | 0.75 (0.87) | 0.05 (0.22) | 0.75 (0.87) | 0.05 (0.22) | 0.20 (0.45) |
| 10 | 25.7 (17.4) | 22.6 (22.1) | 0.44 (0.66) | - (-) | 1.16 (1.08) | 0.04 (0.20) | 1.68 (1.07) | 0.32 (0.57) | 0.32 (0.57) | 4.88 (4.35) | 1.96 (1.37) | 0.04 (0.20) | 3.16 (2.61) | 0.80 (0.89) | 0.76 (0.87) | 0.40 (0.63) | 0.60 (0.77) | 0.96 (0.98) | 7.84 (7.32) | 0.08 (0.28) | 0.76 (7.87) | 0.04 (0.20) | 0.56 (0.75) | 0.12 (0.35) | 0.52 (0.72) |
| 11 | 7.69 (7.17) | 5.46 (4.93) | 0.06 (0.24) | 0.14 (0.38) | 0.23 (0.48) | - (-) | 0.51 (0.72) | 0.03 (0.17) | 0.17 (0.41) | 3.03 (2.48) | 1.71 (1.11) | - (-) | 2.80 (2.24) | 0.91 (0.96) | 0.31 (0.56) | 0.03 (0.17) | 0.17 (0.41) | 0.26 (0.51) | 3.06 (2.51) | 0.17 (0.41) | 1.11 (1.06) | 0.03 (0.17) | 0.74 (0.86) | - (-) | 0.69 (0.83) |
| 12 | 11.8 (11.3) | 6.00 (3.46) | 0.49 (0.70) | - (-) | 0.91 (0.96) | 0.34 (0.59) | 49.5 (49.0) | 0.26 (0.51) | 0.23 (0.48) | 4.17 (3.64) | 2.83 (2.27) | - (-) | 3.40 (2.86) | 0.80 (0.89) | 0.80 (0.89) | 0.17 (0.41) | 1.11 (0.36) | 0.26 (0.51) | 4.71 (4.18) | 0.26 (0.51) | 0.54 (0.74) | - (-) | 0.29 (0.53) | 0.23 (0.48) | 0.86 (0.93) |
| 13 | 14.7 (14.2) | 8.56 (8.05) | 0.59 (0.77) | 0.18 (0.42) | 1.38 (0.65) | 0.23 (0.48) | 1.64 (1.03) | 0.15 (0.39) | 0.41 (0.64) | 7.82 (7.30) | 2.72 (2.16) | - (-) | 5.38 (4.86) | 1.51 (0.88) | 1.49 (0.85) | 0.31 (0.55) | 1.15 (1.07) | 0.36 (0.60) | 3.18 (2.63) | 0.15 (0.39) | 1.28 (1.13) | 0.08 (0.28) | 0.46 (0.68) | 0.21 (0.45) | 0.64 (0.80) |
| 14 | 12.2 (11.7) | 10.6 (10.1) | 0.67 (0.82) | 0.13 (0.36) | 0.77 (0.88) | 0.08 (0.28) | 1.72 (1.11) | 0.08 (0.28) | 0.26 (0.51) | 3.97 (1.98) | 2.26 (1.68) | 0.13 (0.36) | 6.64 (6.12) | 1.13 (0.38) | 1.18 (0.46) | 0.03 (0.16) | 1.03 (1.01) | 0.05 (0.23) | 2.51 (1.95) | 0.05 (0.23) | 1.77 (1.17) | - (-) | 0.59 (0.77) | 0.03 (0.16) | 0.03 (0.16) |
| 15 | 9.90 (9.38) | 5.10 (2.81) | 0.87 (0.93) | 0.05 (0.23) | 0.96 (0.93) | 0.41 (0.64) | 1.85 (1.25) | 0.36 (0.60) | 0.28 (0.53) | 2.87 (2.32) | 1.79 (1.19) | 0.03 (0.16) | 15.3 (14.8) | 0.79 (0.89) | 1.90 (1.30) | 0.08 (0.28) | 1.21 (1.10) | 0.21 (0.45) | 7.51 (6.99) | 0.13 (0.36) | 1.72 (1.11) | 0.21 (0.45) | 0.33 (0.58) | 0.15 (0.39) | 0.10 (0.32) |
| 16 | 29.0 (28.5) | 15.2 (14.7) | 0.87 (0.93) | 0.15 (0.38) | 1.81 (1.22) | 0.28 (0.53) | 2.41 (1.84) | 0.20 (0.45) | 2.24 (1.67) | 3.06 (2.51) | 0.63 (0.79) | 0.02 (0.14) | 5.02 (4.49) | 1.17 (0.44) | 1.57 (0.95) | 0.15 (0.38) | 0.85 (0.92) | 0.56 (0.75) | 3.93 (3.39) | 0.06 (0.24) | 1.65 (1.03) | 0.07 (0.27) | 0.24 (0.49) | 0.28 (0.53) | 0.11 (0.33) |
| 17 | 9.81 (9.30) | 3.61 (3.07) | 0.93 (0.96) | 0.09 (0.30) | 1.61 (0.99) | 1.01 (0.10) | 2.44 (1.88) | 0.35 (0.59) | 1.57 (0.95) | 2.39 (1.82) | 0.20 (0.45) | 0.04 (0.19) | 4.69 (4.16) | 1.61 (0.99) | 1.11 (0.35) | 0.17 (0.41) | 0.83 (0.91) | 0.22 (0.47) | 1.22 (0.52) | 0.31 (0.56) | 2.70 (2.15) | 0.13 (0.36) | 0.67 (0.82) | 0.22 (0.47) | 0.15 (0.38) |
| 18 | 12.3 (7.98) | 6.76 (6.24) | 2.09 (1.51) | 0.09 (0.30) | 4.47 (3.94) | 0.42 (0.65) | 3.16 (2.61) | 0.87 (0.93) | 2.73 (2.18) | 4.07 (3.53) | 1.13 (0.39) | 0.02 (0.15) | 3.64 (3.10) | 3.87 (3.33) | 4.73 (4.20) | 3.71 (3.17) | 4.44 (3.91) | 0.71 (0.84) | 2.42 (1.86) | 0.18 (0.42) | 4.16 (2.04) | 0.38 (0.61) | 0.93 (0.97) | 0.80 (0.89) | 0.56 (0.75) |
| 19 | 17.2 (11.4) | 8.84 (8.33) | 2.56 (1.99) | 0.07 (0.26) | 5.84 (3.35) | 0.40 (0.63) | 4.16 (3.62) | 0.60 (0.77) | 2.07 (1.48) | 4.87 (4.34) | 1.31 (0.64) | 0.02 (0.15) | 3.64 (3.10) | 3.33 (2.79) | 7.16 (6.64) | 5.53 (5.01) | 3.89 (3.35) | 0.44 (0.67) | 4.36 (2.26) | 0.18 (0.42) | 5.49 (2.34) | 0.29 (0.54) | 1.29 (0.61) | 0.62 (0.79) | 0.60 (0.77) |
| 20 | 19.8 (19.3) | 4.84 (4.32) | 2.11 (1.53) | 0.22 (0.47) | 4.24 (3.71) | 0.38 (0.61) | 4.40 (3.87) | 0.33 (0.58) | 2.71 (2.51) | 6.69 (6.17) | 1.11 (0.35) | 0.07 (0.26) | 3.13 (2.59) | 3.91 (3.37) | 2.89 (1.70) | 2.04 (1.46) | 1.27 (0.58) | 0.47 (0.68) | 9.07 (8.55) | 0.04 (0.21) | 4.29 (3.76) | 0.07 (0.26) | 0.78 (0.88) | 0.38 (0.61) | 0.47 (0.68) |
| 21 | 13.7 (13.2) | 5.68 (5.15) | 2.38 (1.81) | 0.25 (0.50) | 4.82 (4.30) | 0.10 (0.32) | 2.65 (2.09) | 0.30 (0.55) | 2.03 (1.44) | 6.55 (6.03) | 1.05 (0.23) | 0.70 (0.84) | 3.33 (2.78) | 3.18 (2.63) | 2.33 (1.52) | 0.70 (0.84) | 1.13 (1.06) | 0.45 (0.67) | 3.58 (3.03) | 0.10 (0.32) | 6.70 (6.18) | 0.18 (0.42) | 1.95 (1.36) | 1.03 (1.01) | 0.25 (0.50) |
| 22 | 24.3 (11.1) | 4.83 (4.30) | 3.07 (2.52) | 0.27 (0.52) | 5.83 (3.34) | 0.10 (0.32) | 3.50 (2.96) | 0.10 (0.32) | 2.37 (1.80) | 9.53 (5.99) | 4.10 (3.57) | 2.03 (1.45) | 2.67 (2.11) | 4.90 (4.37) | 3.83 (3.30) | 2.10 (1.52) | 1.10 (1.05) | 0.30 (0.55) | 10.9 (10.4) | 0.07 (0.26) | 7.70 (7.18) | 0.13 (0.37) | 5.77 (5.24) | 2.00 (1.41) | 0.60 (0.77) |
| 23 | 36.8 (17.4) | 8.47 (7.95) | 3.83 (3.30) | 0.27 (0.52) | 7.83 (7.32) | 0.17 (0.41) | 4.27 (3.73) | 0.07 (0.26) | 2.77 (2.21) | 15.9 (10.5) | 1.00 (1.00) | 3.13 (2.59) | 3.17 (2.62) | 3.63 (3.09) | 6.23 (5.71) | 0.37 (0.61) | 0.43 (0.66) | 0.70 (0.84) | 12.8 (12.3) | 0.53 (0.73) | 8.90 (8.39) | 0.17 (0.41) | 5.77 (5.24) | 2.30 (1.73) | 2.23 (1.66) |
| 24 | 27.5 (15.0) | 5.65 (5.13) | 2.50 (1.94) | 0.31 (0.55) | 5.31 (4.78) | 0.19 (0.44) | 2.50 (1.94) | 0.27 (0.52) | 3.46 (2.92) | 6.46 (5.94) | 1.69 (1.08) | 0.65 (0.81) | 3.65 (3.11) | 3.27 (2.72) | 6.00 (3.74) | 0.96 (0.98) | 2.23 (1.66) | 1.31 (1.14) | 15.2 (14.7) | 0.31 (0.55) | 3.23 (2.68) | - (-) | 1.96 (1.37) | 0.77 (0.88) | 1.00 (1.00) |
| 25 | 13.4 (8.70) | 4.04 (3.50) | 1.69 (1.30) | 0.23 (0.48) | 2.46 (0.66) | 0.08 (0.28) | 1.81 (1.34) | 0.23 (0.48) | 2.27 (1.70) | 2.92 (2.37) | 0.54 (0.73) | 0.69 (0.83) | 2.19 (1.62) | 2.04 (1.45) | 5.62 (5.09) | 0.38 (0.62) | 2.73 (1.65) | 0.54 (0.73) | 10.7 (10.1) | 0.12 (0.34) | 2.96 (1.72) | 0.08 (0.28) | 1.73 (1.12) | 0.65 (0.81) | 0.08 (0.28) |
| 26 | 9.88 (9.37) | 2.23 (1.66) | 0.96 (0.98) | 0.15 (0.39) | 3.15 (2.61) | 0.73 (0.85) | 0.77 (0.88) | 0.04 (0.20) | 1.77 (1.17) | 2.38 (0.68) | 0.42 (0.65) | 2.58 (2.02) | 2.15 (1.58) | 2.58 (2.02) | 4.65 (2.16) | 0.15 (0.39) | 2.04 (1.45) | 0.27 (0.52) | 6.54 (6.02) | 0.15 (0.39) | 4.50 (3.97) | 0.08 (0.28) | 1.88 (1.29) | 0.23 (0.48) | 0.12 (0.34) |
| Classification | Sub-Category | Statistics of Repair Time Distributions | |||||
|---|---|---|---|---|---|---|---|
| Mean | Median | Mode | Standard Deviation | Skewness | Kurtosis | ||
| Interior (I) | Wall (I1) | 16.78 | 16.86 | 17.00 | 1.14 | −0.3748 | 3.17 |
| Floor (I2) | 13.89 | 13.93 | 14.00 | 1.30 | −0.0911 | 2.76 | |
| Ceiling (I3) | 19.85 | 19.88 | 20.00 | 0.91 | −0.2197 | 3.01 | |
| Molding (I4) | 18.30 | 19.67 | 0.00 | 5.88 | −1.9200 | 6.62 | |
| Door and windows (DW) | Wood (DW1) | 19.59 | 19.62 | 20.00 | 0.82 | −0.2577 | 3.18 |
| Steel (DW2) | 18.28 | 18.29 | 17.00 | 2.06 | −0.0709 | 2.79 | |
| Plastic (DW3) | 13.89 | 13.70 | 14.00 | 1.52 | 0.5518 | 3.11 | |
| Aluminum (DW4) | 16.61 | 16.75 | 18.00 | 2.66 | −1.3800 | 10.65 | |
| Window screen (DW5) | 20.27 | 20.29 | 20.00 | 0.82 | −0.1015 | 2.89 | |
| Painting (P) | Water paint (P1) | 17.93 | 17.97 | 18.00 | 1.01 | −0.1835 | 2.91 |
| Oil paint (P2) | 16.04 | 16.00 | 16.00 | 1.07 | 0.1382 | 2.87 | |
| Anti-sweating paint (P3) | 23.35 | 23.40 | 23.00 | 0.76 | −0.5356 | 4.04 | |
| Tiling (T) | Wall (T1) | 16.47 | 16.42 | 16.00 | 0.76 | 0.3168 | 3.09 |
| Floor (T2) | 19.48 | 19.50 | 19.00 | 0.80 | −0.1337 | 3.03 | |
| Front door (FD) | Body (FD1) | 20.47 | 20.48 | 20.00 | 0.76 | −0.1286 | 3.03 |
| Doorframe (FD2) | 19.14 | 19.15 | 19.00 | 0.88 | −0.1901 | 3.56 | |
| Components (FD3) | 19.05 | 19.04 | 19.00 | 0.89 | 0.0855 | 3.12 | |
| Furniture (F) | General (F1) | 18.31 | 18.36 | 18.00 | 2.04 | −0.3427 | 4.93 |
| Kitchen (F2) | 18.47 | 18.52 | 18.00 | 1.26 | −0.2442 | 2.89 | |
| Waterproofing (W) | Membrane waterproofing (W1) | 16.57 | 17.00 | 17.00 | 4.69 | −1.2500 | 5.98 |
| Liquid waterproofing cement (W2) | 19.88 | 19.90 | 20.00 | 0.76 | −0.1987 | 3.05 | |
| Sheet waterproofing (W3) | 16.04 | 18.00 | 0.00 | 6.98 | −1.5000 | 4.08 | |
| Caulking (W4) | 20.49 | 20.57 | 21.00 | 1.01 | −0.4000 | 3.09 | |
| Plastering (PL) | - | 20.91 | 21.00 | 21.00 | 1.15 | −0.4571 | 3.48 |
| Carpentry (CA) | - | 18.39 | 18.38 | 18.00 | 1.79 | 0.0089 | 2.89 |
| Repair Time (Year) | Finishing Work | ||||||||||||||||||||||||
|---|---|---|---|---|---|---|---|---|---|---|---|---|---|---|---|---|---|---|---|---|---|---|---|---|---|
| I | DW | P | T | FD | F | W | PL | CA | |||||||||||||||||
| 1 | 2 | 3 | 4 | 1 | 2 | 3 | 4 | 5 | 1 | 2 | 3 | 1 | 2 | 1 | 2 | 3 | 1 | 2 | 1 | 2 | 3 | 4 | |||
| 0 | 6.8 | 0.5 | 3.2 | 13.9 | |||||||||||||||||||||
| 1 | |||||||||||||||||||||||||
| 2 | |||||||||||||||||||||||||
| 3 | |||||||||||||||||||||||||
| 4 | |||||||||||||||||||||||||
| 5 | |||||||||||||||||||||||||
| 6 | |||||||||||||||||||||||||
| 7 | 0.3 | 0.2 | |||||||||||||||||||||||
| 8 | 0.4 | 0.1 | 1.0 | ||||||||||||||||||||||
| 9 | 0.1 | 0.5 | 1.4 | 0.7 | |||||||||||||||||||||
| 10 | 0.1 | 0.1 | 0.5 | 0.1 | 1.4 | 0.6 | |||||||||||||||||||
| 11 | 1.3 | 1.3 | 1.0 | 0.6 | 0.1 | 2.1 | 0.5 | ||||||||||||||||||
| 12 | 6.6 | 0.5 | 0.1 | 7.4 | 1.6 | 0.2 | 3.3 | 0.3 | |||||||||||||||||
| 13 | 0.1 | 17.4 | 2.0 | 0.8 | 21.6 | 3.2 | 0.1 | 0.5 | 4.4 | 1.7 | 0.1 | ||||||||||||||
| 14 | 1.3 | 27.1 | 2.4 | 1.6 | 27.8 | 6.5 | 2.3 | 1.3 | 5.7 | 1.4 | 0.7 | ||||||||||||||
| 15 | 5.4 | 27.3 | 2.6 | 4.6 | 20.0 | 10.5 | 0.2 | 14.9 | 1.7 | 3.4 | 0.4 | 8.0 | 5.0 | 2.6 | |||||||||||
| 16 | 16.4 | 15.4 | 4.6 | 8.1 | 12.0 | 15.0 | 3.0 | 33.2 | 26.7 | 0.1 | 7.1 | 2.6 | 10.0 | 4.9 | 6.9 | ||||||||||
| 17 | 31.3 | 4.2 | 0.2 | 6.0 | 0.3 | 14.3 | 6.3 | 17.7 | 14.9 | 31.1 | 48.4 | 0.2 | 1.2 | 1.0 | 12.8 | 9.7 | 11.3 | 8.4 | 0.1 | 0.3 | 13.3 | ||||
| 18 | 31.2 | 0.5 | 2.6 | 7.8 | 3.0 | 17.6 | 2.7 | 17.0 | 0.4 | 33.3 | 14.7 | 20.1 | 3.6 | 0.1 | 8.4 | 11.0 | 18.3 | 21.7 | 11.4 | 1.0 | 14.3 | 1.2 | 1.2 | 19.8 | |
| 19 | 11.9 | 0.1 | 15.1 | 9.7 | 19.7 | 18.4 | 0.7 | 12.8 | 6.4 | 33.9 | 3.5 | 2.9 | 23.8 | 3.0 | 34.3 | 37.6 | 20.5 | 30.2 | 9.8 | 11.6 | 14.6 | 7.0 | 5.0 | 21.7 | |
| 20 | 1.4 | 38.0 | 11.5 | 45.7 | 15.1 | 0.1 | 7.4 | 31.4 | 13.0 | 0.3 | 0.1 | 0.1 | 46.7 | 24.1 | 41.4 | 36.7 | 17.1 | 24.1 | 7.9 | 42.5 | 10.1 | 21.9 | 15.5 | 17.6 | |
| 21 | 34.7 | 11.9 | 28.0 | 10.8 | 3.7 | 43.6 | 1.3 | 0.6 | 23.2 | 48.7 | 13.0 | 12.1 | 10.8 | 9.4 | 6.1 | 38.5 | 9.5 | 37.9 | 30.5 | 10.8 | |||||
| 22 | 9.0 | 10.6 | 3.3 | 6.0 | 1.5 | 16.9 | 4.9 | 2.4 | 22.4 | 1.4 | 1.5 | 5.1 | 1.3 | 4.1 | 6.1 | 6.2 | 27.2 | 32.2 | 4.7 | ||||||
| 23 | 0.4 | 9.4 | 0.0 | 2.3 | 0.5 | 1.3 | 25.6 | 1.7 | 0.1 | 2.0 | 4.2 | 0.1 | 4.3 | 4.6 | 13.6 | 1.7 | |||||||||
| 24 | 7.0 | 0.4 | 0.3 | 52.2 | 0.6 | 2.9 | 0.9 | 0.1 | 1.6 | 0.4 | |||||||||||||||
| 25 | 3.6 | 0.2 | 16.1 | 0.1 | 1.1 | 1.4 | 0.1 | ||||||||||||||||||
| 26 | 1.4 | 0.6 | 0.6 | 1.2 | |||||||||||||||||||||
Publisher’s Note: MDPI stays neutral with regard to jurisdictional claims in published maps and institutional affiliations. |
© 2021 by the authors. Licensee MDPI, Basel, Switzerland. This article is an open access article distributed under the terms and conditions of the Creative Commons Attribution (CC BY) license (https://creativecommons.org/licenses/by/4.0/).
Share and Cite
Cho, Y.; Lee, S.; Lee, J.; Kim, J. Analysis of the Repair Time of Finishing Works Using a Probabilistic Approach for Efficient Residential Buildings Maintenance Strategies. Sustainability 2021, 13, 12443. https://doi.org/10.3390/su132212443
Cho Y, Lee S, Lee J, Kim J. Analysis of the Repair Time of Finishing Works Using a Probabilistic Approach for Efficient Residential Buildings Maintenance Strategies. Sustainability. 2021; 13(22):12443. https://doi.org/10.3390/su132212443
Chicago/Turabian StyleCho, Youngduk, Sanghyo Lee, Joosung Lee, and Jaejun Kim. 2021. "Analysis of the Repair Time of Finishing Works Using a Probabilistic Approach for Efficient Residential Buildings Maintenance Strategies" Sustainability 13, no. 22: 12443. https://doi.org/10.3390/su132212443