
Qualitative Analysis of Risks Affecting the Delivery of Land Surveying Project Activities


Civil Engineering Department, College of Engineering, Taif University, P.O. Box 11099, Taif 21944, Saudi Arabia
*
Author to whom correspondence should be addressed.
Sustainability 2021, 13(22), 12645; https://doi.org/10.3390/su132212645
Submission received: 24 October 2021
/
Revised: 6 November 2021
/
Accepted: 12 November 2021
/
Published: 16 November 2021
(This article belongs to the Special Issue Buildings and Infrastructures Management: Models Strategies and Evaluation Tools)
Abstract
:Land surveying projects (LSPs) suffer from the effects of many risk factors on the time and accuracy of these projects. Using field surveys, the main objective of this study was identifying the major activities and risk factors associated with LSPs’ execution, as well as assessing and analyzing the effects of the risk factors on the LSPs’ time and accuracy. Furthermore, the study aimed to classify and determine the responsibility of each risk factor and evaluate the responsibilities. Four main activities were categorized and presented, including reconnaissance works, planning works, data collection works, and data adjustment works. Moreover, forty-three risk factors that control the main activities and affect the time and accuracy of LSPs were recognized. The probabilities of occurrences for the risk factors and impacts on the time and accuracy of LSPs were determined as well as their combined effects. Key risk factors that had high threats on LSPs and affect time and accuracy were highlighted as the most critical risk factors. Many correlations were determined among risk factors affecting LSPs’ activity groups and their various effects on time and accuracy. The responsibilities of the surveying crew (chief, surveyor, assistance, office engineer) for each risk factors were correspondingly defined. The results showed that “Data collection works” is considered the riskiest activity group in LSPs and most of the key risk factors belonged to this group. Around 25% of the LSPs face time overrun and do not meet the required specifications. On the other hand, the surveyor was found to be responsible for most of the risk factors and the office engineer was signified by the lowest responsibility, while the responsibilities for most risk factors were single responsibility and few were shared by only dual responsibility.
1. Introduction
Land surveying is essential and vital work for the design and construction processes in all civil engineering projects (CEPs). Surveying works set up a basic outline of control or positioning CEPs, used in construction to establish grades, axes, and fixed points. The surveying crew participates in many tasks in CEPs such as project pre-studies; determination of the boundaries of the project area and preparing a map for design purposes; the processes of designing, direct implementation, maintenance, and use; and finally, demolition of building structures [1].
The surveying works are not completed by ending the construction phase. The surveyor introduces continuous monitoring if displacements, cracks, or settlement occur on a structure to prevent possible construction disasters, and he is also obliged to assess the conformity of the erected building structure with the design. It can be concluded that, without executing surveying works with high accuracy, none of the CEPs can be executed correctly.
As all construction projects, LSPs face the effects of many risks that affect the project objectives. Moreover, LSPs have more different characteristics than other CEPs, which may increase the effects of risks on their objectives such as the project purpose, type, size, location, site (accessibility, challenges, evictions, and obstacles), terrain nature, and weather conditions [2].
In the area of risk management in CEPs, there are some factors, items, and features that should be taken into account and properly identified and quantified in LSPs’ objectives. Time and accuracy are considered the most important and vital objectives in LSPs. The accuracy of surveying measurements plays a key role in LSPs and this objective is considered the core of these projects. Furthermore, any delay in a time project makes several problems such as increasing costs and causing payments for delay penalties. Land surveyors are held to high standards, as errors in their work not meeting specifications or achieving proposed project time may result in lost construction costs, faulty construction, or potential safety issues.
From the perspective of project management knowledge, the chief party (project manager) in land surveying should know and properly manage various resources (human, financial, equipment, documentary information, and time) at their disposal and overcome challenges, obstacles, and barriers in all of the surveying activities [3]. Accordingly, they should aim to achieve maximum efficiency in the executed work (satisfying specifications) with minimum resources and overall cost, in the minimum amount of time (i.e., achieves constraints on time and accuracy). In other words, the surveying team should complete its work on time, with high quality results.
The previously mentioned reasons concern the importance and complexity of executing the activities of LSPs in all CEPs and the presence of many risks affecting these projects and, correspondingly, the high importance of meeting specifications with the objective of accuracy and achieving the proposed project time in LSPs. Furthermore, no studies have been conducted to analyze or identify risks in LSPs. Therefore, the research efforts in the field of LSPs’ management need to be developed to include risk analysis, thus confirming that LSPs’ leaders are adequately educated and ready to satisfy the surveying projects’ requirements. Furthermore, these causes show the necessity for risk analysis and management for LSPs’ activities.
Accordingly, the main purpose of this research was identifying the main activities associated with LSPs as well as exploring the various components of risk factors that affect the time and accuracy of executing these projects in order to rank and show the key risk factors. Additional objectives presented in this research can be briefed as follows:
- (a)
- Examining the agreement between the contractors and consultants for the assessment of the risk factors’ probabilities and impacts on both time and accuracy in land surveying projects.
- (b)
- Presenting a general overview for the risk factors’ probabilities and their impacts on the time and accuracy in land surveying projects to determine the most critical of the risk factors. It is essential to generate awareness of these factors and their probability of occurrence, as well as to examine the level to which they have high impacts on the project objectives.
- (c)
- Studying and comparing the impacts and weights of each activity on the time and accuracy in land surveying projects, so that efforts can be completed to control these reasons, share practical results, and examine their relative importance.
- (d)
- Determining who is responsible for each risk factor and categorizing them into groups based on the responsibility, as well as evaluating these responsibility groups.
In addition to the abstract, an introduction covering the problem statement, objectives, and methodology, this paper included a review of risks, risk analysis, and risks in construction projects including many applications of risk management and modeling in CEPs. Furthermore, activities of LSPs were identified, as well as forty-three risk factors with their characteristics. The analysis of the results included evaluating the time and accuracy of the LSPs, and a qualitative analysis of risk factors’ effects, in addition to defining and ranking the key risk factors and risk groups in LSPs. Finally, the results included percentages of responsibility for each risk factor and for each responsibility in each activity group, as well as percentages of responsibility in each group and in all factors.
2. Risk Overview
Project risk is an uncertain incident or situation. It can cause a positive or negative influence on the project’s objectives [4]. Several projects’ mangers try to avoid the negative impacts of risk factors on their projects to reach their time, cost, and quality goals [5,6]. Thus, risk factors should be recognized and evaluated [7]. The identification of risk factors is the first and most important step of the risk management process [8]. In this process, all major causes of factors impacting a certain project’s objective should be identified. These risks have weights that can be calculated prior to estimating project risk level, which can be calculated as the total of the weighted risk impacts of risk factors [9]. The magnitude of risk can be defined by multiplying the relative effect with the relative possibility of the cause of every risk occurring determined within the risk breakdown structure. The sum of these values can be used to determine an overall risk level for a project [10]. Risk factors that affect many project objectives are defined as the most critical risk factors and require more awareness [11]. On the other hand, management of risks and uncertainties can be completed by a systematic procedure during the estimation phase to decrease their negative impacts on the time and cost of the project. The aim of risk management is the identification of the sources of risk and uncertainty. It also involves the estimation of risk impact and the development of a suitable management response [12].
2.1. Risk Analysis
The majority of risk analysis difficulties have a combination of qualitative and quantitative data [13]. The total risk can be calculated through qualitative analysis, which depends on the subjective judgment of a skilled person. Qualitative assessment for the identified risks can be utilized to define both their probability and their impact on project goals. As a result of qualitative risk analysis, the risks can be prioritized for more attention [14]. In contrast, quantitative assessment for the risks in project management can be completed through changing the effect of risk on a project into statistical numbers. These statistical numbers are regularly utilized to compute the cost and time contingencies of a project. Thus, it can be seen that quantitative assessment can be done over a simultaneous estimation of the effect of all identified and quantified risks [10].
2.2. Risk Analysis in Construction Projects
There are many case studies investigating different numbers of risk factors affecting the cost and time objectives of construction projects [15,16]. The risk assessment process usually involves an assessment of the likelihood or probability of the risk and its impacts on project objectives. Rezakhani (2012) [11] stated that the assessment of the level of risk is a complicated topic with uncertainty and vagueness. The project definition phase includes very critical steps that comprise the evaluation and analysis of the risks of a project. It also involves planning for risk management.
Several studies in recent years investigated the topic of risk identification and assessment in construction projects. Zhou et al. (2020) [17] investigated risks in the construction field and proposed a new system to manage and assess these risks. The proposed system combined the quality and risk management systems, incorporating a work field observing information, design data, and environmental records. Risks in the construction process of international rail projects were investigated and assessed using the principle of maximum proximity and Monte Carlo simulation techniques for estimating the costs of these projects, including risk assessment for the construction of urban rail transit projects [18,19].
Other researchers introduced and developed models and approaches in order to manage or assess risks especially related to safety and workers’ issues in the construction field. Several risk factors related to the falls in high-voltage transmission towers were studied [20]. The effectiveness of virtual reality in safety studies on construction workers’ fall risk attitude was examined [21]. A framework concerns the data-driven approach to offering effective safety advance strategies based on risk networks in construction was delivered in relation to safety and workers’ problems in construction [22]. Moreover, the performance metrics are deliberated at network level and critical risk determining metrics at node level are measured. In addition, a hybrid fuzzy-based occupational risk assessment model was developed for the purpose of identifying, analyzing, and evaluating the risks facing the construction workers [23]. The implementation of this model caused an improvement in the safety and health of the involved workers.
Jebelli et al. (2016) [24] investigated the fall risk of construction laborers in stationary postures. Sanni-Anibire et al. (2020) [25] presented a new risk assessment technique for creating risks scores and weights of various events in construction projects, helping to improve the safety performance. Furthermore, a qualitative approach is introduced for investigating the attitudes and practices of construction workers towards employing individual protective equipment [26]. Convenient recommendations to reduce the risk-taking behaviors of construction staff were presented [27]. These recommendations involved satisfying the expectations of construction staffs and enhancing benefits, for example, work effectiveness, convenience, safety training, and physical comfort. On the other hand, A Construction Worker Risk Perception Scale was established to include scales of worker risk perception, for instance, probability and severity [28].
Based on risk analysis, many researchers supported various decisions in construction projects as well as using risk management in solving many construction problems [10,29]. There is a considerable positive relationship between construction risk management and regulations [30]. A new method for evaluating construction projects was presented for supporting the choice of minimally risky projects based on risk analysis, taking into account the cost and time overruns criteria, as well as market conditions and financial resources [31]. A systemic decision-support approach was offered for metro construction projects, focusing on safety risk analysis and uncertainty and based on integrating fuzzy extensive evaluation method and a Bayesian network using three aspects including risk probability, risk loss, and risk controllability [32]. A methodology was suggested to appropriately take supply disruption risk into account through modelling a new algorithm to find the needed probability distributions of disruption delays [33]. The results of this study declared the importance of the identified risks in order to take optimal judgments for various construction policies.
A weighting function in construction risk assessment was proposed for offering better measurement of the cognitive errors by adjusting the over- and under-estimation [34]. A thorough method was suggested considering supply chain risk management for construction projects [35]. In these projects, grounded theory, fuzzy cognitive mapping, and grey relational analysis were employed for assisting in classifying and identifying risk reduction scenarios.
Risks in small and medium enterprises (SMEs) in the construction sector were also studied, focusing on the occupational risk-prevention training [36]. The triangular intuitionistic fuzzy-EDM model was proposed for enhancing the applicability of time performance indices and the process of forecasting under unknown conditions. A new approach of risk assessment, changing probabilities to control levels, was also introduced for providing simple implementation and more precise risk scores [37]. This could lead to a healthier, secure, and more suitable jobsite for the construction of small and medium enterprises.
Lastly, it is worth mentioning that there is a use for new techniques and models based on fuzzy set theory to quantify the risks’ effect on many objectives in construction projects, such as cost and time overruns [38], and for quantifying the effects on greening existing buildings [39] in addition to estimating the risk incidents during tunnel construction operations [15].
3. Research Methodology
The research methodology of this study was applied through three stages. In the first one, an inclusive literature review is prepared as well as semi structured interviews to professionals in the field of LSPs for the purpose of identifying the main activities in these projects in addition to identifying the risk factors affecting these activities. A list for the main activities and risks affecting them was obtained as a result of this stage.
In the second stage, brainstorming sessions were conducted to filter and arrange the main data concerning the risk factors affecting the main activities. The output of this stage is a questionnaire form main section concerning the risk factors affecting time and accuracy objectives. This stage is followed by designing the questionnaire including other sections related to respondent’s data and data concerning time and accuracy characteristics of land surveying projects. The questionnaires were distributed to professionals in designing and executing LSPs, and the data collected from questionnaires feedback were fully analyzed. An agreement test was conducted to confirm that the information collected has a high level of agreement among partners. Finally, a brainstorming session was conducted in the third stage to rate and evaluate the responsibility of each risk factor. A flowchart summarizes the methodology stages and outputs in each stage, as presented in Figure 1.
4. LSPs’ Activity Groups
Land surveying has always required four consecutive activities. The first main activity group is “Reconnaissance works”, which explores and evaluates many issues concerning project sites such as the overall layout, contacts with landowners, barriers of site accessibility, and lines of occupation [40]. The second main activity group is “Planning works”, which is used for selecting techniques, suitable instruments, type of survey method, and surveying crew according to the purpose and the accuracy requirements. The third main activity group is “Data collection works”, which is utilized for gathering data about the land, which involves choosing and marking points; making description sketches; measuring distances, angles, and coordinates for points; and recording these observations; placing stakes at designated points measuring the distance between survey points; marks measuring points with keel or stakes; placing stakes at designated points; obtaining data pertaining to angles, elevations and control points, map creation, or other purposes, such as notes compiling, data recording, and sketches of attained and performed work. The fourth main activity group is “Data adjustment works”, which involves analyzing; filtering; verifying the accuracy of field survey data; and preparing plots, maps, and reports. Surveying works comprise both fieldwork and office work. The first and the third groups are fieldworks (outdoor work), while the other groups are considered office work (indoor work).
5. Data Collection, Analysis, and Discussion
The questionnaires are considered a suitable tool that can be used in the case of collecting new data [41]. This tool is well-familiar and commonly used in construction projects management studies [42,43]. In some circumstances, the required data can be completed by a limited number of questionnaires [44]. In this research, the latest version of the questionnaire forms was distributed among 140 specialists in many countries who had adequate experience in LSPs. The professionals were asked to reply related to the probability of occurrences and weights associated with every risk factor based on their practice experience. The respondents were divided into two categories: contractors and consultants, and the whole sum of respondents was 89. Of the 89 returned accepted questionnaires, 54 out of 76 questionnaires were obtained from contractors and 35 out of 64 from consultants, as shown in Table 1. The response rates were about 71% and 54% from contractors and consultants, respectively, with an average response rate of 63.5%. Further, 60.7% of the questionnaires were done by contractors and 39.3% were done by consultants.
5.1. Field Survey Design
LSPs such as most construction projects suffer from the shortage of documented data related to the probability of occurrence and impacts on LSPs’ objectives (time and accuracy). Thus, a questionnaire was constructed based upon available data from past experiences to find information on the probability and impacts of the risk factors recognized by experts on LSPs. Some methods were applied to convey the questionnaires to potential respondents. Direct distribution was utilized in the majority of the questionnaire to encourage respondents and to certify the accurateness of responses and increase the response rate [45].
In order to present the questionnaire in an organized way, a comprehensive multiple-choice question was completed and verified prior to being directed to respondents. The questionnaire was separated into three sectors (A, B, and C). Sector (A) covers broad questions related to the respondents’ information such as position and experiences. Sector (B) denotes the key section of collected information to attain data on the probability of occurrence for each risk factor and its impact on the time and the accuracy of the land surveying projects from the reality of the participant experience. The proposed forty-three risk factors were comprised as presented in Table 2. Lastly, Sector (C) pursued information on the land surveying projects’ time delay and satisfaction of accuracy levels of these projects on which the respondents have worked.
5.2. Experiences of Respondents
The degree of consistency and strength of the data provided can be measured by number of respondents’ years of experience. In this research, about 28% of the specialists who responded had more than twenty years of experience in surveying projects in many countries, which subsequently improved the reliability of the collected data. Besides, to confirm that the field survey results were reliable, the answers of any respondents with less than five years of experiences were not taken into account. As presented in Figure 2, 32% of the respondents had 15–20 years of relevant experience, 21% of the respondents had between 10 and 15 years of relevant experience, and the remaining percentage of the respondents (19%) had 5–10 years of relevant experience. The average relevant experience of all respondents was 16.4 years; thus, the opinions are believed to reflect the real situation in this field.
5.3. Agreement Analysis
Separating the results for each of the two applicants’ groups (contractors and consultants) is not a logical job. It will be correct to show the results as an average of the findings. In order to take the advantage of this step, a correlation test is introduced to prove the agreement between those two groups through applying the Spearman’s correlation coefficient. This statistical test measures the relationship between any continuous or ordinal variables to evaluate direction and strength among them. This test has a noticeable benefit of no need for the hypothesis of normality or the supposition of variance homogeneity. Comparisons between medians and means can be carried out and, if the data represent two or less outliers, their effect can be cancelled. The Spearman test was conducted in this research on the responses of the two kinds of applicants (contractors and consultants) to determine whether or not the rankings for the probability of occurrence and the impacts of risk factors on the time and the accuracy of executing LSPs are in strong agreement. The value of rank correlation coefficient (R) varies from −1 to +1. In the case of R = +1, this represents a whole agreement in the order of the ranks and the ranks are in the same direction of increase. In the case of R = −1, this refers to a whole agreement and the priorities are in a reverse direction. If R = 0, then there is no relationship. Regarding Figure 3, all values of R are positive and larger than 0.5, which indicate that the probability of occurrence represents the highest level of agreement, while the impact on time represents the lowest one. However, these high positive values indicate a high agreement degree between the two applicants on the level of probability of occurrence and the impacts on time and accuracy. Consequently, the analysis will be conducted using average data from the two groups of respondents.
5.4. Evaluation of Time of LSPs
The experts were asked in the last part of the questionnaire to answer some data concerning the time weight of the four risk categories, also delaying time and meeting accuracy associated with LSPs. The expected increase in the total time as well as achieving specification to represent accuracy according to the impact of the risk factors on the identified activities is determined. The average percentage weight of time for activity group (A): (Reconnaissance works) is very small and does not exceed 2%. This may be due to the limited number of risk factors under this group and small values for their indices. Activity group (B): (Planning works), which contains 10 factors, represented only by 5% of the project time. On the other hand, activity group (C): (Data collection works), which was affected by 24 factors, represents 83% of the total time. Finally, activity group (D): (Data adjustment works), represented by 10% of the total time, is affected by 7 factors. The values in Figure 4 represent the common and moderate percentages of the project period for each group, but they vary from project to another based on the size, scope, and type of land surveying projects. The percentage of predictable risk factors affecting an activity can determine the time weight of the activity [8].
It is also noticeable that there is a perfect fit between the number of risk factors affecting each group and the time represented by the same group. For example, Group (C), which is affected by 24 risk factor and represented by about 55% of all factors, consumes 83% from total time.
To measure the expected increase in project time in LSPs, the respondents were asked to respond from their experiences and the projects on which they have worked. As shown in Figure 5, regarding a pre-established procedure in all stages of the surveying works in CEPs, 74% from LSPs face less than 5% delays in project time, while the LSPs that suffer from a high percentage of delay (more than 20%) do not exceed 6% from all LSPs.
5.5. Evaluation of Accuracy of LSPs
Applying a predetermined procedure in all stages of the surveying works reduces the effect of mistakes and blunders and eliminates most instrumental errors. As presented in Figure 6, a high percentage value (about 76%) of projects satisfy specifications and meet accuracy requirements. A small percentage value (about 18%) of projects satisfy near specifications that occur in a special circumstance like bad weather conditions or moderate experience for surveying crew, while a very low percentage value (about 6%) of projects do not satisfy the requirements of accuracy, which occurs when the surveying crew has poor experience and does not meet specifications and precautions.
6. Qualitative Analysis for Risk Factors Effects on LSPs
Five risk levels were proposed to assess the collected data of the identified risk factors in the questionnaire. These data were in the form of five labels as follows: very high, high, medium, low, and very low. The probability of the occurrence of a risk factor and its level of impact on project time and accuracy were represented in two data categories as attained from the returned questionnaires. The analysis of risk factors was investigated through three indices, namely, (1) Probability Index (PI), (2) Impact Index for Time (IIT), and (3) Impact Index for Accuracy (IIA). These indices were used to assess risk factors based on their probability of occurrence, impact on the project time, and impact on the project accuracy as recognized by the participants. A description of these indices can be explored through the following equations:
where
- PI represents the probability index for a certain risk factor;
- Pi represents the probability weight;
- n represents the number of participants who responded;
- EFi represents the experience factor: (EF1 = 1 for 5–10 years, EF2 = 1.6 for
- 10–15 years, EF3 = 2.3 for 15–20 years, and EF4 = 3 for above 20 years);
- IIT represents the impact index for time;
- Iti represents the impact weight for time;
- IIA represents the impact index for accuracy;
- Iai represents the impact weight for accuracy;
- Pi, Iit, and Iia represent constants expressing the weight (0.1, 0.3, 0.5, 0.7, or 0.9) given to the ith response.
The respondents were requested to answer three points for each risk. For example, to determine the probability weight Pi, the respondents were asked to judge the probability level of risk occurrence by choosing one of the five labels, namely, very low probability, low probability, moderate probability, high probability, and very high probability [43]. The same methodology was applied to obtain IIT and IIA. These equations were used to calculate the three indices (PI, IIT, and IIA) for all identified risk factors.
To determine the previous indices, the labels for Pi, Iti, and Iai (very low, low, moderate, high, and very high) were changed into numerical scales as follows: ‘very low’ = 0.1, ‘low’ = 0.3, ‘moderate’ = 0.5, ‘high’ = 0.7, and ‘very high’ = 0 [8,46].
A certain risk factor may occur frequently while its impact may be high, and vice versa. So, it is important to calculate a combined effect of risks using the Risk Factor Index for Time (RFIT) and Risk Factor Index for Accuracy (RFIA) as follows:
RFIT = PI ∗ IIT
RFIA = PI ∗ IIA
The risk factor indices for time and accuracy were calculated for all identified risks using Equations (4) and (5) and the results are presented in Figure 7. Although, the way to determine RFIT and RFIA may disregard the risks with a low probability of occurrence and a high impact on project time and accuracy.
6.1. Risk Indices’ Correlations
A Spearman test is also conducted to show the direction and strength of the relationship among all risk factors’ indices. Table 3 summarizes the values of correlation coefficient between each of the two indices. The values between PI and both IIT and IIA are equal to −0.445 and −0.297 respectively. The minus sign refers to the reverse direction relation, which is specially with time. On the other hand, relation between IIT and IIA is positive (0.129), while this relation increases between RFIT and RFIA with a coefficient of 0.388.
6.2. Key Risk Factors
Qualitative analysis for risks includes highlighting and prioritizing the high-level factors in the study. Table 4 declares the top ten key risk factors that control the time and accuracy of LSPs. It is clear that risk factor No. 23 (Taking measurements at inappropriate times( is ordered first in the case of time, while it does not appear in the top ten related to accuracy, while risk factor No. 16 (Transferring the instrument from control point to another one) appears to be first in accuracy, while it is ordered sixth in time. Four risk factors occupied advanced ranking and appear in both time and accuracy (factors No. 13, 15, 16, and 17). Regarding risk activity groups, as expected, activity group (C) represents the highest group, which has six factors in time and eight in accuracy, which appear in Table 4. On the other hand, activity group (A) does not have any risk factors in the top ten risk factors, and activity group (D) has no factors in the top ten risk factors in the case of time and has one factor in the case of accuracy. Concerning Figure 8, it is clear that the values of RFIA are higher than their counterparts in time (RFIT).
6.3. Analysis Based on Risk Groups Effects
For comparing the risks’ effects on the risk activities groups, the boxplot was conducted on the obtained data. Using the boxplot that can display the middle, spread, range, and any blunders can provide a rapid visual overview [47]. Usually, the plot of the box shows 50% of the information in the box. While the upper side of the box indicates the 75th percentile, whereas the lower side indicates the 25th percentile. A straight line implies the median in the middle of the box. If the data do not contain outliers, the ends for lines shows the minimum and maximum values. If Q1 and Q3 represent the 25th percentile and the 75th percentile, respectively, and the interquartile range (IQR) represents the difference between Q3 and Q1, then the value that is under Q1 − 1.5 (IQR) or above Q3 + 1.5 (IQR) can be measured as an outlier. The outliers are symbolized on the display with a point above or below the range.
In this study, a boxplot analysis is presented in Figure 9 and Figure 10 for comparing and summarizing the data sets for RFIT and RFIA magnitudes in the case of risk activity groups and the case of all risk factors. RFIT and RFIA values were shown in the boxplot and arranged side-by-side in the two mentioned cases.
Regarding Figure 9, the widest range of RFIT and RFIA values is for activity group (B), although it contains 10 factors. On the other hand, activity group (C), which contains the large number of factors (24 factors), does not represent the widest range, especially in case the of accuracy. Furthermore, the only group that contains outliers is also activity group (C), which contains three factors in the case of accuracy (factors No. 16, 17, and 33). The highest values also belong to activity group (C) in both time and accuracy. The results of activity group (A) can be neglected owing to the limited numbers of factors (two only), but the values are less than other activity groups. In the case of comparing cases of time and accuracy regarding risk groups, it can be clarified that activity groups (B) and (C) are close in their values, except for outliers’ factors.
It is clear that, from Figure 10 when comparing FRIT and FRIA based on all factors, the same high outliers appear, belonging to activity group (C) (factors No. 16, 17, and 33). On the other hand, new outliers appear in the bottom. The range in the case of time is higher than the range in the case of accuracy.
Table 5 declares the statistical data for RFIT and RFIA values for each group. It is obvious that, for all factors, the standard deviation and mean in RFIA are higher than those in RFIT by about 50% and 24%, respectively. On the other hand, it can be seen that, for each activity group separately, the mean value in the case of RFIA in activity group (A) is smaller than that of RFIT by about 80%, while the mean values of RFIA are higher than RFIT in Groups B, C, and D the by about 10%, 32%, and 44% respectively.
6.3.1. The Party Chief
The party chief leads the work activities of a survey party day-to-day. The party chief is responsible for ensuring that the crew performs their tasks perfectly and safely according to the presented plan. Moreover, they confirm the accuracy of the crew’s performance, measures precise observations, and supports solving work challenges, conducts documentation for all project data and electronic files, and finally follows achieving the project scope.
6.3.2. Professional Land Surveyor
The professional land surveyor uses basics of mathematics (geometry and trigonometry), physics, and engineering [48]. They should be independent, stable, persistent, practical, and thrifty, with a distinct personality. Most of his tasks include hard field works owing to many difficulties in the site, while he conducts little tasks indoors.
6.3.3. The Assistant Surveyor
The assistant surveyor is also called the survey chainman, stakeholder, or prism man. For assisting the surveying crew, they can perform the following duties: holding the level rod or reflector at designated points, calling out reading or writing it in a notebook, measuring distance between survey stations, sites staking at designated stations and fixing them into the ground, compiling sketches and recording data, and executing other tasks as ordered by the party chief.
6.3.4. Office Engineer
An office engineer is responsible for filtering, verifying the accuracy and analyzing field survey data, preparing plots, maps, and reports, as well as presenting information to regulatory agencies.
6.4. Analysis Based on Responsibility
One of the main steps for mitigating the effect of risks on the project activities is defining the responsibility of risks. As explained before, there are four responsible for the risk factors affecting LSPs. A brainstorming session was conducted in the last phase as explained in the methodology with five professionals to arrange and rate this responsibility. The results of this session were summarized and the percentage of responsibility in each risk factor is determined in Table 6.
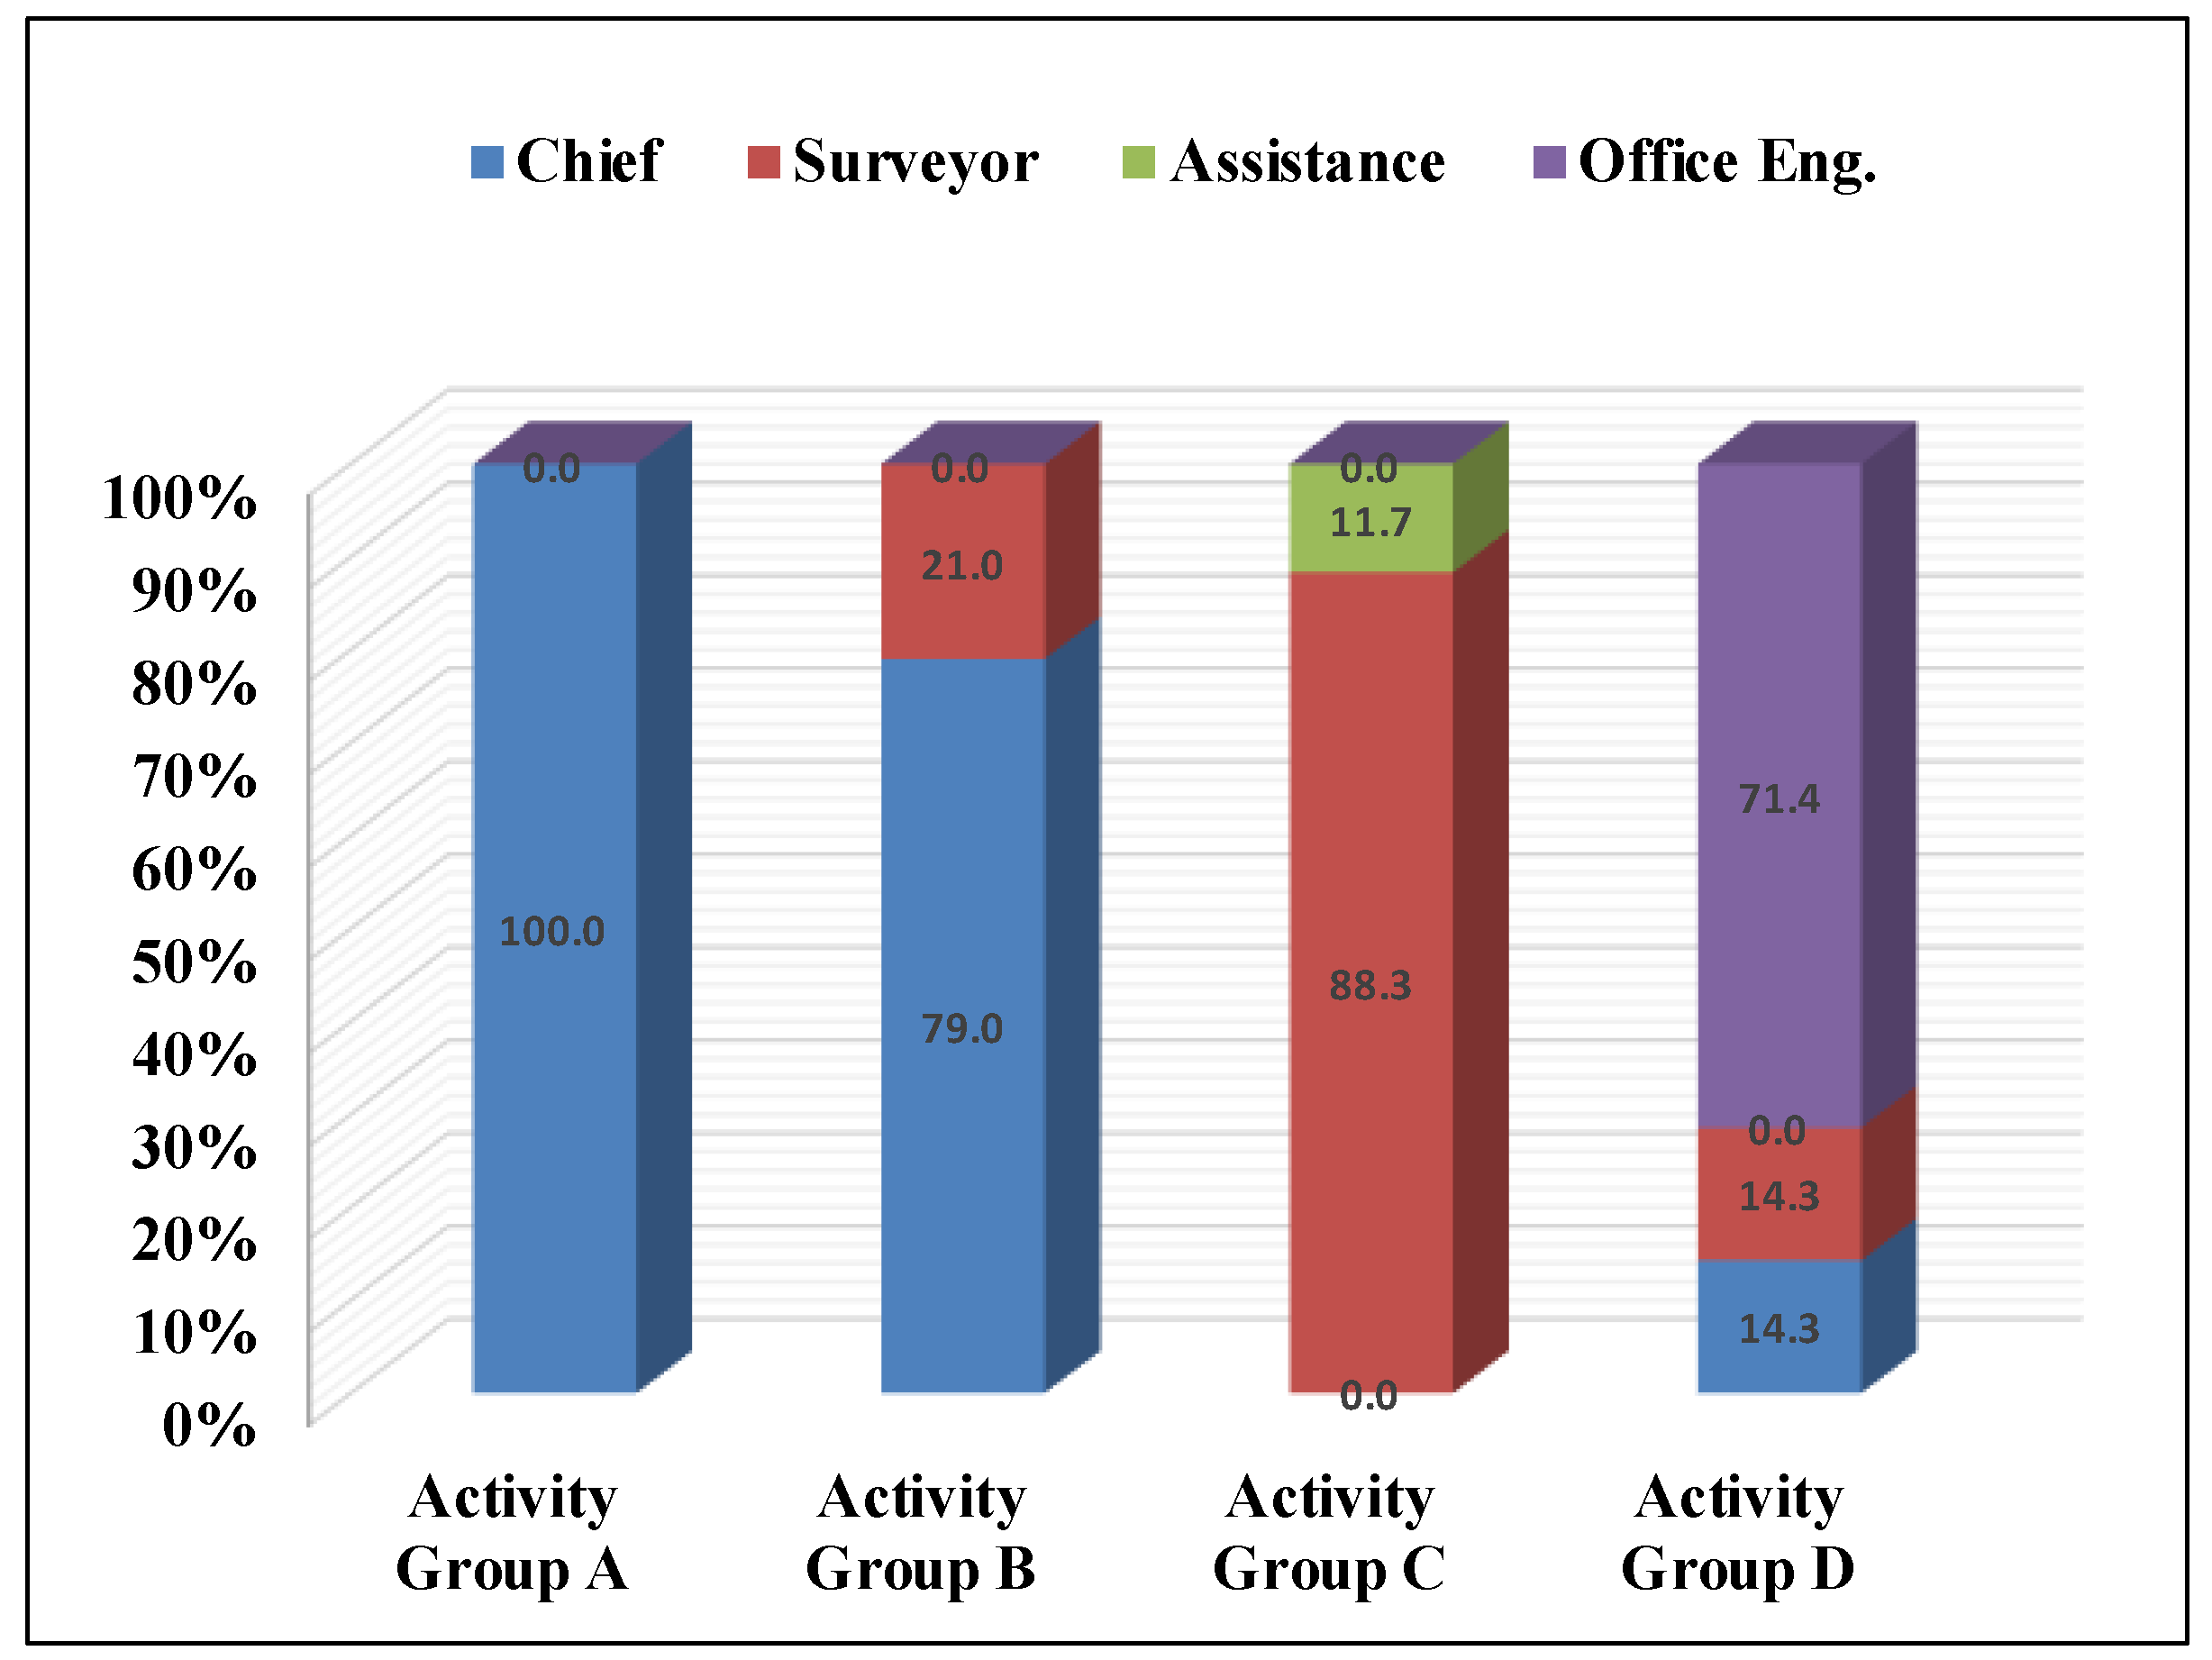
Figure 11 and Table 7 show the percentage on each responsibility in each activity group and summarize the percentage of each responsible in each group as well as the percentage of each responsible in all risk factors. It can be concluded that the surveyor is the responsible for most of risk factors (31), with a percent of 55.4%, representing 88.3% from responsibility in the activity group (C), which is considered the most risky group. However, the chief has no responsibility in activity group (C), but he is ranked in the second order in responsibility and represents 23.2% of total responsibility. Most of his responsibility appears in activity group (B). It is also noticeable that the assistance appears only in activity group (C), with a percent 11.7 and total 12.5%, and office engineer appears only in activity group (D), with a percent 71.4 and total 8.9. Most of the responsibilities for the risk factors are single and few are shared by only two responsible.
7. Conclusions
Based on the support of a practical survey, the principal activities of LSPs in CEPs were identified. Furthermore, this study characterized the risk factors that affect the time and accuracy of the identified activities with the target of focusing on the most important risks that can affect the execution of LSPs. Forty-three risk factors were grouped under four main execution activities, including reconnaissance, planning, data collection, and data adjustment works. The identified risk factors were qualitatively analyzed and assessed. The distribution of data for the different activities showed that the studied risk factors for the LSPs in this study were convincing and could be used for conducting a risk management plan in forthcoming LSPs. A brief for the specific conclusions can be summarized as follows:
- Many agreements tests were conducted based on risk factors ranking by consultants and contractors through three developed indices corresponding to the possibility of occurrence, the influence on time, and the influence on accuracy. The weight of respondents’ experiences was considered through calculations.
- There is a positive correlation between the number of risk factors affecting each activity group and the time weight represented by the same group. For example, in activity group (C), which is affected by 24 risk factors and represented by about 55% of all factors, it consumes 83% from total time.
- About 74% of the LSPs meet the proposed time or faces minimum time delay, while about 76% of these projects satisfy specifications and meet high accuracy.
- For risk factors’ assessment, two severity indices (RFIT and RFIA) were developed and determined by combining effects of the possibility of occurrence with the influences of risk factors on time and accuracy. The values of RFIA were found to be higher than their counterparts in RFIT.
- Not all risk factors appear together in first top ten ranked risk factors related to time and accuracy. For example, the risk factor arranged first in the case of time does not appear in the first top ten in the case of accuracy.
- Most of the key risk factors that affect both time and accuracy were located in activity group (C). For example, risk factor No. 16, concerning the transfer of the instrument and sights from one control point to another, was considered the most vital factor that affects both time and accuracy. On the other hand, risk factor No. 23, which concerns taking measurements at inappropriate times, is ordered first in the case of time, while it does not appear in accuracy first top ten.
- The standard deviation and mean values for RFIA in case of all risk factors are greater than in the case of RFIT values, while the mean values of RFIA are higher than those for RFIT in all activity groups except activity group (A).
- The boxplot analysis displayed that the values of developed indices for time and accuracy for activity group (A) were adjacent, whereas the values for activity group (C) presented a convergence. The widest range of RFIT and RFIA values was found for activity group (B). Risk factors occupied outliers, and appeared only in activity group (C). It can be clarified that activity groups (B) and (C) are close in their values, except outliers’ factors. Based on all factors, the range in the case of time is higher than that of accuracy.
- The surveyor has the highest responsibility for most of risk factors, followed by the chief and assistant surveyor, while the office engineer is denoted the lowest responsibility. Most of the responsibilities for the risk factors are single and few are shared by only two responsibilities.
- Although activity group (C) is considered the riskiest group, there is no responsibility for the chief in that group, while all responsibilities for the assistance appear in this group.
Author Contributions
Conceptualization, U.I., M.A. and I.S.; methodology, U.I.; formal analysis, U.I., M.A. and I.S.; investigation, U.I., M.A. and I.S.; resources, U.I. and I.S.; data curation, U.I., M.A. and I.S.; writing—original draft preparation, U.I., M.A. and I.S.; writing—review and editing, U.I., and I.S.; project administration, U.I., M.A. and I.S.; funding acquisition, M.A. All authors have read and agreed to the published version of the manuscript.
Funding
This study was funded by Taif University, Researchers Support Project Number (TURSP-2020/324) Taif University, Taif, Saudi Arabia.
Institutional Review Board Statement
Not Applicable.
Informed Consent Statement
Not applicable.
Data Availability Statement
All relevant data are included within the manuscript.
Acknowledgments
The authors would like to acknowledge Taif University Researchers Supporting Project number (TURSP-2020/324), Taif University, Taif, Saudi Arabia.
Conflicts of Interest
The authors declare no conflict of interest.
References
- Puniach, E.; Kwartnik-Pruc, A. The Use of Laser Scanning and Unmanned Aerial Vehicles in Construction Surveying in the Light of Legal Regulations in Poland. J. Appl. Eng. Sci. 2018, 8, 79–88. [Google Scholar] [CrossRef]
- Division of Plats and Surveys, Maryland State Highway Administration. Survey Field Procedures Manual; Division of Plats and Surveys, Maryland State Highway Administration: Baltimore, MD, USA, 2001.
- Ana-Cornelia, B.; Gheorghe, B.; Silviu, C.T. Some Elements of Project Management Using Dedicated SOftware in the Land Surveying Works. In Proceedings of the International Multidisciplinary Scientific GeoConference: SGEM, Albena, Bulgaria, 17–23 June 2012; Volume 2, p. 1147. [Google Scholar]
- Abd El-Karim, M.S.B.A.; Mosa El Nawawy, O.A.; Abdel-Alim, A.M. Identification and assessment of risk factors affecting construction projects. HBRC J. 2017, 13, 202–216. [Google Scholar] [CrossRef]
- Guan, L.; Abbasi, A.; Ryan, M.J. Analyzing green building project risk interdependencies using Interpretive Structural Modeling. J. Clean. Prod. 2020, 256, 120372. [Google Scholar] [CrossRef]
- Issa, U.H.; Marouf, K.G.; Faheem, H.B. Analysis of risk factors affecting the main execution activities of roadways construction projects. J. King Saud Univ. —Eng. Sci. 2021. [Google Scholar] [CrossRef]
- Taroun, A. Towards a better modelling and assessment of construction risk: Insights from a literature review. Int. J. Proj. Manag. 2014, 32, 101–115. [Google Scholar] [CrossRef]
- Mosaad, S.; Issa, U.H.; Hassan, M.S. Risks affecting the delivery of HVAC systems: Identifying and analysis. J. Build. Eng. 2018, 16, 20–30. [Google Scholar] [CrossRef]
- Zayed, T.; Amer, M.; Pan, J. Assessing risk and uncertainty inherent in Chinese highway projects using AHP. Int. J. Proj. Manag. 2008, 26, 408–419. [Google Scholar] [CrossRef]
- Issa, U.H.; Farag, M.A.; Abdelhafez, L.M.; Ahmed, S.A. A risk allocation model for construction projects in Yemen. Civ. Environ. Res. 2015, 7, 78–89. [Google Scholar]
- Rezakhani, P. Fuzzy MCDM model for risk factor selection in construction projects. Eng. J. 2012, 16, 79–93. [Google Scholar] [CrossRef]
- Rezakhani, P. Fuzzy risk analysis model for construction projects. Int. J. Civ. Struct. Eng. 2011, 2, 516–531. [Google Scholar] [CrossRef]
- Nieto-Morote, A.; Ruz-Vila, F. A fuzzy approach to construction project risk assessment. Int. J. Proj. Manag. 2011, 29, 220–231. [Google Scholar] [CrossRef] [Green Version]
- Issa, U.H. Developing an Assessment Model for Factors Affecting the Quality in the Construction Industry. J. Civ. Eng. Archit. 2012, 6, 504–512. [Google Scholar] [CrossRef] [Green Version]
- Yazdani-Chamzini, A. Proposing a new methodology based on fuzzy logic for tunnelling risk assessment. J. Civ. Eng. Manag. 2014, 20, 82–94. [Google Scholar] [CrossRef]
- Abd El Khalek, H.; Aziz, R.F.; Aziz, K.H.; Kamel, H. International construction projects’ risk cost estimation: Fuzzy logic and AHP in application (Real case studies). J. Build. Sustain. 2017, 2, 1–30. [Google Scholar]
- Zhou, H.; Zhao, Y.; Shen, Q.; Yang, L.; Cai, H. Risk assessment and management via multi-source information fusion for undersea tunnel construction. Autom. Constr. 2020, 111, 103050. [Google Scholar] [CrossRef]
- Yan, H.; Gao, C.; Elzarka, H.; Mostafa, K.; Tang, W. Risk assessment for construction of urban rail transit projects. Saf. Sci. 2019, 118, 583–594. [Google Scholar] [CrossRef]
- Yuan, T.; Xiang, P.; Li, H.; Zhang, L. Identification of the main risks for international rail construction projects based on the effects of cost-estimating risks. J. Clean. Prod. 2020, 274, 122904. [Google Scholar] [CrossRef]
- Chang, W.-T.; Lin, C.J.; Lee, Y.-H.; Chen, H.-J. Development of an observational checklist for falling risk assessment of high-voltage transmission tower construction workers. Int. J. Ind. Ergon. 2018, 68, 73–81. [Google Scholar] [CrossRef]
- Shi, Y.; Du, J.; Ahn, C.R.; Ragan, E. Impact assessment of reinforced learning methods on construction workers’ fall risk behavior using virtual reality. Autom. Constr. 2019, 104, 197–214. [Google Scholar] [CrossRef]
- Chen, F.; Wang, H.; Xu, G.; Ji, H.; Ding, S.; Wei, Y. Data-driven safety enhancing strategies for risk networks in construction engineering. Reliab. Eng. Syst. Saf. 2020, 197, 106806. [Google Scholar] [CrossRef]
- Mohandes, S.R.; Zhang, X. Towards the development of a comprehensive hybrid fuzzy-based occupational risk assessment model for construction workers. Saf. Sci. 2019, 115, 294–309. [Google Scholar] [CrossRef]
- Jebelli, H.; Ahn, C.R.; Stentz, T.L. Fall risk analysis of construction workers using inertial measurement units: Validating the usefulness of the postural stability metrics in construction. Saf. Sci. 2016, 84, 161–170. [Google Scholar] [CrossRef]
- Sanni-Anibire, M.O.; Mahmoud, A.S.; Hassanain, M.A.; Salami, B. A risk assessment approach for enhancing construction safety performance. Saf. Sci. 2020, 121, 15–29. [Google Scholar] [CrossRef]
- Wong, T.K.M.; Man, S.S.; Chan, A.H.S. Critical factors for the use or non-use of personal protective equipment amongst construction workers. Saf. Sci. 2020, 126, 104663. [Google Scholar] [CrossRef]
- Man, S.; Chan, A.H.; Wong, H. Risk-taking behaviors of Hong Kong construction workers—A thematic study. Saf. Sci. 2017, 98, 25–36. [Google Scholar] [CrossRef]
- Man, S.S.; Chan, A.H.S.; Alabdulkarim, S. Quantification of risk perception: Development and validation of the construction worker risk perception (CoWoRP) scale. J. Saf. Res. 2019, 71, 25–39. [Google Scholar] [CrossRef] [PubMed]
- Issa, U.H.; Salama, I.M. Improving Productivity in Saudi Arabian Construction Projects: An Analysis based on Lean Techniques. Int. J. Appl. Eng. Res. 2018, 13, 8669–8678. [Google Scholar]
- Adeleke, A.; Bahaudin, A.; Kamaruddeen, A.M.; Bamgbade, J.; Salimon, M.G.; Khan, M.W.A.; Sorooshian, S. The Influence of Organizational External Factors on Construction Risk Management among Nigerian Construction Companies. Saf. Health Work 2018, 9, 115–124. [Google Scholar] [CrossRef]
- Issa, U.H.; Mosaad, S.A.; Hassan, M.S. Evaluation and selection of construction projects based on risk analysis. Structures 2020, 27, 361–370. [Google Scholar] [CrossRef]
- Wang, Z.; Chen, C. Fuzzy comprehensive Bayesian network-based safety risk assessment for metro construction projects. Tunn. Undergr. Space Technol. 2017, 70, 330–342. [Google Scholar] [CrossRef]
- Leontaris, G.; Nápoles, O.M.; Dewan, A.; Wolfert (Rogier), A.R.M. Decision support for offshore asset construction using expert judgments for supply disruptions risk. Autom. Constr. 2019, 107, 102903. [Google Scholar] [CrossRef]
- Farooq, M.U.; Thaheem, M.J.; Arshad, H. Improving the risk quantification under behavioural tendencies: A tale of construction projects. Int. J. Proj. Manag. 2018, 36, 414–428. [Google Scholar] [CrossRef]
- Shojaei, P.; Haeri, S.A.S. Development of supply chain risk management approaches for construction projects: A grounded theory approach. Comput. Ind. Eng. 2019, 128, 837–850. [Google Scholar] [CrossRef]
- Barriuso, Á.R.; Escribano, B.V.; Cañamares, M.S.; García, M.G.; Sáiz, A.R. Analysis and diagnosis of risk-prevention training actions in the Spanish construction sector. Saf. Sci. 2018, 106, 79–91. [Google Scholar] [CrossRef]
- Gunduz, M.; Laitinen, H. Construction safety risk assessment with introduced control levels. J. Civ. Eng. Manag. 2018, 24, 11–18. [Google Scholar] [CrossRef] [Green Version]
- Issa, U.H.; Mosaad, S.A.; Hassan, M.S. A model for evaluating the risk effects on construction project activities. J. Civ. Eng. Manag. 2019, 25, 687–699. [Google Scholar] [CrossRef]
- Issa, U.; Sharaky, I.; Alwetaishi, M.; Balabel, A.; Shamseldin, A.; Abdelhafiz, A.; Al-Surf, M.; Al-Harthi, M.; Osman, M. Developing and Applying a Model for Evaluating Risks Affecting Greening Existing Buildings. Sustainability 2021, 13, 6403. [Google Scholar] [CrossRef]
- Minchin, M.; WestOne Services. Introduction to Surveying; WestOne Services: Nokomis, FL, USA, 2003. [Google Scholar]
- Galvin, R. How many interviews are enough? Do qualitative interviews in building energy consumption research produce reliable knowledge? J. Build. Eng. 2015, 1, 2–12. [Google Scholar] [CrossRef]
- Thomas, A.V.; Kalidindi, S.N.; Ananthanarayanan, K. Risk perception analysis of BOT road project participants in India. Constr. Manag. Econ. 2003, 21, 393–407. [Google Scholar] [CrossRef]
- Issa, U.H.; Ahmed, A.; Ugai, K. A Decision Support System for Ground Improvement Projects Using Gypsum Waste Case Study: Embankments Construction in Japan. J. Civ. Environ. Res. 2013, 4, 74–84. [Google Scholar]
- Townsend, K. Saturation and run off: How many interviews are required in qualitative research. In Proceedings of the ANZAM Conference 2013, Hobart, Australia, 4–6 December 2013. [Google Scholar]
- Long, N.D.; Ogunlana, S.; Quang, T.; Lam, K.C. Large construction projects in developing countries: A case study from Vietnam. Int. J. Proj. Manag. 2004, 22, 553–561. [Google Scholar] [CrossRef]
- Osman, M.M.A.; Issa, U.H.; Eraqi, A.M.Z. Identifying the Risk Impact on Cost and Time of the Egyptian Non-Residential Buildings Projects. Int. J. Sci. Res. Sci. Eng. Technol. 2020, 7, 1–12. [Google Scholar] [CrossRef]
- Tukey, J.W. Exploratory Data Analysis; SAGE Publications: Thousand Oaks, CA, USA, 1977; Volume 2. [Google Scholar]
- Mishiyi, H.; Cumberlege, R.; Buys, F. Challenges facing newly established quantity surveying firms to secure tenders in South Africa. Acta Structilia 2019, 26, 42–60. [Google Scholar] [CrossRef] [Green Version]
Figure 1.
The research methodology overview.

Figure 2.
Years of experience of the respondents.
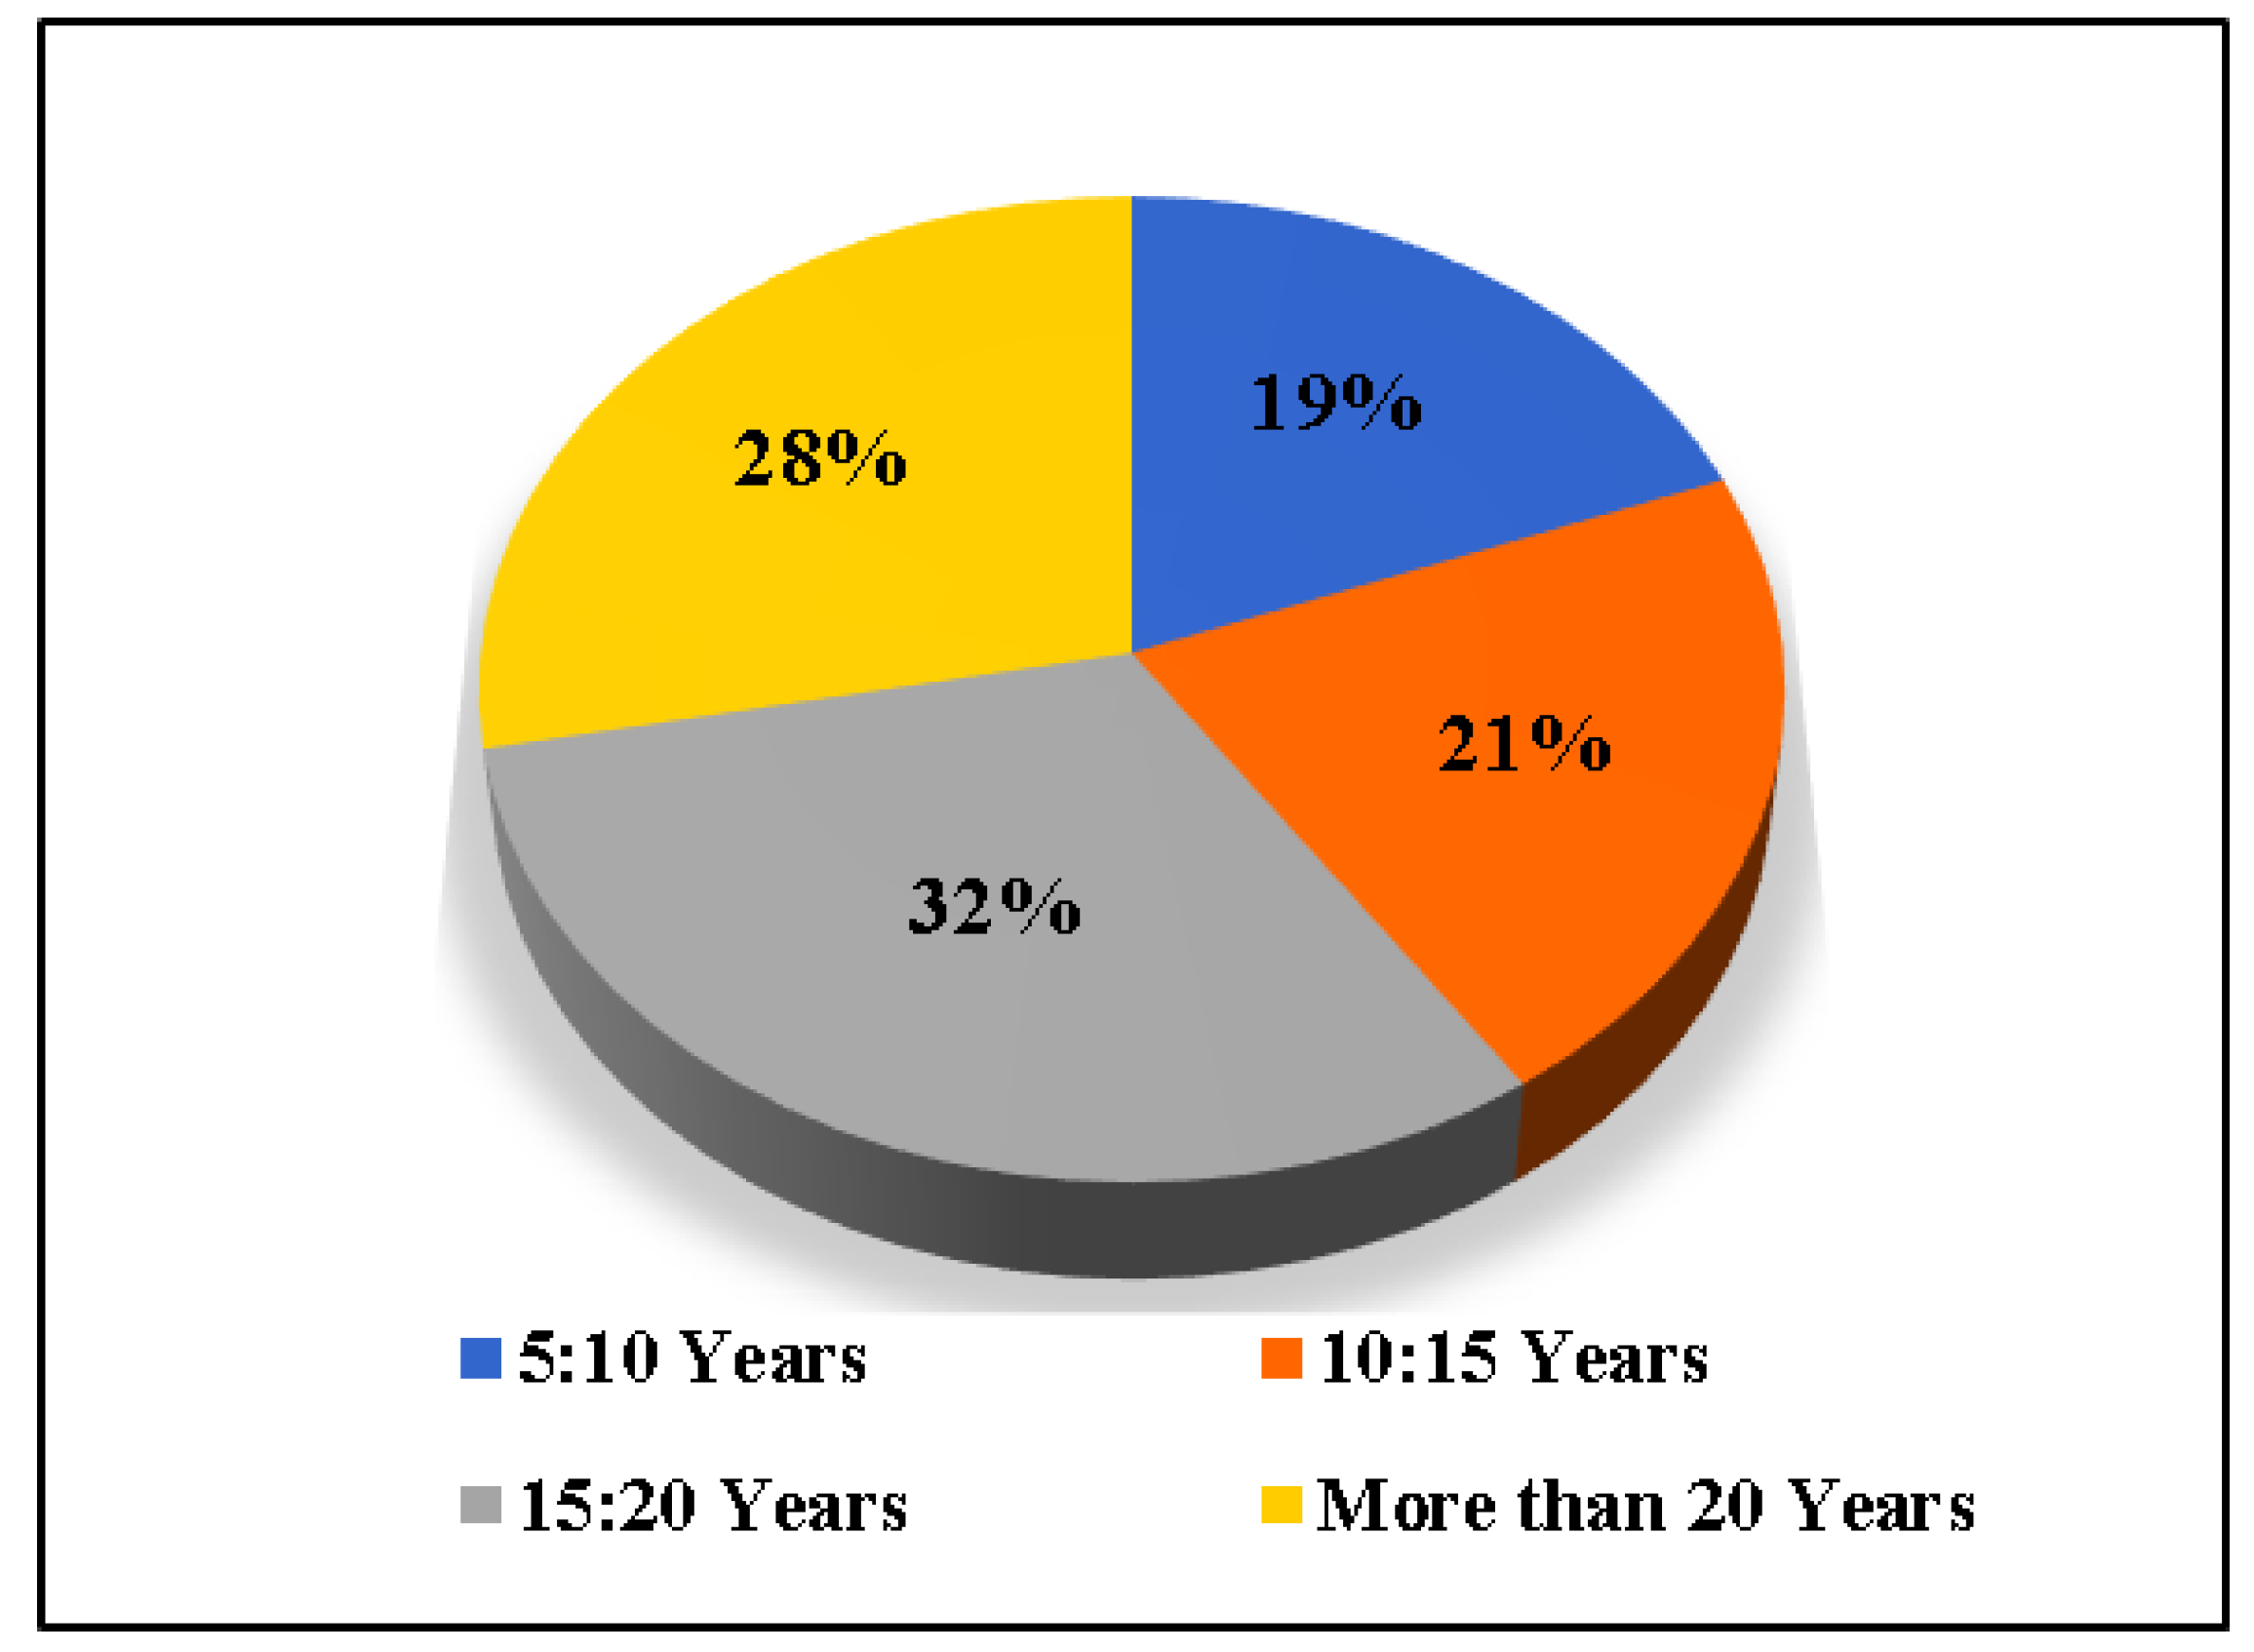
Figure 3.
Spearman’s correlation coefficient for measuring the agreement between contractors and consultants.
Figure 3.
Spearman’s correlation coefficient for measuring the agreement between contractors and consultants.

Figure 4.
Percentages of the project period for each activity group.
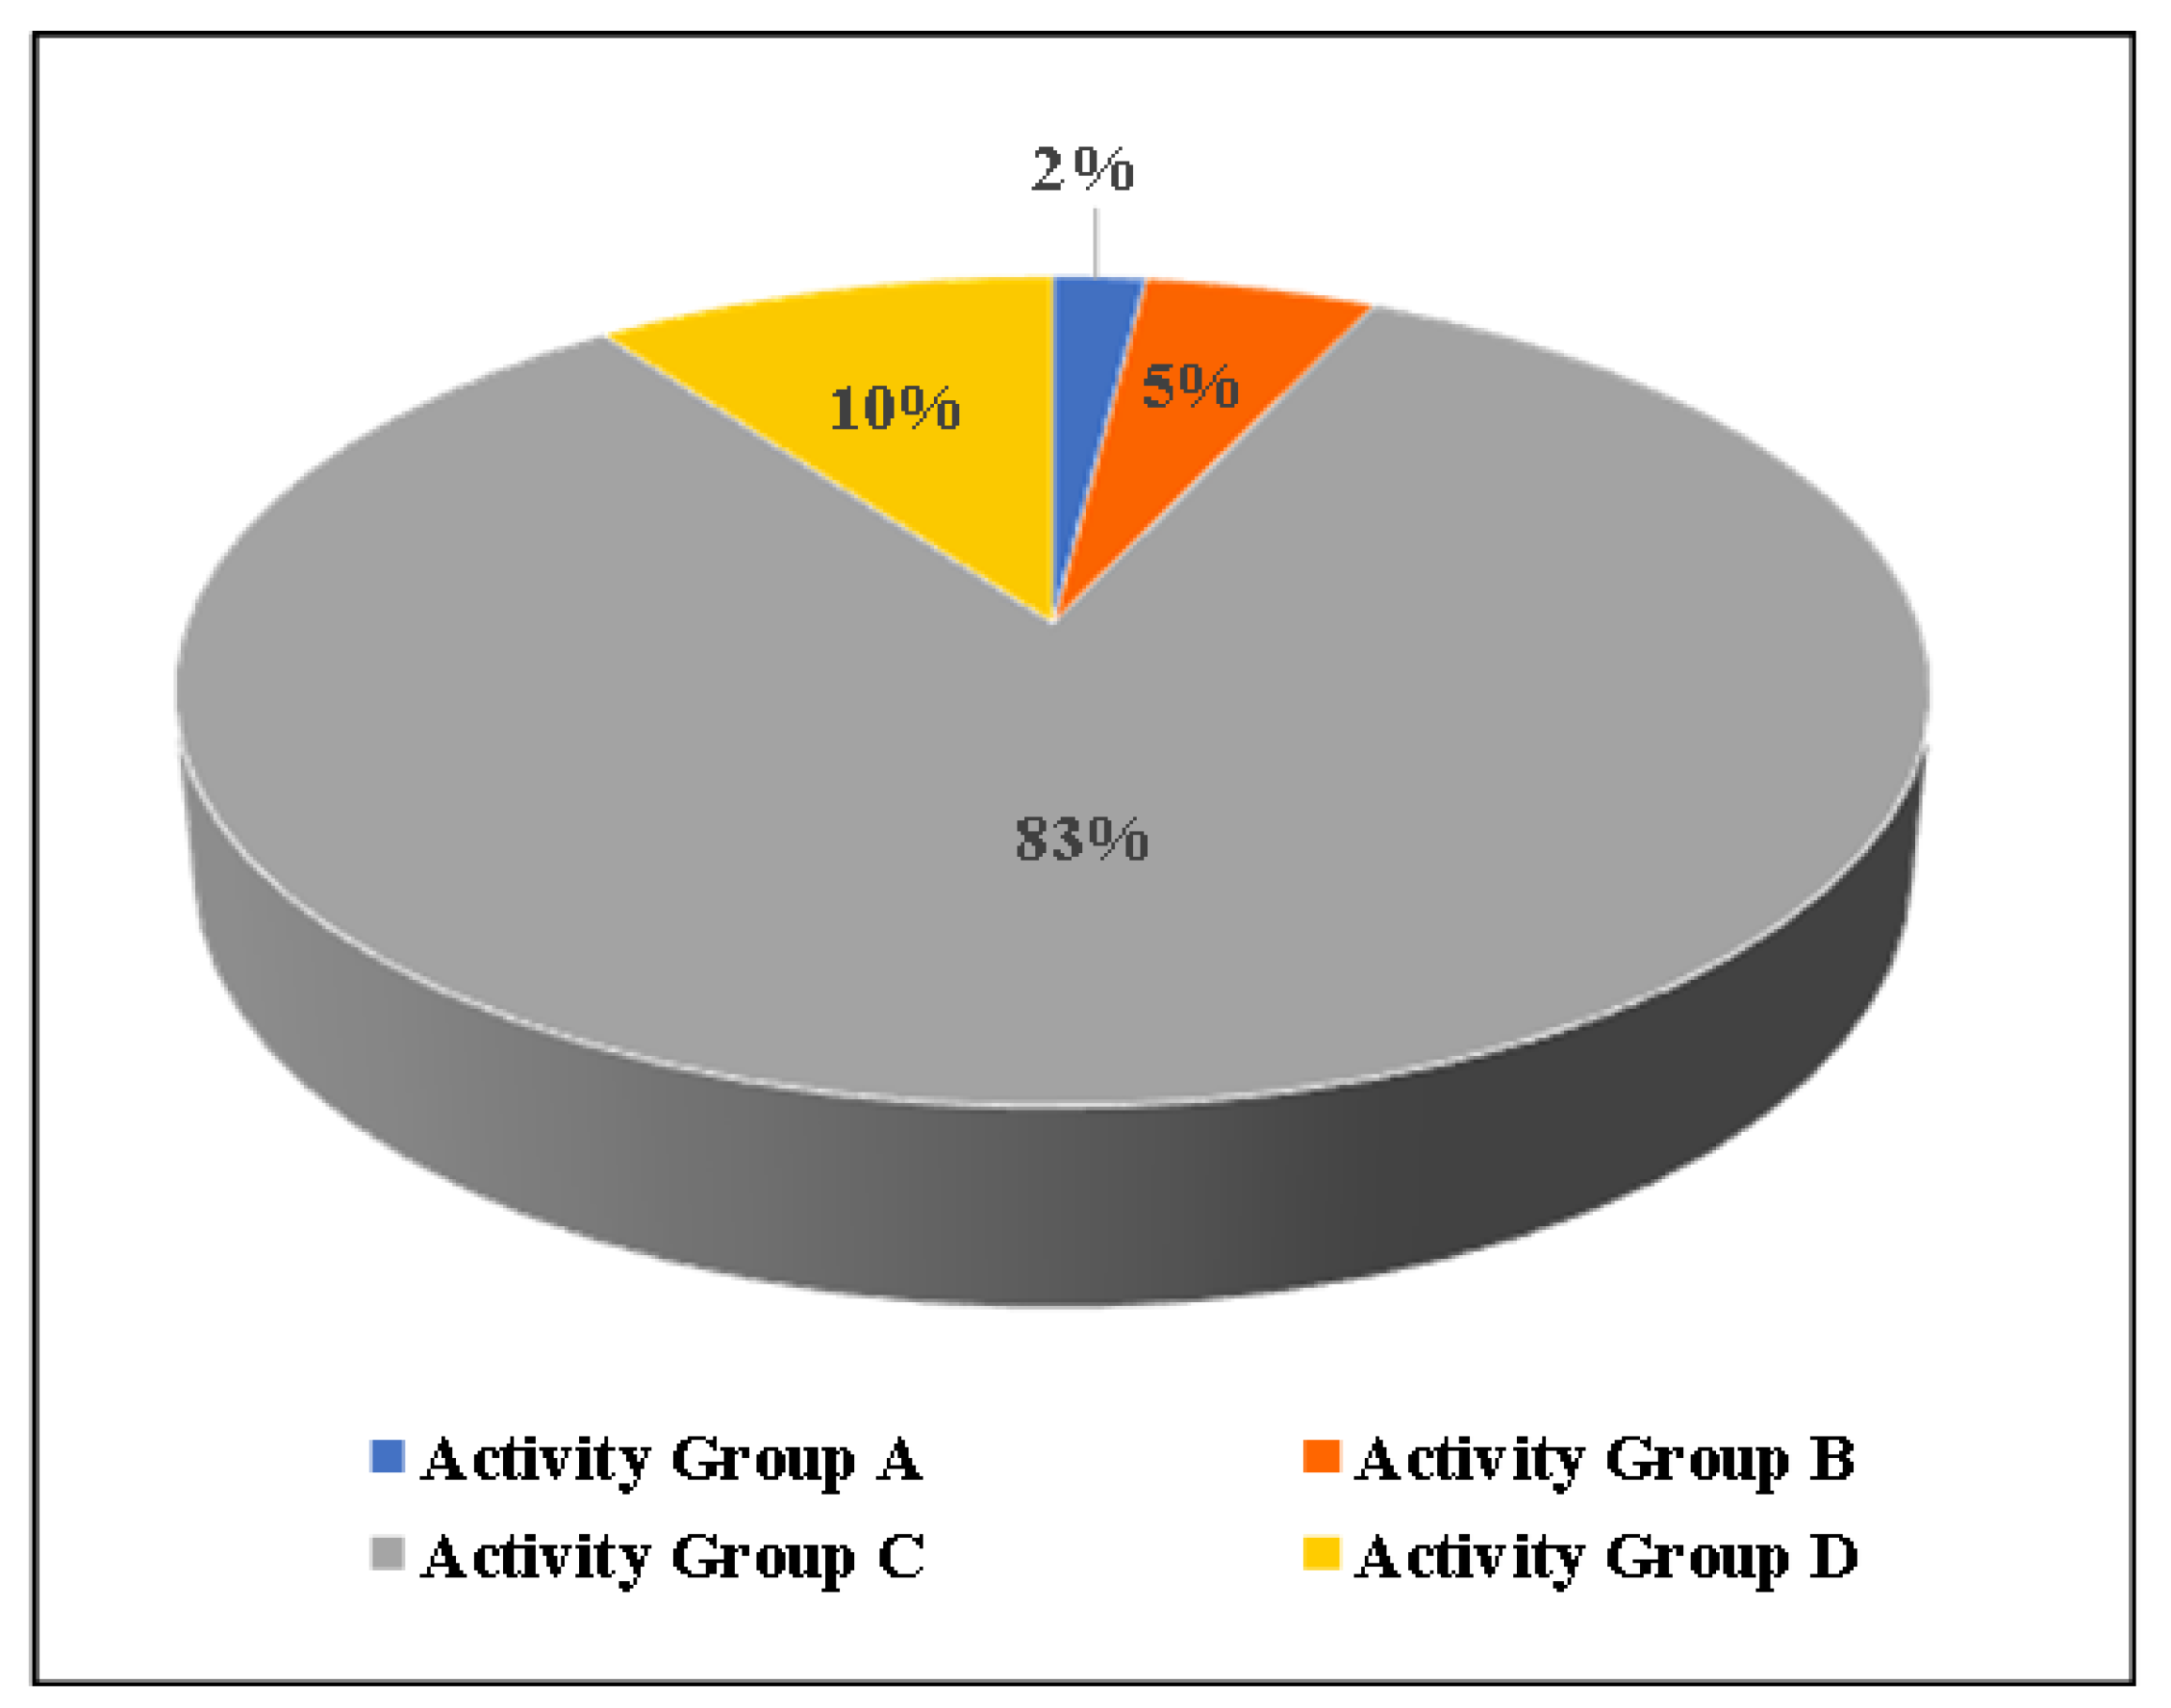
Figure 5.
Percentages of LSPs’ time delay.
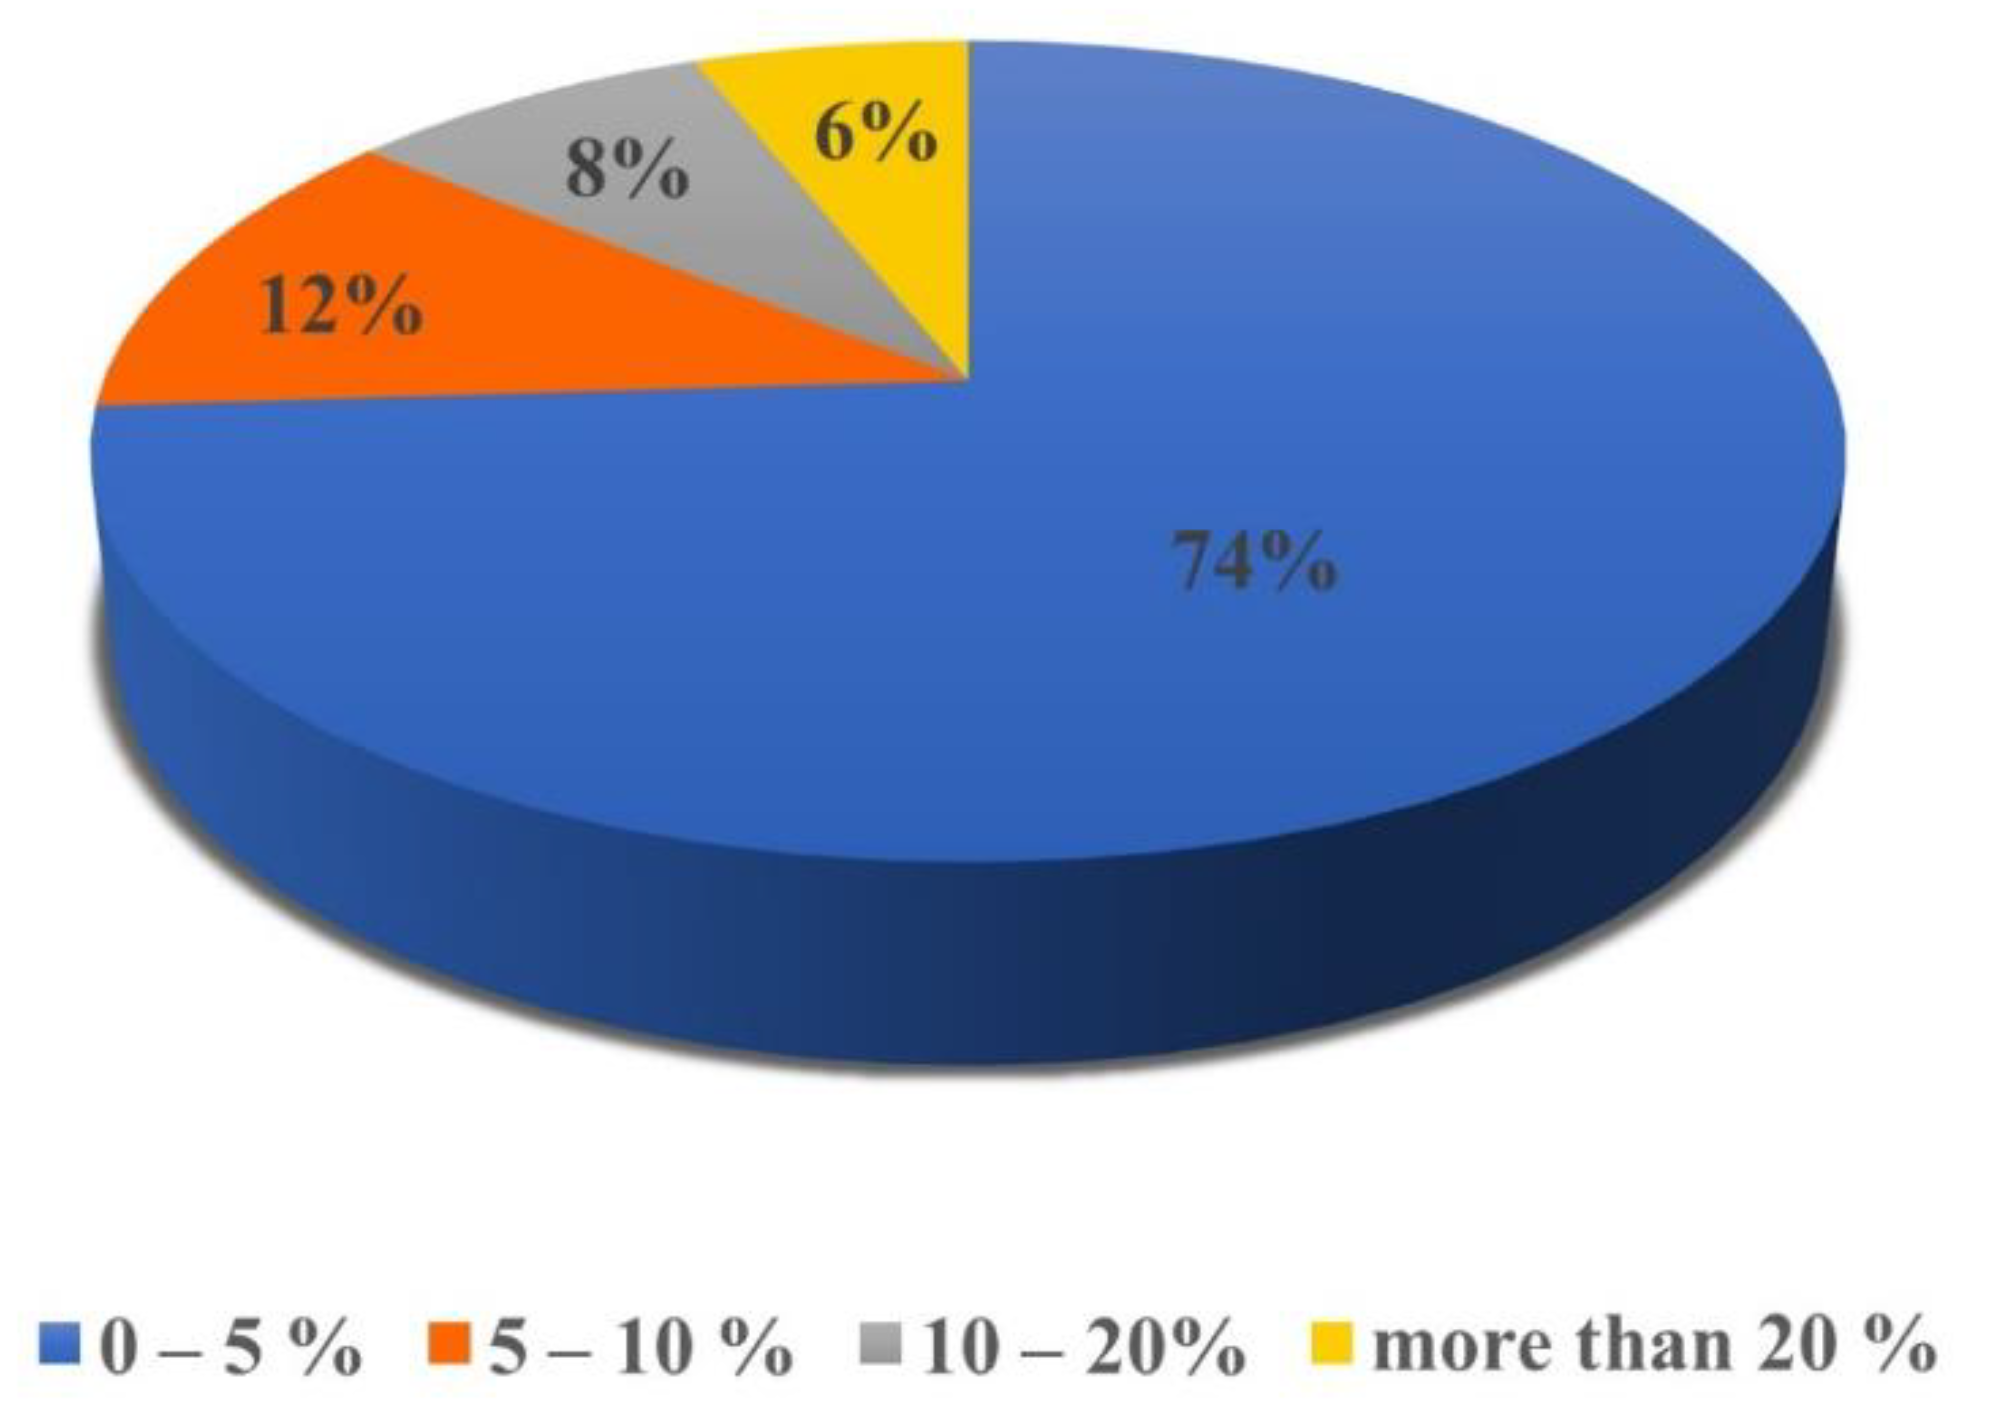
Figure 6.
Percentages of the projects’ satisfy specifications.
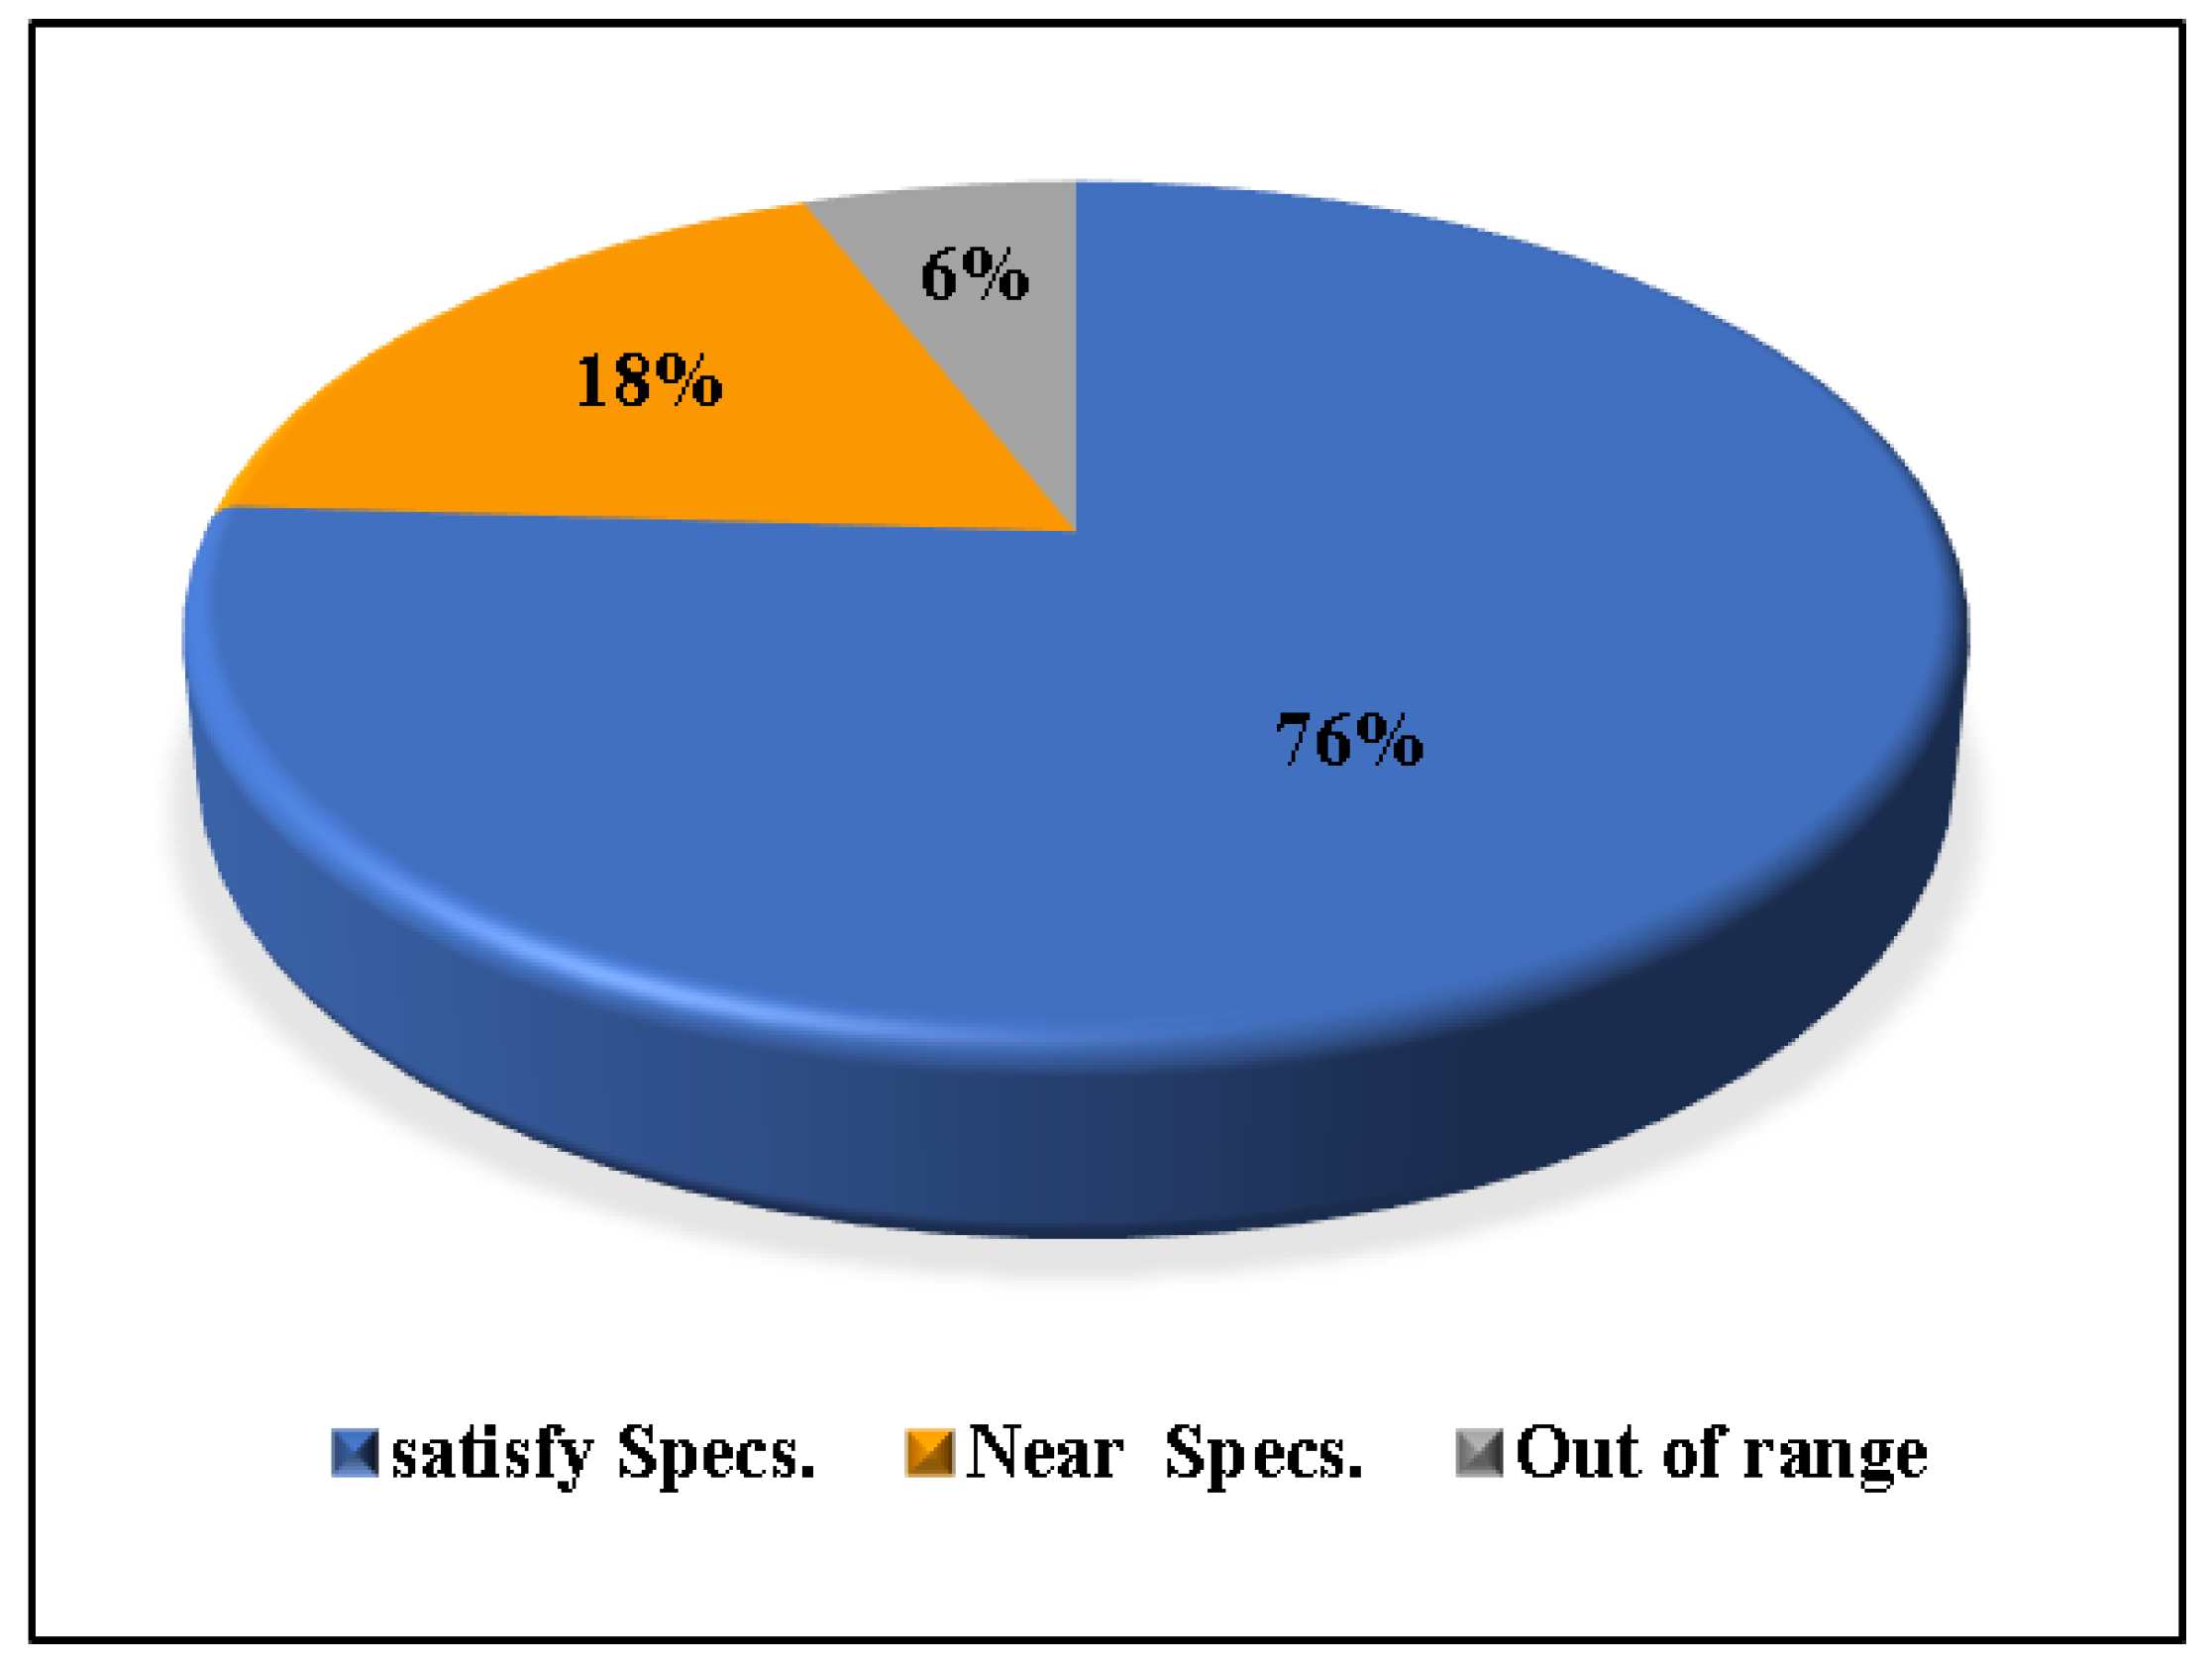
Figure 7.
The risk factor index for time (RFIT) and accuracy (RFIA).
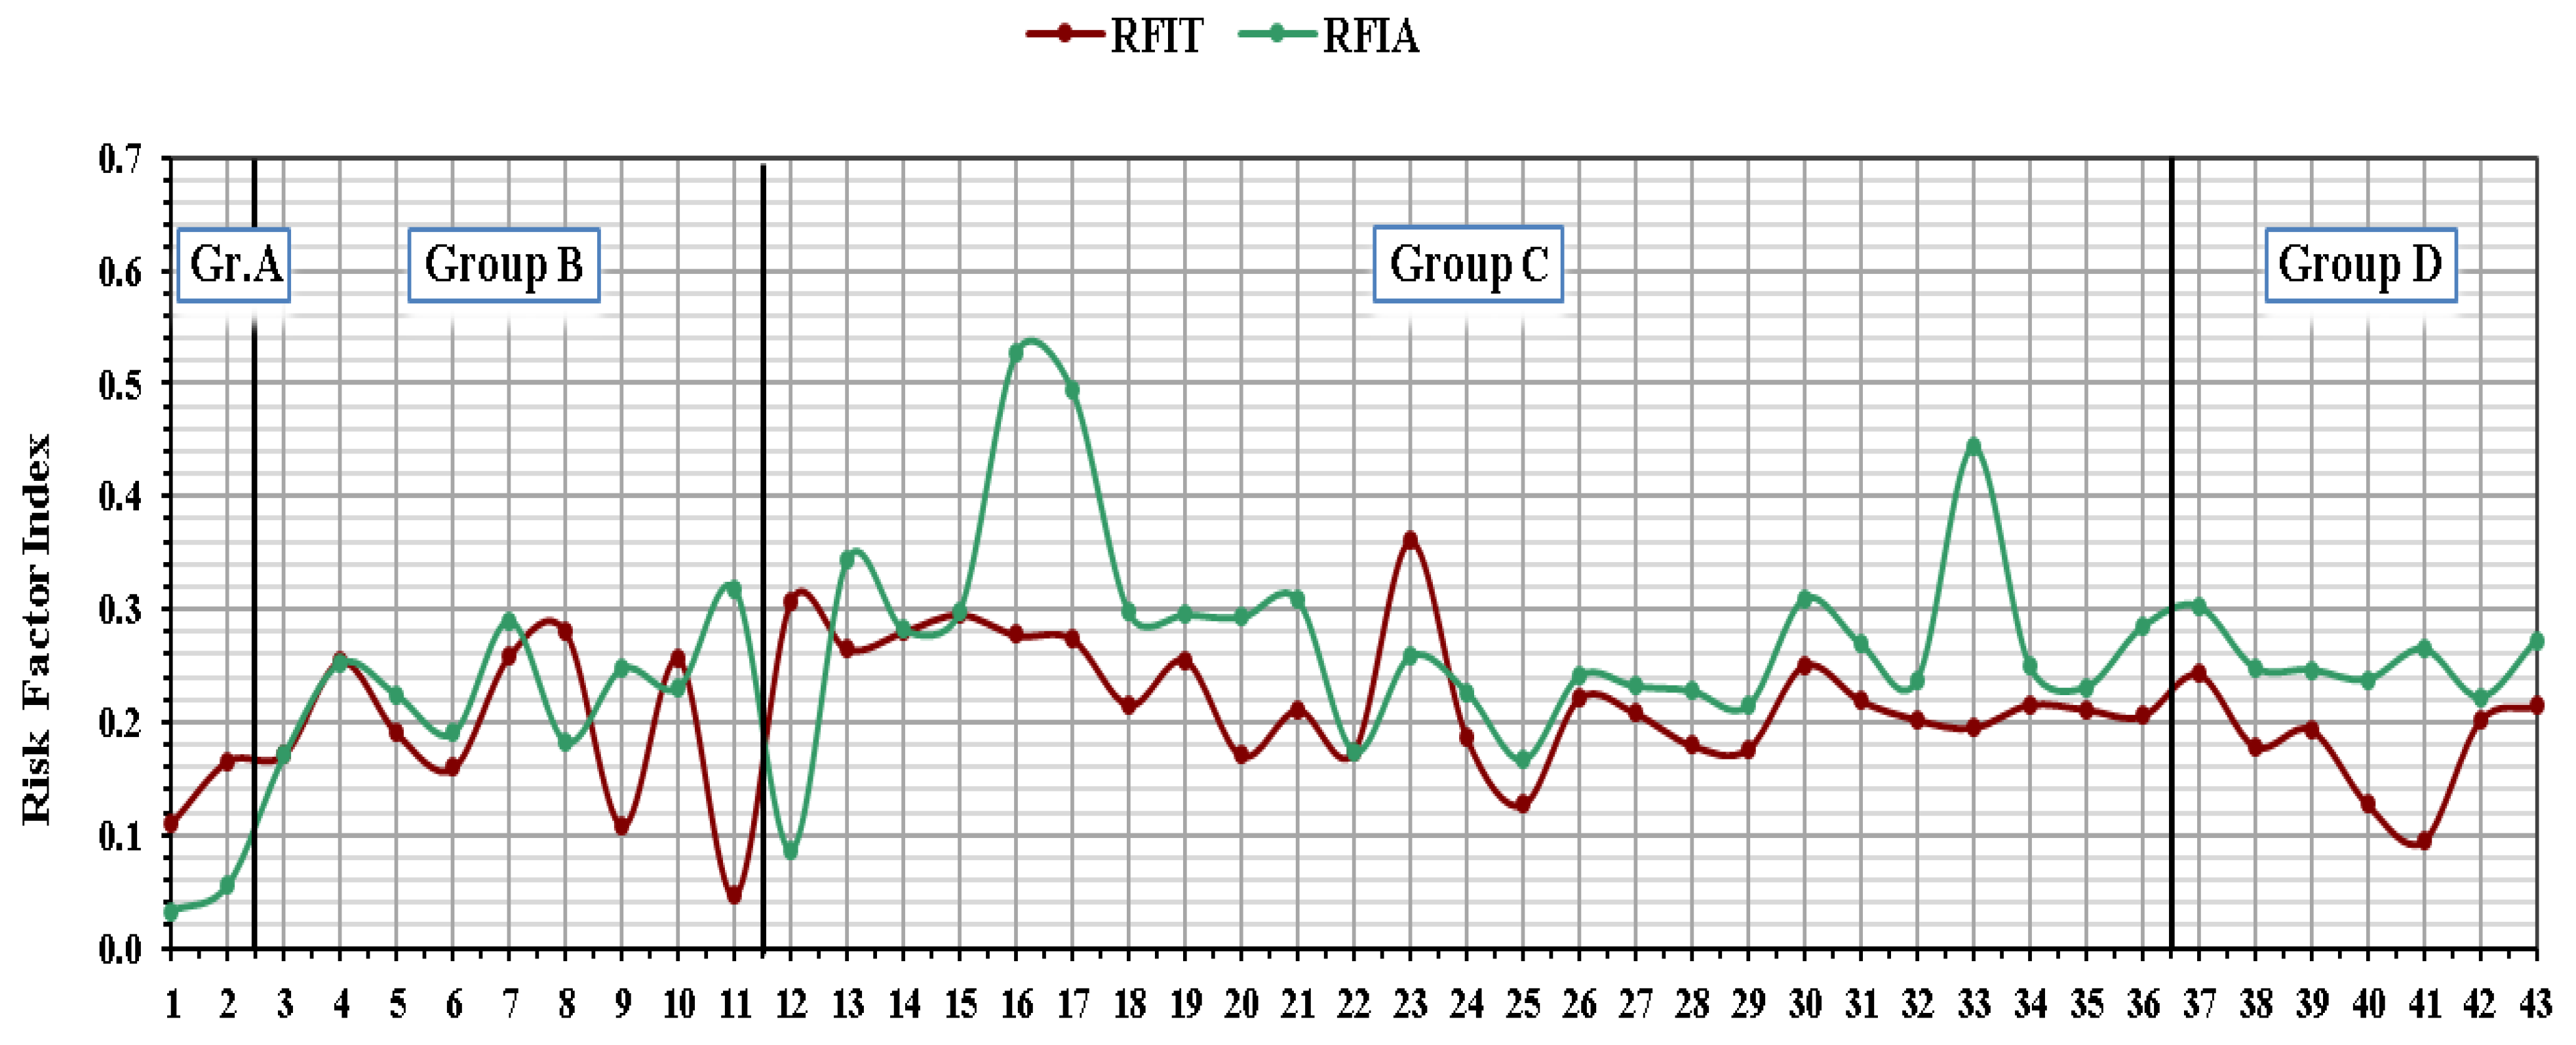
Figure 8.
A comparison of the top ten’ risk factors for RFIT and RFIA.
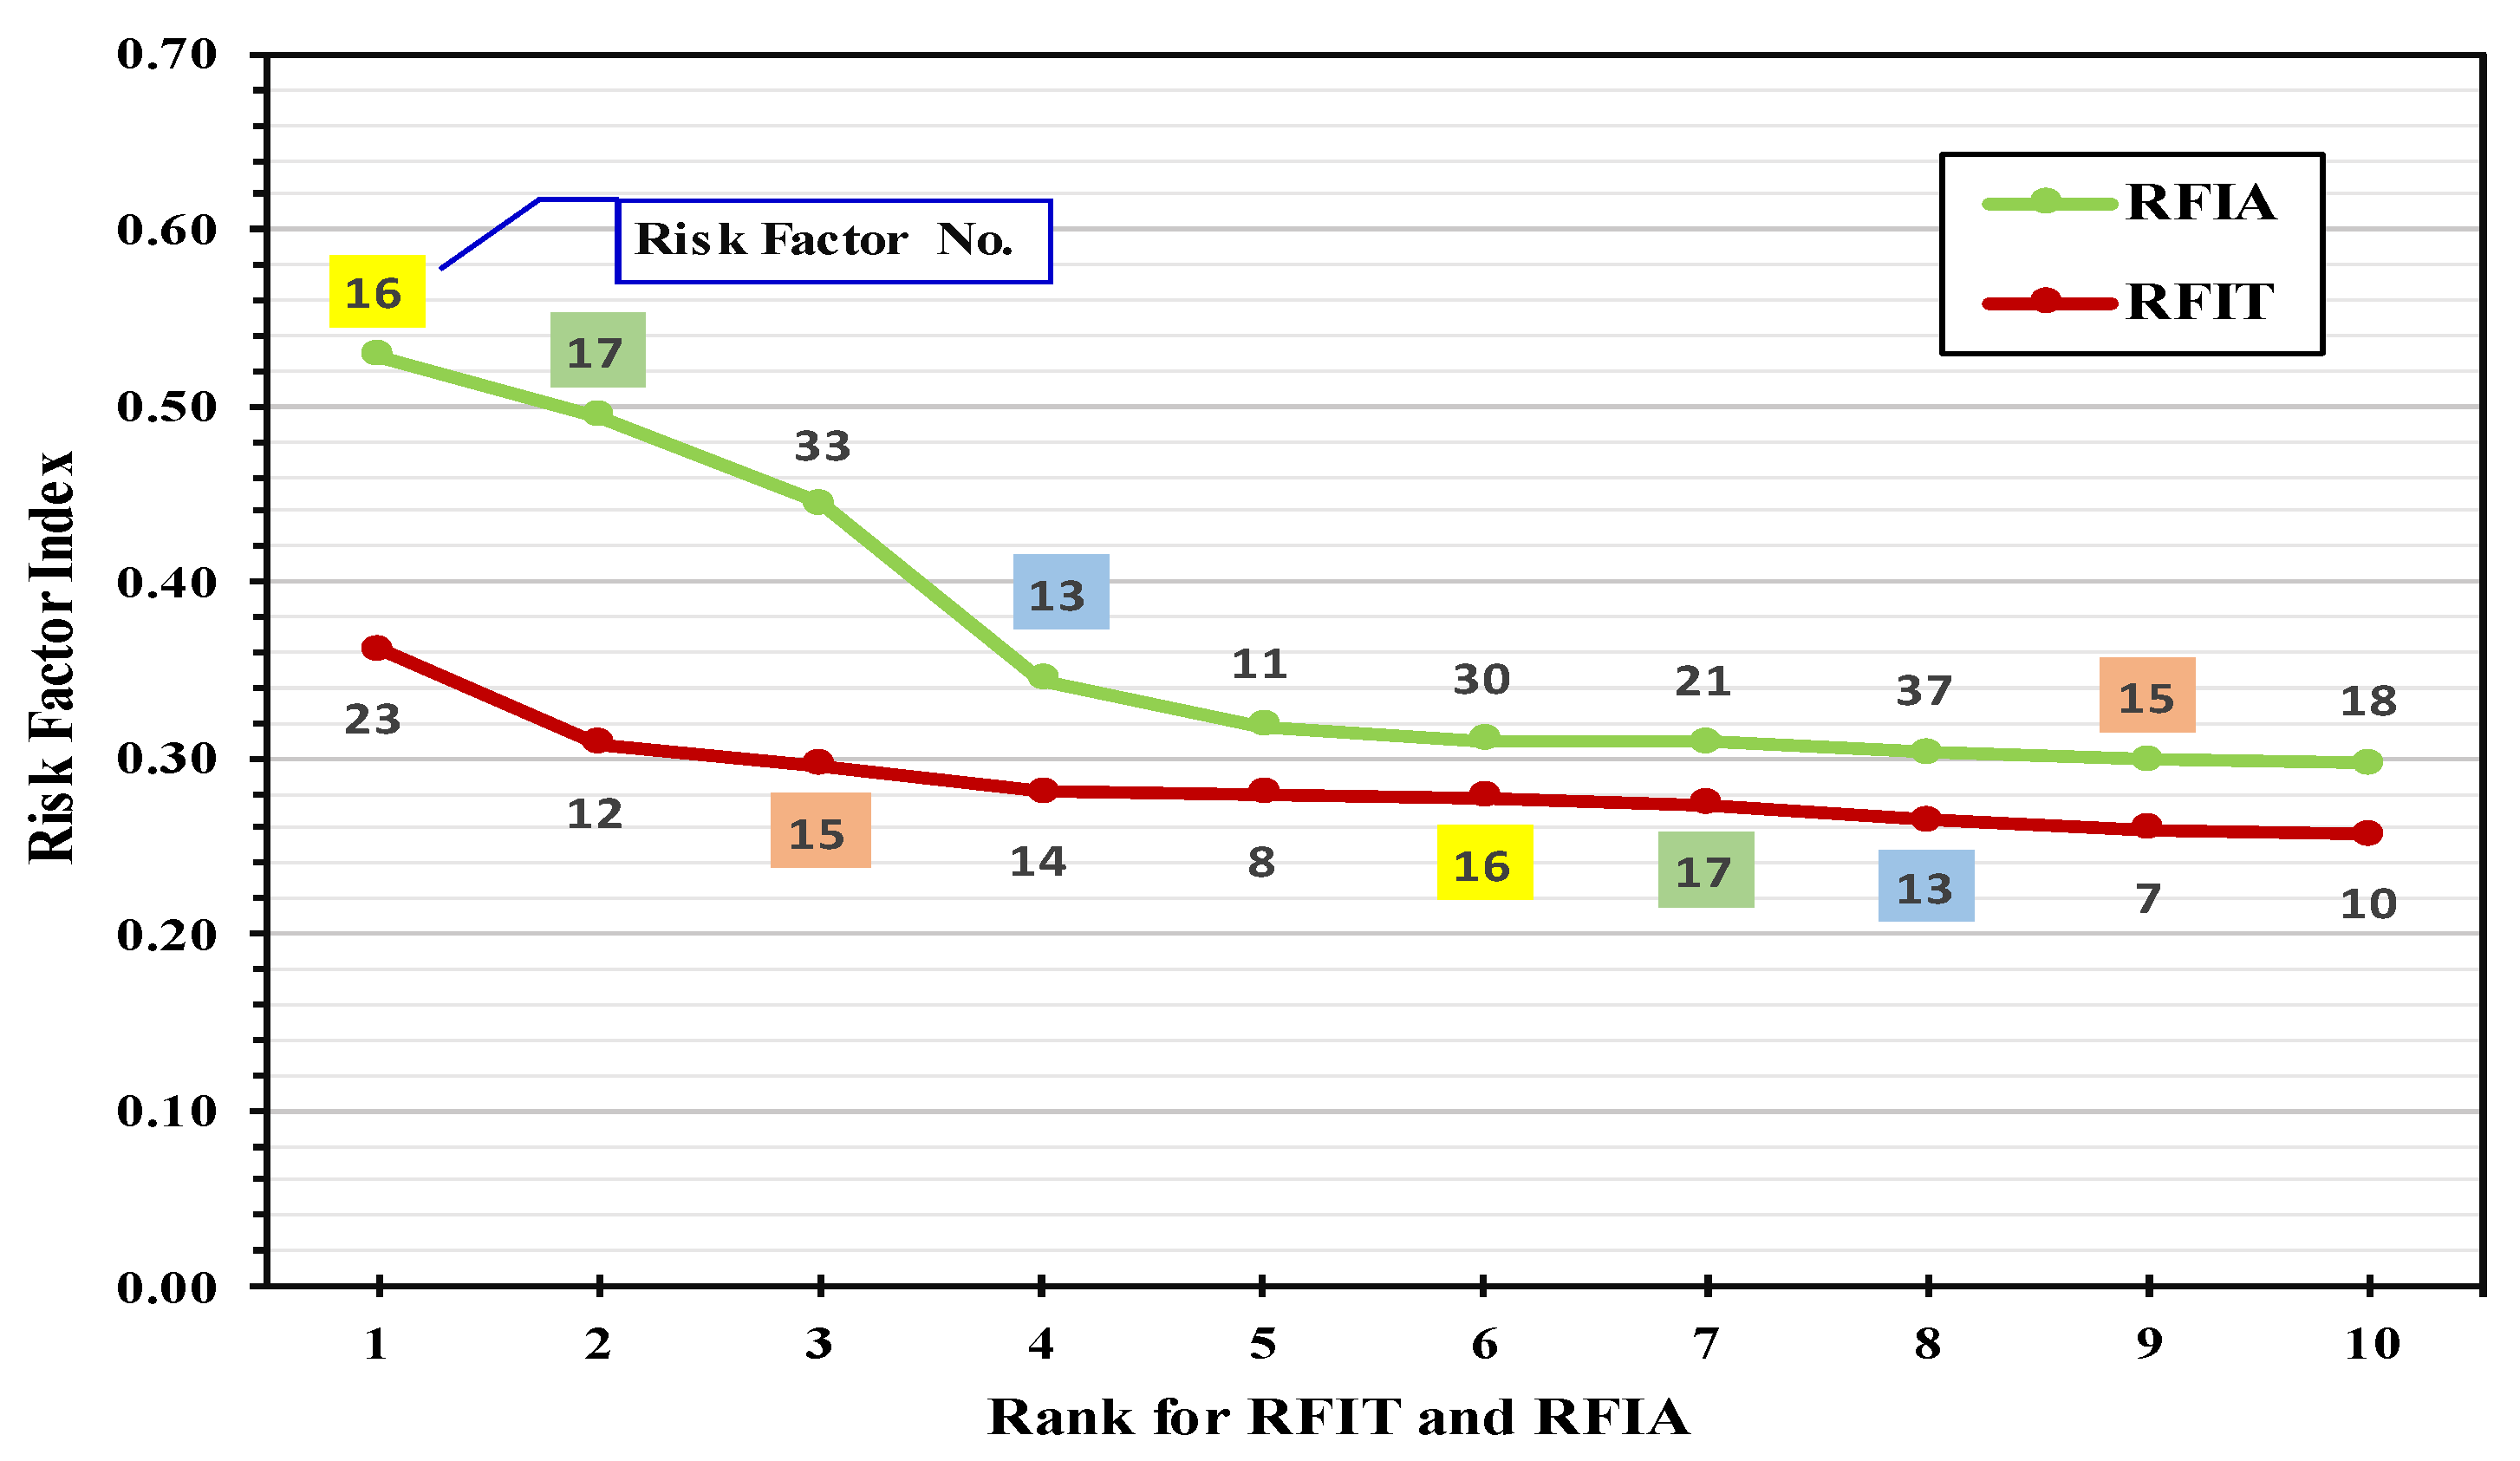
Figure 9.
Boxplot analyses for each activity group.
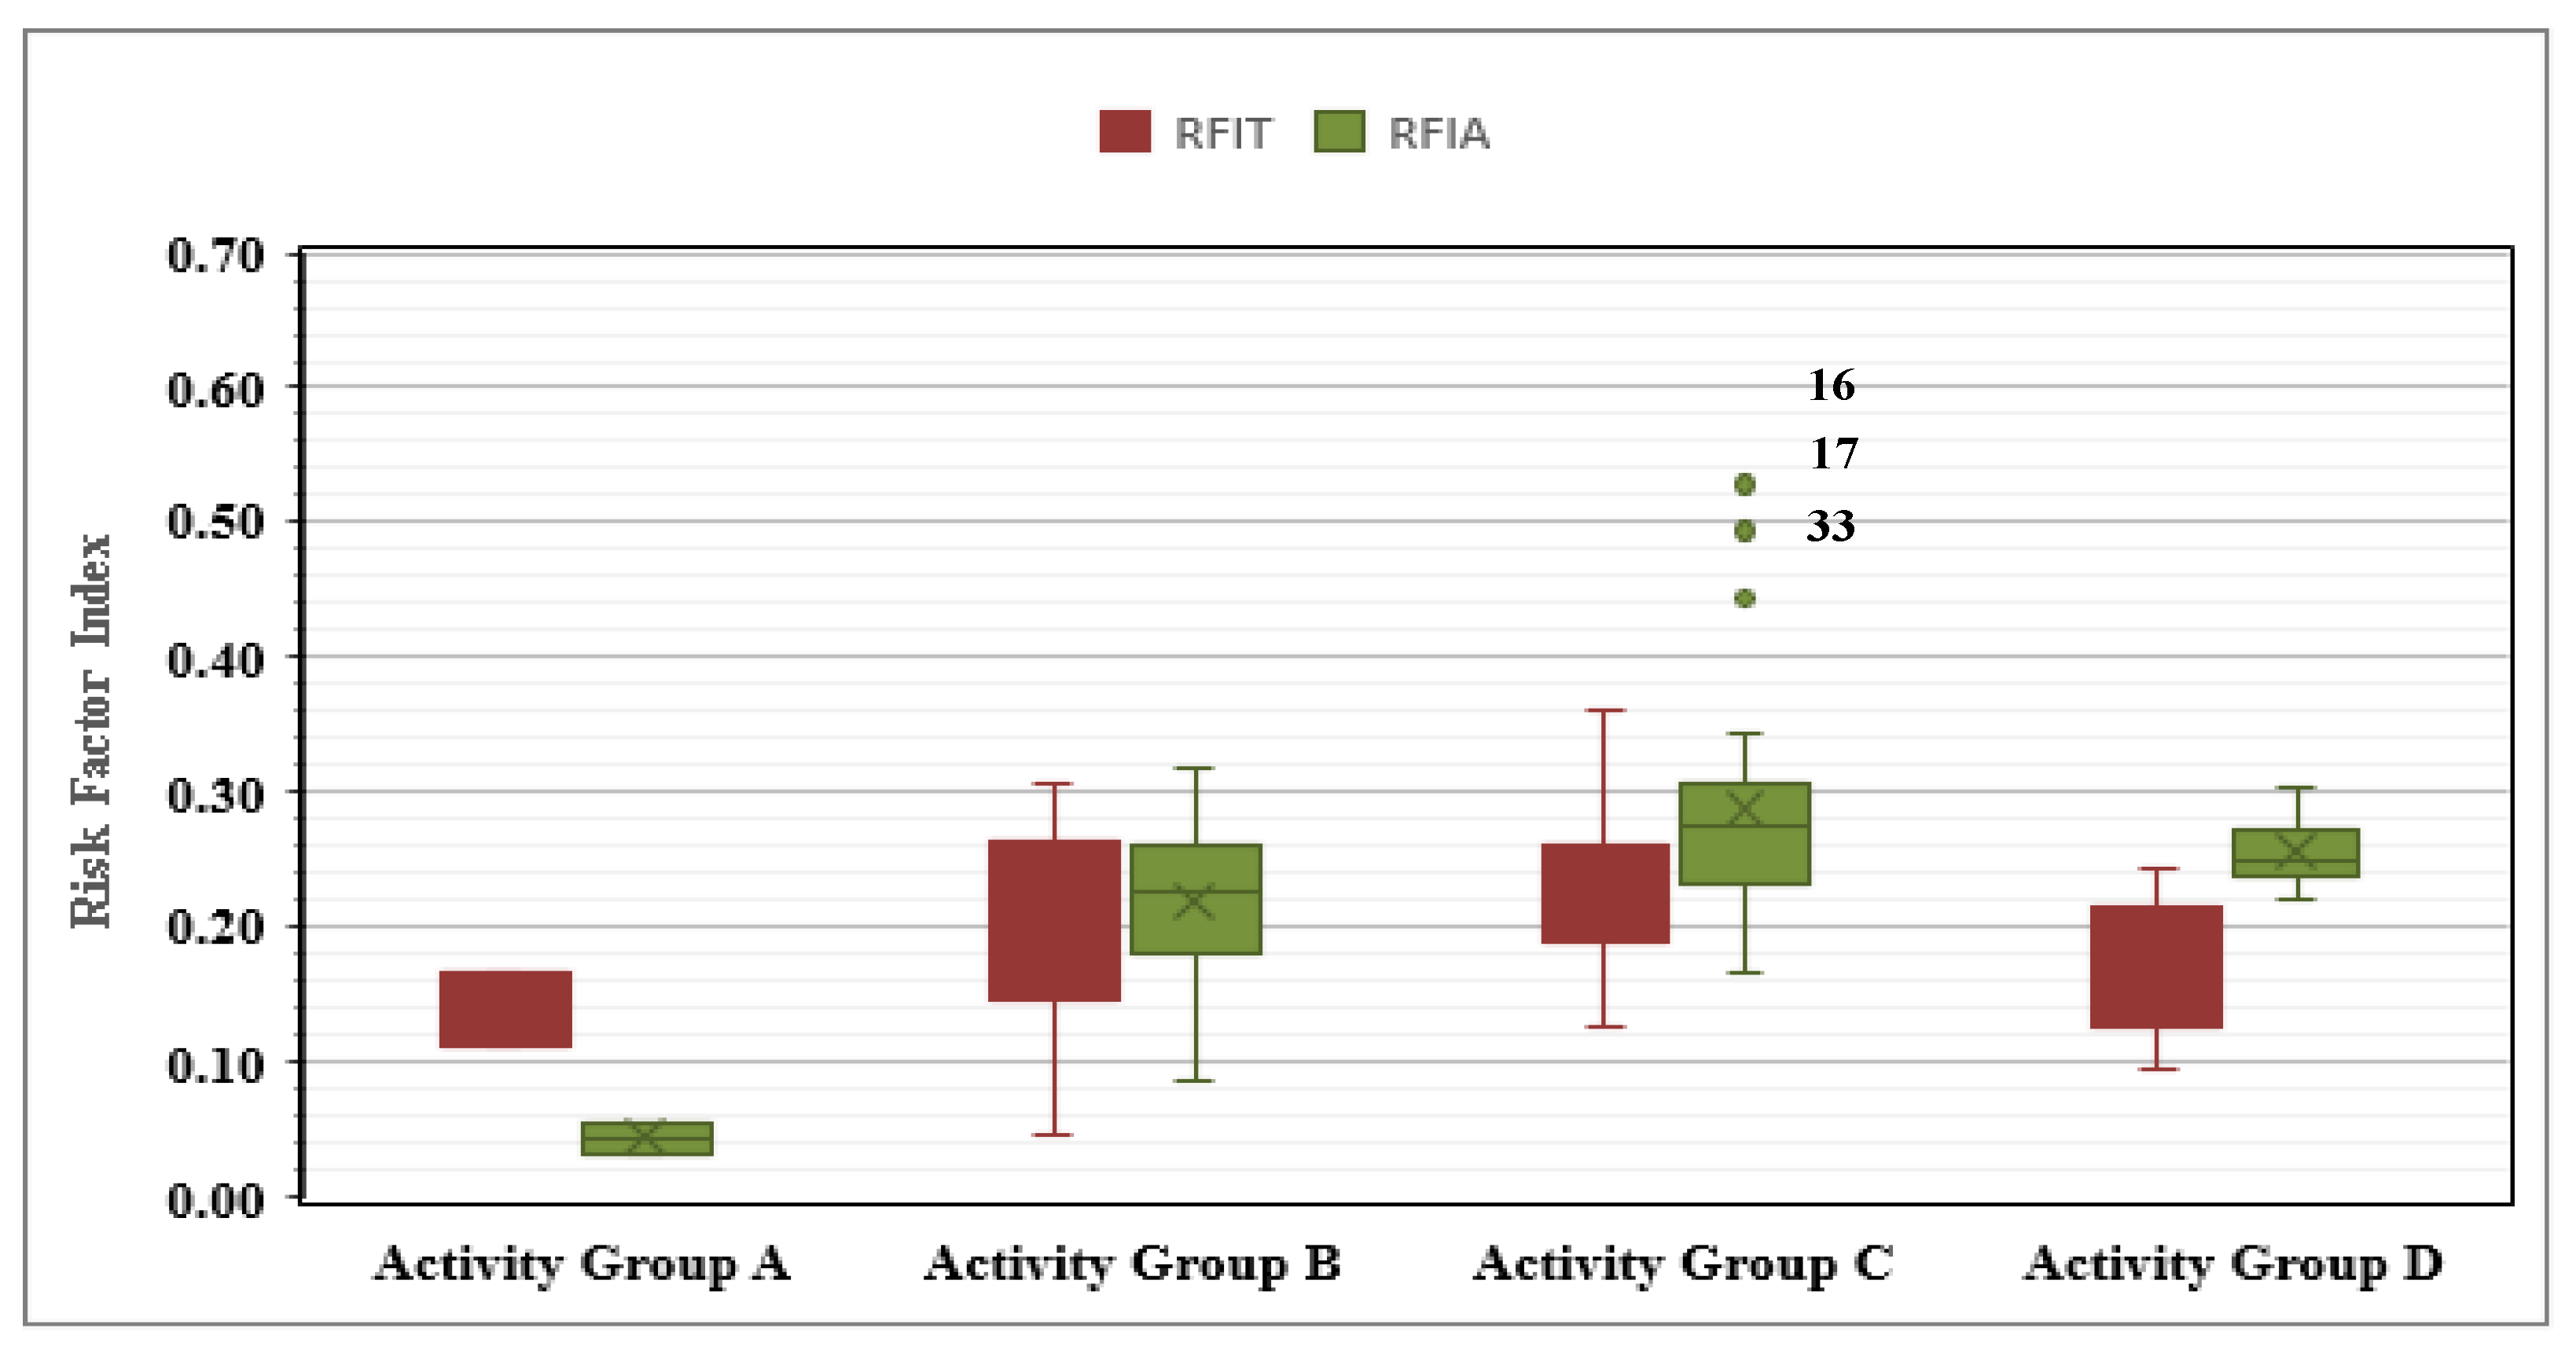
Figure 10.
Boxplot analyses for all factors.
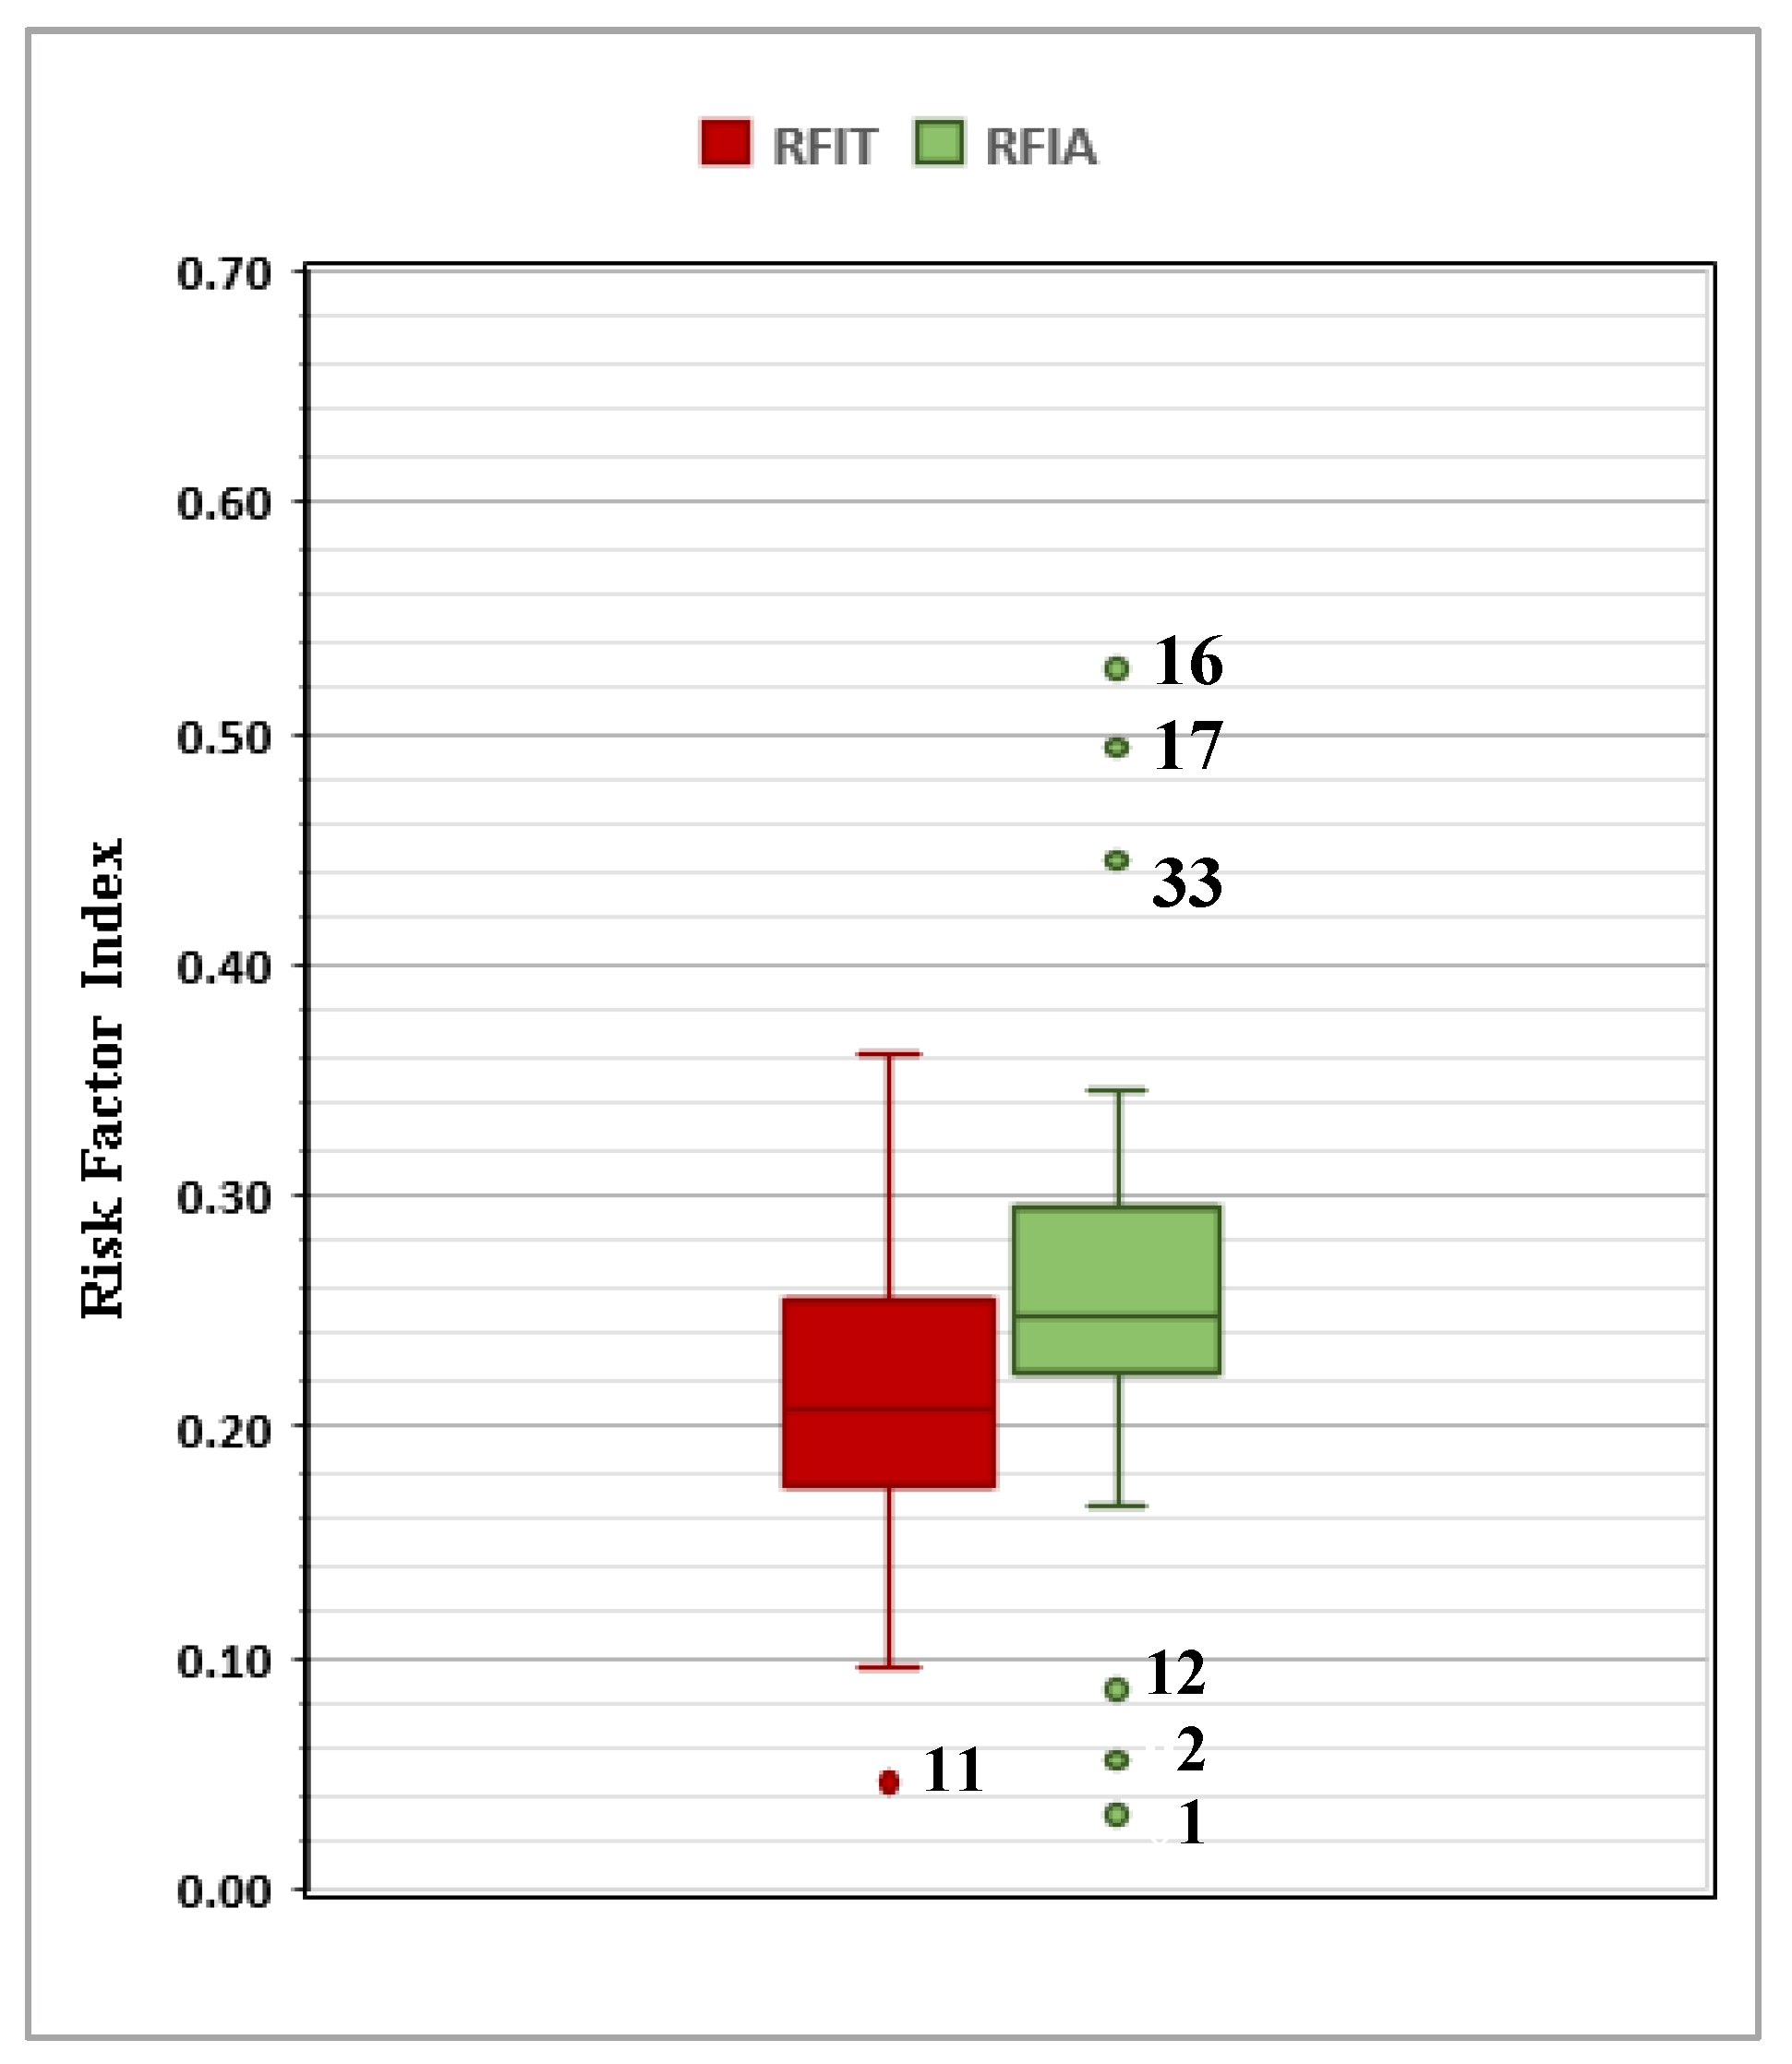
Figure 11.
Percentage of each responsibility in each group.

Table 1.
Questionnaire return rate and frequency of participation.
| Respondents | Contractors | Consultants | Total |
|---|---|---|---|
| Questionnaire Distributed | 76 | 64 | 140 |
| Responses Received | 54 | 35 | 89 |
| Response Rate | 71.05% | 54.69% | 63.57% |
| Percentage | 60.67% | 39.33% | 100.00% |
Table 2.
Description and identification of the risk factors that control land surveying activities.
| NO. | Activity Group (A): Reconnaissance Works |
| 1 | Absence of reconnaissance works for exploring site conditions and availability of infrastructures. |
| 2 | Shortage in implementation of reconnaissance works. |
| Activity Group (B): Planning Works | |
| 3 | Absence of pre-established (predetermined) procedure in all stages of the survey to reduce the effect of mistakes and blunders. |
| 4 | No selection for an observation method to eliminate known systematic errors, such as face left and face right. |
| 5 | Absence of preventive procedures which eliminate most instrumental errors. |
| 6 | Poor selection for technologies, suitable instruments and type of survey according to the purpose and accuracy requirements. |
| 7 | Lack of proper planning and preparation. |
| 8 | Poor selection of improper points sites that do not meet specifications and precautions. |
| 9 | Bad selection of point positions and geometry (improper magnitude for horizontal angles between points). |
| 10 | Poor planning and bad selection for observation time which affect signals received from GPS and accuracy. |
| 11 | Inconsistency between precision of angular measurements and precision of linear measurements. |
| 12 | Absence of pre-determined scale for the produced map to specify the details that can be taken and measured. |
| Activity Group (C): Data collection works | |
| 13 | Absence of applying the engineering and surveying specifications necessary for the measurements. |
| 14 | Not following a determinable observation method (technique) to avoid and eliminate systematic errors. |
| 15 | Absence of appropriate preventive procedures (such as repeated measurements) to eliminate most of the instrumental errors. |
| 16 | Transferring The instrument and sights from control point to other one instead of making mounted tribrach stay on the tripod over that points for all uses without disturbing the tribrach setup. |
| 17 | Poor checking instrument settings when it is received by a crew, whether new or transferred from another crew. |
| 18 | Carefully read and call out each reading (observation) to the recorder. so, any large blunders will be caught. |
| 19 | Absence of carefully analyzing observation sheets. There are some important items should be checked in the field by the recorder. |
| 20 | Absence of measuring the angle used to calculate the inaccessible distances with a high degree of accuracy. |
| 21 | Using sight distances that bad fit the terrain and are not comfortable for the observer. |
| 22 | Lack of elimination parallax before any readings are made. |
| 23 | Taking measurements at inappropriate times (just before and after noon), where the impact of refraction is greatest. |
| 24 | Turning through side shots to accomplish the work, rather than observing via control points. |
| 25 | Transposing two numbers (in field notes or computer input). |
| 26 | Changing instrument settings or value of constants unintentionally during observing. |
| 27 | Setting up (placing) the instrument or the rod at a wrong point (station). |
| 28 | Using the incorrect values for coordinates or benchmark. |
| 29 | Use incorrect units (feet instead of meters). |
| 30 | Uncertainty of holding the range pole (rod) perfectly in the direction of the plumb line. |
| 31 | Incorrect input value for prism constant or incompatible with the setting of the prism on target when using EDM. |
| 32 | Uncertainty of temporary adjustment (Parallax - setup - centering) when beginning to operate a new instrument. |
| 33 | Lack of honesty among some observers, such as accepting an error greater than what is permitted. |
| 34 | The tripod is not in good condition and some parts are not well fitted |
| 35 | The instrument is not exactly over the point (centering). |
| 36 | Not following different pointing techniques that should be used depending on the type and apparent size of the target. |
| Activity Group (D): Data adjustment works | |
| 37 | Lack of correction or modeling of natural errors in adjustment process. |
| 38 | Absence of necessary corrections due to weather conditions. |
| 39 | Ignoring the ionosphere effect in adjustment on GPS surveying. |
| 40 | Inconsistency precision in angular and linear measurements. |
| 41 | Use of insufficiently accurate computation equations. |
| 42 | Lack of redundant observations to check observations. |
| 43 | End observations without locking on a control point (B.M.) to detect the closed error and ensure that it is permitted. |
Table 3.
Spearman’s correlation coefficient between each of the two indices.
| PI | IIT | IIA | RFIT | RFIA | |
|---|---|---|---|---|---|
| PI | 1 | −0.445 | −0.297 | 0.575 | 0.634 |
| IIT | −0.445 | 1 | 0.129 | 0.312 | −0.411 |
| IIA | −0.297 | 0.129 | 1 | −0.094 | 0.323 |
| RFIT | 0.575 | 0.312 | −0.094 | 1 | 0.388 |
| RFIA | 0.634 | −0.411 | 0.323 | 0.388 | 1 |
Table 4.
Ranking of top ten risk factors in case of time and accuracy of LSPs.
| Rank | Factor No. | RFIT | Activity Group | Rank | Factor No. | RFIA | Activity Group |
|---|---|---|---|---|---|---|---|
| 1 | 23 | 0.361 | C | 1 | 16 | 0.528 | C |
| 2 | 12 | 0.308 | B | 2 | 17 | 0.494 | C |
| 3 | 15 | 0.296 | C | 3 | 33 | 0.445 | C |
| 4 | 14 | 0.280 | C | 4 | 13 | 0.345 | C |
| 5 | 8 | 0.280 | B | 5 | 11 | 0.318 | B |
| 6 | 16 | 0.278 | C | 6 | 30 | 0.310 | C |
| 7 | 17 | 0.274 | C | 7 | 21 | 0.309 | C |
| 8 | 13 | 0.265 | C | 8 | 37 | 0.303 | D |
| 9 | 7 | 0.260 | B | 9 | 15 | 0.299 | C |
| 10 | 10 | 0.257 | B | 10 | 18 | 0.297 | C |
Table 5.
Statistical data for RFIT and RFIA.
| RFIT | RFIA | ||
|---|---|---|---|
| Mean | Activity Group A | 0.14 | 0.04 |
| Activity Group B | 0.20 | 0.22 | |
| Activity Group C | 0.22 | 0.29 | |
| Activity Group D | 0.18 | 0.26 | |
| ALL Factors | 0.21 | 0.26 | |
| Std. Deviation | 0.06 | 0.09 | |
| Minimum Range | 0.05 | 0.03 | |
| Maximum Range | 0.36 | 0.53 | |
Table 6.
Percentage of responsibility of each risk factor.
| Activity Group | Risk Factor No. | Percentage of Responsibility | |||
|---|---|---|---|---|---|
| Chief | Surveyor | Assistance | Office Eng. | ||
| Activity Group A: Reconnaissance Works | 1 | 100 | - | - | - |
| 2 | 100 | - | - | - | |
| Activity Group B: Planning Works | 3 | 100 | - | - | - |
| 4 | 100 | - | - | - | |
| 5 | 50 | 50 | - | - | |
| 6 | 100 | - | - | - | |
| 7 | 100 | - | - | - | |
| 8 | 30 | 70 | - | - | |
| 9 | 50 | 50 | - | - | |
| 10 | 80 | 20 | - | - | |
| 11 | 80 | 20 | - | - | |
| 12 | 100 | - | - | - | |
| Activity Group C: Data collection works | 13 | - | 100 | - | - |
| 14 | - | 100 | - | - | |
| 15 | - | 100 | - | - | |
| 16 | - | 80 | 20 | - | |
| 17 | - | 100 | - | - | |
| 18 | - | 50 | 50 | - | |
| 19 | - | 100 | - | - | |
| 20 | - | 100 | - | - | |
| 21 | - | 100 | - | - | |
| 22 | - | 100 | - | - | |
| 23 | - | 100 | - | - | |
| 24 | - | 100 | - | - | |
| 25 | - | 50 | 50 | - | |
| 26 | - | 100 | - | - | |
| 27 | - | 50 | 50 | - | |
| 28 | - | 100 | - | - | |
| 29 | - | 100 | - | - | |
| 30 | - | 30 | 70 | - | |
| 31 | - | 80 | 20 | - | |
| 32 | - | 80 | 20 | - | |
| 33 | - | 100 | - | - | |
| 34 | - | 100 | - | - | |
| 35 | - | 100 | - | - | |
| 36 | - | 100 | - | - | |
| Activity Group D: Data adjustment works | 37 | - | - | - | 100 |
| 38 | - | - | - | 100 | |
| 39 | - | - | - | 100 | |
| 40 | - | - | - | 100 | |
| 41 | - | - | - | 100 | |
| 42 | 50 | 50 | - | - | |
| 43 | 50 | 50 | - | - | |
Table 7.
Percentage of each responsibility in each activity group and all factors.
| Group | Percentages of Responsibility | |||
|---|---|---|---|---|
| Chief | Surveyor | Assistance | Office Eng. | |
| Activity Group A | 100.0 | - | - | - |
| Activity Group B | 79.0 | 21.0 | - | - |
| Activity Group C | - | 88.3 | 11.7 | - |
| Activity Group D | 14.3 | 14.3 | - | 71.4 |
| ALL Group Factors | 23.2 | 55.4 | 12.5 | 8.9 |
Publisher’s Note: MDPI stays neutral with regard to jurisdictional claims in published maps and institutional affiliations. |
© 2021 by the authors. Licensee MDPI, Basel, Switzerland. This article is an open access article distributed under the terms and conditions of the Creative Commons Attribution (CC BY) license (https://creativecommons.org/licenses/by/4.0/).
Share and Cite
MDPI and ACS Style
Issa, U.; Alqurashi, M.; Salama, I. Qualitative Analysis of Risks Affecting the Delivery of Land Surveying Project Activities. Sustainability 2021, 13, 12645. https://doi.org/10.3390/su132212645
AMA Style
Issa U, Alqurashi M, Salama I. Qualitative Analysis of Risks Affecting the Delivery of Land Surveying Project Activities. Sustainability. 2021; 13(22):12645. https://doi.org/10.3390/su132212645
Chicago/Turabian StyleIssa, Usama, Muwaffaq Alqurashi, and Ibrahim Salama. 2021. "Qualitative Analysis of Risks Affecting the Delivery of Land Surveying Project Activities" Sustainability 13, no. 22: 12645. https://doi.org/10.3390/su132212645
Note that from the first issue of 2016, this journal uses article numbers instead of page numbers. See further details here.