Article

Lookup Tables for Power Generation Performance of Photovoltaic Systems Covering 40 Geographic Locations (Wilayats) in the Sultanate of Oman, with and without Solar Tracking, and General Perspectives about Solar Irradiation

College of Engineering, University of Buraimi, Al Buraimi 512, Oman
Sustainability 2021, 13(23), 13209; https://doi.org/10.3390/su132313209
Submission received: 29 September 2021 / Revised: 17 November 2021 / Accepted: 17 November 2021 / Published: 29 November 2021
(This article belongs to the Special Issue Green Technology and Renewable Energy Projects)

Abstract

:
An energy modeler for solar photovoltaic (PV) systems may be limited to climatic data of certain major cities, not covering the one for which the PV system is intended. Additionally, a person not skilled in solar PV modeling may still desire a quick estimate of PV system electricity generation to help decide the level of investment in PV systems. This work addresses these points by establishing lookup tables to summarize predicted electricity generation, solar irradiation, and optimum orientation at various locations in the Sultanate of Oman. The results are produced by processing simulation data using the online open-access tool PVGIS (Photovoltaic Geographical Information System) of the European Commission’s Joint Research Centre (EC-JRC). The tables cover 40 out of the country’s 61 s-level administrative divisions (wilayats) and cover fixed and movable PV panels. The results show that the yearly electricity generation can change up to 11.86% due to the change of location. Two-axis PV tracking offers a small improvement (about 4% on average) over single-vertical-axis tracking but offers noticeable improvement (about 34% on average) over optimally oriented fixed PV panels. Monthly profiles of expected PV electricity generation, as well as the generation drop due to changing the PV mounting from free standing to building integrated, were examined for three locations. As general perspectives that may be of interest to global readers, this work provides quantitative evidence of the overall accuracy of the PVGIS-SARAH database through comparison with ground-measured global horizontal irradiation (GHI). In addition, a full example is presented considering 12 different countries in the northern and southern hemispheres that brings the attention of solar energy modelers to the level of errors they may encounter when the impact of longitude (thus, the exact location) is ignored for simplicity, while focus is given to the latitude.

1. Introduction

Limiting the global temperature increase to 2 °C above pre-industrial levels (before the intensive industrial activities that started around 1750) demands reaching net-zero carbon emissions by around 2070, while limiting this to 1.5 °C demands an earlier attainment of the net-zero emissions of carbon dioxide by around 2050 [1]. Decarbonization efforts include integrating renewable energy electricity generation from solar photovoltaic (PV) panels, thereby reducing electricity generation from fossil fuels that lead to carbon emissions [2]. In 2019, solar photovoltaic technology contributed about 679 TWh to electricity generation, forming a share of 9.8% among renewable energy sources [3]. The transforming energy scenario of IRENA (International Renewable Energy Agency) calls for an increased share of 25% for the solar photovoltaic technology, representing 13,787 TWh in 2050, in order to restrain the global temperature increase to 1.5 °C and bring carbon dioxide emissions close to net zero by 2050 [4]. It is appealing to see that solar PV power generation increased by 22% in 2019, taking the second position in terms of generation growth among renewable energy technologies (with wind energy technology being in the first position, leading solar PV energy technology by a small gap). Extrapolating the nonlinear accelerating progress in solar PV technology over the period of 2006–2020 suggests that it meets the Sustainable Development Scenario (SDS) of the IEA (International Energy Agency), reaching 3269 TWh in 2030, compared to only 6 TWh in 2006 [5]. Such intensive deployment of solar PV technology as well as the demand for continuous expansion in its utilization warrants a parallel effort in numerically simulating PV systems ahead of installation so that a PV system can be reasonably sized according to the demanded electricity generation at the specific geographic location of operation.
Mathematical models that describe the solar radiation at an arbitrary time or location exist [6,7,8], as well as software programs that enable prediction of the generated electricity from a PV design [9,10,11]. When predicting the electricity generation from complex systems (as compared to a single PV panel or a solar cell) under optimized configuration throughout the year, mathematical equations become impractical alone, and one needs to resort to a computational tool that accounts for different factors affecting the performance of the PV system, while yielding a result in a reasonably short time. Even with the availability of software programs for simulating PV systems, a climatic record is needed for useful prediction. The climatic information is location-dependent, and the simulation tool may come with a database of locations for the user to select from as a convenient way of providing the necessary meteorological data. In the case where the users are interested in a location not in the built-in database, they may need to set the environment to the nearest location available, or the simulation tool may perform interpolation. Either option incurs some approximation that can introduce errors. It can be helpful if pre-calculated one-time lookup tables are made for users, with multiplication factors that help in translating the predicted electricity from a PV system of a certain design type (such as fixed PV panels, single-axis tracking PV panels, and two-axis tracking PV panels) that have records for a large number of geographic locations or communities within a country. Then, a PV system modeler who already predicted the performance of a PV system in one location may use the table to translate the predicted electricity at different location by using the proper factors in the lookup tables that correspond to the specific type of concern. This procedure extends the capability of the simulation beyond the embedded database of locations it has. The lookup tables can be established for arbitrary locations with a spatial resolution that can easily be expanded when needed. They are also not tied to a specific PV simulation tool, simply being tables that correct the yearly PV electricity generation at one location (where the electricity generation is known) so that it corresponds to another location (where electricity generation is sought). In addition, personnel interested in PV systems may use the tables without the need of performing any solar simulation. This relieves the need to have access to a PV simulation tool or to have the technical skills to use it, which may not be readily available to non-experienced persons. The known yearly electricity generation (to be projected or corrected for another location) does not have to come from a simulation tool; instead, it can be an actual measured value [12,13]. In this case, the lookup tables are still useful in providing a quantitative assessment of the performance of such a PV system if replicated in another location. Aside from conveniently projecting the yearly electricity generation to different geographic locations, the lookup tables themselves can include additional location-specific valuable information to PV investors in the public or private sectors (such as the solar irradiation, the expected electricity generation for a standard PV size, and the optimum orientation for fixed PV panels) and also enable convenient quantitative identification of locations of the highest potential for solar power generation, which can be given a priority over other locations. In relation to the previous remarks, this work gives three lookup tables for use in the Sultanate of Oman, corresponding to three categories of PV solar systems, which are:
  • Fixed PV panels with optimum azimuth and tilt;
  • Moving PV panels with vertical-axis solar tracking;
  • Moving panels with two-axis solar tracking.
The Sultanate of Oman (or simply Oman) is administratively divided into 61 s-level administrative divisions (“wilayats” according to the local language) in 11 governorates. The country enjoys relatively high solar radiation [14], making solar energy a primary option for the country in case it decides to reshape its energy mix, having a significant share of renewable energy in it, including solar PV energy, consistent with the country-led renewables readiness assessment (RRA) and long-term electricity transmission system master plan, having an outlook toward 2070 [15]. A map of Oman is given in Figure 1, showing the 11 governorates. The capital Muscat lies in the governorate of Muscat, which is also the name of one of the second-level administrative divisions (wilayats) within that governorate. The figure also highlights the location of three wilayats, in addition to Muscat, which are: Thumrait (in the southern governorate of Dhofar), Madha (in the northern governorate of Musandam), and Adam (in the central governorate of Ad Dakhliya). This can facilitate later discussions about these specific locations, where the first one shows the best PV performance among the 40 analyzed wilayats, the second one shows the poorest performance among the 40 analyzed wilayats, and the third one shows third-party ground-based measurements of monthly global horizontal irradiation (GHI) that are used in validation. For readers not familiar with Oman, these additional details can be very helpful.
The governorates of Oman vary not only in land size, but also in population, terrain, and climate. The governorate of Musandam is an exclave located in the north tip of Oman.
This work considers 40 out of the 61 s-level administrative divisions (the wilayats) of Oman. For simplicity, and since a single point was analyzed per second-level administrative division, they are referred to here as “locations”, which, for the purpose of this work, serves to indicate the geographic points that represent a second-level administrative division selected for photovoltaic analysis and inclusion in each of the lookup tables. In some regions, the locations are relatively close to each other, so not all of them were included in the analysis. However, the number of locations selected for analysis in each governorate never drops below half the number of wilayats in that governorate. Considering 40 wilayats out of the total 61 wilayats appears to give good coverage for Oman. Expanding the analysis to the remaining 21 wilayats is straightforward, although it may lead to some redundancy in the results.
Aside from constructing tables that summarize the relative performance of PV systems in different locations of Oman, this work also provides the year-round optimum orientation angles (azimuth and slope) for fixed PV panels in each analyzed location and the optimum slope angle for single-vertical-axis PV panels with solar tracking. The multiplication factors in the tables are all relative to the PV system electricity generation (alternating-current electricity) in Muscat, which is taken as a reference location and thus assigned the factors 1.00 by definition. This study also provides two normalized performance metrics for PV systems in each analyzed location: the first is the expected yearly PV electricity generated per kWp of installed PV capacity (expressed in kWh/kWp/year), and the second is the yearly global solar irradiation received per m2 of tilted PV panel surface (expressed in kWh/m2/year). The first normalized performance metric helps in evaluating the feasibility of investing in solar PV in Oman through estimating the size of the installed capacity needed. The second metric serves a similar role as the first one, but it is independent of the exact performance characteristics of the envisioned PV system. The work also provides some details about the solar PV electricity generation at the best-performing and the lowest-performing locations identified among the analyzed ones, as well as the reference location of Muscat, representing the capital of the country.

2. Methods

The study is primarily quantitative. It is primarily an analysis of secondary data and third-party validated solar PV web-based tools that are freely accessible to the public and are well documented. The tools are collectively referred to as the PVGIS (Photovoltaic Geographical Information System) web application, which includes a calculator for solar irradiation and PV electricity generation. It is hosted at the European Commission’s science and knowledge service (EU Science Hub) and developed by the Joint Research Centre (JRC) of the European Commission [18]. The version used here is the 5th version, which is the latest version at the time of preparing this article. PVGIS has 5 solar radiation databases. However, the one that covers Oman and was used in the current study is PVGIS-SARAH. It is a data set calculated from satellite images, and covers the whole Sultanate of Oman, along with Africa, most of Europe, more than half of Asia, approximately the eastern half of South America, and a small zone in the west of Australia. The data in PVGIS-SARAH database cover the years from 2005 to 2016. Their spatial resolution is 0.05° (latitude) and 0.05° (longitude) [19], which, near the equator, translates to a grid of squares with a side length of about 5.5 km. The PVGIS-SARAH database was prepared through cooperation between members at PVGIS and at CM SAF (Satellite Application Facility on Climate Monitoring), which provides satellite-based data suitable to monitor the climate [20]. PVGIS was subject to data validation for the used satellite solar radiation data. Comparison with ground station measurements shows generally good agreement between the ground station data and the PVGIS-SARAH database [21,22,23,24,25], which is the one used in the current study for Oman. Most of the benchmarking data for validation came from the Baseline Surface Radiation Network (BSRN), which is a project for detecting change in solar and atmospheric radiation at the surface of the Earth, and that project belongs to the World Climate Research Programme (WCRP). The project’s instruments are of the highest possible accuracy and provide high time resolution (from 1 to 3 min) [26].
The PVGIS application was utilized in calculating PV performance data for 40 locations in the Sultanate of Oman. When selecting these locations, attention was paid to cover a large geographic area of the country, while limiting the locations to the official second-level administrative divisions (wilayats). This is an advantage for the locations’ selection, helping in aligning them with places where social communities typically exist.
Table 1 lists the wilayats selected for solar PV analysis. They are grouped by governorate, starting with the most-populous governorate (Muscat) and ending with the least-populous governorate (Musandam), based on recent governmental records dated August 2021 [27]. The number of wilayats in each governorate [28] and the number of selected wilayats for analysis in each governorate are also listed in the table. In total, 40 wilayats were selected out of the country-level total of 61 [29]. At minimum, either three or half of the number wilayats in each governorate is selected, whichever is larger. The governorates of Adh Dhahirah and Al Buraimi have 3 wilayats each, and thus all of them were included in the analysis. Using an official map of Oman [30] to inspect visually the separation distance among wilayats, some wilayats were excluded when found lying close to an already-selected wilayat. The first wilayat listed for each governorate is the administrative capital of that governorate. Then, when adding more wilayats, generally a more distant wilayat has priority of inclusion in the analysis, which helps in improving the geographic coverage of the study. The governorate of Dhofar is large in terms of the land area and is also relatively populous; it has the largest number of selected wilayats (seven) for solar PV analysis compared to other governorates. The governorate of Al Wusta is also large in terms of the land area, and all its 4 wilayats were selected in the analysis despite being the second least populated governate in Oman.

3. Results

The performed PV solar simulations using the PVGIS tools assume crystalline silicon (c-Si) panels, which is the dominant technological type of PV panels [31,32,33], and a system loss of 14% (the default value in PVGIS). Such a system loss accounts for losses in cables and power inverters, for example, as well as any dirt on the panels [34]. The simulations performed for the design type of a fixed PV system with optimum orientation of the PV panels are for free-standing mounting, as compared to building integrated, so the virtual PV panels are supported by a frame allowing air to flow over the panels’ back side.
Although the lookup tables are essential outcomes of this study, it may be better to move them to Appendix B, separated from the main text, while describing them in the present section. There are three lookup tables, each of them corresponding to a design type of the PV system.

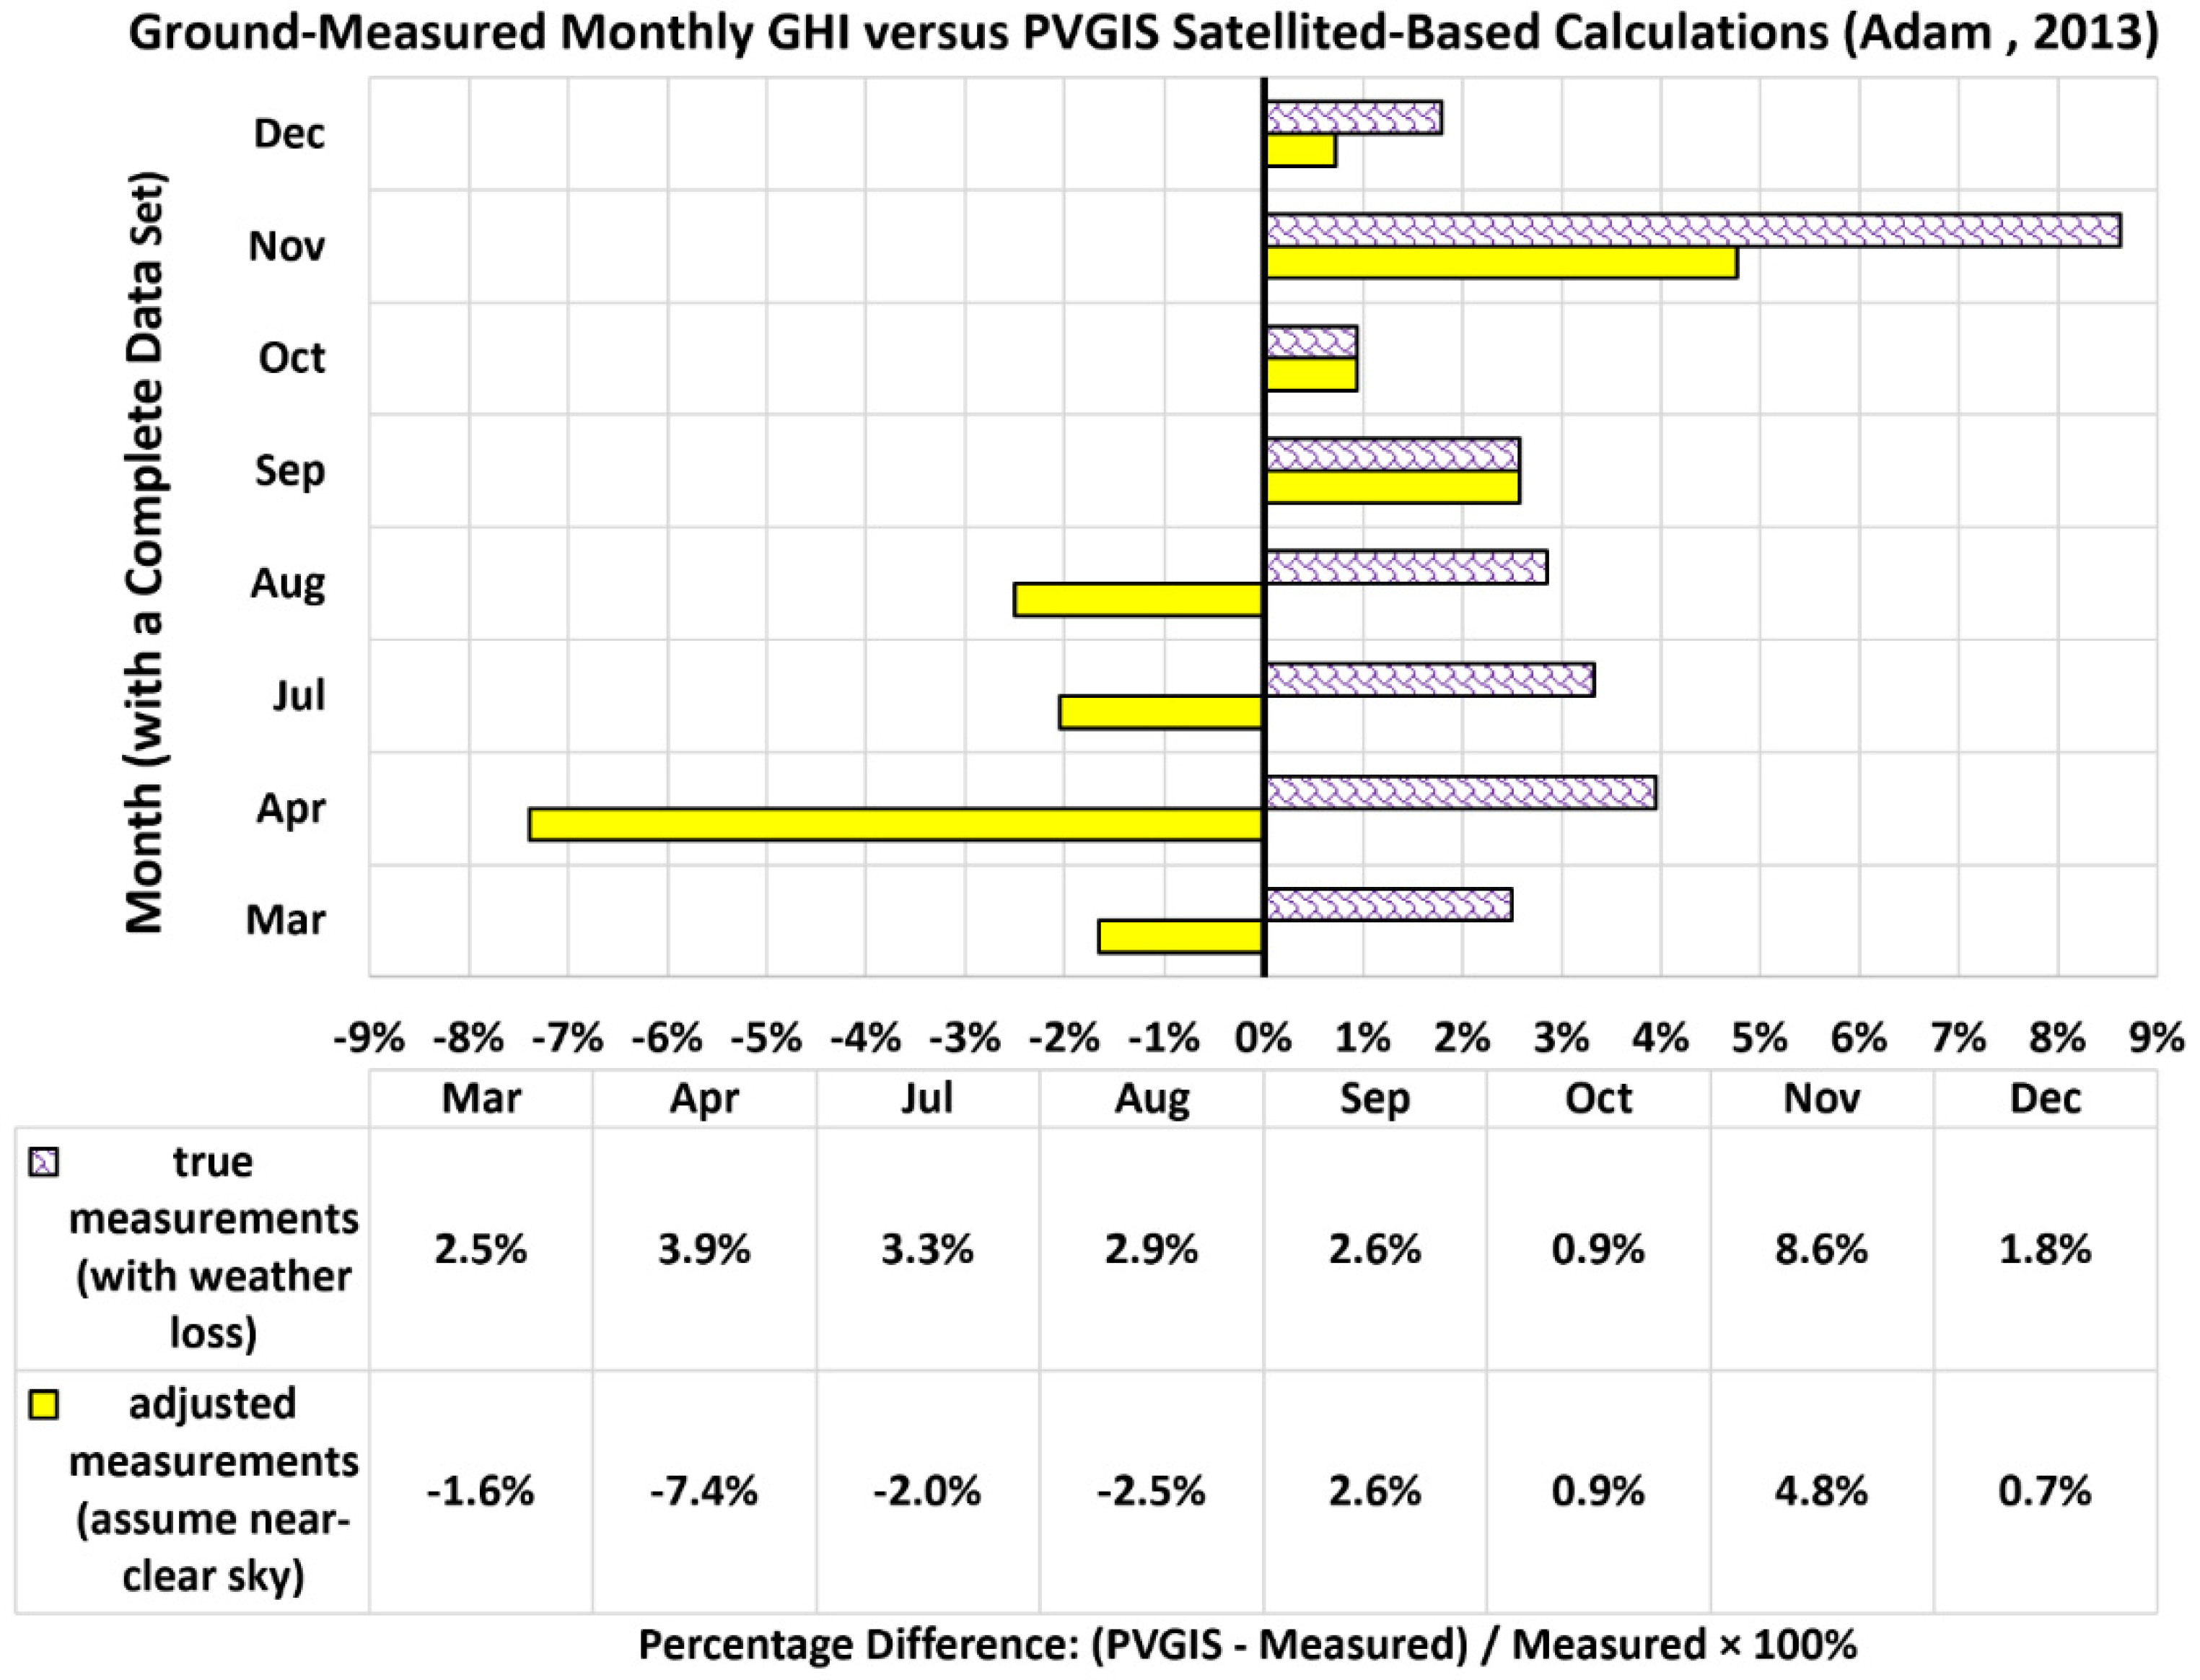
3.1. Validation against Third-Party Calculated Results

This subsection presents a validation test for one of the solar calculator tools of PVGIS. This is different from the independent validation studies mentioned in the previous section. The validation is performed in terms of predicting the yearly electricity generation for 1 kWp of installed PV capacity, as well as the received solar radiation per 1 m2 of the tilted PV panel surface in the location representing the capital Muscat, with a fixed optimized orientation of PV panels. These four simulation quantities are compared when obtained from PVGIS and from another online solar calculator, which is the Global Solar Atlas (GSA), a free tool provided by the World Bank Group [35].
The validation comparison is given in Table 2. The optimum slope (the tilt angle from the horizontal) suggested by PVGIS is only 1 degree smaller than that suggested by GSA. It should be mentioned that both tools report the slope angle in whole degrees. The angles are reasonable, as they should be close to (but not necessarily equal to) the latitude of the location [36] (which is 24° in the test case, after rounding to the nearest integer). Both tools agree on the suggested optimum azimuth angle of the PV panels in Muscat, showing that the PV panels should be facing the south exactly. This is a reasonable azimuth given that Muscat’s selected analysis location is in the northern hemisphere [37], and it is not surrounded by excessive mountains that may cause some bias toward the west or the east. As a remark, the azimuth angle in PVGIS for the south is expressed as 0°, whereas it is expressed as 180° for GSA, given the different reference of measurement in both tools (the south for PVGIS, but the north for GSA). The yearly PV electricity generated for 1 kWp of PV capacity is very close for PVGIS and GSA, differing by only 10.2 kWh/kWp/year, which is 0.6% of either value. The estimated solar radiation differs by 123.3 kWh/m2/year for the two tools, which is about 5% of either value.

3.2. PV Design Type 1: Fixed Optimized Orientation

Table A3 is the lookup table for the PV design type with fixed orientation where the photovoltaic panels are installed with the optimized azimuth angle (the direction in which the panels face in the horizontal plane) and the optimized slope angle (the tilt above the horizontal plane) for maximum cumulative yearly radiation received by a unit area of the photovoltaic panels, considering the whole year rather than a specific season. These optimized angels are reported as integer values by PVGIS.
For the analyzed locations, the optimized slope ranges from 20° (in multiple locations) to 26° (in Al Rustaq and in Dibba), with a range of 6°. In relation to this, the latitude angle for the analyzed locations varies from 16.70° (in Dhalkut) to 26.18° (in Khasab), with a range of 9.48°. Figure 2 shows how the slope changes with the latitude for all the analyzed locations. A linear regression model is moderately fitting the data.
For the optimized PV azimuth, it is at or close to due south, with a small east–west deviation range of 16°. The most east-biased azimuth corresponds to the location of Madha (in Musandam governorate), being 11° toward the east. The most west-biased azimuth corresponds to the location of Salalah (in Dhofar governorate), being 5° toward the west. The profiles of the horizon height (expressed as an angular distance, in degrees) for both locations are compared in Figure 3. The deviation from due south in the case of Salalah is small and can be attributed to small differences in the solar radiation between the morning and the afternoon intervals.
Figure 4 shows a calculated typical hourly profile of irradiance on the fixed optimally oriented PV panels in Salalah, calculated by one of the PVGIS online tools (AVERAGE DAILY IRRADIANCE DATA). The profile is not perfectly symmetric around the point of maximum irradiance, supporting the presence of a small difference in the cumulative received radiation before and after the solar noon. The deviation from due south in the case of Madha can be partly attributed to a relatively high horizon in the west part compared to the east part, leading to an early virtual sunset, with the sun no longer sending direct normal irradiance (DNI) to the PV panels from the west side, which makes the east side more favorable. In the case of Salalah, the yearly PV electricity production per kWp installed decreased from 1814.37 kWh/kWp/year to 1813.56 kWh/kWp/year (keeping the optimum slope as 21°), which is a trivial drop of less than 1 kWh. In the case of Madha, the yearly PV electricity production per kWp installed decreased from 1753.99 kWh/kWp/year to 1750.46 kWh/kWp/year (keeping the optimum slope as 24°). This is a small drop of only 0.2%.
Concerning the normalized electricity generation (per kWp and year) for the analyzed locations, it ranges from 1753.99 kWh/kWp/year in Madha (in the northern exclave governorate of Musandam) to 1959.43 kWh/kWp/year in Thumrait (in the southern governorate of Dhofar), with a gap of 205.44 kWh/kWp/year between them. The average value of the normalized electricity generation over all analyzed locations is 1845.75 kWh/kWp/year.

3.3. PV Design Type 2: Single-Vertical-Axis Solar Tracking

The lookup Table A4 summarizes results for the PV design type with single-axis solar tracking, where the PV panels (which are tilted at an optimized slope) are able to rotate around a vertical axis. This means that the azimuth can change during the day, but the slope has to be fixed during that rotation.
The optimized slope in this type was found to vary over a narrow range from 46° to 49°. The slope is higher than it was with a fixed optimized azimuth (design type 1).
The normalized electricity generation for the analyzed locations ranges from 2181.92 kWh/kWp/year in Madha to 2559.34 kWh/kWp/year in Thumrait, with a gap of 377.42 kWh/kWp/year between them. The average value of the normalized electricity generation over all analyzed locations is 2373.68 kWh/kWp/year, which is 1.286 times its corresponding value for the fixed optimized azimuth (design type 1).

3.4. PV Design Type 3: Two-Axis Solar Tracking

The lookup Table A5 summarizes results for the PV design type with two-axis solar tracking, where the PV panels are able to rotate around both the vertical axis and the horizontal axis, thus receiving the solar rays perpendicularly all the time. This means that losses due to the imperfect orientation of PV panels are eliminated, since the PV orientation is continuously optimized [38].
The normalized electricity generation for the analyzed locations ranges from 2254.12 kWh/kWp/year in Madha to 2674.22 kWh/kWp/year in Thumrait, with a gap of 420.1 kWh/kWp/year between them. The average value of the normalized electricity generation over all analyzed locations is 2471.57 kWh/kWp/year, which is 1.339 times its corresponding value for the fixed optimized azimuth and 1.041 times its corresponding value for single-vertical-axis tracking.

3.5. Some Monthly Profiles of PV Electricity

The location (or wilayat) of Madha consistently gave the lowest normalized electricity generation among all the locations examined for the three design types of PV systems, whereas the location (or wilayat) of Thumrait consistently gave the highest normalized electricity generation. In addition, the improvement in the normalized electricity generation when upgrading from single-vertical-axis tracking to two-axis tracking was much smaller compared to upgrading from optimized fixed orientation to single-vertical-axis. Not only did the average normalized electricity increase when upgrading the PV design type, but the gap in the normalized electricity (difference between its maximum in Thumrait and its minimum in Madha) also increased.
Figure 5, Figure 6 and Figure 7 give some insight about these findings, through examining the monthly profile of the normalized electricity generation for the three PV design types, while considering the location of highest performance (Thumrait) and the location of lowest performance (Madha). Muscat is also included in the figures, and it has an intermediate performance lying between the two extremum locations. The months of October–March contribute largely to the difference of yearly PV electricity generation among the three locations, whereas the monthly electricity generation during April–September is not significantly different among the three locations. In the months of October–March, the sun has relatively low altitudes, and a place like Madha with high horizon heights is adversely affected by less direct solar irradiation to PV panels, regardless of the presence of tracking. With no exception to the months of the year or locations of the three discussed here, the monthly gain due to upgrading from fixed optimized orientation to single-vertical-axis tracking is noticeably larger than the monthly gain when upgrading from single-vertical-axis tracking to two-axis tracking, with the ratios of the two monthly gains for the three locations and the 12 months (total 36 ratios) ranging between 3.45 and 11.39. Additionally, for each month in October–March, the gap in the monthly PV electricity generation between Madha and Thumrait is increased in either level of upgrade.

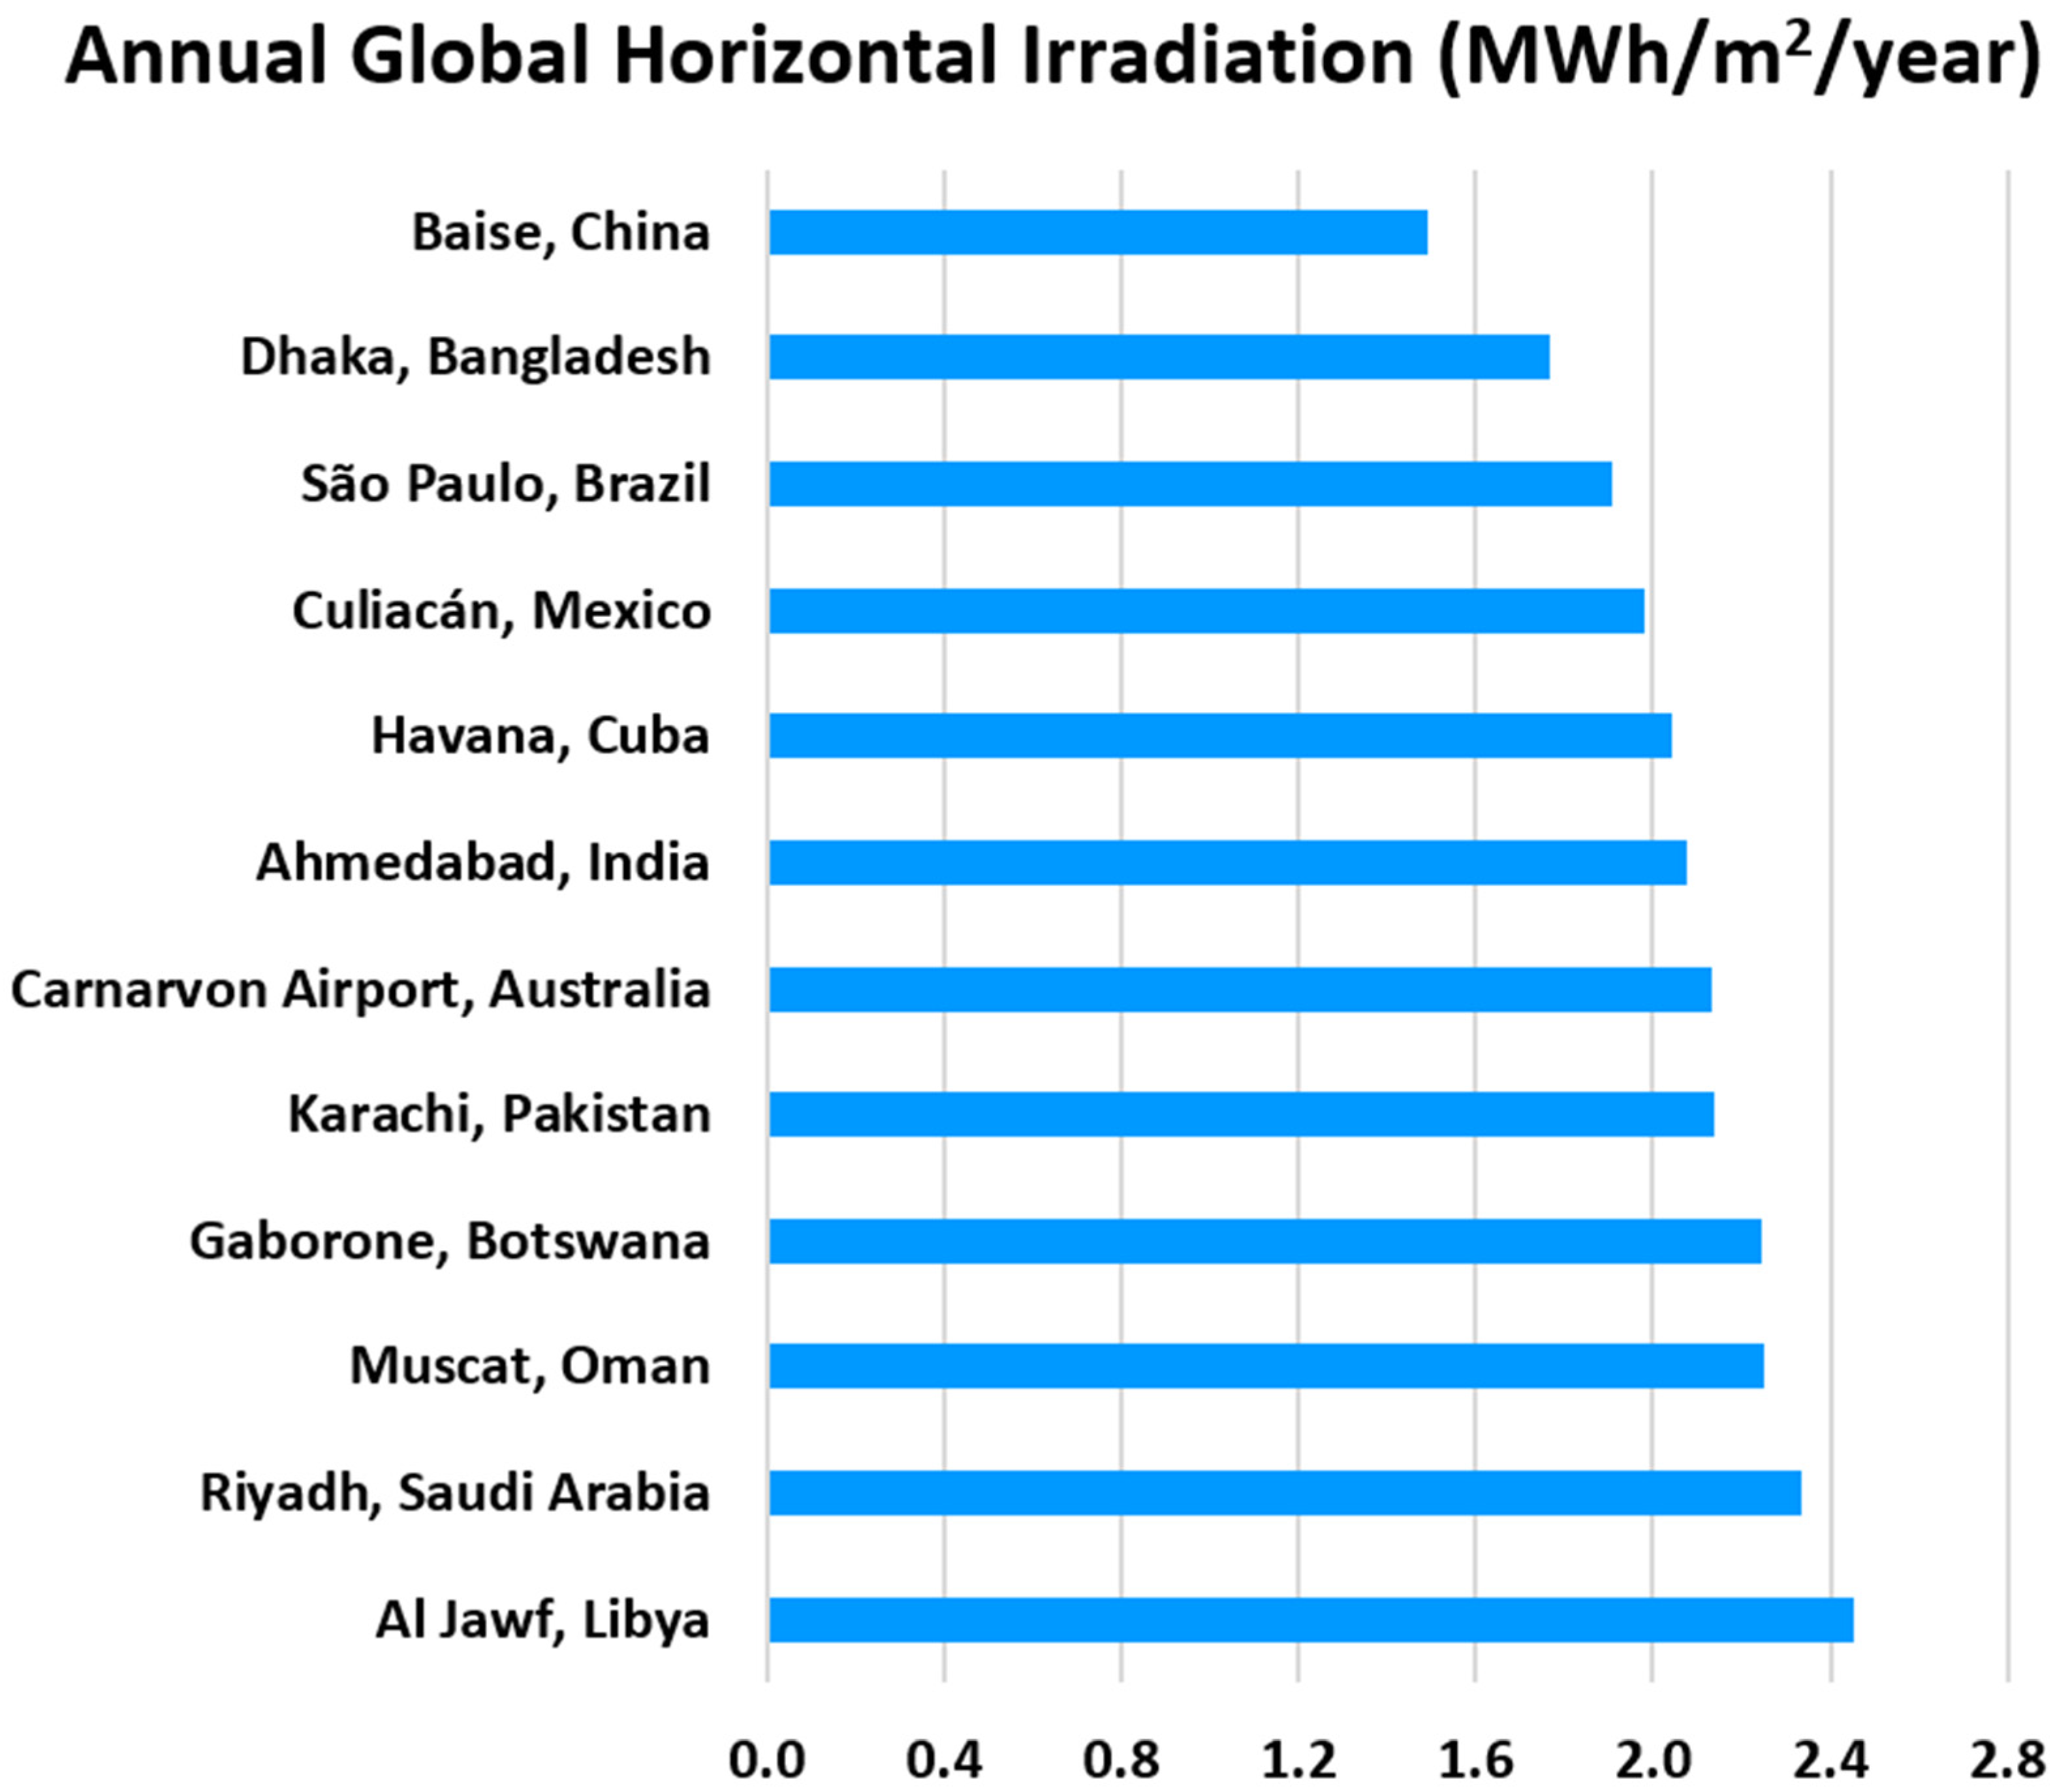
3.6. General Perspectives and Remarks about Contributions

This work has a focus on the Sultane of Oman, establishing a numerical multi-aspect discrete-point map of its photovoltaic-based electricity generation potential, which may be considered as a local contribution at the country level. This is different from continuous two-dimensional maps [39] that are excellent in quickly showing spatial variations and zones of peak performance, but not as accurate and useful as lookup tables when a designer is in need of precise numbers at a precise point. While the raw data itself used in the work are not novel, their analytics (collection, organization, processing, checking, visualization) results in a novel output for the local reader.
Considering global readers, they may still benefit from the earlier part through exposure to web-based modeling tools and their capabilities (in case they are not already familiar with them) and through the suggested relation between the optimum slope for fixed PV panels and the latitude. Additionally, the asymmetry in solar irradiance during the day and the impact of horizon discussed here bring specific examples of features influencing solar-power performance that are applicable globally.
In the current subsection, the non-local contribution of this work is strengthened in two ways: first, through presenting a conducted validation of PVGIS calculations against monthly ground-measured global horizontal irradiation (GHI), which also tests the ability of the PVGIS tool in capturing weather disturbances.
As with the PVGIS data, the measurements used here are not proprietary. They were published openly by the Oman Power and Water Procurement Company (OPWP) [40], which is the sole entity involved in purchasing electricity and water for all independent power projects (IPPs) or independent water and power projects (IWPPs) in the Sultanate of Oman [41]. OPWP is in charge of ensuring that the needs of electricity and water in the Sultanate of Oman are met, with adequate supply of electricity and water, at competitive prices. OPWP is part of the Nama Holding Company (previously called Electricity Holding Company), which is a joint stock governmental company, having a share in multiple companies operating collectively in the fields of the procurement, generation, transmission, and distribution of electricity and water within the Sultanate of Oman [42,43].
The experimental study reports the measured average daily global horizontal irradiation (GHI), expressed in kWh/m2/day for 11 months in 2013 (all months in that year except the month of January). Here, the months of February, May, and June were excluded despite having reported data. The reason is that the data sets for these months are not complete (some days of the month do not have collected data). The remaining 8 months in 2013 with complete GHI solar irradiation measurements are March, April, July, August, September, October, November, and December. The data used here come from the Adam meteorological station. Adam is one of the 40 wilayats analyzed here in terms of PV performance (in the governorate of Ad Dakhliya). The experimental daily GHI measurement is converted into a monthly value by multiplying it by the number of days in the month (either 30 or 31). This makes the unit of the resulting number kWh/m2/month, which is consistent with a tool in PVGIS used to calculate the GHI at the location representing Adam here (latitude: north 22.379167° N, longitude: east 57.526944° E). The PVGIS tool used here is called (MONTHLY IRRADIATION DATA), and it reports monthly GHI in kWh/m2/month. The PVGIS data correspond to the same year of the measurements, which is 2013.
The experimental data are based on true measurements, which reflect weather irregularities (overcast and rainfall). Corrections were also reported in the third-party experimental study of OPWP to enable the construction of fictitious GHI values assuming nearly clear days. The correction is performed here, and the adjusted experimental monthly GHI values were obtained. Such corrections are not applicable for the months of September and October, because no important weather irregularities were observed and the true measured GHI and the adjusted measured GHI are considered the same.
The percentage difference between the PVGIS-based GHI and the experimental GHI is calculated as in Equation (1):
Percentage   Difference   =   PVGIS   Value     Meaured   Value Measured   Value × 100 % .
With respect to the true measurements, all the individual monthly percentage differences are positive, which means that the calculated values of GHI exceed the experimental GHI values. Nevertheless, considering all 8 months, the average of the percentage differences is 3.32%, which is relatively small. With respect to the adjusted measurements, half of the individual monthly percentage differences are positive, and the other half is negative. The average of the absolute values of the percentage difference for the 8 months is 2.82%. The individual monthly percentage differences are shown in Figure 8.
As another component in the present work that goes beyond the local scope of Oman and can be beneficial for global readers, the current part examines the longitude-dependence of solar irradiation (while having the latitude nearly fixed, thus having similar distances from the equator) on a large geographic scale. This component is conducted by selecting additional locations outside Oman with a latitude lying between 23° and 25° (regardless of being in the northern hemisphere or the southern hemisphere), similar to Muscat in Oman, and comparing the annual global horizontal irradiation (GHI) in MWh/m2/year and the annual direct normal irradiation (DNI) in MWh/m2/year among them, as predicted by PVGIS (obtained by summing the 12 monthly values in the same year, from January to December). A large variability calls for attention among solar energy modelers who may rely on simple equations for incoming annual solar radiation that heavily depends on the latitude (while not taking into account other secondary factors, such as the terrain, cloud cover, and horizon heights).
In addition to Muscat (the Capital of Oman and one of the 40 local locations analyzed here), the additional foreign locations are distributed in different countries (one location per country) in North America, South America, Africa, Asia, and Australia. Out of the total of 12 international locations, three are in southern hemisphere (such as Gaborone, the capital of Botswana in Africa) and the remaining nine locations are in the northern hemisphere (such as Culiacán, a city in northwestern Mexico, and Dhaka, the capital of Bangladesh). More details about these 12 locations (the latitude, the longitude, and the elevations) are provided in Table A2 in Appendix A.
Nearly all the additional foreign locations were analyzed using the PVGIS-SARAH data set (which is the data set used for the 40 wilayats in Oman in the earlier locally focused part of this work) except Culiacán (Mexico) and Havana (the capital of Cuba), where PVGIS-SARAH is not applicable. Instead, the data set of PVGIS-NSRDB was used. PVGIS-NSRDB has a finer spatial resolution than PVGIS-SARAH (latitude × longitude: 0.038° × 0.0.38°, compared to 0.05° × 0.05° for PVGIS-SARAH), but its end year is 2015 (as compared to 2016 for PVGIS-SARAH). The calculated annual GHI and DNI here are for the last year available in the data set, which is either 2016 for PVGIS-SARAH or 2015 for PVGIS-NSRDB.
Figure 9 presents the annual GHI for the 12 locations in the selected 12 countries, ordered from smallest (top) to largest (bottom). The largest-to-smallest GHI ratio is 1.64. Al Jawf in Libya (North Africa) has the largest GHI, which is slightly above the annual GHI of Muscat (with a ratio of 1.088). Muscat comes in the third position when ordering the GHI in a descending order.
Figure 10 presents the annual DNI for the same 12 locations selected in 12 countries, following the same order as in the previous figure (ascending order of GHI). The largest-to-smallest DNI ratio is 2.77, which is significant and reflects a more intensive variability in DNI than in GHI. Al Jawf in Libya has the largest DNI (as was the case for GHI), which is 1.157 times the DNI of Muscat. Muscat comes in the fifth position when ordering the DNI in a descending order.

4. Discussion

This section gives some remarks about the results of the study. The first remark concerns the results’ generality. For the presented suggested optimized slope, optimized azimuth, and normalized solar irradiation, they should be stable in terms of not being influenced by the selected simulation parameter. On the other hand, the normalized PV electricity generation corresponds to a given mounting type and a specified system loss. In the case of the Muscat location, the building-integrated mounting was predicted to result in a lower normalized PV electricity generation of 1725.1 kWh/kWp/year as compared to 1809.44 kWh/kWp/year under free-standing mounting with fixed optimized PV orientation, which means a drop of 84.34 kWh/kWp/year (thus 4.66% relative to the free-standing case). If the mounting type changes from free standing to building integrated, the normalized PV electricity generation drops from 1753.99 kWh/kWp/year to 1675.79 kWh/kWp/year for Madha (a drop of 78.20 kWh/kWp/year or 4.46% relative to the free-standing case) and from 1959.43 kWh/kWp/year to 1874.35 kWh/kWp/year for Thumrait (a drop of 85.08 kWh/kWp/year or 4.34% relative to the free-standing case). Based on these cases, deducting 80 kWh/kWp/year from the free-standing normalized electricity generation appears to be a reasonable way to estimate the building-integrated normalized electricity generation. This drop in normalized PV electricity generation can be justified by the lower cooling of the PV panels in the case of building-integrated mounting, thereby increasing the panels’ temperature and decreasing their ability to generate electricity [44]. The influence of mounting and preset system loss is relatively mitigated by the relative performance multiplication factors provided in the lookup tables, where the PV electricity generation in a location is expressed in relation to its (hypothetical) counterpart in Muscat. This is because the PV electricity generation in both conditions was predicted under the same simulation settings.
The second remark is about the use of the relative-performance multiplication factors, relating the solar PV electricity generation in a general analyzed location to the reference one of Muscat. While any location among those analyzed can serve as a reference for others, Muscat is the capital of the Sultanate of Oman, and it is a good candidate for setting a common base value. One multiplication factor is provided in the lookup tables with the name Translation Factor (X to Muscat), which manifests its role in translating or projecting the solar PV electricity generation from one location to another. The letter “X” refers to any location among the 40 analyzed ones in the Sultanate of Oman. The factor (X to Muscat) is a scaling value assigned to one location, such that when it is multiplied by the PV solar electricity in that location, one obtains an expected PV solar electricity in Muscat for the same PV system. Dividing by that factor serves the opposite function: scaling the yearly electricity generation in Muscat to its expected value in case the same PV system is translated from Muscat to another location “X”.
For example, if a solar PV system with a fixed optimized PV orientation is located in Madha and was found to generate 800 kWh of electricity yearly, and then it is translated to Muscat, it is expected to produce 800 × 1.0316 = 825.28 kWh yearly. The number (1.0316) is the translation factor (X to Muscat) for Madha in the lookup table under the fixed optimized-orientation PV design type. As another example, if a solar PV system with a fixed optimized orientation is located in Muscat and was found to generate 800 kWh of electricity yearly, and then it is translated to Thumrait, it is expected to produce 800 ÷ 0.92345 = 866.32 kWh yearly. The number (0.92345) is the translation factor (X to Muscat) for Thumrait under the fixed optimized-orientation PV design type. Translating the yearly electricity generation from one location to another when both locations are not Muscat involves a multiplication with the (X to Muscat) translation factor for the source location combined with a division by the (X to Muscat) translation factor for the destination location. For example, if a solar PV system with a fixed optimized orientation is located in Madha and was found to generate 800 kWh of electricity yearly, and then it is translated to Thumrait, it is expected to produce 800 × 1.0316 ÷ 0.92345 = 893.7 kWh yearly. The numbers (1.0316) and (0.92345) are interpreted here exactly as they were interpreted earlier. The translation (or projection) process is not limited to a system size (no need to restrain them to 1 kWp of installed PV capacity) but should be applied to a one-year interval (to adjust yearly electricity generation).
The largest relative deviation in the predicted yearly PV electricity generation due to translating a PV system from one place to another among those analyzed in the present study is simply obtained through dividing the largest (X to Muscat) translation factor by the smallest (X to Muscat) translation factor in the same lookup table. As a special case in the present study, the largest (X to Muscat) translation factor is always the one corresponding to the wilayat of Madha, while the smallest (X to Muscat) translation factor is always the one corresponding to the wilayat of Thumrait. The largest relative deviations are as follows:
  • For fixed optimized orientation: 1.0316 ÷ 0.92345 = 1.117 (or 11.17% increase);
  • For single-vertical-axis tracking: 1.0716 ÷ 0.91358 = 1.173 (or 11.73% increase);
  • For two-axis tracking: 1.0800 ÷ 0.91032 = 1.186 (or 11.86% increase).
These extreme-case values are not very large, suggesting that the location alone is not a key element in improving solar PV generation in the Sultanate of Oman. Considering all 3 PV design types and all 40 analyzed locations (thus, a total of 120 cases), the highest predicted normalized PV electricity generation is that for Thumrait with two-axis solar tracking, which is 2674.22 kWh/kWp/year, while the lowest predicted normalized PV electricity generation is that for Madha with fixed PV optimized orientation, which is 1753.99 kWh/kWp/year. The ratio of the two overall extreme values is 1.5246.
As a third remark, while the current study pays special attention to the Sultanate of Oman in terms of lookup tables and graphical results, the procedure of establishing these results is not restrained to a specific country or region. In addition, the tools needed to build the lookup tables for certain locations of interest are made available to the public and involve a validated solar simulation application. Thus, the present study can be useful to both a local audience in the Sultanate of Oman and an overseas audience outside.

5. Conclusions

This study may be viewed as a collection of data related to the expected performance of solar photovoltaic (PV) systems in the Sultanate of Oman, providing quick estimates of normalized input irradiation (in kWh of radiative energy for 1 m2 of tilted photovoltaic panels area and over one year) and normalized output electricity generation (in kWh of electric energy for 1 kWp of installed photovoltaic power and over one year) in more than half of the second-level administrative divisions (wilayats) of the country. The reader does not need to have technical background in solar simulation and does not need to perform complicated data analysis. The results are normalized, making them easy to scale to applications of specific size through one simple arithmetic operation. Additionally, the PV electricity generation in one location can be projected to another. In addition, the optimum slope and azimuth for fixed PV panels are given for each location.
Three lookup tables were established, corresponding to three design types of PV panels, being (1) fixed optimized slope and azimuth, (2) single-vertical-axis solar tracking, and (3) two-axis solar tracking. The upgrade from the fixed optimum slope and azimuth to the single-vertical-axis tracking has much more improvement than the upgrade from the single-vertical-axis tracking to the two-axis tracking.
The location of Madha (an exclave zone in the north of Sultanate of Oman) was found to have the least expected electricity generation, whereas the location of Thumrait (in the south of Sultanate of Oman) was found to have the best expected electricity generation. These rankings for both locations are irrespective of the PV design type. The monthly electricity generation was examined for both locations.
The study focused on free-standing PV mounting. However, the study indicates that it can be enough to subtract 80 kWh/kWp/year from the normalized PV electricity generation for the PV design type of fixed optimized orientation to reach an estimate for building-integrated PV mounting.
A brief benchmarking test was conducted, comparing PVGIS to GSA (Global Solar Atlas) in the case of the fixed optimized slope and azimuth for Muscat.
When comparing PVGIS calculations of monthly global horizontal irradiation (GHI) for 8 months in 2013 with ground-measured values in a meteorological station in Oman, reasonable performance was observed overall. The percentage differences (with the measurements taken as a reference) ranged from 0.9% (October) to 8.6% (November).
The GHI and the direct normal irradiation (DNI) calculation capability in PVGIS were used to estimate the variability in annual solar irradiation with the longitude (while keeping the latitude within a narrow zone of only 2 degrees). Moderate variation was found in the GHI, but remarkable deviations were found for the DNI among 12 locations (including Muscat) in 12 countries that were analyzed. This step shows the importance of using detailed solar energy modeling tools and not relying on simplified models when predicting the performance of a solar system at a large commercial scale.

Funding

This research received no external funding.

Institutional Review Board Statement

Not applicable.

Informed Consent Statement

Not applicable.

Data Availability Statement

Publicly available datasets were analyzed in this study. These data may be found in links provided in relevant references in this article, such as [35,40,45,46].

Acknowledgments

The National Centre for Statistics and Information of the Sultanate of Oman is highly thanked for quickly (after only one hour) clarifying that no permission is needed from them to use their maps, which were used to construct the map included in the study for the Sultanate of Oman, forming an important component of this study, especially for those not very familiar with the country.

Conflicts of Interest

The author declare no conflict of interest.

Appendix A

The first part of this appendix is devoted to giving some geographic information about the 40 selected local locations (wilayats) in the Sultanate of Oman for the solar PV analysis in the current study. The second part of this appendix gives a similar set of information about the 12 selected international locations in 12 different countries in the world (including the Sultanate of Oman), to examine the variability in solar irradiation even with similar latitudes.
For each location, the latitudes and longitudes [45] are listed in the degrees, arcminutes, arcseconds format (DDMMSS), and the elevations are also given in meters [46]. Each latitude/longitude coordinate pair was verified to lie in the corresponding wilayat using Google Maps [47].
Table A1. Geographic information about the locations selected for solar PV analysis in the Sultanate of Oman.
Name of Selected WilayatLatitude
(Degrees, Arcminutes, Arcseconds)
Longitude
(Degrees, Arcminutes, Arcseconds)
Elevation (m)
MuscatN 23°35′2″E 58°24′28″17
QurayyatN 23°15′46″E 58°55′12″7
A’SeebN 23°40′13″E 58°11′20″6
SoharN 24°20′50″E 56°42′33″11
Al SuwaiqN 23°50′58″E 57°26′19″6
ShinasN 24°44′33″E 56°28′1″2
NizwaN 22°56′0″E 57°32′0″507
AdamN 22°22′45″E 57°31′37″284
SamailN 23°17′54″E 57°57′11″402
Al HamraN 23°6′54″E 57°17′29″649
Al RustaqN 23°23′27″E 57°25′28′344
BarkaN 23°40′43″E 57°53′9″13
Wadi Al Ma’awilN 23°27′51″E 57°49′18″212
SalalahN 17°0′54″E 54°5′32″16
MuqshinN 19°29′53″E 54°50′36″113
Shalim and the Hallaniyat IslandsN 18°6′9″E 55°39′12″269
DhalkutN 16°42′14″E 53°14′31″9
Al MazyonaN 17°50′18″E 52°39′37″504
ThumraitN 17°40′12″E 54°2′0″454
SadahN 17°3′0″E 55°4′0″44
SurN 22°34′0″E 59°31′44″7
MasirahN 20°39′2″E 58°52′22″12
Jaalan Bani Bu AliN 22°0′56″E 59°20′1″92
IbraN 22°41′26″E 58°32′0″436
Al MudhaibiN 22°34′13″E 58°7′16″401
Wadi Bani KhalidN 22°34′48″E 59°5′35″600
BidiyaN 22°26′25″E 58°47′57″290
IbriN 23°13′32″E 56°30′56″361
YankulN 23°35′11″E 56°32′22″546
DhankN 23°33′1″E 56°15′26″342
Al BuraimiN 24°15′3″E 55°47′35″298
Al SunaynahN 23°36′23″E 55°57′16″255
MahdahN 24°24′1″E 55°58′1″426
HaimaN 19°57′33″E 56°16′32″135
DuqmN 19°39′43″E 57°42′13″4
Al JazerN 18°32′42″E 56°21′36″144
MahoutN 20°42′0″E 57°55′19″40
KhasabN 26°10′47″E 56°14′51″11
DibbaN 25°38′11″E 56°15′57″1
MadhaN 25°16′53″E 56°18′57″97
Table A2. Summary of location from different countries with similar distances from the equator.
LocationCountryLatitude
(Degrees, Arcminutes, Arcseconds)
Longitude
(Degrees, Arcminutes, Arcseconds)
Elevation (m)
Al JawfLibyaN 24°11′56″E 23°17′27″391
RiyadhSaudi ArabiaN 24°41′15″E 46°43′18″612
MuscatOmanN 23°35′2″E 58°24′28″17
GaboroneBotswanaS 24°39′16″E 25°54′30″1013
KarachiPakistanN 24°51′38″E 67°0′37″10
Carnarvon AirportAustraliaS 24°52′50″E 113°40′19″5
AhmedabadIndiaN 23°1′32″E 72°35′14″55
HavanaCubaN 23°7′58″W 82°22′58″37
CuliacánMexicoN 24°47′25″W 107°23′16″92
São PauloBrazilS 23°32′51′W 46°38′10″784
DhakaBangladeshN 23°42′37″E 90°24′26″17
BaiseChinaN 23°53′59″E 106°36′48″134

Appendix B

This appendix provides three tables (lookup tables), which are summaries of normalized photovoltaic electricity generation in the selected locations (wilayats) in the Sultanate of Oman, both as absolute measures (in kWh/kWp/year) and as relative measures, relative to the location in the capital Muscat (nondimensional). Each row in either table corresponds to a location, where some characteristics related to solar PV performance are given. There are three tables corresponding to three different design types of the PV panels in terms of their response to the sun path.
Table A3. Lookup table for solar PV systems with fixed optimized orientation of the photovoltaic panels. The reference (yearly PV electricity production per kWp installed) is 1809.44 kWh/kWp/year, corresponding to the wilayat of Muscat.
Name of Selected WilayatOptimized Slope (°)Optimized Azimuth, from South (°)Yearly Global Solar Irradiation Received by m2 of Tilted PV Panels Surface (kWh/m2/year)Translation Factor (X to Muscat) for Yearly PV Electricity Production
Muscat2502500.821.0000
Qurayyat2502489.680.99495
A’Seeb2502502.940.99855
Sohar2502509.630.99392
Al Suwaiq2502515.810.98945
Shinas2512493.460.98423
Nizwa25−42516.220.99362
Adam25−32575.140.96714
Samail25−72492.281.0004
Al Hamra25−72507.20.99871
Al Rustaq2602469.71.0116
Barka2502506.10.99854
Wadi Al Ma’awil25−22496.781.0040
Salalah2152383.350.99728
Muqshin22−12583.420.95280
Shalim and the Hallaniyat Islands2002562.060.94005
Dhalkut2202328.41.0246
Al Mazyona20−42610.950.94111
Thumrait2002618.370.92345
Sadah2022440.660.96510
Sur2402523.190.98118
Masirah2342514.080.94424
Jaalan Bani Bu Ali24−12552.070.96129
Ibra25−42522.880.98923
Al Mudhaibi25−42535.230.98424
Wadi Bani Khalid24−52505.250.98250
Bidiya25−22564.140.96101
Ibri25−52547.620.98085
Yankul24−22487.991.0019
Dhank25−52539.440.98800
Al Buraimi25−42499.830.99104
Al Sunaynah25−42542.30.97983
Mahdah23−12582.440.94764
Haima23−12582.440.94764
Duqm2112458.120.96761
Al Jazer2112582.310.93129
Mahout23−12551.410.95471
Khasab2532410.211.0069
Dibba2602384.361.0294
Madha24−112355.451.0316
Table A4. Lookup table for solar PV systems with single-vertical-axis solar tracking of the photovoltaic panels. The reference (yearly PV electricity production per kWp installed) is 2338.16 kWh/kWp/year, corresponding to the wilayat of Muscat.
Name of Selected WilayatOptimized Slope (°)Yearly Global Solar Radiation Received by m2 of Tilted PV Panels Surface (kWh/m2/year)Translation Factor (X to Muscat) for Yearly PV Electricity Production
Muscat493209.541.0000
Qurayyat493192.190.99431
A’Seeb493216.30.99672
Sohar493220.740.99354
Al Suwaiq493232.530.98801
Shinas493188.70.98879
Nizwa483203.71.0040
Adam493304.690.96816
Samail483171.571.0105
Al Hamra483191.021.0095
Al Rustaq483136.451.0247
Barka493221.280.99659
Wadi Al Ma’awil493201.321.0062
Salalah473032.61.0071
Muqshin483315.310.95239
Shalim and the Hallaniyat Islands473307.10.93211
Dhalkut472945.661.0409
Al Mazyona473373.230.93417
Thumrait473390.480.91358
Sadah463111.590.97085
Sur483231.730.98079
Masirah473201.480.95063
Jaalan Bani Bu Ali483268.930.96041
Ibra493229.520.99186
Al Mudhaibi483248.050.98682
Wadi Bani Khalid473160.651.0034
Bidiya483282.280.96358
Ibri493263.670.98308
Yankul473136.61.0236
Dhank493252.630.99104
Al Buraimi493207.50.99030
Al Sunaynah493263.150.97923
Mahdah483304.50.95005
Haima483304.50.95005
Duqm473115.440.97770
Al Jazer473319.90.92742
Mahout483261.770.95623
Khasab473007.451.0421
Dibba493044.71.0339
Madha462923.531.0716
Table A5. Lookup table for solar PV systems with two-axis solar tracking of the photovoltaic panels. The reference (yearly PV electricity production per kWp installed) is 2434.4 kWh/kWp/year, corresponding to the wilayat of Muscat.
Name of Selected WilayatYearly Global Solar Radiation Received by m2 of Tilted PV Panels Surface (kWh/m2/year)Translation Factor (X to Muscat) for Yearly PV Electricity Production
Muscat3351.521.0000
Qurayyat3334.60.99371
A’Seeb3359.410.99634
Sohar3362.950.99357
Al Suwaiq3376.560.98769
Shinas3326.570.98946
Nizwa3342.551.0053
Adam3452.650.96774
Samail3307.151.0123
Al Hamra3332.271.0097
Al Rustaq3268.321.0273
Barka3364.620.99632
Wadi Al Ma’awil3342.711.0067
Salalah3173.521.0037
Muqshin3464.90.95139
Shalim and the Hallaniyat Islands3461.080.92908
Dhalkut3080.141.0385
Al Mazyona3532.270.93145
Thumrait3550.340.91032
Sadah3254.420.96772
Sur3375.570.98024
Masirah3344.80.94891
Jaalan Bani Bu Ali3415.830.95906
Ibra3374.90.99139
Al Mudhaibi3394.070.98633
Wadi Bani Khalid3288.111.0074
Bidiya3428.770.96304
Ibri3409.060.98285
Yankul3262.41.0280
Dhank3396.470.99133
Al Buraimi3348.810.99039
Al Sunaynah3407.740.97915
Mahdah3451.710.94934
Haima3451.710.94934
Duqm3254.410.97606
Al Jazer3471.930.92503
Mahout3407.270.95505
Khasab3111.621.0517
Dibba3174.021.0352
Madha3027.541.0800

References

  1. Masson-Delmotte, V.; Zhai, P.; Pörtner, H.-O.; Roberts, D.; Skea, J.; Shukla, P.R.; Pirani, A.; Moufouma-Okia, W.; Péan, C.; Pidcock, R.; et al. (Eds.) IPCC, 2018: Summary for Policymakers. In Global Warming of 1.5 °C. An IPCC Special Report on the Impacts of Global Warming of 1.5 °C Above Pre-Industrial Levels and Related Global Greenhouse Gas Emission Pathways, in the Context of Strengthening the Global Response to the Threat of Climate Change, Sustainable Development, and Efforts to Eradicate Poverty; World Meteorological Organization: Geneva, Switzerland, 2018; p. 32. Available online: https://www.ipcc.ch/site/assets/uploads/sites/2/2019/05/SR15_SPM_version_stand_alone_HR.pdf (accessed on 18 September 2021).
  2. IRENA (International Renewable Energy Agency). World Energy Transitions Outlook: 1.5 °C Pathway; IRENA: Abu Dhabi, United Arab Emirates, 2021; p. 321. Available online: https://www.irena.org/publications/2021/Jun/-/media/C3BB1085FEA5401D9CA9598A61C8B267.ashx (accessed on 29 July 2021).
  3. Distribution of Renewable Energy Technologies by IRENA (International Renewable Energy Agency). Available online: https://www.irena.org/Statistics/View-Data-by-Topic/Capacity-and-Generation/Technologie (accessed on 25 September 2021).
  4. Remap—Renewable Energy Roadmaps by IRENA (International Renewable Energy Agency). Available online: https://www.irena.org/remap (accessed on 25 September 2021).
  5. Solar PV Power Generation in the Sustainable Development Scenario, 2000–2030. IEA (International Energy Agency), Paris. Available online: https://www.iea.org/data-and-statistics/charts/solar-pv-power-generation-in-the-sustainable-development-scenario-2000-2030 (accessed on 25 September 2021).
  6. Alboteanu, I.L.; Bulucea, C.A.; Degeratu, S. Estimating Solar Irradiation Absorbed by Photovoltaic Panels with Low Concentration Located in Craiova, Romania. Sustainability 2015, 7, 2644–2661. [Google Scholar] [CrossRef] [Green Version]
  7. Katiyar, A.K.; Pandey, C.K. A Review of Solar Radiation Models—Part I. J. Renew. Energy 2013, 2013, 11. [Google Scholar] [CrossRef] [Green Version]
  8. Bakirci, K. Models for Determination of Solar Energy Potential. Energy Explor. Exploit. 2008, 26, 281–292. [Google Scholar] [CrossRef]
  9. Xie, C.; Schimpf, C.; Chao, J.; Nourian, S.; Massicotte, J. Learning and teaching engineering design through modeling and simulation on a CAD platform. Comput. Appl. Eng. Educ. 2018, 26, 824–840. [Google Scholar] [CrossRef]
  10. Sharma, S.; Kurian, C.P.; Paragond, L.S. Solar PV System Design Using PVsyst: A Case Study of an Academic Institute. In Proceedings of the International Conference on Control, Power, Communication and Computing Technologies (ICCPCCT), Kannur, India, 23–24 March 2018; IEEE (Institute of Electrical and Electronics Engineers): New York City, NY, USA; pp. 123–128. [Google Scholar] [CrossRef]
  11. Sources of Meteo Data in Monthly Values—PVsyst. Available online: https://www.pvsyst.com/meteo-data-source (accessed on 25 September 2021).
  12. Honnurvali, M.S.; Gupta, N.; Goh, K.; Umar, T.; Kabbani, A.; Nazeema, N. Case study of PV output power degradation rates in Oman. IET Renew. Power Gener. 2019, 13, 352–360. [Google Scholar] [CrossRef] [Green Version]
  13. Al-Badi, A. Performance assessment of 20.4 kW eco-house grid-connected PV plant in Oman. Int. J. Sustain. Eng. 2020, 13, 230–241. [Google Scholar] [CrossRef]
  14. ESMAP (Energy Sector Management Assistance Program). Global Photovoltaic Power Potential by Country; World Bank: Washington, DC, USA, 2020; p. 62. Available online: https://documents1.worldbank.org/curated/en/466331592817725242/pdf/Global-Photovoltaic-Power-Potential-by-Country.pdf (accessed on 14 June 2021).
  15. IRENA (International Renewable Energy Agency). Renewables Readiness Assessment: Sultanate of Oman; International Renewable Energy Agency: Abu Dhabi, United Arab Emirates, 2014; p. 88. Available online: https://www.irena.org/-/media/Files/IRENA/Agency/Publication/2014/IRENA_RRA_Oman_2014_LR.pdf (accessed on 25 September 2021).
  16. DATA PORTAL, Labor Market, Data of Year 2018 by National Centre for Statistics & Information (NCSI) of the Sultanate of Oman. Available online: https://data.gov.om/nyavlmf/labor-market (accessed on 23 September 2021).
  17. DATA PORTAL, Communication, Data of Year 2018 by National Centre for Statistics & Information (NCSI) of the Sultanate of Oman. Available online: https://data.gov.om/lgtrktf/communication?indicator=No.%20of%20Exchanges (accessed on 23 September 2021).
  18. PVGIS Contact Points. Available online: https://ec.europa.eu/jrc/en/PVGIS/about/contact (accessed on 26 September 2021).
  19. PVGIS Users Manual. Available online: https://ec.europa.eu/jrc/en/PVGIS/docs/usermanual (accessed on 25 September 2021).
  20. CM SAF (Satellite Application Facility on Climate Monitoring). Available online: https://www.cmsaf.eu/EN/Home/home_node.html (accessed on 25 September 2021).
  21. PVGIS Data Sources and Calculation Methods. Available online: https://ec.europa.eu/jrc/en/PVGIS/docs/methods (accessed on 25 September 2021).
  22. Mueller, R.; Behrendt, T.; Hammer, A.; Kemper, A. A New Algorithm for the Satellite-Based Retrieval of Solar Surface Irradiance in Spectral Bands. Remote Sens. 2012, 4, 622–647. [Google Scholar] [CrossRef] [Green Version]
  23. Mueller, R.; Matsoukas, C.; Gratzki, A.; Behr, H.D.; Hollmann, R. The CM-SAF operational scheme for the satellite based retrieval of solar surface irradiance—A LUT based eigenvector hybrid approach. Remote Sens. Environ. 2009, 113, 1012–1024. [Google Scholar] [CrossRef]
  24. Huld, T.; Müller, R.; Gambardella, A. A new solar radiation database for estimating PV performance in Europe and Africa. Sol. Energy 2012, 86, 1803–1815. [Google Scholar] [CrossRef]
  25. Gracia Amillo, A.; Huld, T.; Müller, R. A New Database of Global and Direct Solar Radiation Using the Eastern Meteosat Satellite, Models and Validation. Remote Sens. 2014, 6, 8165–8189. [Google Scholar] [CrossRef] [Green Version]
  26. BSRN (Baseline Surface Radiation Network): Baseline Surface Radiation Network. Available online: https://bsrn.awi.de (accessed on 25 September 2021).
  27. DATA PORTAL, Population, Data of August 2021 by National Centre for Statistics & Information (NCSI) of the Sultanate of Oman. Available online: https://data.gov.om/amxduh/population (accessed on 23 September 2021).
  28. Oman by region—Foreign Ministry of Oman. Available online: https://fm.gov.om/about-oman/state/oman-by-region (accessed on 22 September 2021).
  29. About Oman—Omani Ministry of Health. Available online: https://www.moh.gov.om/en/about-oman (accessed on 21 September 2021).
  30. Map of the Sultanate of Oman—By the National Survey Authority, Ministry of Defense—Hosted at the Website of the Foreign Ministry of Oman. Available online: https://fm.gov.om/wp-content/uploads/Oman_Map_AR.pdf (accessed on 22 September 2021).
  31. Cotfas, D.T.; Cotfas, P.A. Comparative Study of Two Commercial Photovoltaic Panels under Natural Sunlight Conditions. Int. J. Photoenergy 2019, 2019, 10. [Google Scholar] [CrossRef] [Green Version]
  32. Andreani, L.C.; Bozzola, A.; Kowalczewski, P.; Liscidini, M.; Redorici, L. Silicon solar cells: Toward the efficiency limits. Adv. Phys. X 2019, 4, 24. [Google Scholar] [CrossRef] [Green Version]
  33. Common Types of Solar Cells—What Are Better Silicon, Monocrystalline, or Polycrystalline Solar Cells? Available online: https://www.altenergy.org/renewables/solar/common-types-of-solar-cells.html (accessed on 26 September 2021).
  34. Attari, K.; Elyaakoubi, A.; Asselman, A. Performance analysis and investigation of a grid-connected photovoltaic installation in Morocco. Energy Rep. 2016, 2, 261–266. [Google Scholar] [CrossRef] [Green Version]
  35. Global Solar Atlas (GSA), data for 23.583889°, 058.407778° (Muscat). Available online: https://globalsolaratlas.info/detail?s=23.583889,58.407778&m=site&c=23.583497,58.40744,11 (accessed on 25 September 2021).
  36. Darhmaoui, H.; Lahjouji, D. Latitude Based Model for Tilt Angle Optimization for Solar Collectors in the Mediterranean Region. Energy Procedia 2013, 42, 26–435. [Google Scholar] [CrossRef] [Green Version]
  37. Dhimish, M.; Silvestre, S. Estimating the impact of azimuth-angle variations on photovoltaic annual energy production. Clean Energy 2019, 3, 47–58. [Google Scholar] [CrossRef] [Green Version]
  38. Seme, S.; Štumberger, B.; Hadžiselimović, M.; Sredenšek, K. Solar Photovoltaic Tracking Systems for Electricity Generation: A Review. Energies 2020, 13, 4224. [Google Scholar] [CrossRef]
  39. Hereher, M.; El Kenawy, A.M. Exploring the potential of solar, tidal, and wind energy resources in Oman using an integrated climatic-socioeconomic approach. Renew. Energy 2020, 161, 662–675. [Google Scholar] [CrossRef]
  40. OPWP (Oman Power and Water Procurement Company). Solar Data—Weather Impact Analysis; Oman Power and Water Procurement Company: Muscat, Oman; p. 42. Available online: https://omanpwp.om/PDF/Solar%20Data%20-%20Weather%20Impact%20Analysis.pdf (accessed on 3 November 2021).
  41. Introduction to OPWP. Available online: https://omanpwp.om/new/Pages.aspx?Pid=1 (accessed on 6 November 2021).
  42. About Nama Group. Available online: https://www.omangrid.com/en/Pages/AMA-Group.aspx (accessed on 6 November 2021).
  43. Nama Group. Available online: https://www.linkedin.com/company/namagroupoman (accessed on 6 November 2021).
  44. Gulkowski, S.; Zdyb, A.; Dragan, P. Experimental Efficiency Analysis of a Photovoltaic System with Different Module Technologies under Temperate Climate Conditions. Appl. Sci. 2019, 9, 141. [Google Scholar] [CrossRef] [Green Version]
  45. GeoNames. Available online: https://www.geonames.org/advanced-search.html (accessed on 22 September 2021).
  46. Photovoltaic Geographical Information System (PVGIS). Available online: https://re.jrc.ec.europa.eu/pvg_tools/en (accessed on 22 September 2021).
  47. Google Maps. Available online: https://www.google.com/maps (accessed on 22 September 2021).
Figure 1. A map of the Sultanate of Oman, showing its 11 first-level administrative divisions (governorates) as well as its capital (Muscat). It also shows two locations which receive special attention in this work as having the highest and the lowest predicted PV performance among all 40 examined locations, irrespective of whether solar tracking (single-vertical-axis or two-axis) is enabled or not (Thumrait—highest performance, and Madha—lowest performance). In addition, the location of Adam is also highlighted, where comparison with ground-measurement irradiation data is made. The location of Salalah is indicated as well, whose horizon height profile is discussed in a subsequent part of this work. The map is adapted from two maps available freely and licensed under the Open Government License of the Sultanate of Oman [16,17].
Sustainability 13 13209 g001
Figure 2. Variation of the optimized slope of PV panels (as predicted by PVGIS) with the latitude for the analyzed locations in the Sultanate Oman.
Sustainability 13 13209 g002
Figure 3. Illustration of the horizon height (in angular degrees) at two special locations in the Sultanate of Oman among Table 1. Madha (showing the most eastern-biased optimized azimuth angle for fixed PV panels, 11° east of due south); (2) Salalah (showing the most western-biased optimized azimuth angle for fixed PV panels, 5° west of due south). Data source: PVGIS ©European Union, 2001–2021. The innermost circle corresponds to a horizon height of 0°, and the outermost circle corresponds to a horizon height of 25°.
Sustainability 13 13209 g003
Figure 4. Temporal distribution of calculated hourly solar irradiance for the month of June and the month of December in the location of Salalah, latitude: north 17.015° and longitude: east 54.092222°. The values are obtained using PVGIS Table 2005. Years of data in the database: PVGIS-SARAH.
Sustainability 13 13209 g004
Figure 5. Monthly expected electricity generation from solar PV systems with fixed year-round optimized orientation of Table 1. (1) Madha (showing the lowest expected electricity generation over the whole year); (2) Muscat (the capital, and the reference location in the current study); (3) Thumrait (showing the highest expected electricity generation over the whole year). Data source: PVGIS ©European Union, 2001–2021.
Sustainability 13 13209 g005
Figure 6. Monthly expected electricity generation from solar PV systems with single-vertical-axis solar tracking in three special locations in the Sultanate of Oman among those analyzed in the current study: (1) Madha (showing the lowest expected electricity generation over the whole year); (2) Muscat (the capital, and the reference location in the current study); (3) Thumrait (showing the highest expected electricity generation over the whole year). Data source: PVGIS ©European Union, 2001–2021.
Sustainability 13 13209 g006
Figure 7. Monthly expected electricity generation from solar PV systems with two-axis solar tracking in three special locations in the Sultanate of Oman among those analyzed in the current study: (1) Madha (showing the lowest expected electricity generation over the whole year); (2) Muscat (the capital, and the reference location in the current study); (3) Thumrait (showing the highest expected electricity generation over the whole year). Data source: PVGIS ©European Union, 2001–2021.
Sustainability 13 13209 g007
Figure 8. Comparison of monthly global horizontal irradiation (GHI) for the location of Adam, located in the governorate of Ad Dakhliya, in the Sultanate of Oman, when measured at a meteorological station and when reported by PVGIS web calculator (PVGIS ©European Union, 2001–2021), for 8 months in 2013.
Sustainability 13 13209 g008
Figure 9. Annual global horizontal irradiation (GHI) for 12 locations in 12 countries having similar distances from the equator as Muscat. Data source: PVGIS ©European Union, 2001–2021.
Sustainability 13 13209 g009
Figure 10. Annual direct normal irradiation (DNI) for 12 locations in 12 countries having similar distances from the equator as Muscat. Data source: PVGIS ©European Union, 2001–2021.
Sustainability 13 13209 g010
Table 1. List of the selected wilayats in the Sultanate of Oman for solar energy analysis.
Index of Selected WilayatsGovernorates
(in Descending Order by Population)
Population of the Governorate (as of August 2021)Number of Wilayats in the GovernorateNumber of Selected Wilayats in the GovernorateSelected Wilayats for Analysis (First One is the Administrative Capital of the Governorate)
1Muscat1,270,30863Muscat
2Qurayyat
3A’Seeb
4Al Batinah North780,89963Sohar
5Al Suwaiq
6Shinas
7Ad Dakhliya478,22984Nizwa
8Adam
9Samail
10Al Hamra
11Al Batinah South465,21063Al Rustaq
12Barka
13Wadi Al Ma’awil
14Dhofar409,019107Salalah
15Muqshin
16Shalim and the Hallaniyat Islands
17Dhalkut
18Al Mazyona
19Thumrait
20Sadah
21Ash Sharqiyah South314,20453Sur
22Masirah
23Jaalan Bani Bu Ali
24Ash Sharqiya North270,52064Ibra
25Al Mudhaibi
26Wadi Bani Khalid
27Bidiya
28Adh Dhahirah212,95433Ibri
29Yankul
30Dhank
31Al Buraimi120,29533Al Buraimi
32Al Sunaynah
33Mahdah
34Al Wusta51,19144Haima
35Duqm
36Al Jazer
37Mahout
38Musandam48,83443Khasab
39Dibba
40Madha
Total-4,421,6636140-
More details about the selected locations are provided in Appendix A. These are the latitude and longitude coordinates, as well as the elevations.
Table 2. Comparison of PV system characteristics with optimized fixed orientation in the location representing Muscat (latitude: north 23.583889°, longitude: east 58.407778°), as predicted by PVGIS (Photovoltaic Geographical Information System) and by GSA (Global Solar Atlas) online solar calculation tools.
CharacteristicPVGIS ValueGSA ValueAbsolute Difference
Optimum slope (°)25261
Optimum azimuth, from south (°)000
Yearly PV electricity production per kWp installed (kWh/kWp/year)1809.41819.610.2
Yearly global solar radiation received by m2 of tilted PV panel surface (kWh/m2/year)2500.82377.5123.3
Publisher’s Note: MDPI stays neutral with regard to jurisdictional claims in published maps and institutional affiliations.

