Article

Comparative Study of Factors Contributing to Land Surface Temperature in High-Density Built Environments in Megacities Using Satellite Imagery

1
School of Marine Science, Nanjing University of Information Science and Technology, Nanjing 210044, China
2
Center for Housing Innovations and Institute of Asia-Pacific Studies, Chinese University of Hong Kong, Shatin, New Territories, Hong Kong, China
3
EarthStar Inc., Beijing 100101, China
4
Faculty of Information Science, Beijing University of Technology, Beijing 100124, China
5
Department of Economics and Finance/Sustainable Real Estate Research Center, Hong Kong Shue Yan University, Hong Kong, China
*
Author to whom correspondence should be addressed.
Sustainability 2021, 13(24), 13706; https://doi.org/10.3390/su132413706
Submission received: 7 November 2021 / Revised: 3 December 2021 / Accepted: 8 December 2021 / Published: 12 December 2021

Abstract

:
In this study, the root sources contributing to the urban heat island (UHI) effect between megacities, such as Hong Kong and Shenzhen, were integrated and compared using satellite remote sensing data. Classification and multilayer perceptron regression tree (CARTMLP) algorithms were used to classify land use. The radiative transfer equation method was applied to retrieve the land surface temperatures (LSTs) in the study area. Multiple linear regression analysis was applied to determine the relationship between land-use types and UHIs. The experimental results show a large area of relatively high temperature dispersed within Shenzhen, and comparatively small areas highly centralized in Hong Kong, with the retrieved LST in Hong Kong lower than that in Shenzhen. In addition, the surface temperature of large complex buildings decorated with high-albedo materials in Hong Kong was higher than in Shenzhen (e.g., Hong Kong International Airport, 25.12 °C; Shenzhen Bao’an International Airport, 23.38 °C), with artificial heat being an important contributor to these differences. These results also imply that high-albedo materials are sufficient to alleviate high temperatures. These findings are integrated to propose an organic combination strategy for reducing UHI effects in urban areas in megacities worldwide, such as Hong Kong and Shenzhen in China.

1. Introduction

The urban heat island (UHI) refers to higher-temperature urban areas that have higher surface or atmospheric temperatures than their surroundings [1]. The UHI effect attracts increasing public awareness as urban areas become hotter, with more significant temperature differences between urban and rural settings. The adverse effects of UHIs have been widely highlighted. In a study of 193 older people suffering from UHIs in Vienna, Arnberger et al. found that noise levels and the UHI effect discouraged the elderly from going outside [2]. The factors in relatively high temperatures are often ignored by the public but are of great significance to investigating the causes of the UHI phenomenon. As the southern gateway to China and the pioneer of the open-door policy, Shenzhen has experienced rapid economic development in recent decades, accompanied by a dramatic increase in its population. Traditionally, Hong Kong has been a high-density city with an array of skyscrapers. The rapid growth of society has caused both Shenzhen and Hong Kong to suffer from the UHI effect. According to Tsou et al., who investigated UHIs in Shenzhen and Hong Kong, the UHIs in Shenzhen are larger than those in Hong Kong [3]. An array of literature has similarly highlighted the features of the UHI effect on Hong Kong and Shenzhen, but few studies have investigated the different spatiotemporal distribution levels of UHIs in order to compare Hong Kong and Shenzhen, or the relationship between land use/land cover (LULC) and the UHI effect in Shenzhen and Hong Kong. We can quickly observe and monitor the relationship between LULC and the UHI effect in Shenzhen and Hong Kong using remote sensing technologies. These technologies reveal the differences between the presence and absence of climate change. Big data from remote sensing has replaced the repeated manual operation and has greatly extended the survey boundaries. However, leveraging remote sensing data could not reveal as much social value as we needed. In this case, because of the differences in the terrains of Shenzhen and Hong Kong, biases may be introduced when developing a quantitative model to analyze the relationship between LULC and the UHI effect in Shenzhen and Hong Kong. Accordingly, monitoring the spatiotemporal distribution of UHIs in Shenzhen and Hong Kong is necessary, along with an accurate classification of the LULC, in order to quantify the relationship between LULC and the UHI effect using a suitable quantitative model.
Changes in LULC are a root cause of UHIs [4,5]. Traditionally, land classification relies on band math calculations, such as the normalized difference vegetation index (NDVI), the normalized difference water index (NDWI), or the difference vegetation index (DVI), to identify the spectral characteristics and the conduct classifications of objects. However, because classifying an object whose characteristics are unknown is difficult, a supervised method of classification, the classification of the machine learning (multilayer perceptron (MLP)) algorithm, was used in this study.
Remote sensing is widely used to analyze the UHI effect. Using data from the Landsat TM/ETM, OLI, and ASTER images of the Suez Governorate from 1988 to 2014 in winter, Ahmed investigated land use and the land surface temperatures (LSTs) by the NDVI, the NDBI, and the urban thermal field variance index (UTFVI) [6], showing that densely populated industrial districts suffer from the UHI effect. Similarly, on the basis of the mesoscale Weather Research and Forecasting (WRF) model that Takebayashi and Senoo applied to Tokyo, Osaka, and Nagoya, UHI areas increase with urban sizes [7]. Collecting images from the Landsat-8 OLI, from 6 January 2014 to 12 April 2014 in Mumbai, Dwivedi and Mohan classified land use and prepared NDVI maps with the intention of generating a land surface temperature map that could serve as the basis for correlation studies [8]. They showed that, when vegetation and green roofs account for more than 50% of the area, the best green area/green infrastructure ratio results, and the heat decreases by around 30%. On the basis of the data analysis for Shanghai from the Landsat-8 on 29 August 2013, Du et al. report that green space could play a significant role in producing the cool island effect [9], with the outcome highly dependent on the size of the green space and its surrounding characteristics. Water also plays an essential role in influencing the UHI effect. Yamagata et al. measured the relationship between the road surface temperature and sprinkled water by thermography in Shiodome District, Tokyo, and concluded that the water decreased the surface temperature more during the day than at night [10]. However, “according to hobbyists’” meteorological observations, Steeneveld et al. note that warm water could not act as a powerful cooling element on UHIs [11].
Using the multiband aerial imagery of remote sensing on four spectral bands, Ban-Weiss et al. investigated the roof albedos in seven U.S. cities: Los Angeles, Long Beach, San Diego, Bakersfield, Sacramento, San Francisco, and San Jose [12]. They sketched the building outlines and transferred four satellite narrowbands to solar reflectance by testing the solar spectral reflectance of 190 roofing products to identify the albedo of cool roofs on the basis of the unique characteristics of cool roofs, which were poorly reflective in the visible bands, but highly reflective in the near-IR band. The albedo results indicate that this method predicts solar reflectance well, and that the temperature could drop by as much as 0.2 °C. According to Yang et al. [13], when a phase-change PCM material was applied as a cool roof material, the temperature decreased by 6.8 °C in a computational fluid dynamics (CFD) simulation [13]. The cool roof plays an important role in decreasing the temperature [14], with the performance varying between cool roof materials. Although the albedos of roofs offer one way of quantifying the relationship between cool roofs, conducting such a large project in a short time is difficult. Doing so would also depart from the original aim of taking advantage of remote sensing and quantifying the relationship between cool roofs and UHIs, and quantifying the albedos of roofs over such a large area is difficult. Accordingly, this study sought a new approach to saving time and expense when retrieving the temperature data for various cool roofs and evaluating their performance on different construction objects. In addition, factors such as forests, hillsides, water, urban areas, and soil were selected as possible contributors to the UHI effect. Although many relationships between these factors and UHIs have been investigated using regression models, few studies have quantified their effect levels for different land uses with temperature changes. Most studies quantify the relationship between large-area UHIs and various ground features, such as vegetation, bare soil, high-albedo impervious surfaces, low-albedo impervious surfaces, and water. Finally, a multiple linear regression method was developed to present the relationship between LULC and the UHI effect. As a result, this study used the classification of various land objects adapted with the machine learning algorithm. The shared and disparate features of the UHIs in Shenzhen and Hong Kong are revealed on the basis of the Landsat data, providing directions for future urban planners who seek to reduce UHIs during rapid urbanization.
The objectives of this study were as follows:
(1)
To compare the LST areas between Hong Kong and Shenzhen in 1998, 2004, 2009, 2013, and 2018;
(2)
To compare and quantify the root sources contributing to the UHI effect between megacities, such as Hong Kong and Shenzhen;
(3)
To analyze the characteristics of different ground features in Hong Kong and Shenzhen to reveal their influences on the UHI effect.
The study proceeded as follows (Figure 1):
(1)
Data collection and data preprocessing of Landsat data from 1998 to 2018;
(2)
LST retrievals for Hong Kong and Shenzhen via the radiative transfer equation;
(3)
The use of MLP to classify land use;
(4)
The combination and coding of LST retrieval layers, with land-use classification;
(5)
Quantification of the root sources contributing to the UHI effect, using multiple linear regression models;
(6)
Analysis of the differences in the LST characteristics between Hong Kong and Shenzhen, and of the accuracy of the MLP algorithms used to classify land use and to reveal the root sources contributing to the UHI effect between the megacities of Hong Kong and Shenzhen.

2. Data Collection

2.1. Study Area

Figure 2 illustrates the study area. Shenzhen (SZ), the southern gateway of China, stands at the forefront of the Pearl River Delta and comprises eight traditional administrative districts, as well as the new districts of Longhua and Dapeng. The ten districts of SZ cover 2050 km2 and are home to a population of 12.53 million people. The pearl of the Orient, Hong Kong composes the New Territories, Kowloon, Hong Kong Island, and 262 other small islands, from north to west. Its eighteen districts cover 1110 km2 and are home to a population of 7.32 million people.
Shenzhen and Hong Kong are both in southern China and, thus, have similar weather conditions despite their different terrains. Shenzhen is covered by plains but surrounded by forest to the north and northeast. By contrast, Hong Kong is chiefly mountainous and has a long winding natural coastline, with small islands and harbors. Consequently, the urban landscape in Hong Kong is highly centralized on the ring-like coastline, whereas Shenzhen’s urban landscape is more evenly distributed over a flatter area.
Although the shapes of Shenzhen and Hong Kong are quite different, the types of land use or land cover are primarily the same because of their similar experiences of industrial transfer and urbanization. Both of them share proliferating factories and skyscrapers and the farmlands are shrinking considerably. In this case, more and more soil, water, and forest are increasingly replaced by high- and low-albedo areas. However, the timing of the economic transformations and the policy environments are so varied between Shenzhen and Hong Kong that the situation produced a great difference in the performances of the changes in their land use. In the end, this might also be the cause of the diversity in the climate-change ecosystems. Even they are quite close in geographical location, and this phenomenon aroused our concern.

2.2. Image Data

Landsat Collection 1 Level-2 (on-demand) data were obtained from the free database of the United States Geological Survey (USGS), with a spatial resolution of 30 m. The projection method was Mercator projection. Level-2 data is the surface reflectance data. It has already finished atmospheric correction. In this study, we only chose images with clear skies or few clouds. Two photos need to be merged in order to cover the entire Shenzhen and Hong Kong area. The Paths are 121 and 122, and the Row is 44. Details are given in Table 1.
In addition, the vector map of Hong Kong was downloaded from the database of Global Administrative Areas (GADM), and the vector map of Shenzhen was downloaded from DIVA-GIS. However, the DIVA-GIS only provided the administrative areas in China, and the vector map of Shenzhen was extracted with ArcGIS 10.1 software provided by ESRI (Environmental Systems Research Institute, Inc., Redlands, CA, USA).

3. Research Method

3.1. Preprocessing

After the collection of the satellite images and vector maps, the images were preprocessed. The Landsat-8 data contain only the datasets of independent single-band images, so the final satellite images were combined into multiband images using the layer-stacking tool included in the ENVI 5.3 software, which is also provided by ESRI [15]. The geometric correction was performed for further radiation correction. In addition, vector maps of Hong Kong and Shenzhen were used to clip the interest areas using the subset tool in the ENVI 5.3 software.

3.2. Determination of Land Surface Temperature (LST)

Three types of algorithms are frequently used to determine the LST: split-window (SW) algorithms, single-channel (SC) algorithms, and the radiative transfer equation (RTE). In this study, we used the single-channel LST algorithm proposed by Wang et al. [16], which needs to be used on the Google Earth Engine (GEE) cloud platform to generate a long-term unified LST. There is good agreement between this algorithm and the MODIS LST. After achieving the LULC classification [17,18,19] and the temperature LST calculation, regression modeling and a multiple linear regression with dummy variables were performed to investigate the factors accounting for the high temperature in Hong Kong and Shenzhen.

3.3. Land-Use Classification

The MLP is an artificial neural network algorithm commonly used for remote sensing image classification [20]. It can estimate the probability between the predictor variables and the response variables through the Softmax function. This study established an MLP with three hidden layers, each with 10, 10, and 5 neurons. The loss function is cross entropy, and the training algorithm is a scaled conjugate gradient.
Landsat’s multispectral band is the basis of classification. To better distinguish the characteristics of different ground objects, we use minimum noise fraction rotation (MNF) to improve the image signal-to-noise ratio to enhance the ability to identify the land-cover types. In this study, land-cover types are divided into vegetation, soil, water, impervious surface (high-albedo), and impervious surface (low-albedo) [21]. The aboveground object types were extracted by pairwise combination through visual interpretation. We collected typical feature samples in the Landsat OLI and TM and then established two MLP classification models. The collected sample points are shown in Table 2. A total of 80% of the data was used to train the MLP, and the remaining 20% was used to verify the accuracy of the MLP. Finally, the classification accuracy of the Landsat OLI is 98%, and the classification accuracy of the Landsat TM is 97%.

3.4. Multiple Linear Regression Models

After collecting the classification data, which were coded with dummy variables, and the temperature data, they were well organized and matched with geographical coordinates. Multiple linear regression models with dummy variables were developed to quantify the relationship between LULC and the LST in Shenzhen and Hong Kong. Using the stepwise regression to fit the regression equation, when the explanatory variables in the linear regression model are highly correlated, as when multicollinearity exists, the regression model will be distorted. The variance inflation faction (VIF) is used to test multicollinearity. If the square root of the VIF is greater than 2, this indicates that the regression equation has multicollinearity. To solve this problem, if the correlation coefficient between a variable and the previously selected variable is within 0.5, the variable is selected; otherwise, it is discarded. The model formula is as follows:
Y = β 0 + β 1 D 1 + β 2 D 2 + + β k D k + u    
where Y is the dependent variable, representing the LST, affected by the LULC; and D1, D2, and DK are the dummy variables.
The multiple regression models with dummy variables are special linear regression models, as the independent variable is the dummy variable. The binary dummy variables represent the attributes of the independent variable. If the independent variables have the target characteristics, it will be input as 1; otherwise, it will be input as 0. The coefficients in the multifactor model are derived by ordinary least squares (OLS):
β ^ OLS = ( x i x ¯ ) y i ( x i x ¯ ) 2 = x i y i x ¯ y i x i 2 + x ¯ 2 2 x i x ¯ = i = 1 n 1 y i n 1 n i = 1 n y i n 1 + ( n ) ( n 1 n ) 2 2 ( n 1 n ) n 1 = i = 1 n 1 y i n 1 y ¯ n 1 n 1 2 n 0 n 1 = 1 n 0 + n 1 i = 1 n 1 y i n 1 n 0 + n 1 y ¯ n 1 n 0 + n 1 ( n 1 n 0 + n 1 ) 2 = 1 n 0 + n 1 i = 1 n 1 y i n 1 n 0 + n 1 ( 1 n 0 + n 1 i = 1 n y i ) n 1 n 0 + n 1 2 n 1 2 ( n 0 + n 1 ) 2 = ( 1 n 0 + n 1 ) [ i = 1 n 1 y i n 1 n 0 + n 1 ( i = 1 n 0 y i + i = 1 n 1 y i ) ] n 1 n 0 ( n 0 + n 1 ) 2 = i = 1 n 1 y i n 1 i = 1 n 0 y i n 0 = y ¯ 1 y ¯ 0
In this case, the estimate model can be explained further as:
TEMPERATURE = β 0 + β 1   Soil + β 2   High   albedo + β 3   Low   albedo + β 4   Water + β 5   Vegetation
where TEMPERATURE is the dependent variable, affected by the various land uses/land covers; and Soil, High albedo, Low albedo, Water, and Vegetation are the dummy variables.
When Soil = 1, it represents that the LULC is soil, 0 if otherwise;
When High albedo = 1, it represents that the LULC is high-albedo, 0 if otherwise;
When Low albedo = 1, it represents that the LULC is low-albedo, 0 if otherwise;
When Water = 1, it represents that the LULC is water, 0 if otherwise;
When Vegetation = 1, it represents that the LULC is vegetation, 0 if otherwise;
When Soil = High albedo = Low albedo = Water = Vegetation = 0, it represents the temperature of the urban area.

4. Results and Analysis

4.1. LST Area Distribution, Temperature, and Verification

From the LST retrieved by the Landsat, the maximum, minimum, and average surface temperatures of Hong Kong and Shenzhen were calculated (Table 3). As can be seen from the LST map (see Figure 3), both Shenzhen and Hong Kong experienced greater high-temperature areas in summer than in winter, with the LST area in Shenzhen larger than in Hong Kong. Moreover, Shenzhen’s relatively high-temperature area expanded greatly from 1998 to 2009, and then remained stable, whereas the relatively high-temperature area of Hong Kong was stable from 1998 to 2009. The relatively high-temperature areas occurred throughout northern Shenzhen, with severe high-temperature areas distributed mainly in the northwest, including in Guangming, Longhua, Bao’an, and Nanshan. The severe high-temperature areas in Hong Kong were located on the coasts of Kowloon, Lantau Island, and Hong Kong Island, excluding north of the New Territories and Hong Kong International Airport.

4.2. Land-Use Distribution and Verification of Land-Use Classification

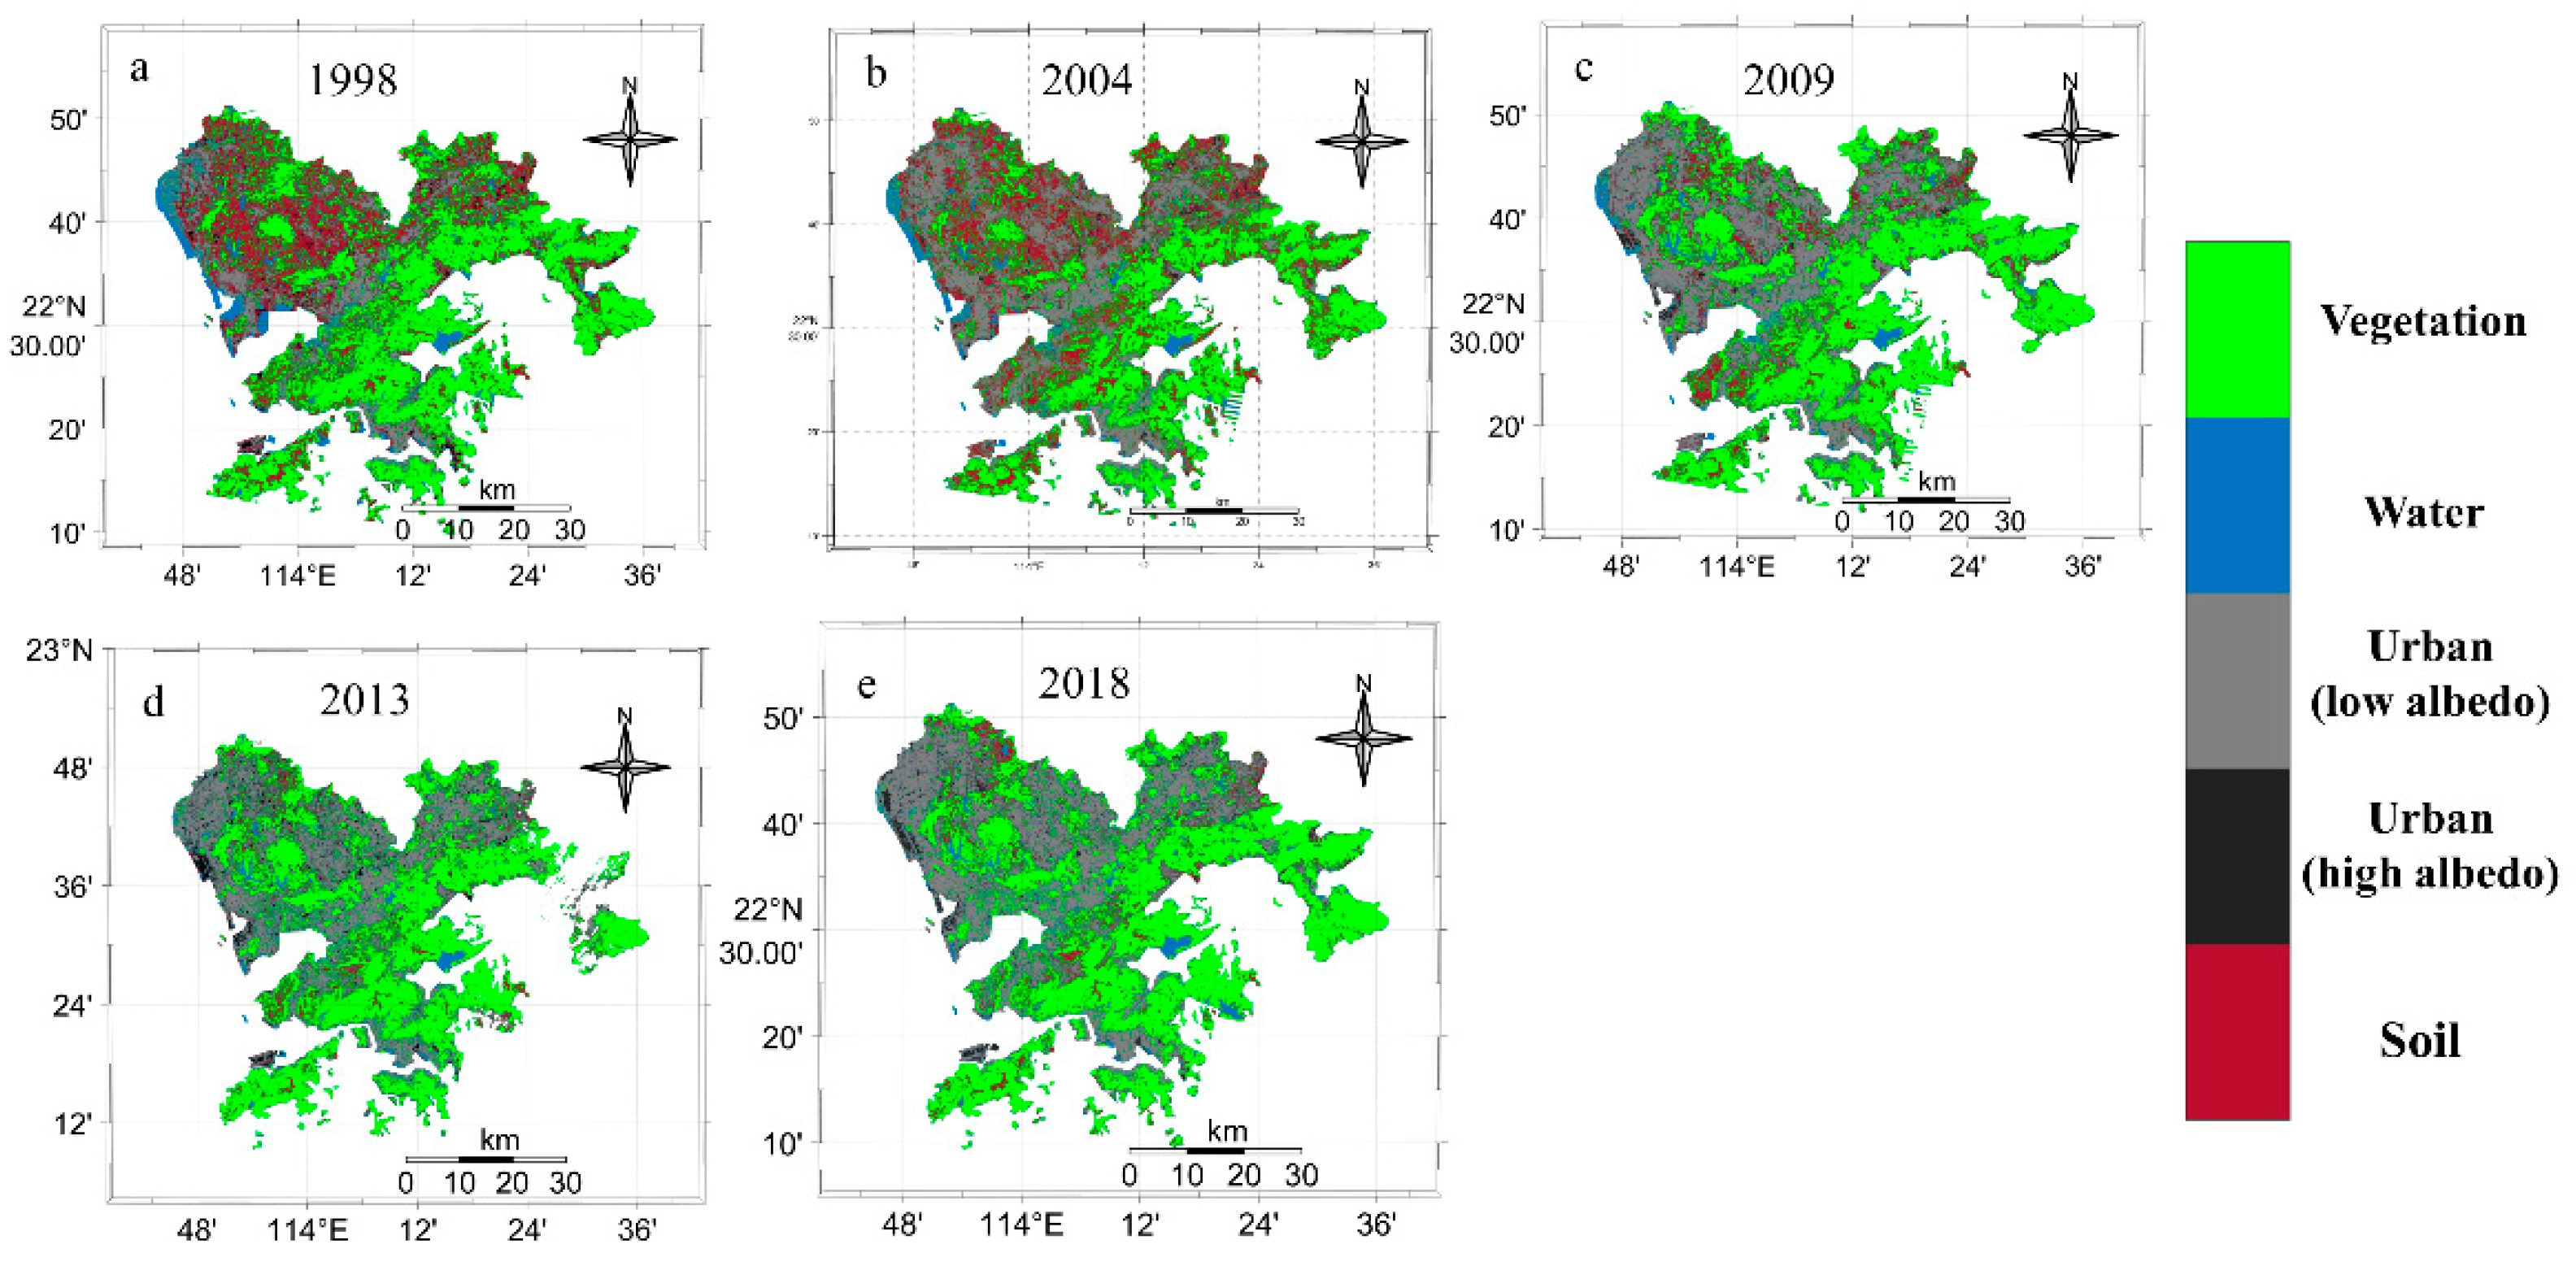
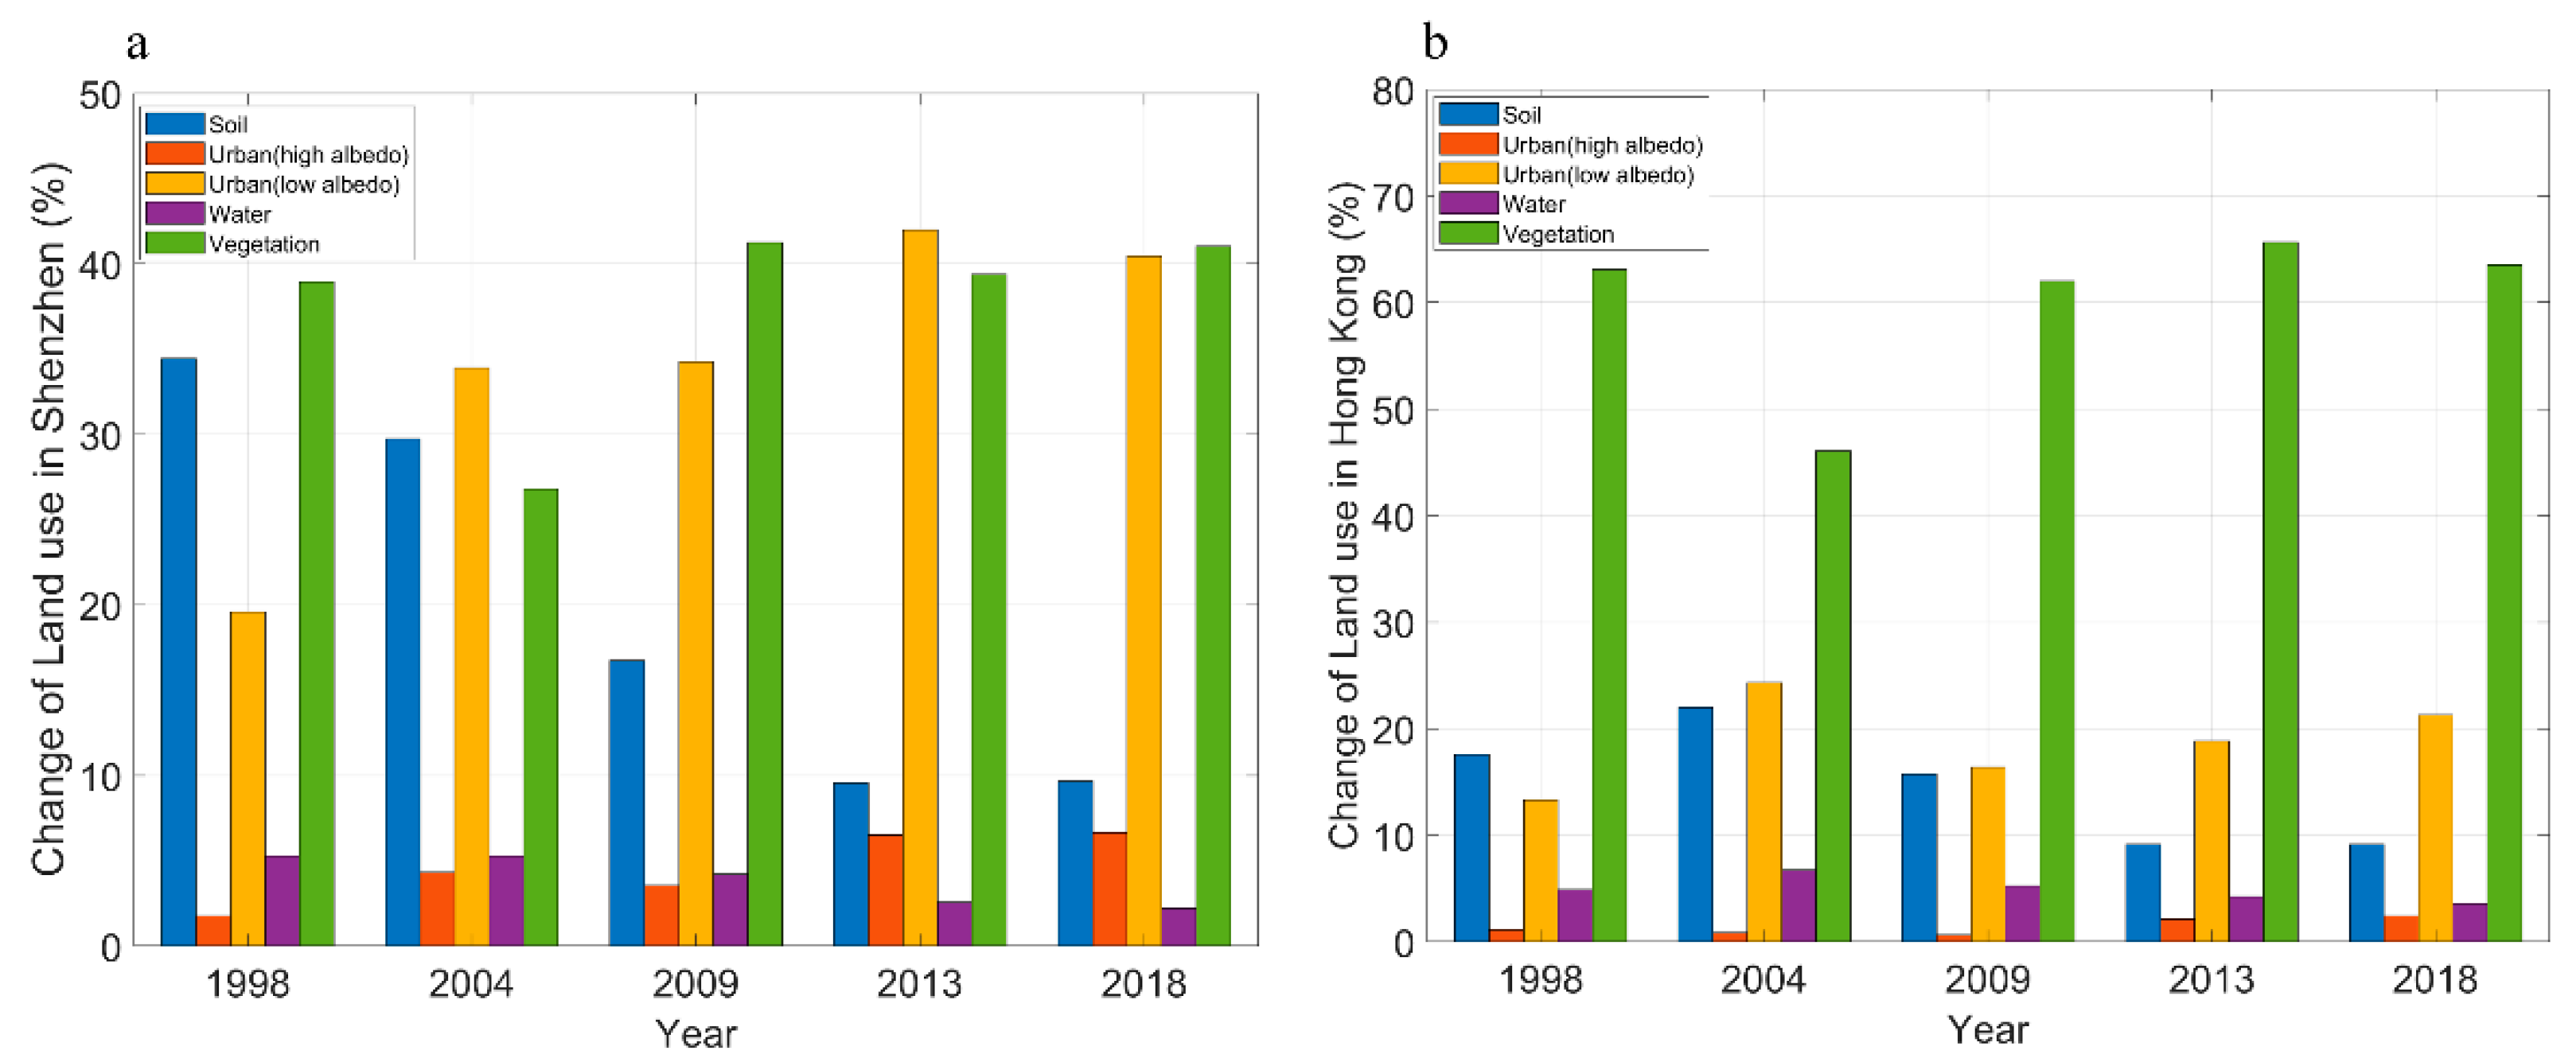
Unlike in Shenzhen, forest dominates in Hong Kong. Although Shenzhen has attempted to increase its proportion of forest cover, it remains less than Hong Kong’s, which has a vegetation cover rate exceeding 60%. By contrast, the high-albedo area in Shenzhen is greater than in Hong Kong (Figure 4 and Figure 5). In addition, Shenzhen’s high-albedo coverage has increased, indicating that the use of high-albedo materials has increased, while Hong Kong has remained almost unchanged.
The accuracy of the land-use classification was compared for the randomly selected ground true regions of interest (ROIs) and the classification results. From the classification results (Table 2), it is clear that the MLP algorithm classification, based on supervised classification, was highly accurate. Moreover, small specific objects were outlined after the extraction of the multiple band characteristics and the MLP were developed by training on ROI samples. Furthermore, the classification accuracy was verified against the urban morphology, with the shapes of the cool roofs essentially outlined using the MLP algorithm. Thus, the MLP algorithm is suitable for classifying specific objects, such as cool roofs, consistent with the findings of previous studies [21]. For example, on the basis of Google Earth Map data, as shown in Table 4, the high-albedo features outlined in the classification correspond to large complex public buildings, such as the Shenzhen Bay Sports Center, Shenzhen Bao’an International Airport, Hong Kong International Airport, and Hong Kong Stadium.

4.3. Multiple Regression Analysis

Detailed multiple regression model results are provided in Table 5 and Table 6. Low-albedo features are excluded by the multiple-stepwise linear regression because of collinearity. In summary, most of the factors included in the multiple regression method are significant. The determined LSTs of the urban areas in Shenzhen are similar to those in Hong Kong, with a summer temperature of approximately 25 °C in both areas, versus a winter temperature of 16 °C. The vegetation and water have negative effects on the LSTs, but the soil and the high albedo have positive effects. The LSTs were stable, with no clear annual deviations. Importantly, the high-albedo coefficient in Hong Kong was higher than in Shenzhen, indicating that artificial heat is one of the most important sources of the temperature differences between these two areas. In addition, although time-series data were not used in this model, the multiple line regression was input with a temperature-independent variable. Because it may exist in the spatial autocorrelation among the temperature of the surrounding pixels, autocorrelation must be considered in the model and the DW test (a tool designed for testing autocorrelation). The regression model applied in Shenzhen is significant but it is not in the case of Hong Kong. The p values in the t-statistics of Shenzhen and Hong Kong were less than 0.05, with Shenzhen’s DW values almost equal to 2, but Hong Kong’s less than 2, indicating autocorrelation in Hong Kong, perhaps as a result of the differences in the topographies between Shenzhen and Hong Kong. The relatively high-temperature area is wider in Shenzhen, but more centralized in Hong Kong, and because of the spatial autocorrelation, the multiple linear regression model is valid in Shenzhen, but is not statistically significant for Hong Kong and, thus, should be modified further using Moran’s I in ArcGIS.
The model result of November of 1998, Hong Kong, shows that if soil is increased in the urban area, the retrieval LST of the urban area will increase 2.29 °C on average. If high albedo is increased in the urban area, the retrieval LST of the urban area will increase 0.74 °C on average. If water is increased in the urban area, the retrieval LST of the urban area will decrease 5.77 °C on average. If vegetation is increased in the urban area, the retrieval LST of the urban area will decrease 4.82 °C on average.
The model result of Shenzhen in the November of 1998 shows that if soil is increased in the urban area, the retrieval LST of the urban area will increase 1.21 °C on average. If high albedo is increased in the urban area, the retrieval LST of the urban area will decrease 0.20 °C on average. If water is increased in the urban area, the retrieval LST of the urban area will decrease 8.86 °C on average. If vegetation is increased in the urban area, the retrieval LST of the urban area will decrease 4.34 °C on average.
The model result of Hong Kong in the November of 2004 shows that if soil is increased in the urban area, the retrieval LST of the urban area will increase 1.25 °C on average. If high albedo is increased in the urban area, the retrieval LST of the urban area will decrease 3.98 °C on average. If water is increased in the urban area, the retrieval LST of the urban area will decrease 6.66 °C on average. If vegetation is increased in the urban area, the retrieval LST of the urban area will decrease 4.72 °C on average.
The model result of Shenzhen in the November of 2004 shows that if soil is increased in the urban area, the retrieval LST of the urban area will decrease 0.73 °C on average. If high albedo is increased in the urban area, the retrieval LST of the urban area will decrease 0.72 °C on average. If water is increased in the urban area, the retrieval LST of the urban area will decrease 6.58 °C on average. If vegetation is increased in the urban area, the retrieval LST of the urban area will decrease 4.91 °C on average.
The model result of Hong Kong in the October of 2009 shows that if soil is increased in the urban area, the retrieval LST of the urban area will decrease 1.14 °C on average. If high albedo is increased in the urban area, the retrieval LST of the urban area will decrease 9.94 °C on average. If water is increased in the urban area, the retrieval LST of the urban area will decrease 6.88 °C on average. If vegetation is increased in the urban area, the retrieval LST of the urban area will decrease 5.78 °C on average.
The model result of Shenzhen in the October of 2009 shows that if soil is increased in the urban area, the retrieval LST of the urban area will decrease 1.31 °C on average. If high albedo is increased in the urban area, the retrieval LST of the urban area will decrease −0.13 °C on average. If water is increased in the urban area, the retrieval LST of the urban area will decrease 8.33 °C on average. If vegetation is increased in the urban area, the retrieval LST of the urban area will decrease 6.19 °C on average.
The model result of Hong Kong in the October of 2013 shows that if soil is increased in the urban area, the retrieval LST of the urban area will decrease 2.42 °C on average. If high albedo is increased in the urban area, the retrieval LST of the urban area will increase 5.95 °C on average. If water is increased in the urban area, the retrieval LST of the urban area will decrease 4.31 °C on average. If vegetation is increased in the urban area, the retrieval LST of the urban area will decrease 4.42 °C on average.
The model result of Shenzhen in the October of 2013 shows that if soil is increased in the urban area, the retrieval LST of the urban area will increase 0.89 °C on average. If high albedo is increased in the urban area, the retrieval LST of the urban area will increase 2.93 °C on average. If water is increased in the urban area, the retrieval LST of the urban area will decrease 2.08 °C on average. If vegetation is increased in the urban area, the retrieval LST of the urban area will decrease 3.85 °C on average.
The model result of Hong Kong in the February of 2018 shows that if soil is increased in the urban area, the retrieval LST of the urban area will increase 1.94 °C on average. If high albedo is increased in the urban area, the retrieval LST of the urban area will increase 6.89 °C on average. If water is increased in the urban area, the retrieval LST of the urban area will decrease 6.72 °C on average. If vegetation is increased in the urban area, the retrieval LST of the urban area will decrease 3.73 °C on average.
The model result of Shenzhen in the February of 2018 shows that if soil is increased in the urban area, the retrieval LST of the urban area will increase 0.24 °C on average. If high albedo is increased in the urban area, the retrieval LST of the urban area will increase 6.40 °C on average. If water is increased in the urban area, the retrieval LST of the urban area will decrease 6.07 °C on average. If vegetation is increased in the urban area, the retrieval LST of the urban area will decrease 3.35 °C on average.

5. Discussion

According to the experiment results, vegetation and water have negative relationships with temperature in both Shenzhen and Hong Kong, of which water has the strongest relationship, followed by vegetation. These findings are consistent with previous research. Yu et al. [22] used Landsat-8 data from April 2015 to conduct UHI research in Guangxi and showed that the LST of soil was higher than that of the urban area, with the LST of the urban area higher than that of grass, and with water having the lowest LST. Furthermore, the LST map also shows that the UHI area in Shenzhen is larger than that in Hong Kong, which is also in line with the study of Tsou et al. and Yu et al.’s study, mentioned before [3,22]. Thus, vegetation and water play important roles in decreasing the UHI effect in cities. Interestingly, soils have an unstable relationship with temperature.
Lots of literature has evidenced that high-albedo features, such as cool roofs, are the ideal materials for energy performance [23,24]. Still, some research has also pointed out that many different factors can affect the performance of the cool roof, such as seasonal factors and varying climatic conditions [25,26]. This study also investigated the energy performances of high-albedo features in Shenzhen and Hong Kong, showing that the temperatures of high-albedo features in Hong Kong were higher than in Shenzhen. Surprisingly, on the basis of further analysis, after using the raster tool in ENVI5.3 combined with the classification result layer and the temperature information, we found that the surfaces of high-albedo features have higher temperatures than the nearby surrounding environment, perhaps because buildings that have high albedos tend to be large public buildings [27], with high levels of energy consumption. These findings are consistent with the MLP classification results, such as those for the Hong Kong Convention and Exhibition Centre. From a design perspective, large public buildings or factories are likely to be fitted with a high albedo. Still, high-albedo features alone are not sufficient to cope with the high temperatures caused by the artificial heat resulting from the building’s high-energy consumption, which outweighs the heat dissipation by the cool roof. Considering air conditioning requirements as an example, it is well known that the temperatures of shopping malls in Hong Kong are much lower than those in Shenzhen because cooler temperatures promote dehumidification. In fact, according to the Hong Kong government’s Electrical and Mechanical Services Department, building energy consumption is more than 60% of the total energy consumption in Hong Kong [28], and the Hong Kong Energy End-use Data 2017 report notes that, in residential and commercial buildings, air conditioning energy consumption ranks highest [29].

6. Conclusions

With heat waves becoming more prevalent worldwide, the UHI effect is increasingly attracting public attention. This study applied the RTE method to determine the LSTs [30] in Shenzhen and Hong Kong using Landsat data from 1998–2018. The LST data indicated that relatively high-temperature areas occurred throughout Shenzhen but were smaller and more centralized in Hong Kong. In Shenzhen the relatively high-temperature areas were concentrated in the center and the west, whereas, in Hong Kong, it was concentrated in Kowloon and along the coasts of Lantau Island and Hong Kong Island, particularly at Hong Kong International Airport, consistent with previous research.
The experimental results show a positive and uncertain relationship between soil and the LST, but vegetation and water have strong negative relationships with the LST [30]. This finding suggests the potential for alleviating the UHI effect using green spaces or water in urban areas. In reality, there is evidence of the effectiveness of green roofs. Estimating available green roof areas using high-spatial-resolution satellite images and natural color orthoimagery, Theodoridou et al. assessed and quantified green roof areas and the benefits in Thessaloniki, finding that green roofs can increase the rate coefficients of open green spaces and carbon sequestration, saving energy and improving rainwater drainage [31].
Nonetheless, the organic combination, or portfolio, of the green space, green plants and water may play a significant role in reducing the UHI effect in urban areas, such as through the green-blue roof and the park cool island (PCI). In a case study in Seoul, Korea, Shafique and Kim monitored the effect of blue roofs using platinum silicone patch sensors (RTF5). They found that, under the same climatic conditions, the temperatures of the green-blue roofs were 5 to 9 °C less than those of control roofs [32]. Similarly, Wang et al. analyzed the Landsat-8 OLI data of eighteen different-sized parks in Changzhou and found that the LSTs of the parks could decrease the LSTs of their surroundings, thanks to lower temperatures. Moreover, they found that the composition or characteristics of a park, such as the shape (perimeter/area), the leaf-area index (LAI), the density, tree cover, water cover, and the impervious-surface cover had various significant effects on the PCI [33].
A practical classification method, the MLP algorithm, and supervised classification were used to identify the types of land use/land cover to further investigate the relationship between LULC and the LSTs in Shenzhen and Hong Kong. Furthermore, multiple linear regression models featuring dummy variables were used to quantify the relationships between LULC and the LSTs in Shenzhen and Hong Kong, showing that the temperature of Hong Kong was higher than Shenzhen, indicating a potentially more substantial UHI effect in Hong Kong. According to the DW test, the model is valid for Shenzhen but shows existing spatial autoregression in Hong Kong, perhaps because of the differences in the topographies. Thus, the regression model needs to be modified for the case of Hong Kong to include the characteristics of spatial autoregression. Furthermore, the classification method confirmed the MLP algorithm’s accuracy at classifying small and specific objects, which could aid in conserving resources for surveying the different spectral characteristics of various objects and provide a new method for classifying cool roofs. The multiple linear regression models with dummy variables are appropriate tools for establishing and quantifying the relationship between LULC and the LST, different from the traditional regression with the NDVI and the NDWI.
Owing to limitations on time and resources, only one method was used to determine the LST. Errors of classification could have led to regression errors, and differences were seen between the LST and the atmospheric temperature, making the effective reduction in temperature caused by cool roofs challenging to quantify.

Author Contributions

F.F.Z. and Y.Z. conceived, designed, and performed the experiments, analyzed the data, and wrote the paper; J.F., T.X. and Y.L. improved the data analysis. J.Y.T. and R.Y.M.L. contributed reagent/material/analysis tools. All authors have read and agreed to the published version of the manuscript.

Funding

This research is jointly supported by the National Natural Science Foundation of China (U1901215), the Marine Special Program of Jiangsu Province in China (JSZRHYKJ202007), and the Natural Scientific Foundation of Jiangsu Province (BK20181413).

Institutional Review Board Statement

Not applicable.

Informed Consent Statement

Not applicable.

Data Availability Statement

Not applicable.

Acknowledgments

The authors are extremely grateful for the Landsat TM from the U.S. Geological Survey (USGS) and the regional map of Hong Kong data from the database of Global Administrative Areas, GADM. The vector map of Shenzhen was downloaded from DIVA-GIS. The atmospheric correction parameter and the temperature data from NASA (http://atmcorr.gsfc.nasa.gov/ accessed on 22 November 2021) and the Hong Kong Observatory are greatly appreciated in this research.

Conflicts of Interest

The authors declare no conflict of interest.

References

  1. Li, R.Y.M.; Cheung, K.Y.; Shoaib, M. Walled buildings, sustainability, and housing prices: An artificial neural network approach. Sustainability 2018, 10, 1298. [Google Scholar] [CrossRef] [Green Version]
  2. Arnberger, A.; Allex, B.; Eder, R.; Ebenberger, M.; Wanka, A.; Kolland, F.; Wallner, P.; Hutter, H. Elderly resident’s uses of and preferences for urban green spaces during heat periods. Urban For. Urban Green. 2017, 21, 102–115. [Google Scholar] [CrossRef]
  3. Tsou, J.; Zhuang, J.; Li, Y.; Zhang, Y. Urban Heat Island Assessment Using the Landsat 8 Data: A Case Study in Shenzhen and Hong Kong. Urban Sci. 2017, 1, 10. [Google Scholar] [CrossRef]
  4. Ibitoye, M.; Aderibigbe, O.; Adegboyega, S.; Adebola, A. Spatio-temporal analysis of land surface temperature variations in the rapidly developing Akure and its environs, southwestern Nigeria using Landsat data. Ethiop. J. Environ. Stud. Manag. 2017, 10, 389. [Google Scholar] [CrossRef] [Green Version]
  5. Youssef, A.; Pourghasemi, H.; Pourtaghi, Z.; Al-Katheeri, M. Erratum to: Landslide susceptibility mapping using random forest, boosted regression tree, classification and regression tree, and general linear models and comparison of their performance at Wadi Tayyah Basin, Asir Region, Saudi Arabia. Landslides 2015, 13, 1315–1318. [Google Scholar] [CrossRef] [Green Version]
  6. Ahmed, S. Assessment of urban heat islands and impact of climate change on socioeconomic over Suez Governorate using remote sensing and GIS techniques. Egypt. J. Remote Sens. Space Sci. 2018, 21, 15–25. [Google Scholar] [CrossRef]
  7. Takebayashi, H.; Senoo, M. Analysis of the relationship between urban size and heat island intensity using WRF model. Urban Clim. 2018, 24, 287–298. [Google Scholar] [CrossRef]
  8. Dwivedi, A.; Mohan, B. Impact of green roof on micro climate to reduce Urban Heat Island. Remote Sens. Appl. Soc. Environ. 2018, 10, 56–69. [Google Scholar] [CrossRef]
  9. Du, H.; Cai, W.; Xu, Y.; Wang, Z.; Wang, Y.; Cai, Y. Quantifying the cool island effects of urban green spaces using remote sensing Data. Urban For. Urban Green. 2017, 27, 24–31. [Google Scholar] [CrossRef]
  10. Yamagata, H.; Yoshizawa, M.; Miyamoto, A.; Minamiyama, M.; Nasu, M. Heat island mitigation using water retentive pavement sprinkled with reclaimed wastewater. Water Sci. Technol. 2008, 57, 763. [Google Scholar] [CrossRef]
  11. Steeneveld, G.; Koopmans, S.; Heusinkveld, B.; Theeuwes, N. Refreshing the role of open water surfaces on mitigating the maximum urban heat island effect. Landsc. Urban Plan. 2014, 121, 92–96. [Google Scholar] [CrossRef]
  12. Ban-Weiss, G.; Woods, J.; Levinson, R. Using remote sensing to quantify albedo of roofs in seven California cities, Part 1: Methods. Sol. Energy 2015, 115, 777–790. [Google Scholar] [CrossRef] [Green Version]
  13. Yang, Y.; Kang, I.; Chung, M.; Kim, S.; Park, J. Effect of PCM cool roof system on the reduction in urban heat island phenomenon. Build. Environ. 2017, 122, 411–421. [Google Scholar] [CrossRef]
  14. Macintyre, H.L.; Heaviside, C. Potential benefits of cool roofs in reducing heat-related mortality during heatwaves in a European city. Environ. Int. 2019, 127, 430–441. [Google Scholar] [CrossRef] [PubMed]
  15. ESRI. Available online: https://www.esri.com/en-us/home (accessed on 14 July 2018).
  16. Wang, M.; Zhang, Z.; Hu, T.; Wang, G.; He, G.; Zhang, Z.; Li, H.; Wu, Z.; Liu, X. An efficient Framework for Producing Landsat Based Land Surface Temperature Data using Google Earth Engine. IEEE J. Sel. Top. Appl. Earth Obs. Remote Sens. 2020, 13, 4689–4701. [Google Scholar] [CrossRef]
  17. Apresyan, L.A.; Kravtsov, Y.A. Radiation Transfer: Statistical and Wave Aspects; CRC Press: Boca Raton, FL, USA, 2019. [Google Scholar]
  18. Budak, V.P.; Veklenko, B.A. Boson peak, flickering noise, backscattering processes and radiative transfer in random media. J. Quant. Spectrosc. Radiat. Transf. 2011, 112, 864–875. [Google Scholar] [CrossRef]
  19. Atmospheric Correction Parameter Calculator. Available online: http://atmcorr.gsfc.nasa.gov/ (accessed on 14 July 2018).
  20. Debella-Gilo, M.; Gjertsen, A.K. Mapping Seasonal Agricultural Land Use Types Using Deep Learning on Sentinel-2 Image Time Series. Remote Sens. 2021, 13, 289. [Google Scholar] [CrossRef]
  21. Dong, X.; Meng, Z.; Wang, Y.; Zhang, Y.; Sun, H.; Wang, Q. Monitoring Spatiotemporal Changes of Impervious Surfaces in Beijing City Using Random Forest Algorithm and Textural Features. Remote Sens. 2021, 13, 153. [Google Scholar] [CrossRef]
  22. Yu, S.; Li, L.; Chen, L.; Wu, Y.; Lu, D.; Ye, S. A Study of Urban Heat-Island Effect of Nanning City Based on Landsat TM Data. Available online: http://en.cnki.com.cn/Article_en/CJFDTotal-NXNL201305029.htm (accessed on 14 July 2018).
  23. Barozzi, B.; Pollastro, M. Assessment of the Impact of Cool Roofs in Temperate Climates through a Comparative Experimental Campaign in Outdoor Test Cells. Buildings 2016, 6, 52. [Google Scholar] [CrossRef] [Green Version]
  24. Wang, Y.; Berardi, U.; Akbari, H. Comparing the effects of urban heat island mitigation strategies for Toronto, Canada. Energy Build. 2016, 114, 2–19. [Google Scholar] [CrossRef]
  25. Pisello, A.; Rossi, F.; Cotana, F. Summer and Winter Effect of Innovative Cool Roof Tiles on the Dynamic Thermal Behavior of Buildings. Energies 2014, 7, 2343–2361. [Google Scholar] [CrossRef] [Green Version]
  26. Piselli, C.; Pisello, A.L.; Saffari, M.; de Gracia, A.; Cotana, F.; Cabeza, L.F. Cool Roof Impact on Building Energy Need: The Role of Thermal Insulation with Varying Climate Conditions. Energies 2019, 12, 3354. [Google Scholar] [CrossRef] [Green Version]
  27. Zhang, F.; Kung, H.; Johnson, V. Assessment of Land-Cover/Land-Use Change and Landscape Patterns in the Two National Nature Reserves of Ebinur Lake Watershed, Xinjiang, China. Sustainability 2017, 9, 724. [Google Scholar] [CrossRef] [Green Version]
  28. HK EE Net—General Introduction. Available online: http://ee.emsd.gov.hk/english/general/gen_energy/gen_en_intro.html (accessed on 14 July 2018).
  29. Hong Kong Energy End-Use Data. Available online: https://www.emsd.gov.hk/filemanager/en/content_762/HKEEUD2017.pdf (accessed on 14 July 2018).
  30. Liu, L.; Zhang, Y. Urban heat island analysis using the Landsat TM data and ASTER data: A case study in Hong Kong. Remote Sens. 2011, 3, 1535–1552. [Google Scholar] [CrossRef] [Green Version]
  31. Theodoridou, I.; Karteris, M.; Mallinis, G.; Tsiros, E.; Karteris, A. Assessing the Benefits from Retrofitting Green Roofs in Mediterranean, Using Environmental Modelling, GIS and Very High Spatial Resolution Remote Sensing Data: The Example of Thessaloniki, Greece. Procedia Environ. Sci. 2017, 38, 530–537. [Google Scholar] [CrossRef]
  32. Shafique, M.; Kim, R. Application of green blue roof to mitigate heat island phenomena and resilient to climate change in urban areas: A case study from Seoul, Korea. J. Water Land Dev. 2017, 33, 165–170. [Google Scholar] [CrossRef] [Green Version]
  33. Wang, X.; Cheng, H.; Xi, J.; Yang, G.; Zhao, Y. Relationship between Park Composition, Vegetation Characteristics and Cool Island Effect. Sustainability 2018, 10, 587. [Google Scholar] [CrossRef] [Green Version]
Figure 1. Workflow of the procedure.
Sustainability 13 13706 g001
Figure 2. Study areas of Hong Kong and Shenzhen.
Sustainability 13 13706 g002
Figure 3. The LST retrieved by Landsat images.
Sustainability 13 13706 g003
Figure 4. Land-type classification results.
Sustainability 13 13706 g004
Figure 5. Percentage of each land-use type.
Sustainability 13 13706 g005
Table 1. Data collection of Landsat images.
SatelliteSensor IDPixel Size (m)Path,Row DataPath,RowData
Landsat 8OLI and TIRS30121,449 March 2018122,4422 February 2018
Landsat 8OLI and TIRS30121,4424 December 2013122,4429 November 2013
Landsat 5TM30121,4410 October 2009122,4417 October 2009
Landsat 5TM30121,4429 November 2004122,4420 November 2004
Landsat 5TM30121,4413 November 1998122,444 November 1998
Table 2. Sample points and classification accuracies.
VegetationSoilWaterImpervious Surface (High-Albedo)Impervious Surface (Low-Albedo)TotalOverall Accuracy
Landsat OLI1199466586403513316798%
Landsat TM587236413313444199397%
Table 3. Maximum, minimum, and average surface temperatures in Hong Kong and Shenzhen.
Shenzhen Hong Kong
Max °CMin °CMean°CMax °CMin °CMean°C
1998.11.04 40.1112.8124.5144.7615.0725.11
2004.11.2035.3013.3922.7940.1313.1922.79
2009.10.1743.6517.4626.6945.5418.2226.30
2013.11.2934.037.7816.8228.928.2916.65
2018.02.2236.077.5717.3331.697.4215.93
Table 4. Verification for the accuracy of land-use classification (2018).
Landmark Classification ResultLandsat ImageGoogle Earth MapLST
Shenzhen Bay Sports Center Sustainability 13 13706 i001 Sustainability 13 13706 i002 Sustainability 13 13706 i00321.11 °C
Shenzhen Bao’an International Airport Sustainability 13 13706 i004 Sustainability 13 13706 i005 Sustainability 13 13706 i00623.38 °C
Hong Kong International Airport Sustainability 13 13706 i007 Sustainability 13 13706 i008 Sustainability 13 13706 i00925.12 °C
Hong Kong Stadium Sustainability 13 13706 i010 Sustainability 13 13706 i011 Sustainability 13 13706 i01218.37 °C
Table 5. The regression coefficient of each predictor in Hong Kong, where the part in bold indicates that the p-value of the predictor ≤ 0.05.
Hong Kong19982004200920132018
Soil2.291.25−1.14−2.421.94
High albedo0.743.989.945.956.89
Water−5.77−6.66−6.88−4.31−6.72
Vegetation−4.82−4.72−5.78−4.42−3.73
Table 6. The regression coefficient of each predictor in Shenzhen, where the part in bold indicates that the p-value of the predictor ≤ 0.05.
Shenzhen19982004200920132018
Soil1.21−0.73−1.310.890.24
High albedo−0.20−0.72−0.132.936.40
Water−8.86−6.58−8.33−2.08−6.07
Vegetation−4.34−4.91−6.19−3.85−3.35
Publisher’s Note: MDPI stays neutral with regard to jurisdictional claims in published maps and institutional affiliations.

