
Is PET an Adequate Index to Determine Human Thermal Comfort in Mexico City?
by
 , and
, and
Monica Ballinas
1,
Sara Ivonne Morales-Santiago
2,
Victor L. Barradas
3,*,
Adriana Lira
1 and
Gerardo Oliva-Salinas
1 1
Laboratorio de Entornos Sostenibles-Centro de Investigaciones en Arquitectura, Urbanismo y Paisaje, Facultad de Arquitectura, Universidad Nacional Autónoma de México, Mexico City 04510, Mexico
2
Facultad de Estudios Superiores Zaragoza, Universidad Nacional Autónoma de México, Mexico City 09230, Mexico
3
Laboratorio de Interacción Planta-Atmósfera, Instituto de Ecología, Universidad Nacional Autónoma de México, Mexico City 04510, Mexico
*
Author to whom correspondence should be addressed.
Sustainability 2022, 14(19), 12539; https://doi.org/10.3390/su141912539
Submission received: 15 June 2022
/
Revised: 26 September 2022
/
Accepted: 28 September 2022
/
Published: 1 October 2022
(This article belongs to the Collection Adaptive Cities: Urban Planning and Design Contribution for Achieving Climate Resilient Cities)
Abstract
:The urban heat island (UHI) is mostly due to urbanization. This phenomenon in concert with the high temperatures caused by global climate change may profoundly affect human thermal comfort, which can influence human productivity and morbidity especially in spring/summer period. The main objective of this investigation was to determine changes in degree of thermal comfort of Mexico City’s inhabitants and compare it with the physiological equivalent temperature (PET) to evaluate whether PET and its categorization are adequate to be applied in Mexico City. A series of microclimatological measurements to estimate PET were made at four sites including the city’s center. Concomitantly, a series of surveys of thermal perception were applied to 1300 passersby. The results show that PET has increased from 1990 to 2020 from 0.1208 °C/year to 0.1498 °C/year in the study sites, in addition to overestimating the degree of thermal comfort of people according to the stablished categories or classes. It is concluded that it is necessary to adjust thermal stress categories. Knowing the percentages of people without thermal comfort will lead us to determine different ranges in environmental parameters to define an acceptable environment for most people.
1. Introduction
There are two mechanisms that alter or increase the temperature in urban areas: the urban heat island (UHI) and global climate change. The UHI phenomenon has led to increased air temperatures in urban areas compared with their rural surroundings (e.g., [1,2,3,4]). Air temperature rises in a city or urban area due to the redistribution and storage (heat) of solar radiation energy because of changes in land use. The UHI in Mexico City can be as high as 6 to 7 °C on average but can also be established during the day with intensities of up to 10 °C [5].
This increase in temperature implies a direct effect on the thermal comfort index, where undoubtedly people will experience more heat stress and with it a decrease in productivity, and human health [6,7,8,9,10]. Heat stress could also be the beginning of leading to morbidity leading to mortality [11,12,13,14]. Additionally, temperature differences could be exacerbated by global climate change [15], and heatwaves will increase or at least be enhanced by the effect of the UHI [16,17,18,19,20,21]. It was established that the UHI phenomenon has been increasing over the years in cities [22]. From these points of view, the UHI could be considered to be a form of thermal pollution.
It was shown that there are two approaches in the context of human thermal comfort: the synthetic method, which is the combination of several meteorological variables to express thermal comfort comprising many empirical indexes. In addition, the analytical method explains the physical bases of thermal comfort by examining the exchanges of energy between the human being and the surrounding environment [23]. Empirical relationships are valid just for the tested persons and the specific meteorological conditions/sites with which these relations were built. While the analytical method has a characteristic of universality, and therefore is most suitable for predicting human thermal comfort.
One of these indices is the so-called physiological equivalent temperature (PET), which includes a categorization of human thermal perception and the degree of human physiological stress. This index also incorporates physical characteristics of people: weight, height, activity (metabolism), and gender [24].
Because of that, there is much research on human thermal comfort using PET around the world in many locations, in addition to being an index of easy application if the RayMan model is used [25]. However, these studies have not considered whether or not it is possible to use this index [26], and is applied indiscriminately.
Human thermal balance depends on physical activity, type of clothes and environmental parameters such as radiation, and air temperature and humidity [25], and the degree of acclimatization of the city´s inhabitants. However, and despite there being human comfort indexes based on an energy balance between the person and their surroundings, it is advisable to verify whether any of these indices can determine the degree of comfort in some other place where they were generated since acclimatization is different for each part of the world. For example, in Mexico City, the annual average temperature is 15.0 °C, and 21.0 °C in Belo Horizonte, Brazil and 8.0 °C in Freiburg, Germany, and undoubtedly the acclimatization for the inhabitants of these cities must be different and therefore, there will probably be a bias in the categorization of human thermal comfort [27].
Exploring the behavior of these thermal comfort indexes is important in any city with different types of acclimatation. This must be the first step to know more precisely the performance of the physiological equivalent temperature to achieve a better environment in outdoors and housing to move to a more sustainable city identifying how people senses the thermal stress in order to design adequately the housing and the city.
The main objective of this investigation was to determine the changes in the degree of thermal comfort of Mexico City’s inhabitants and compare it with the PET to evaluate whether PET and its categorization are adequate to be applied to Mexico City.
2. Materials and Methods
2.1. Study Site
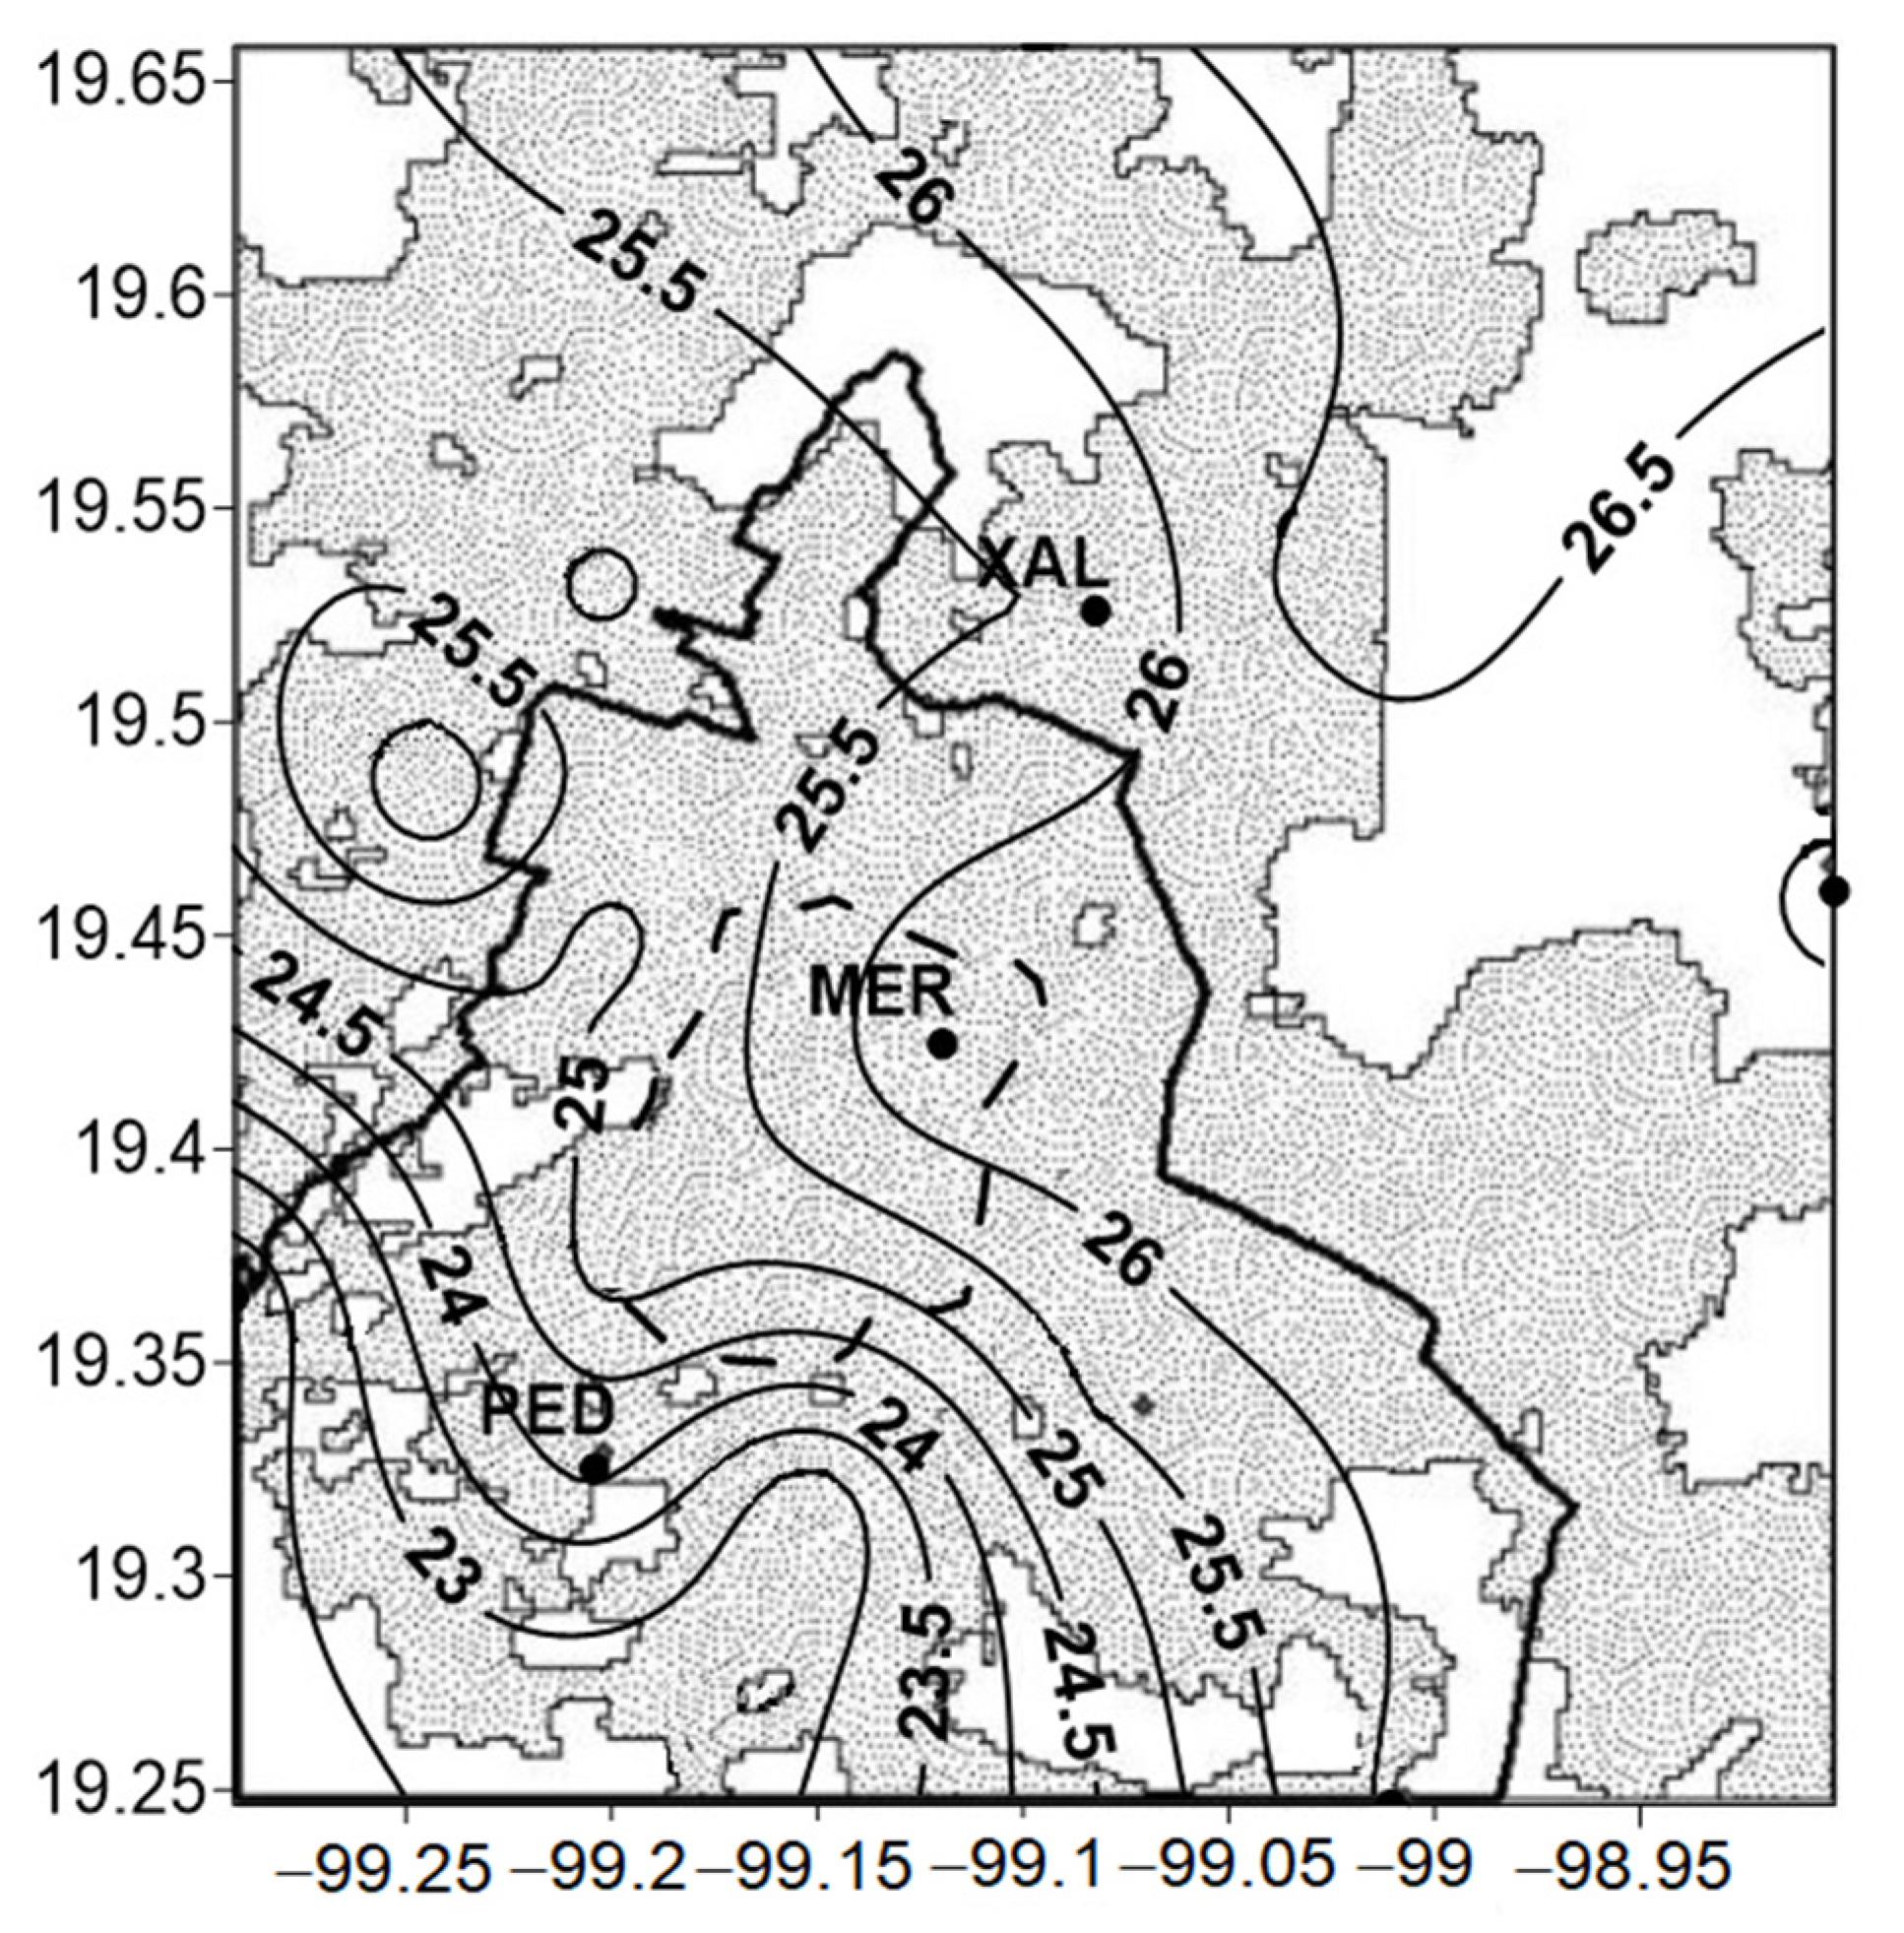
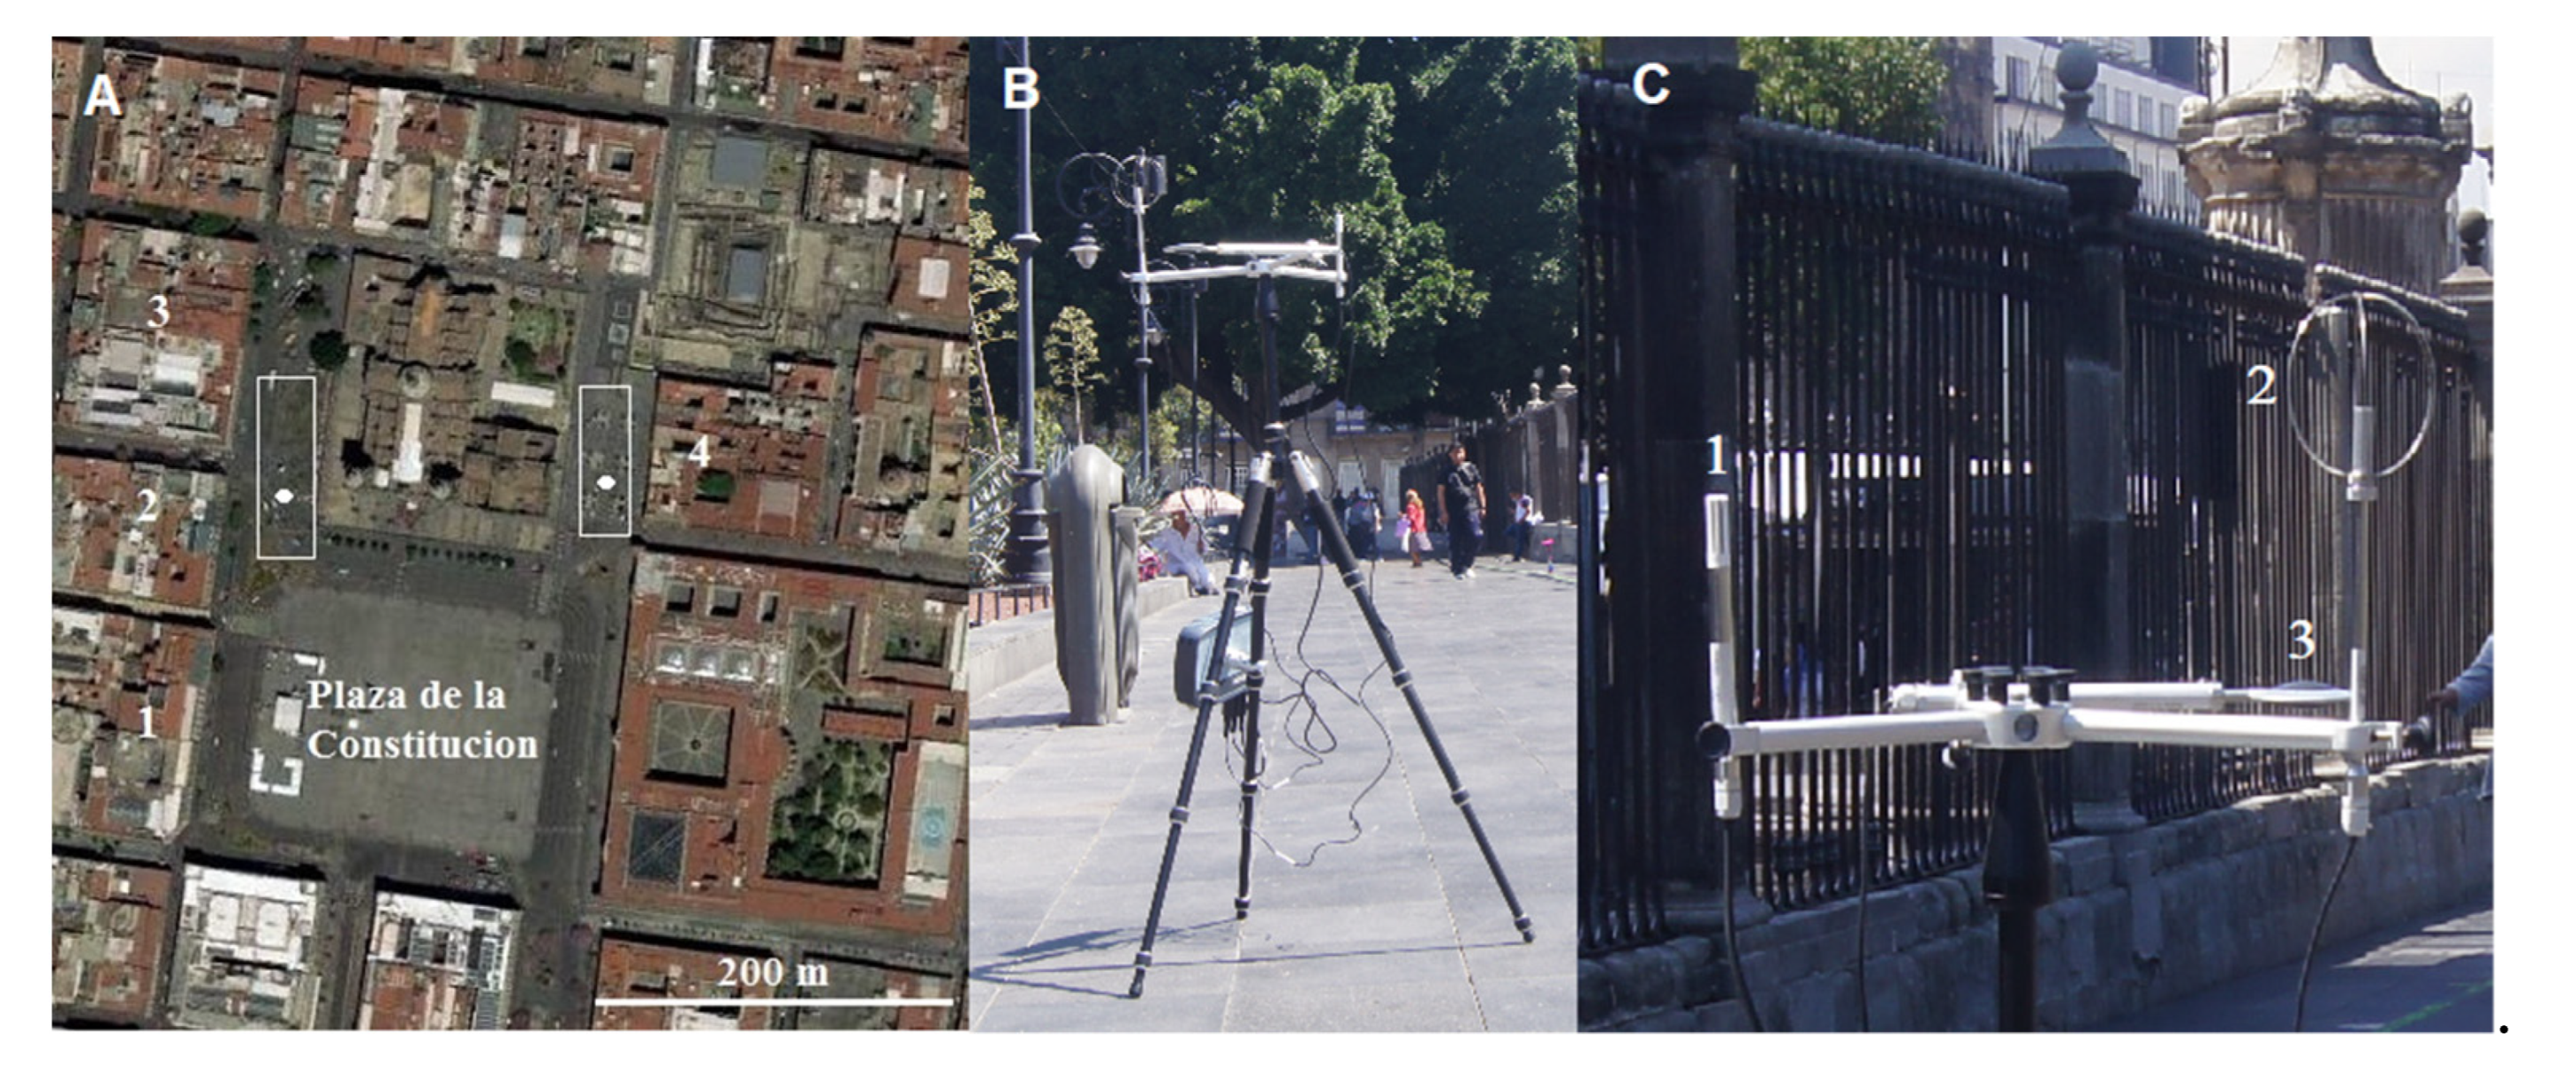
Meteorological data (irradiance, air temperature, relative humidity, wind speed and direction) were collected from the meteorological stations at Xalostoc (XAL), La Merced (MER) and Pedregal (PED) districts; these stations belong to the Mexico City´s urban meteorological network (RedMet). La Merced is part of the commercial and historical center of the metropolitan area of Mexico City (19.4285° N; 99.1277° W; 2245 m asl), while Xalostoc (19.5260° N; 99.0824° W; 2160 m asl) and Pedregal (19.3251° N; 99.2041° W; 2326 m asl) are located in suburban areas with a low grade of urbanization, in the northeast and southwest, respectively (Figure 1). All surveys were performed around La Plaza de la Constitución (19.433° N; 99.133° W; 2229.7 m asl) in the mere political center of the country in completely open spaces and about 1.8 km from La Merced (Figure 2). Plaza de la Constitución is located in the Cuauhtémoc municipality, which is the second most populous district in the city with a population density of 16,848 inhabitants/km2. Mexico City has a highland subtropical climate. Mean annual precipitation (mean of 30 year.) is 275.7 mm, and almost 88.5% occurs during the rainy season (May–September) [28]. Winds are light and predominantly from the northeast. Extreme maximum and minimum temperatures are registered in April and May (30.6 °C) and January and December (0.6 °C), respectively; mean annual temperature is 14.6 °C [28], with a marked UHI effect in the urban area [29]. The UHI effect was established during the daytime, with intensities of up to 10 °C [4]. In Figure 1, we show the distribution of the average temperature (°C) in Mexico City at 14:00 local time in the month of May 2016. These isolines were calculated with data from RedMet [30].
2.2. Bioclimatic Index, Surveys and Meteorological Data
The PET index, defined as the physiological equivalent temperature in any place (indoors or outdoors), is equivalent to the temperature of the air in which in a typical interior arrangement (without solar radiation and wind), the heat load of the human body, maintains the temperature of the skin and body equal to those under conditions in which it is evaluated [24,31]. PET can be estimated by the RayMan model [25,32]. For more information, see Appendix A. We chose this index because it is possible to modify the meteorological variables depending on the place of the study area, as well as the physiological characteristics of people as required obtaining a result of greater precision, likewise the result obtained is given in Celsius degrees, which facilitates its application and subsequent analysis.
The surveys were carried out with reference to [33,34,35] and were divided into four parts: first, we selected the site where the survey was conducted, with the date and local time. The second filter question was to know the user’s time within the area and whether their geographical location/residence in the last five years had been in Mexico City, in order to determine if the survey was appropriate; this was done due to possible complications because of the lack of acclimatization of the users. In the third part, personal data such as gender, weight (kg), height (m), age, and level of studies were collected, and the fourth part indicated the level of physical activity (W, W/m2), the way the respondents were dressed (Iclo) to determine the heat transfer resistance (clo) of clothing, where clo takes values from 0 to 1 [36]. In the last part, verbal and graphic scale of thermal perception was determined, as well as its perception with the atmospheric characteristics at that moment when the surveys were carrying out. We performed 1300 surveys, from 10:00 to 16:00 h, every 30 min during the months of May and June 2019, and June 2021. Before applying the surveys, the respondents were asked for permission to carry out the survey. Then, they were informed of the goals and content of the experiment and, although it was a completely anonymous survey, they were assured that the data obtained would be used only for scientific purposes. All the people surveyed participated voluntarily. Appendix A refers only to the degree of thermal comfort.
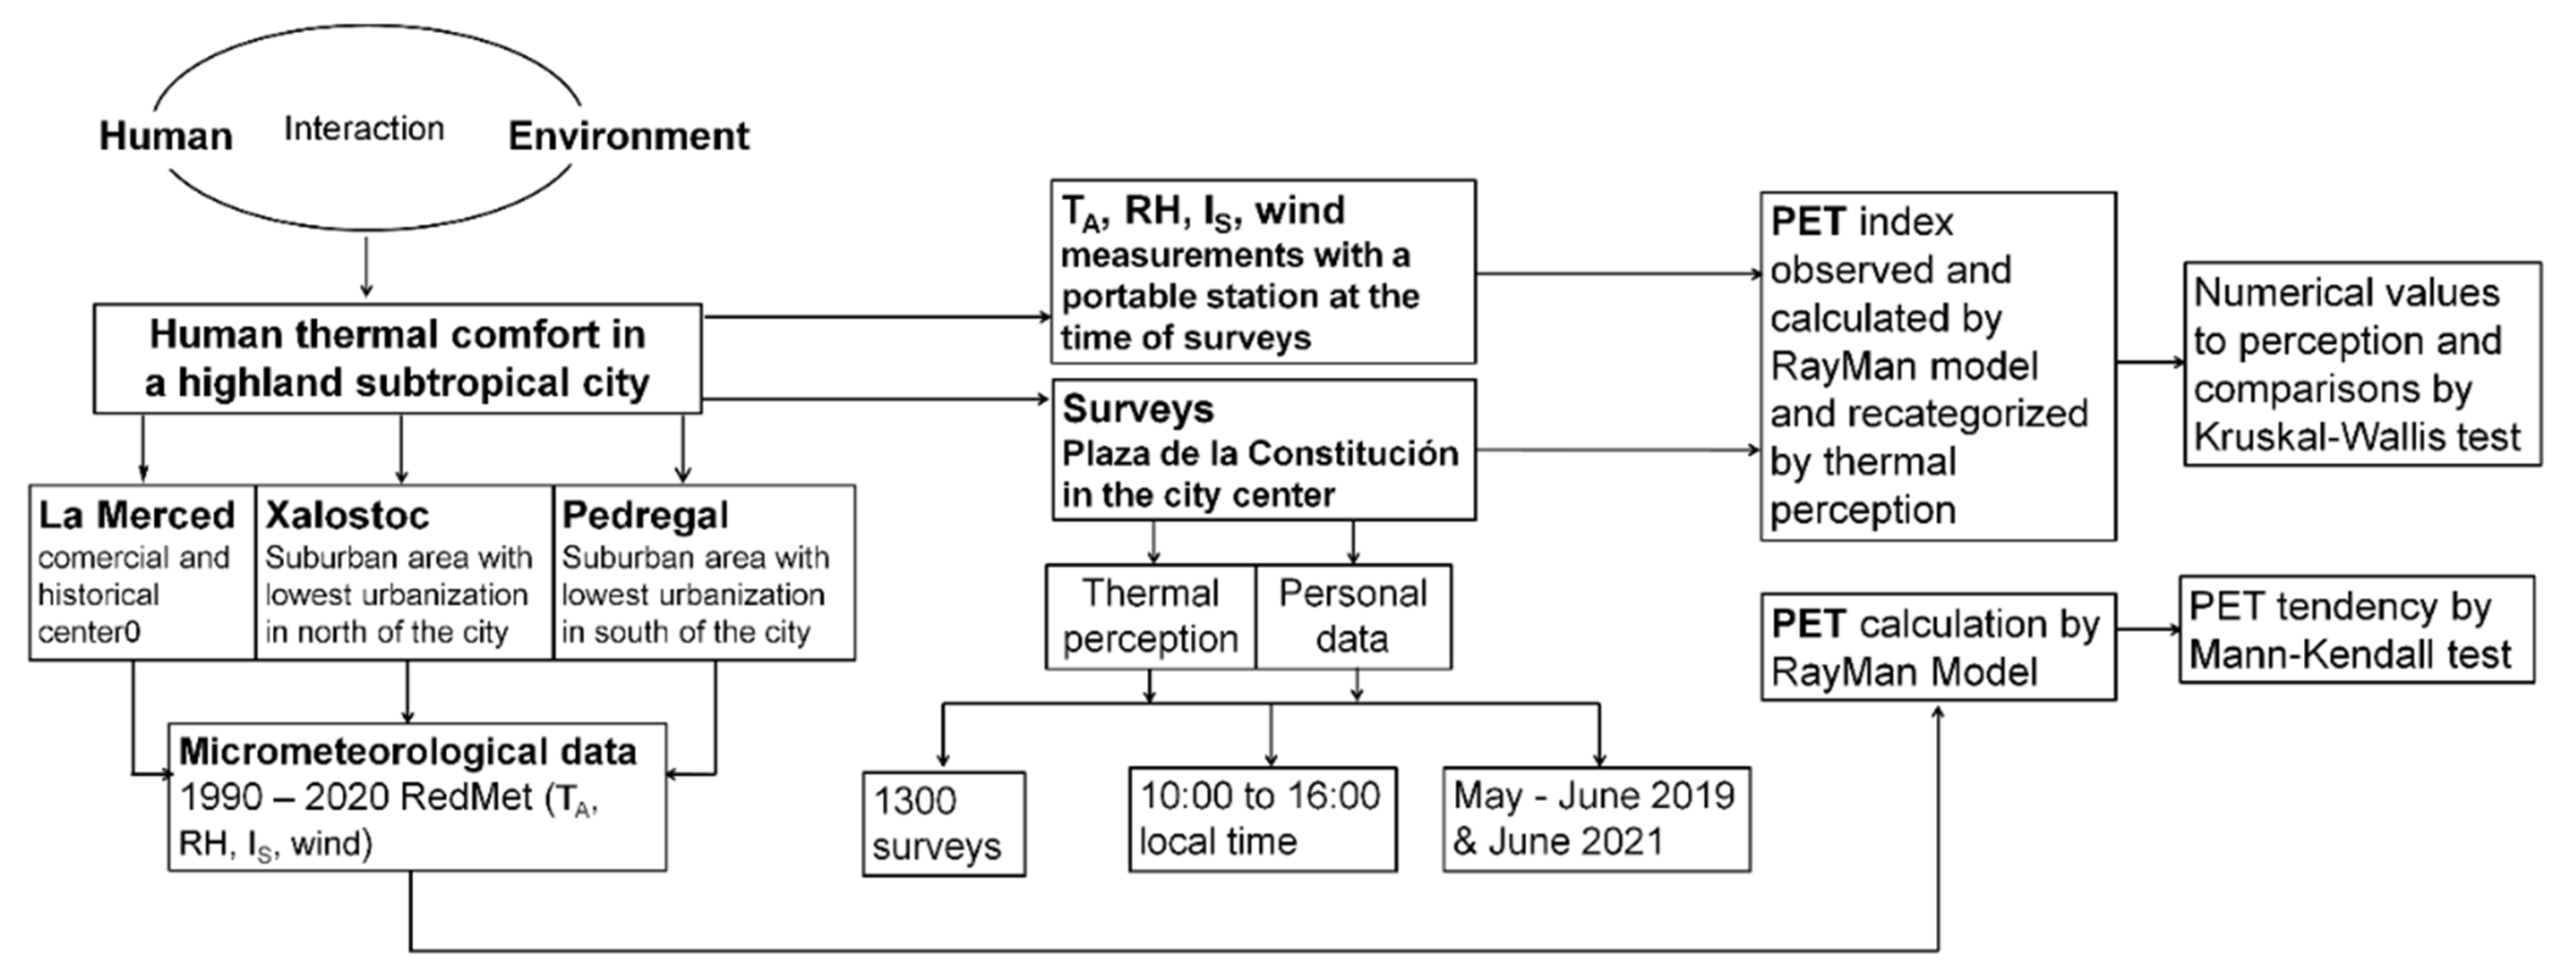
Concomitantly to the surveys, irradiance, air temperature and humidity, and wind speed were measured with a pyranometer (Eppley PSP, Campbell Scientific, Logan, UT, USA), a temperature humidity probe (HMP35C, Campbell Scientific), and a thermal anemometer (03001, RM Young), respectively (Table 1). All sensors were installed in a mobile station at 1.5 m height and connected to a data logger (21 X, Campbell Scientific) that was programmed to store the data every second and generate averages for 1 min and installed in an open space (Figure 2). With this environmental data we calculate PET with the RayMan model according to personal data obtained in the survey, and the categories were assigned (Appendix B).
We analyzed all data available related to average annual irradiance, air temperature and humidity and wind speed from 1990 to 2020 to construct PET trends. The analysis was carried out with public data from MER, XAL and PED from the RedMet of the Secretary of the Environment of Mexico City [30]. Figure 3 shows the study method step by step.
2.3. Statistical Analyses
We analyzed PET data with XLSTAT statistical package to determine whether trends increased or decreased. We performed the Mann–Kendall test [37] to analyze whether physiological equivalent temperature trends were significant. The purpose of the Mann–Kendall test is to statistically assess whether there is a monotonic upward or downward trend in the variable of interest over time [38,39]. Additionally, it discerns whether there were differences between calculated and observed PET physiology; numerical values were given to the thermal sensation categories (Appendix A) and were compared using a Kruskal-Wallis test. Statistical significance was considered at 95% for all cases.
3. Results and Discussion
3.1. Bioclimatic Index Tendency
Figure 4 shows the trend of PET index from 1990 to 2020 in the three studied weather stations: XAL, MER, and PED. In these Please change to graph it is noticed that there are positive tendencies in the three stations (p < 0.05, R2 = 0.6967, 0.5600 and 0.3973, respectively). Although in Pedregal the PET increment is high (0.1368 °C/year) and that of La Merced is about 0.1208 °C/year, in Xalostoc the tendency registered was the highest (0.1498 °C/year), probably indicating that in Pedregal, the PET increment could be low compared with Xalostoc where the PET increment is remarkable. While in La Merced apparently the PET increasing is lower.
The increase of the physiological equivalent temperature in Mexico City is evident. The three chosen stations registered this increment; and although in La Merced the increase in PET is small, this index will probably continue increasing at La Merced, because of the effect of global climate change and other variables that affect PET, such as air humidity and wind speed, for example. On the other hand, the sites XAL and PED because they are in the perimeter of the city probably undergo a change greater than that of La Merced. However, these changes are not only influenced by urbanization but also by global climate change, since it is expected that minimum temperatures increase more than maximum temperatures [40]. According to the tendencies of each of the studied stations, there would be an increase in PET up to 25.2, 24.4 and 25.7 °C annual average, for XAL, MER and PED, respectively, with its direct effect in the hot dry season when air temperatures could be reach up to 30.4 °C [41] toward 2050. It means that PET could reach up to 40 °C situated in the strong heat stress (very hot category) considerably affecting PET daily.
3.2. Daily Physiological Equivalent Temperature
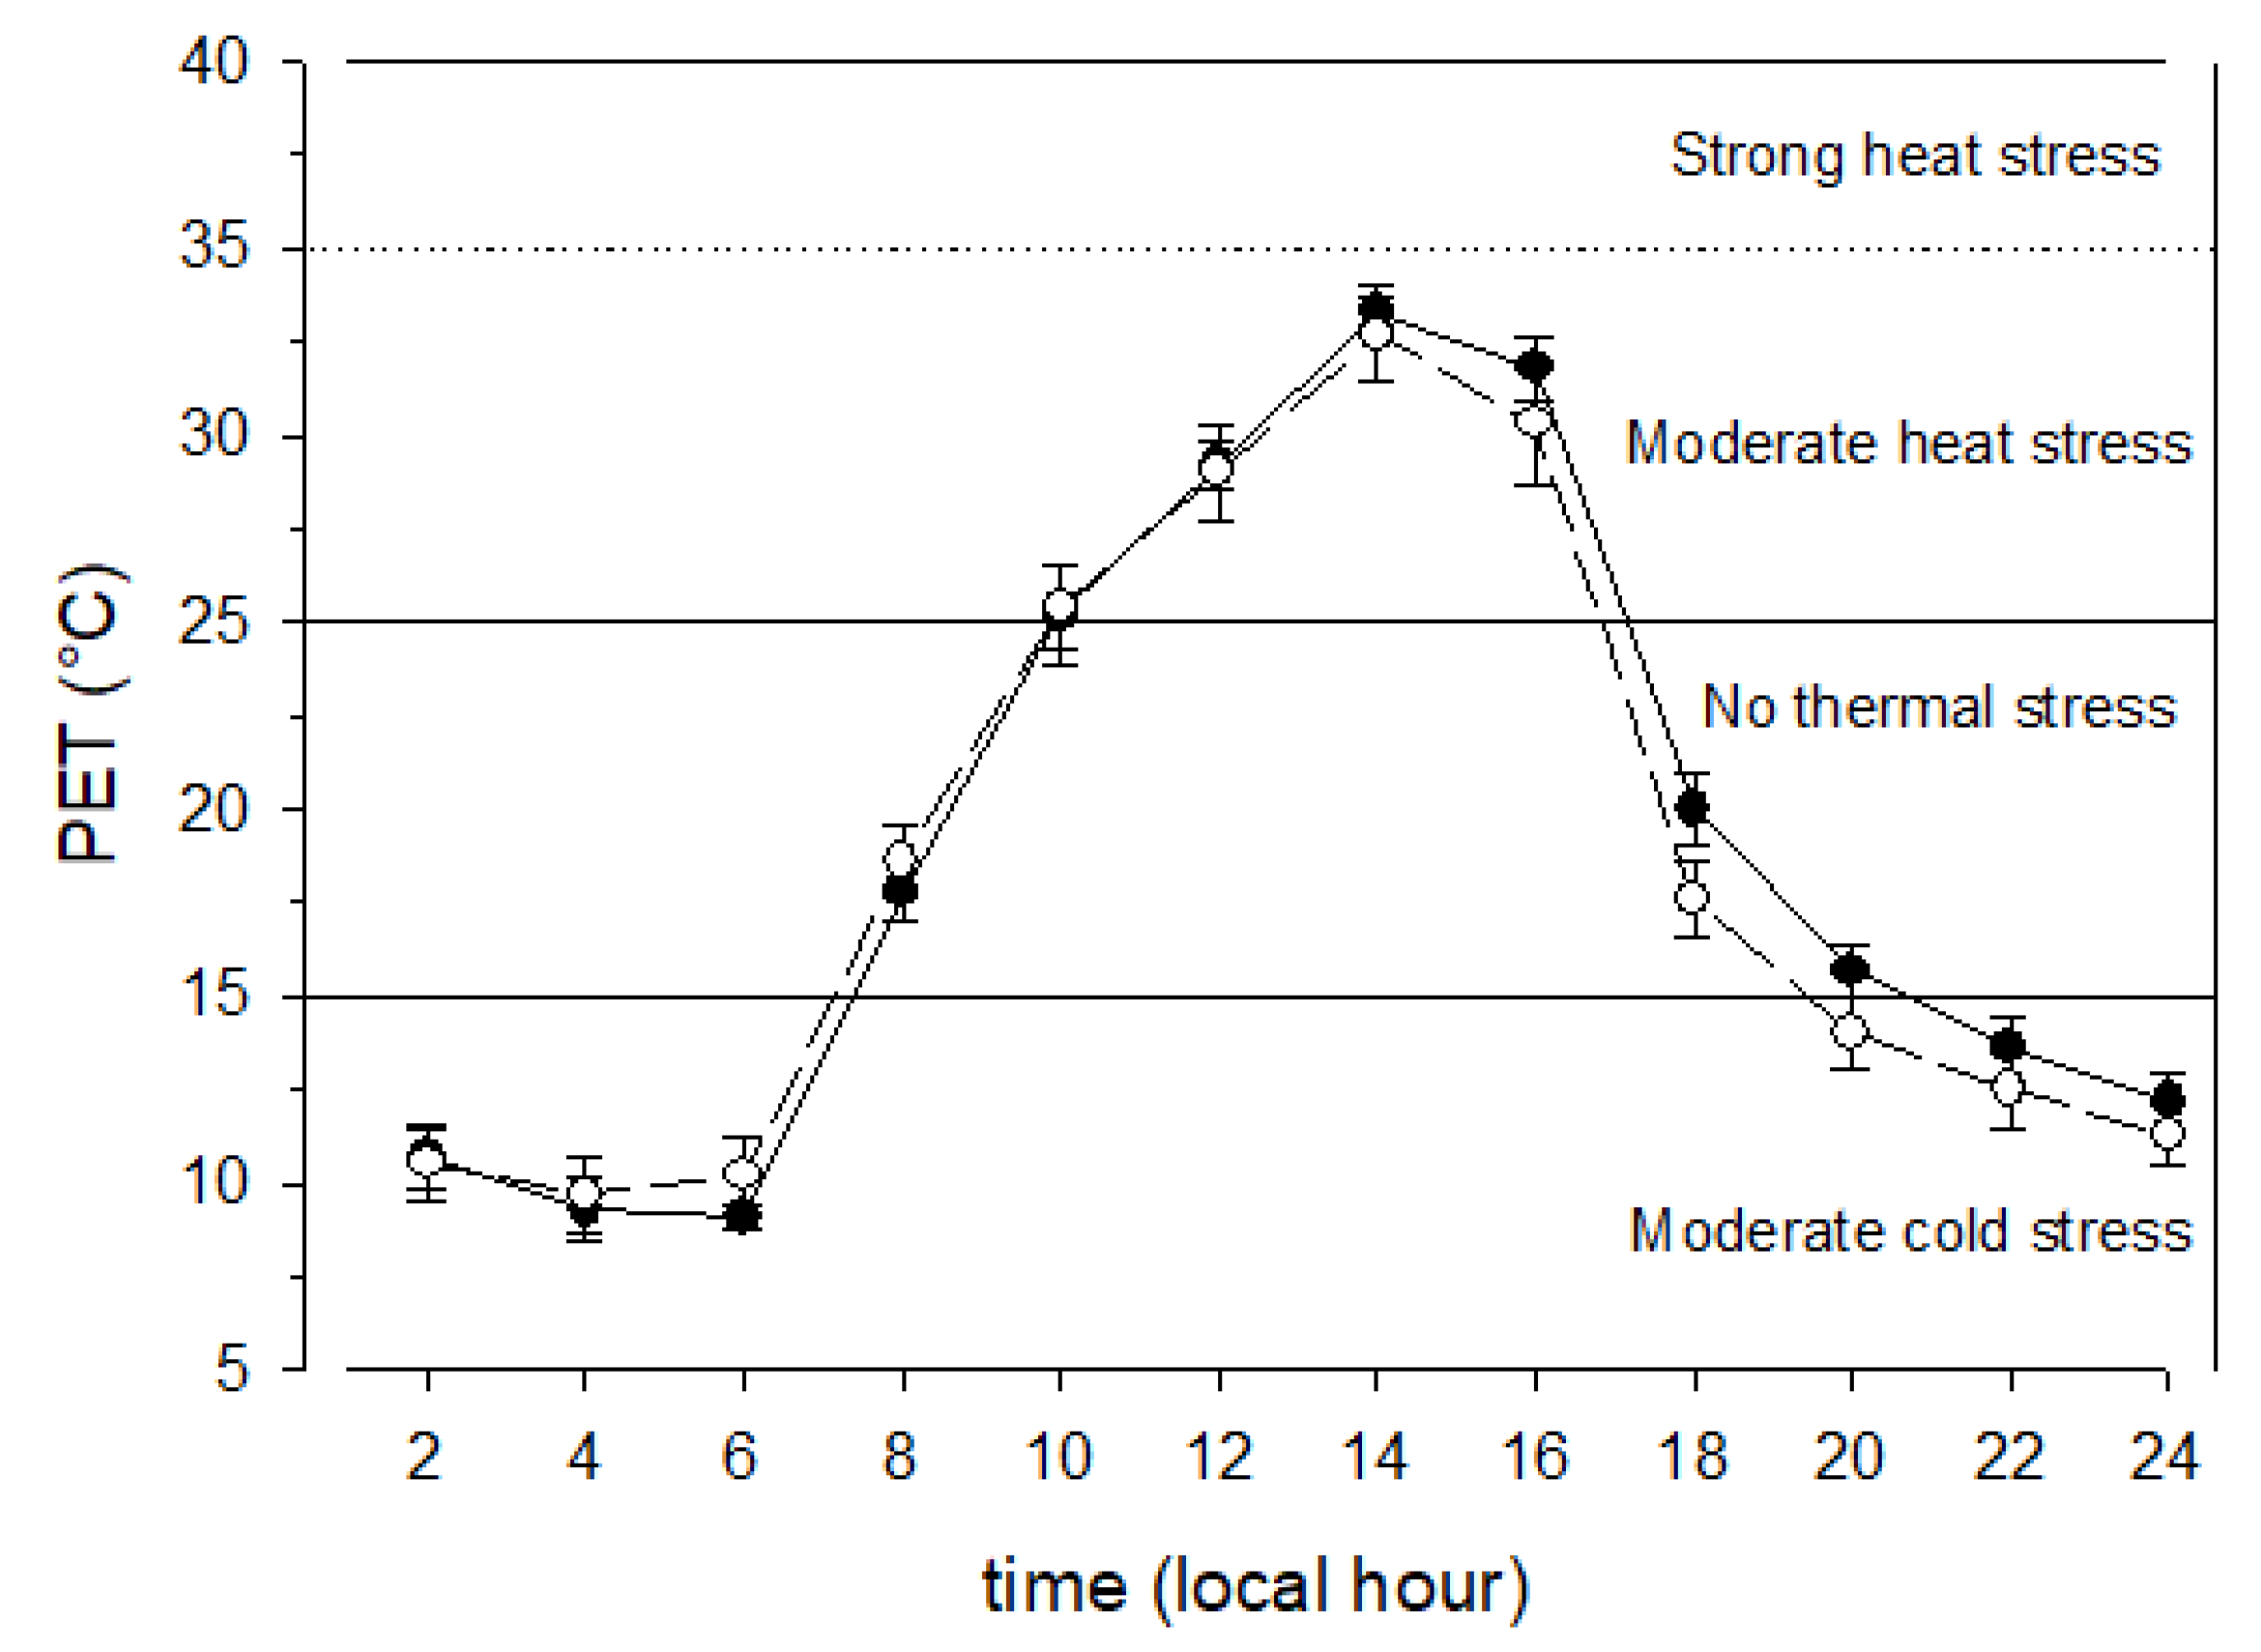
Figure 5 shows the results of the average physiological equivalent temperature (PET) in La Merced throughout the day in the months of May and June (dry hot season) in 2020. PET in the dry warm season was distributed in the three major categories: cold, comfortable, and warm. The lowest PET was 10 °C which refers to a perception of fresh (moderate cold stress) for approximately 5.5 h from 02:00 local hour (lh) until about 07:30 lh, and from 20:30 lh to midnight (≈4.5 h). From 17:00 to 20:00 lh, PET was set in the comfortable category (without thermal stress), so that from 10:00 to 16:30 lh thermal sensation up to a maximum of 33 °C (perception of warm and moderate heat stress), being approximately 3.5 h, while in May PET occurrence is similar to that of April. There were no significant PET differences between April and May. It is interesting to note that mainly in May and June the perceptions of thermal stress reach two antagonistic categories, between moderate cold stress from 05:00 to 07:30 lh, and moderate heat stress from 09:30 to 17:00 lh.
This increase in temperature will also affect the daily development of PET; however, this behavior could be less extreme than it is today, ranging from moderate stress due to cold to moderate heat stress. Currently, in the early morning, Mexico City’s inhabitants take coats to carry out their daily activities, but toward noon people do not know where to put the coat.
Additionally, it is expected that heatwaves will also increase, Jauregui [42] found that in a very long period from 1877 to 2000 heatwaves incremented by 750% registering two hot spells in the decade 1877–1887, to 17 heat waves in the 1991–2000 decade in Mexico City. April and May are the months with the highest number of hot spells, resulting from moderate to severe heat stress based on PET, regardless of the hot and dry season.
Furthermore, apparently PET is overestimating thermal perceptions of the Mexico City’s inhabitants for one class or category at least. However, it is possible to adjust the thermal perceptions or the grade of physiological stress in order to generate better predictions or scenarios to better understand the degree of discomfort experienced by the inhabitants of this city as will be seen in the next section.
3.3. Calculated and Observed Thermal Perception
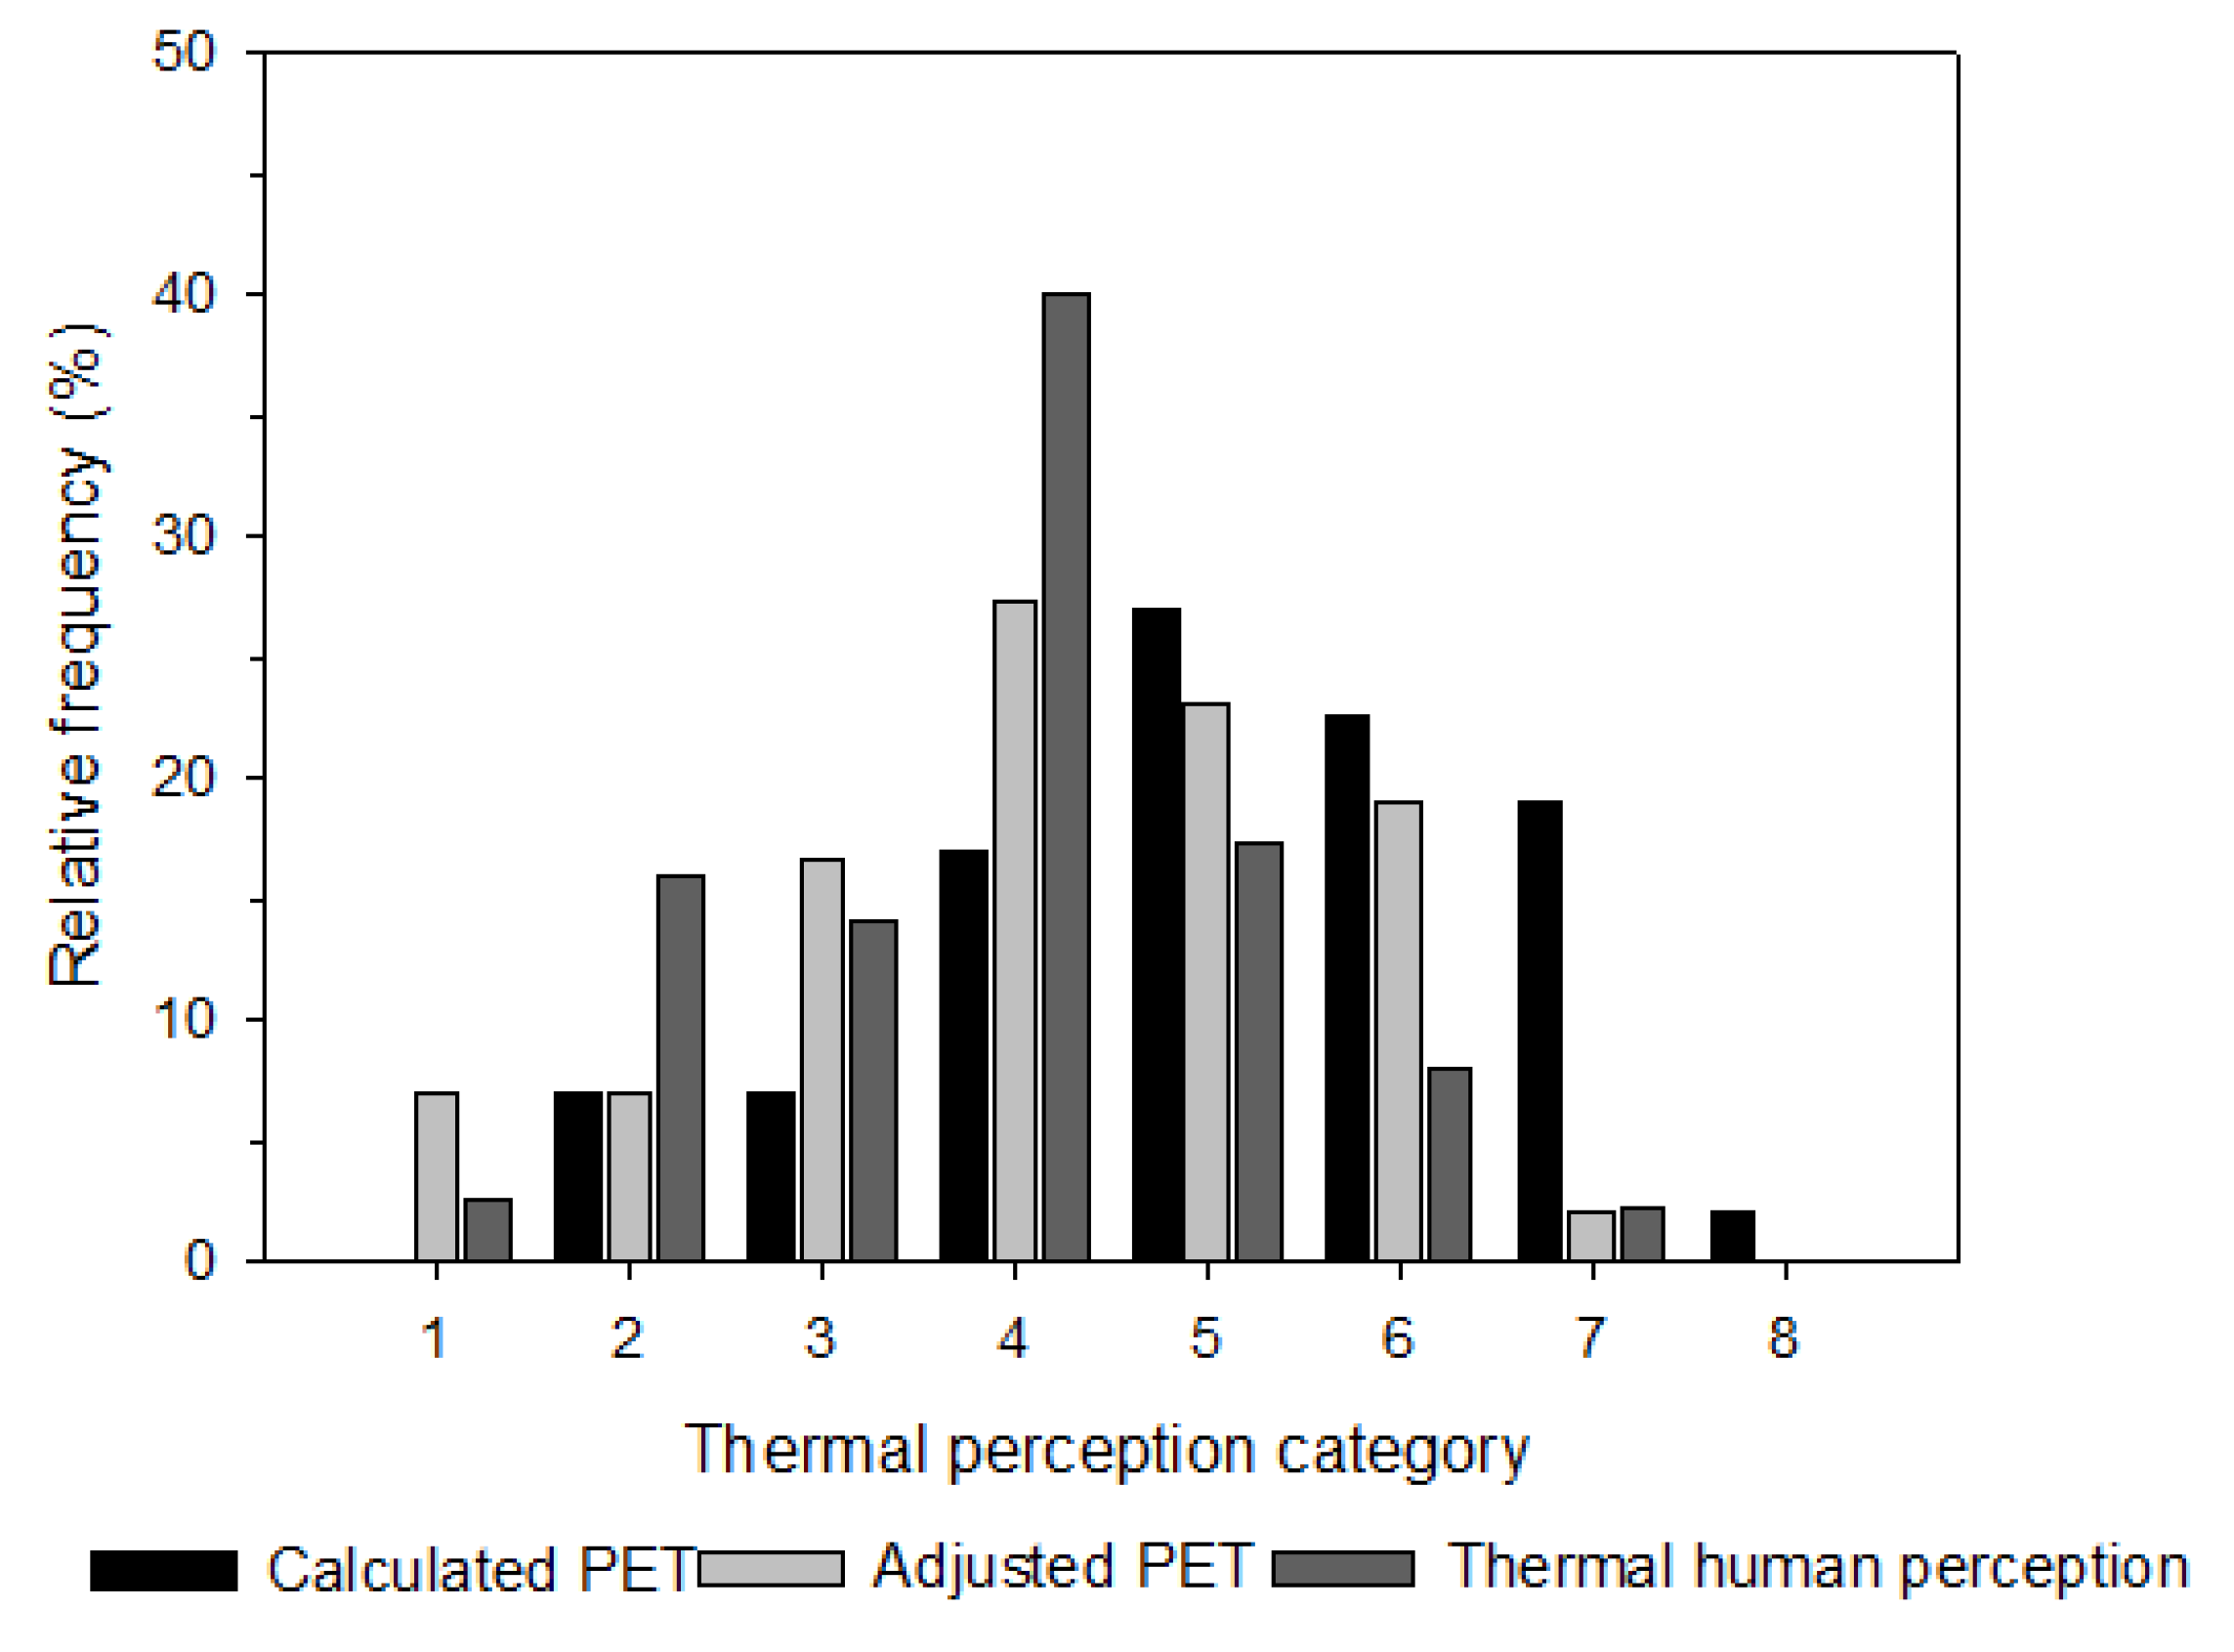
Figure 6 shows the relative frequency of observed thermal perception (OTP) which was derived from surveys of people, compared to the thermal perception calculated or predicted (TPC) by the RayMan model fed with the microclimatic data collected at the Plaza de la Constitución site. Predicted or calculated thermal perception is distributed from class 1 (cold) to 7 (hot), predicting the highest percentage in the slightly warm category (48%) and a very high percentage below this class (41%) with a 12% on comfortable class, and just only 11% above this category 5.
It is evident that the surveys reflect the state of thermal perception of people with a better precision than the actual categorization or classification (Appendix A). This discrepancy may be due to the acclimatization of people that depends mainly on the average temperature of the site; for example by moving the class of the thermal perception/degree of physiological stress only one class, it means that the class of ‘slightly warm’ for the actual categorization, is the comfortable class for people. Therefore, increasing temperatures can negatively affect human thermal comfort, which can lead to health issues and affect human productivity, mainly in the spring/summer seasons [43,44].
To counteract the effect of high urban temperatures, air conditioning systems have been installed; however, this practice increase energy consumption. The total sale of electricity in Mexico City in 1996 was 121.579 GWh of which 28.4 GWh (23.4%) was consumed by the domestic sector, 5.69 GWh was required to cool the spaces inside the buildings (air conditioners, evaporative cooling, and fans), and 8.52 GWh in the shopping centers and services of the metropolitan area [45]. Furthermore, air conditioning systems efficiency is very low and acting “putting” the heat from the indoors to outdoors maybe exacerbating the heat island and increasing the greenhouse gases. Two strategies emerge from this study, one on the mitigation and adaptation to the urban heat island and global climate change.
In terms of mitigation and adaptation to global climate change and to the urban heat island, there are many strategies, such as reducing greenhouse gases emissions and reforesting the urban area, implicitly vegetation becomes a carbon sink, but also locally reduces the temperature by transpiration. Ballinas and Barradas [4] found that to reduce the air temperature by 1 °C in Mexico City´s area, 63 large Eucalyptus camaldulensis would be required per hectare, whereas to reduce the air temperature by 2 °C only 24 large Liquidambar styraciflua trees would be required. This means that an adequate strategy to cope with UHI and climate change would be to increase evaporative surfaces in the urban area. However, evaporative surfaces are not the only solution to mitigate UHI and climate change, but other alternatives could also be the restructuring or establishment of an urban fabric by alternating different architectural elements and/or using new materials.
Physiological equivalent temperature is an adequate index as long as there is an adjustment to adaptation in mean temperature of each city. In Mexico City, the average temperature is 15 °C, in Belo Horizonte and Germany it is 20.8 °C and 10.3 °C, respectively. Thus, thermal perception in neutral comfort is higher in Belo Horizonte (16 to 30 °C PET) and lower in two German cities (18 to 28 °C PET), with thermal perception ranging from 18 to 22 °C in Mexico City; as we see, the range of cities includes light warm and warm perception [27]. The results show that neutral range in Brazil is from 16 °C to 30 °C PET and that hot range starts at 32 °C PET. In Germany, neutral range is from 18 °C to 28 °C PET and hot range starts at 35 °C PET. The very hot category starts in lower values of the PET index in Brazil (36 °C) than in Germany (38 °C). To our knowledge, this research [27] is the only one that has addressed the problem of human acclimatization whose results show an overlap in the neutral comfort category, with the highest rank in Brazil, followed by Germany and the lowest in Mexico. This also speaks of a possible adjustment of the categories in Brazil. It is evident that this research is pioneering in the field, since until now the universality of a universal index had not been questioned. However, it is possible that in future studies, in this regard it would be advisable to include some other factors such as population density and traffic.
Decision makers need the best available scientific information to set policies and allocate resources. This decision to focus on the scientific challenge of heat island mitigation should be respond directly to the needs of the region to benefit.
4. Conclusions
It is evident that the physiological equivalent temperature is a good index to determine human thermal comfort in Mexico City, in addition to being an index that is easy to use if the RayMan program is used. However, it is necessary to adjust the categories or classes given, since the initial categorization seems to overestimate the degree of comfort/discomfort of the inhabitants of Mexico City.
This discrepancy is probably due to the acclimatization of people to an average temperature given by the place of residence. This probably because the initial PET categorization was carried out in a specific site with specific characteristics that do not necessarily match other sites in the world. Therefore, it is advisable to verify whether or not there is a discrepancy in the PET categorization.
On the other hand, the comfort index in Mexico City is gradually increasing over the years, an increase that is mainly due to the interaction of the heat island phenomenon and global climate change. Therefore, it is necessary to mitigate the effects of the urban heat island and climate change and/or generate adaptation strategies to this increase in PET. This increase must be taken into account for future practices and strategies that lead us to a more sustainable city.
Author Contributions
All authors listed have made a substantial, direct and intellectual contribution to the work, and approved it for publication. All authors have read and agreed to the published version of the manuscript.
Funding
This research was funded by Support Program for Research Projects and Technological Innovation (PAPIIT, DGAPA) of the Universidad Nacional Autónoma de México (UNAM) by grant IT200620. The first author (MB) thanks to Dirección General de Asuntos del Personal Académico (DGAPA), UNAM for the postdoctoral scholarship.
Institutional Review Board Statement
Not applicable.
Informed Consent Statement
Written informed consent has been obtained from the patient(s) to publish this paper.
Data Availability Statement
Not applicable.
Acknowledgments
We thank Andreas Matzarakis for his comments and suggestions on the manuscript, and the students of the 2017-2 Bioclimatology course who made the surveys possible. We also would thank Laboratorio de Entornos Sostenibles (LES) and Centro de Investigaciones en Arquitectura, Urbanismo y Paisaje (CIAUP) from Facultad de Arquitectura, UNAM for support this work.
Conflicts of Interest
The authors declare no conflict of interest.
Appendix A
Fragment of the survey referring only to the degree of thermal comfort.
How do you feel right now according to the weather?
Cold/Cool ( )
Warm/Pleasant ( )
Warm ( )
Very warm ( )
Dry ( )
Dry/humid ( )
Humid ( )
What do you think is the most uncomfortable parameter at the moment?
Temperature ( )
Humidity ( )
Solar radiation ( )
Wind ( )
None ( )
How do you feel about the weather in general?
Very uncomfortable ( )
Not comfortable ( )
Comfortable ( )
Very comfortable ( )
Appendix B
The RayMan Model
The Rayman model is based on the German standard VDI 3789 Part II [24,46] and VDI-3787 Part I [24,47]. With the Rayman model, the average radiant temperature, the bioclimatic indexes and micrometeorological data can be calculated in all the environments, so this model has application in climatology, urban climatology, and human bioclimatology (ibid). This model transforms the radiation fluxes at medium radiant temperature (TMRT) forming the PET, SET*, and PMV indices, as well as the energy flows and MEMI body parameters are part of the Rayman model and require the determination of TMRT) [25]. The different points of entry of radiation fluxes can be modified by obstacles, whether natural or artificial; for this reason the environmental morphological properties are important, for which the calculation of the mean radiant temperature is also required [25]. The SVF aerial view factor index (Sky View Factor) is a way to calculate radiation through hemispheric photography. Therefore, for any type of urban structure, through the Rayman model, it is possible to calculate the average of each hour, each day and each month, the duration of the shadow, the long and short waves of the radiation flux with or without the topography data and obstacles in urban structures [25]. In addition, studies have been conducted that have proven the efficiency of the Rayman 2.0 model in hot and humid environments as well as in simple and complex environments [25]. Table A1 shows the different degrees of thermal perception and physiological stress according to PET comfort intervals.

Table A1.
Intervals of the equivalent physiological temperature (PET, °C). Values hold only for an internal heat production of 80 W and a heat transfer of clothing of 0.9 clo [19].
Table A1.
Intervals of the equivalent physiological temperature (PET, °C). Values hold only for an internal heat production of 80 W and a heat transfer of clothing of 0.9 clo [19].
| Class | PET | Thermal Perception | Grade of Physiological Stress |
|---|---|---|---|
| 0 | <4.1 | Very cold | Extreme cold stress |
| 1 | 4.1–8.0 | Cold | Strong cold stress |
| 2 | 8.1–13.0 | Cool | Moderate cold stress |
| 3 | 13.1–18.0 | Slightly cool | Slight cold stress |
| 4 | 18.1–23.0 | Comfortable | No thermal stress |
| 5 | 23.1–29.0 | Slightly warm | Slight heat stress |
| 6 | 29.1–35.0 | Warm | Moderate heat stress |
| 7 | 35.1–41.0 | Hot | Strong heat stress |
| 8 | >41.0 | Very hot | Extreme heat stress |
References
- Lee, D.O. Urban-rural humidity differences in London. Int. J. Clim. 1991, 11, 577–582. [Google Scholar] [CrossRef]
- Oke, T.R. The heat island of the urban boundary layer: Characteristics, causes and effects. In Wind Climate in Cities; Cermack, J.E., Ed.; Kluwer Academic: Boston, MA, USA, 1995; pp. 81–107. [Google Scholar]
- Unger, J. Urban-rural air humidity differences in Szeged, Hungary. Int. J. Clim. 1999, 19, 1509–1515. [Google Scholar] [CrossRef]
- Ballinas, M.; Barradas, V.L. The urban tree as a tool to mitigate the urban heat island in Mexico City: A simple phenomenological model. J. Environ. Qual. 2016, 45, 157–166. [Google Scholar] [CrossRef] [PubMed]
- Ballinas, M. Mitigación de la isla de calor urbana: Estudio de caso de la Zona Metropolitana de la Ciudad de México. Master’s Thesis, Centro de Ciencias de la Atmosfera-Instituto de Ecología, UNAM, Mexico City, Mexico, October 2011. [Google Scholar]
- Gudrun, L.; Gerd, L. Effects of the thermal environment on human health: An investigation of 30 years of daily mortality data from SW Germany. Clim. Res. 2002, 21, 91–103. [Google Scholar]
- Li, Y.; Cheng, Y.; Cui, G.; Peng, C.; Xu, Y.; Wang, Y.; Liu, Y.; Liu, J.; Li, C.; Wu, Z.; et al. Association between high temperature and mortality in metropolitan areas of four cities in various climatic zones in China: A time-series study. Environ. Health 2014, 13, 65. [Google Scholar] [CrossRef] [Green Version]
- Agüero, J.M. Long-Term Effect of Climate Change on Health: Evidence from Heat Waves in Mexico; IDB Working Paper Series No. IDB-WP-481; Inter-American Development Bank: Washington, DC, USA, 2014; p. 29. [Google Scholar]
- Zivin, J.G.; Shrader, J. Temperature Extremes, Health, and Human Capital. Future Child. 2016, 26, 31–50. [Google Scholar] [CrossRef]
- Aguilar, A.J.; de la Hoz-Torres, M.L.; Martínez-Aires, M.D.; Ruiz, D.P. Thermal perception in naturally ventilated university buildings in Spain during the cold season. Buildings 2022, 12, 890. [Google Scholar] [CrossRef]
- Hien, W.N.; Chen, Y. Tropical Urban Heat Islands: Climate, Buildings and Greenery, 1st ed.; Taylor & Francis Editor: Oxfordshire, UK, 2009; Volume 259, pp. 58–68. [Google Scholar]
- Daanen, H.A.; Jonkhoff, W.; Bosch, P.; ten Broeke, H. The effect of global warming and urban heat islands on mortality, morbidity and productivity in The Netherlands. In Proceedings of the International Conference of Environmental Ergononomics, Queenstown, New Zealand, 11–15 February 2013; Cotter, J.D., Lucas, S.J.E., Mundel, T., Eds.; International Society for Environmental Ergonomics: Queenstown, New Zealand, 2013. [Google Scholar]
- Costa, H.; Floater, G.; Hooyberghs, H.; Verbeke, S.; de Ridder, K. Climate change, heat stress and labour productivity: A cost methodology for city economies. Cent. Clim. Change Econ. Policy 2016, 278, 1–15. [Google Scholar]
- Mohaher, H.R.H.; Ding, L.; Santamouris, M. Developing heat mitigation in the urban environment of Sydney, Australia. Buildings 2022, 12, 903. [Google Scholar]
- Brazel, A.J.; Quattrochi, D.A. Urban climatology. In Encyclopedia of World Climatology; Oliver, J.E., Ed.; Springer: Dordrecht, The Netherlands, 2005; pp. 766–779. [Google Scholar]
- Luber, G.; McGeehein, M. Climate change and extreme heat events. Am. J. Prev. Med. 2008, 35, 429–435. [Google Scholar] [CrossRef] [PubMed]
- Basara, J.B.; Basara, H.G.; Illston, B.G. The impact of the urban heat island during the intense heat wave in Oklahoma City. Adv. Meteorol. 2010, 2010, 230365. [Google Scholar] [CrossRef] [Green Version]
- Founda, D.; Santamouris, M. Synergies between Urban Heat Island and Heat Waves in Athens (Greece) during an extremely hot summer. Sci. Rep. 2017, 7, 10973. [Google Scholar] [CrossRef] [PubMed] [Green Version]
- Heaviside, C.; Macintyre, H.; Vardoulakis, S. The Urban Heat Island: Implications for Health in a Changing Environment. Curr. Environ. Health Rep. 2017, 4, 296–305. [Google Scholar] [CrossRef]
- Hayes, A.T.; Jandaqhian, Z.; Lacasse, M.A.; Gaur, A.; Laouadi, A.; Ge, H.; Wang, L. Nature-based solutions (NBSs) to mitigate urban heat island (UHI) effects in Canadian citys. Buildings 2022, 12, 925. [Google Scholar] [CrossRef]
- Sharma, A.; Andhikaputra, G.; Wang, Y.C. Heatwaves in South Asia: Characterization, consequences on human health, and adaptation strategies. Atmosphere 2022, 13, 734. [Google Scholar] [CrossRef]
- Perini, K.; Magliocco, A. Effects of vegetation, urban density, building height, and atmospheric conditions on local temperatures and thermal comfort. Urban For. Urban Green. 2014, 13, 495–506. [Google Scholar] [CrossRef]
- Morgan, D.L.; Basket, R.L. Comfort of man in the city. An energy Balance model man-environment coupling. Int. J. Biometeorol. 1974, 18, 184–198. [Google Scholar] [CrossRef] [PubMed]
- Matzarakis, A.; Mayer, H.; Iziomon, M. Applications of a universal thermal index: Physiological equivalent temperature. Int. J. Biometeorol. 1999, 43, 76–84. [Google Scholar] [CrossRef]
- Matzarakis, A.; Rutz, F.; Mayer, H. Modelling radiation fluxes in simple and complex environments-Application of the RayMan model. Int J Biometeorol. 2007, 51, 323–334. [Google Scholar] [CrossRef]
- Anjos, M.; Lopes, A.; Lucena, A.J.d.; Mendonça, F. Sea breeze front and outdoor thermal comfort during Summer in Northeastern Brazil. Atmosphere 2020, 11, 1013. [Google Scholar] [CrossRef]
- Queiroz da Silveira, S.; Katzschner, A.; Gomes, D.; Sad de Assis, E.; Katzschner, L. Thermal comfort comparison and evaluation in different climates. Urban Clim. 2018, 23, 219–230. [Google Scholar]
- Servicio Meteorológico Nacional (SMN). Normales Climatológicas por Estado. Available online: https://smn.conagua.gob.mx/es/ (accessed on 23 April 2021).
- Jauregui, E. Heat Island Development in Mexico City. Atmos. Environ. 1997, 31, 3821–3831. [Google Scholar] [CrossRef]
- Gobierno de la Ciudad de México. Red Meteorológica y Radiación Solar (RedMet). Available online: http://www.aire.cdmx.gob.mx/default.php?opc=%27aKBi%27 (accessed on 15 March 2021).
- Höppe, P. The physiological equivalent temperature-A universal index for the biometeorological assessment of the thermal environment. Int. J. Biometeorol. 1999, 43, 71–75. [Google Scholar] [CrossRef] [PubMed]
- Matzarakis, A.; Rutz, F.; Mayer, H. Modelling radiation fluxes in simple and complex environments-Basics of the RayMan model. Int. J. Biometeorol. 2010, 54, 131–139. [Google Scholar] [CrossRef] [PubMed] [Green Version]
- Auliciems, A.; Szokolay, S.V. Thermal Comfort; Plea Note 3 Passive and Low Energy Architecture International, 2nd ed.; University of Queensland: Brisbane, Australia, 1996; p. 66. [Google Scholar]
- Lai, D.; Guo, D.; Hou, Y.; Lin, C.; Chen, Q. Studies of outdoor thermal comfort in Northern China. Build. Environ. 2014, 77, 110–118. [Google Scholar] [CrossRef]
- ISO 7730, Determinación Analítica e Interpretación del Confort Térmico Mediante el Cálculo de los índices PMV y PPD y los Criterios del Confort Térmico Local. Available online: https://www.une.org/encuentra-tu-norma/busca-tu-norma/norma?c=N0037517 (accessed on 20 January 2021).
- Yuk, Y.Y.; Oliver, J.E. The CLO: A utilitarian unit to measure weather/climate comfort. Int. J. Clim. 1996, 16, 1045–1056. [Google Scholar]
- Nasrallah, H.A.; Brazel, A.J.; Balling, R.C. Analysis of the Kuwait City urban heat island. Int. J. Clim. 1990, 10, 401–405. [Google Scholar] [CrossRef]
- Mann, H.B. Non-parametric tests against trend. Econometrica. 1945, 13, 245–259. [Google Scholar] [CrossRef]
- Kendall, M.G. Rank Correlation Methods; University of Queensland, Department of Architecture, International PLEA Organisation: London, UK, 1975. [Google Scholar]
- IPCC. Climate Change: Impacts, Adaptation and Vulnerability, 1st ed.; WMO/UNEP: Cambridge, UK, 2001; pp. 1–1042. [Google Scholar]
- UNIATMOS. Atlas Climático: Actualización de los Escenarios de Cambio Climático para Estudios de Impactos, Vulnerabilidad y Adaptación. UNAM; UNIATMOS e INECC Mexico. Available online: http://atlasclimatico.unam.mx/AECC/servmapas (accessed on 4 March 2019).
- Jauregui, E. The heat spells of Mexico City. Investig. Geog. 2009, 70, 71–76. [Google Scholar]
- Seppanen, O.; Fisk, W.J.; Faulkner, D. Control of Temperature for Health and Productivity in Offices. LBNL-55448. Available online: http://escholarship.org/uc/item/39s1m92c (accessed on 15 March 2019).
- Tse, W.L.; So, A.T.P. The importance of human productivity to air-conditioning control in office environments. HVAC&R Res. 2007, 13, 3–21. [Google Scholar]
- Ramos, G.; Heard, C.; Viveros, A.S. Simulación de escenarios de ahorro y uso eficiente de energía con medidas de control pasivo. Rev. FIDE 1998, 7, 17–29. [Google Scholar]
- VDI-Guidelines 3789; Part II: Environmental Meteorology, Interactions between Atmosphere and Surfaces; Calculation of the Short- and Long Wave Radiation. The Association of German Engineers (VDI): Düsseldorf, Germany, 1994.
- VDI-Guidelines 3787; Environmental Meteorology, Methods for the Human-Biometeorological Evaluation of Climate an Air Quality for the Urban and Regional Planning at Regional Level. Part I: Climate. The Association of German Engineers (VDI): Düsseldorf, Germany, 2008.
Figure 1.
Location of the Metropolitan Zone of the Valley of Mexico and distribution of the air temperature (°C) in May 2016 at 14:00 h local time. Mexico City is bounded by the black line. The stations of Xalostoc (XAL), La Merced (MER) and Pedregal (PED) are also shown.
Figure 1.
Location of the Metropolitan Zone of the Valley of Mexico and distribution of the air temperature (°C) in May 2016 at 14:00 h local time. Mexico City is bounded by the black line. The stations of Xalostoc (XAL), La Merced (MER) and Pedregal (PED) are also shown.

Figure 2.
(A) Locations where surveys and atmospheric variables measurements were carried out to calculate the physiological equivalent temperature. The surveys were performed in the areas marked with rectangles and the mobile micrometeorological stations were installed at the points indicated with a closed circle. The surrounding buildings have six (building 1), five (building 2), four (building 3) and three (building 4) stories. Modified from Google Earth. (B) Sensors arrangement. (C) Showing the sensors: air temperature and humidity probe (1), thermal anemometer (2) and pyranometer (3).

Figure 3.
Study method step by step. TA, RH, IS, are mean air temperature, relative humidity, and irradiance, respectively, and wind for wind speed. Physiological equivalent temperature was calculated using the RayMan model [25].
Figure 3.
Study method step by step. TA, RH, IS, are mean air temperature, relative humidity, and irradiance, respectively, and wind for wind speed. Physiological equivalent temperature was calculated using the RayMan model [25].

Figure 4.
Trend of the physiological equivalent temperature (PET) in annual average from 1990 to 2020 in the three studied meteorological stations.
Figure 4.
Trend of the physiological equivalent temperature (PET) in annual average from 1990 to 2020 in the three studied meteorological stations.

Figure 5.
Daily development of the physiological equivalent temperature (PET) during the month of May (open symbols) and June (closed symbols) of 2019 and 2020. The symbols are the averaged PET, and the bars represent the standard error. The different classes of human perception are shown.
Figure 5.
Daily development of the physiological equivalent temperature (PET) during the month of May (open symbols) and June (closed symbols) of 2019 and 2020. The symbols are the averaged PET, and the bars represent the standard error. The different classes of human perception are shown.

Figure 6.
Relative frequency of the thermal perception of Mexico City’s inhabitants, as a result of surveys at the Plaza de la Constitución, and the calculated physiological equivalent temperature (PET) using the RayMan model.
Figure 6.
Relative frequency of the thermal perception of Mexico City’s inhabitants, as a result of surveys at the Plaza de la Constitución, and the calculated physiological equivalent temperature (PET) using the RayMan model.

Table 1.
Technical specifications of the instruments used to determine the physiological equivalent temperature concomitant to the surveys.
Table 1.
Technical specifications of the instruments used to determine the physiological equivalent temperature concomitant to the surveys.
| Sensor | Range | Accuracy | Response Time |
|---|---|---|---|
| Pyranometer * | 0–2000 W/m2 | ±10 W/m2 or 5% | 35 s |
| Anemometer | 0.05–5 m/s | ±0.1 m/s | 20 s |
| Humidity | 0–98% | ±2.5% (25 °C) | 10 s |
| Temperature | –40–100 °C | ±0.4 °C (10–60 °C) | 10 s |
* cosine correction < 5%, spectral response 284–2800 nm.
Publisher’s Note: MDPI stays neutral with regard to jurisdictional claims in published maps and institutional affiliations. |
© 2022 by the authors. Licensee MDPI, Basel, Switzerland. This article is an open access article distributed under the terms and conditions of the Creative Commons Attribution (CC BY) license (https://creativecommons.org/licenses/by/4.0/).
Share and Cite
MDPI and ACS Style
Ballinas, M.; Morales-Santiago, S.I.; Barradas, V.L.; Lira, A.; Oliva-Salinas, G. Is PET an Adequate Index to Determine Human Thermal Comfort in Mexico City? Sustainability 2022, 14, 12539. https://doi.org/10.3390/su141912539
AMA Style
Ballinas M, Morales-Santiago SI, Barradas VL, Lira A, Oliva-Salinas G. Is PET an Adequate Index to Determine Human Thermal Comfort in Mexico City? Sustainability. 2022; 14(19):12539. https://doi.org/10.3390/su141912539
Chicago/Turabian StyleBallinas, Monica, Sara Ivonne Morales-Santiago, Victor L. Barradas, Adriana Lira, and Gerardo Oliva-Salinas. 2022. "Is PET an Adequate Index to Determine Human Thermal Comfort in Mexico City?" Sustainability 14, no. 19: 12539. https://doi.org/10.3390/su141912539
Note that from the first issue of 2016, this journal uses article numbers instead of page numbers. See further details here.