
Urban Fabrics to Eco-Friendly Blue–Green for Urban Wetland Development


1
Instituto de Estudios Urbanos y Territoriales, Centro de Desarrollo Urbano Sustentable CEDEUS, Instituto Milenio SECOS, Pontificia Universidad Católica de Chile, Providencia 7500000, Chile
2
Instituto de Estudios Urbanos y Territoriales, Pontificia Universidad Católica de Chile, Providencia 7500000, Chile
*
Author to whom correspondence should be addressed.
Sustainability 2021, 13(24), 13745; https://doi.org/10.3390/su132413745
Submission received: 13 September 2021
/
Revised: 6 December 2021
/
Accepted: 9 December 2021
/
Published: 13 December 2021
(This article belongs to the Special Issue Sustainable Urban Water Landscapes and Blue-Green Infrastructure)
Abstract
:In an urbanized world, the sustainability of cities will depend on their form and urban structure. In this sense, fabrics that are compact, dense, green, and suitable for non-motorized transport methods are more environmentally efficient. For the purpose of contributing new tools to the design, urban planning, and sustainability of nature in residential areas, this study characterizes the urban fabrics of six urban wetlands in the Latin American city of Concepción (Chile), which is known for its blue–green spaces. In a wetland city, we model urban patterns through spatial relationship using a statistical regression model (OLS—ordinary least squares) with the urban variables of density, distance, population, housing, highways, green areas, and building permits. Concepción shows predominantly low- to medium-density fabrics, and it is not integrated with the urban wetlands. In fact, it was observed that the residential areas do not take advantage of the blue–green spaces and that the urban fabrics do not favor proximity, with a transportation network that promotes the use of cars, leading to the wetlands being inaccessible and fragmented. However, as they are still surrounded by open spaces with abundant vegetation, there are highly feasible opportunities for the future development of blue–green infrastructure.
1. Introduction
As we live on an urbanized planet, we know that the sprawl of cities has damaged aquatic ecosystems such as rivers, wetlands, lakes, and other ecosystems; additionally, the loss of biodiversity that has resulted from urban sprawl has affected cities. Therefore, since it has been demonstrated that human beings require proximity and interaction with nature in order to maintain a healthy lifestyle, this trend reduces our quality of life since natural spaces help reduce conditions that have a negative effect on mental health [1], such as stress [2,3,4]; this is especially important today due to the consequences of the COVID-19 pandemic. The confinement that has been caused by the pandemic has worsened the mental health condition of the population [5,6]. For this reason, access to leisure and recreation spaces is essential for improving the satisfaction and personal well-being of residents [7] around the word, and special attention should be paid to natural spaces. Likewise, the accessibility and integration of open and natural spaces within cities are crucial aspects that should be considered when discussing sustainable urban planning [8].
In modern cities, a number of new urban developments have not integrated nature as an essential ecosystemic element for the environmental quality of residential neighborhoods. While urban development has historically attempted to create healthier cities, such as through the theoretical garden city that was developed by Ebenezer Howard in 1898 [9], which favored greener and more natural designs, which, despite its contributions to urban planning, has ended up as a very utopian concept for developing cities because of staggering urban growth and environmentally negative external factors. In fact, the application of greener and more natural designs to a real city with a similar residential fabric and transport structures to that of Howard’s proposed garden city also implies that these cities are more accessible, with residents being able to walk to open, green spaces, as opposed to in traditional cities, where one may experience longer travel times [10]. Therefore, one of the largest challenges that is faced by present-day cities that have already been built and that are undergoing continuous expansion is the fact that they have only ever included the development of grey infrastructure; this makes it difficult to be able to achieve eco-friendly urban development and a design that can overcome the lack of access to open, green spaces; the use of water; traffic due to an increase in motorization; pollution and CO2 emissions; among other things, and this new type of urban development is an opportunity for sustainability.
One of the current movements in urban planning has been seen through strong government policies to build low-emission eco-cities that allow for the co-existence of nature and sustainability; these cities are primarily found in China and Japan [11,12]. However, in cities that have highly organic and uneven growth, such as cities in Latin America, this is practically impossible. Latin American cities, despite being low in emissions and carbon footprint compared to European and US cities [13,14], face multiple issues of socioeconomic inequality and deficient environmental conditions along with weak urban planning and design instruments, such that creating a sustainable city would be an enormous feat. One possible route is urban development that not only includes green spaces but that also blue spaces, as one of the critical points of sustainable development is the protection and integration of nature, especially bodies of water such as wetlands, in residential areas, as these ecosystems are disappearing.
It is estimated that 4.6% of the Earth’s surface is wetlands [15] (Gardner et al., 2015), of which around 70% have suffered some type of transformation, degradation, or have simply disappeared in the last few decades [16,17]. In fact, Latin America is the leader in terms of wetland loss in recent decades [18], as the role wetlands play in controlling flooding, water cycles, and their potential as blue–green spaces in the city for leisure and recreation has been ignored. The rising level of urbanization in Latin American cities has brought about a sharp loss and the fragmentation of wetlands and has negatively impacted their ecological value and biodiversity [19,20]. Even in wetlands that are located in cities or urban wetlands that are classified under the Ramsar conservation system in addition to losses in surface area the surrounding areas have been urbanized by residential complexes, as in the case of Pantanos de Villa in Lima, Peru [21]. Coastal wetlands are ecosystems that provide multiple benefits for cities (i.e., biodiversity, flood control, coastal protection, carbon sequestration, etc.) [22,23,24], and understanding all of their functions and current status is crucial for their protection and conservation [25]. Due to urban and suburban growth, wetlands have been susceptible to transformations [26] and, to offset the negative effects of urbanization, they must be incorporated within urban planning [27].
In global sustainability efforts, we are aware of the 17 SDGs (Sustainable Development Goals), where SDG 11 presents goals for more inclusive, healthier, safer, and more resilient cities and settlements. However, urban development policies have provided less attention to the biodiversity and ecosystem services of natural open spaces (such as wetlands) in the planning of residential neighborhoods and have instead focused more on access to green areas [20,21,22,23,24,25,26,27,28,29] due to their multiple benefits for the urban form and for the health of residents. In fact, the proximity of residential areas to nature favors health conditions to address cardiovascular risks [30] and can even reduce mortality rates [31]. Urban designs that integrate green and blue spaces (blue–green infrastructure), such as flooding parks or waterfronts, are essential for advancing towards sustainable and healthy cities with more resilient neighborhoods.
To integrate the blue–green solution, or a strategically planned network with nature-based solutions that provide ecosystem services [32], it is necessary to first understand how the urban form of the city operates. That is, it is necessary to delve into the characterization and planning of residential urban fabrics in order to favor urban development and a landscape with more sustainable urban forms. This comprehension needs mathematical models, or so-called “science of cities”, due to the complex evolution of urban settlements, and in this way, it is possible to discover opportunities for urban development to allow for the integration of natural green and blue spaces such as wetlands for more livable neighborhoods. Urban fabrics are physical expressions of the forms of urban land use, and these have largely been planned without considering the ecological attributes of land-use. Urban fabrics also have an impact on mobility, as they are structures that favor walking, public transportation, or automobile use in city neighborhoods [33]; this translates into compact and disperse structures, with compact structures being more environmentally sustainable because of their proximity, and these structures are also better able to mitigate climate change [34].
For this reason, the present study analyzes the urban fabrics that have been constructed over and around water or urban wetland systems to create a new framework for urban planning, which is usually more focused on permitted land use than landscape composition and the complexity of cities, in order to strategically strengthen blue–green infrastructure in residential neighborhoods in a city with a relevant presence of bodies of water, such as the Metropolitan area of Concepción (Chile). Concepción is a city that has been transitioning to more disperse forms that favor the use of cars [35]. It is also well-known for its wetlands, and its geographic and geomorphological conditions make it a suitable home for small lakes and wetlands. Unfortunately, these have been affected by a series of urban pressures, including backfilling and drying out, meaning that large amount of surface area and biodiversity have been lost [20,21,22,23,24,25,26,27,28,29,30,31,32,33,34,35,36,37]. The urban fabrics are detected around six strategic urban wetlands, which form part of the “La Ruta del Agua” network, a government project aimed at taking actions to value urban wetlands and to increase natural spaces in the city through new infrastructure. This route is a public policy in planning [38], so to promote an eco-friendly urban design for sustainability, we propose a characterization of urban fabrics along with an understanding of the urban patterns through knowledge of statistical relationships using a spatial regression model (OLS—ordinary least squares) with the explanatory urban variables of density, distance, population, housing, highways, green areas, and building permits that have been modeled in GIS. The statistical model evaluates which urban variables explain the rise in urbanization according to the urban fabrics over the wetlands. Urban sustainability requires new methodologies to measure the link between urban planning, ecological design, and engineering in urban environments [39]. With the results of this research, we can suggest more compact fabrics that avoid the reduction of urban wetland ecosystem services, such as recreation and resilience, and discuss the sustained prioritization of the use of cars, which harms the integration of blue–green infrastructure and the well-being of residents in nearby neighborhoods.
2. Materials and Methods
2.1. Urban Wetlands
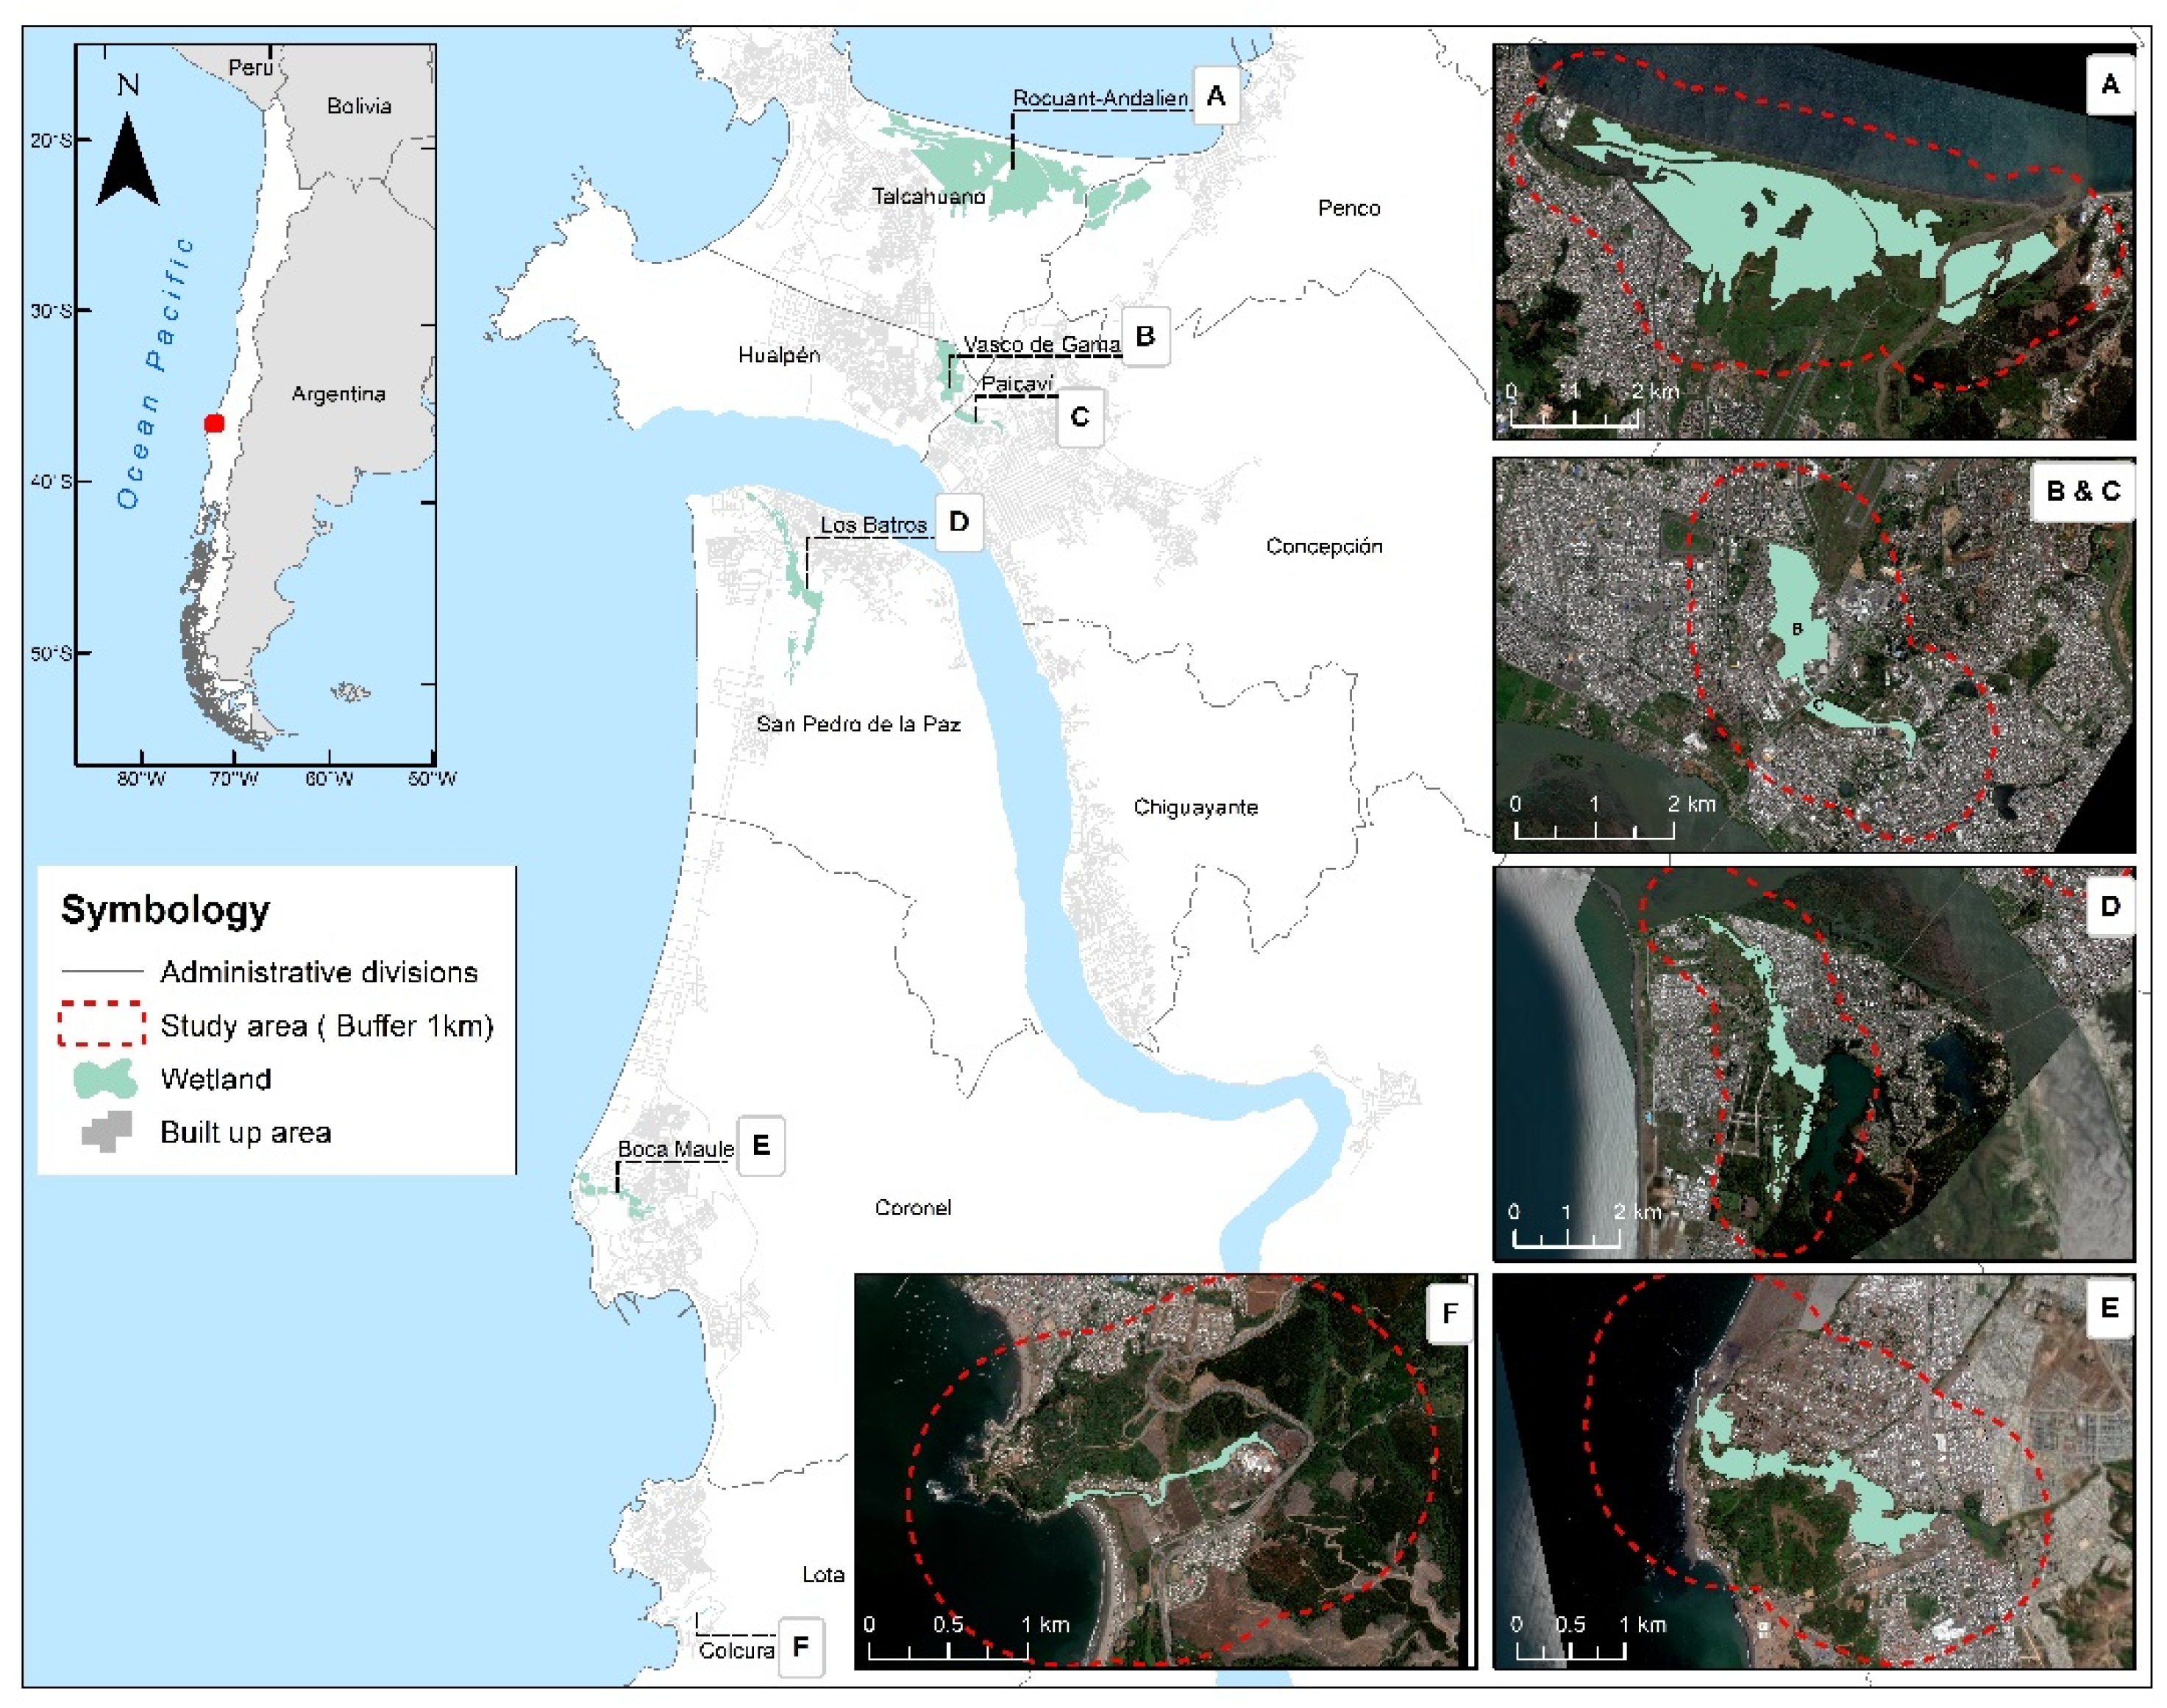
The Metropolitan area of Concepción, an urban settlement in south central Chile, has 15,775 hectares of wetlands that are associated with an urban limit [40]. Public policy has prioritized six urban wetlands that make up the “Ruta del Agua” (Water Route): the Rocuant-Andalién coastal marsh wetland (764 ha) in Talcahuano and part of Penco (the perimeters of this wetland are being updated by the Chilean government in 2021), which has the largest surface area; the Vasco de Gama wetland (86 ha) in Hualpén; Paicaví wetland (23 ha) in Concepción; the Los Batros wetland (133 ha) in San Pedro de la Paz; the Boca Maule wetland (62 ha) in Coronel; and finally, the Colcura wetland (5 ha) in Lota (Figure 1).
These wetlands are located in highly urbanized areas, and in addition to have lost surface area from the effects of poor urban planning [20], they have also lost biodiversity [36,37] despite the fact that Concepcion’s bodies of water and vegetation have shown restorative values in an area that is highly prone to disasters [41].
2.2. Urban Fabric
To characterize the urban fabrics surrounding the six wetlands in question according to expert criteria, the types of urban-residential land-use were determined according to the Corine Land Cover legend, which classifies the urban fabric as continuous and discontinuous [42], and through a modification of the prior proposal for the area of study performed by Rojas, Díaz, and Munizaga [43]. The proposal of the types (Table 1) was conducted in GIS using the photointerpretation of high-resolution satellite images taken by the WorldView-2 sensor (0.3 × 0.3 m) from the year 2018. The recognition was conducted within a walkable buffer of 1 km, from the perimeter of each of the wetlands, and 16 types of urban fabrics were identified.
2.3. Exploratory Urban Variables
Planners tend to describe urban form in order to increase the urban population and, consequently, density, but the complexity of cities also implies understanding social, environmental, and policy factors. Previous work in the study area [37] detected that the biodiversity of wetlands was affected by urbanization variables. Density negatively affects plant composition, distance to the road, and the diversity of insects, while planning areas for the future requires the naturalness of the landscape matrix of urban wetlands to be determined.
To standardize the statistical analysis of spatial variables, a 250 × 250 m grid was used. Likewise, nine variables were established; the dependent variable was the predominant urban fabric by wetland (UF), and there were eight explanatory variables. The variables were selected based on their importance in terms of the configuration of the city, for example distance to the coast, distance to the wetland, and existence of urban green areas. On the other hand, other variables were linked to spatially differentiated territorial planning, such as distance to highways, building permits accepted by the municipality, population, and housing density. Each of the variables are defined as follows:
Social Variables
- (1)
- Urban fabric (UF): The surface area of the urban fabrics was calculated in each cell to determine the predominant one.
- (2)
- Distance to roads (DR): The main road and highway system of Concepcion was considered by calculating the distance (m) from each cell.
- (3)
- Population density (PD): The results of the 2017 CENSUS were used by block, calculating the density of inhabitants per km2 for each cell.
- (4)
- Dwelling density (DD): The number of homes per block from the 2017 CENSUS was considered by calculating the density of homes per km2 for each cell.
- (5)
- Street surface (SC): Considers the detail of the Concepcion road and highway system by calculating the surface area per cell.
Environmental Variables
- (6)
- Distance to coast (DC): Considers the coastal regional border and calculates the distance (m) from each cell to the closest coastline.
- (7)
- Distance to wetland (DW): The distance (m) of each cell was calculated by considering the coverage of the wetlands under analysis.
- (8)
- Green urban areas (GA): Considers the nine (9) types of green urban areas by calculating surface area (m2) by cell.
Policy Variables
- (9)
- Building permits (BP): The number of Concepcion building permits was calculated between 2010 and 2018 for each cell.
The independent variables according to their level or correlation were integrated into each of the Regression Models (this tool combines all of the explanatory variables, helping to determine the model that best explains the dependent variable. In this case, study, Urban Fabric predominates in each wetland. Variables that achieved high adjusted R2 values were considered) by wetland; therefore, they change according to the wetland undervaluation so as to identify the most significant interactions in each ecosystem.
2.4. Regression Model (OLS)
To understand the geographical dynamics of urban development behavior around urban wetlands, the urban variables were used for the statistical analysis. This included modeling the spatial relationship with Linear Regression Ordinary Least Squares (OLS). OLS can be represented with the following equation:
where is the dependent variable that is intended to be predicted or understood. X corresponds to the independent or explanatory variables used to model or predict the dependent variable. β are regression coefficients, which represent the strength or type of relationship that exists between the explanatory variable and the dependent variable, while ε represents the part of the model that cannot explain the dependent variable, known as random error residuals. In addition, a confidence level of 95% is considered, where a p-value (probability) of less than 0.05 indicates that the model is statistically significant.
OLS was applied according to the tool available in GIS in order to detect the areas with the greatest intensification of urbanization and to generate a prediction of the relationships between the explanatory variables and the dependent variable (predominant urban fabric for each wetland, see Figure 2). The predominant urban fabric for the cases of the Rocuant-Andalien, Vasco de Gama and Paicaví, and Boca Maule wetlands is the medium-density residential fabric. In the case of Los Batros and Colcura, the dependent variable or predominant urban fabric is the low-density residential fabric.
3. Results
3.1. Urban Fabrics
First, Latin American cities have diverse types of residential fabrics in nearby areas, making their detection a highly complex task. In the case of the areas surrounding the Concepcion wetlands, the dominant construction type corresponds to low- and medium-density fabrics and has a highly heterogeneous distribution, and the distribution of the fabrics shows that they continue to be less consolidated areas with a large amount of open land with vegetation to be managed. The distribution of the fabrics and the land uses are presented in Figure 3.
The urban fabrics detected may differ by wetland and are presented in Table 2. The following paragraphs discuss their percentages by considering 100% of the total surface area of the 1 km buffer:
A. Rocuant-Andalién: The largest wetland in surface area presents the highest percentage of use in open natural areas with low vegetation (34.4%), followed by forest plantations (7.9%). In the case of artificial lands, the most predominant are residential fabrics with medium density at 6%, which put pressure on the coastal marsh, followed by commercial and industrial areas, also with 6%. The low amount of surface area in green urban areas in these urbanizations must be mentioned, with a low representation of just 0.5%.
B and C. Vasco de Gama and Paicaví: These are marsh wetlands and are perhaps the most urbanized in the area. These wetlands are dominated by commercial and industrial areas, with 33.6% coverage, with respect to urban fabrics, and medium-density residential fabrics represent 21% in these neighborhoods, with 9% in open areas with low vegetation, and low-density residential fabrics with 8%. These urbanizations show a larger presence of green urban areas with 37 hectares (ha).
D. Los Batros: Recognized as an area of important biodiversity, it is highly impacted by forest plantations, with this use being the most relevant at 21.2%, followed by open areas with low vegetation with 15%. Of the constructed areas, the low-density residential fabric represents 13% of residential complexes as well as good transport infrastructure for cars and accessibility to the main urban centers. The northern part of this wetland also has agricultural plantations (vegetables) with 9.1%.
E. Boca Maule: Artificial lands correspond to 15.6%, and in constructed areas, low-density residential fabrics have the greatest representation (15.6%), followed by the medium-density residential fabric (11.3%). In terms of non-constructed spaces, it has open areas with low vegetation (13%) and bare soil (12.6%).
F. Colcura: This wetland is in a more rural setting and is characterized by one-third of its surface area being used for forest plantations (37.7%) followed by bare soil (13.4%). With respect to residential fabrics, they are more dispersed, with the most common being the low density fabric at 8.9%.
3.2. Urbanization Process
The results of the statistical models help describe the urbanization processes that these wetlands have suffered through due to the fact that urban growth directly and indirectly alters ecosystems and their surroundings, especially when the land use is more artificial. Specifically, the wetlands in Concepcion have experienced a reduction in surface area and increased fragmentation and invasion of exotic species, turning natural water landscapes into fragmented soils [37]. However, the different occupancy types of the construction models were unknown, and we will explain this according to the urbanization factors that were evaluated.
This study considers the usual 5% for significance, and the results are presented for each wetland (Table 3 and Figure 4).
A. Rocuant-Andalién: In the case of Andalién, type 1 was used (medium-density residential fabric) as a dependent variable, with five explanatory variables. The model presented an R2 of 0.57, which is fairly optimal, with a significant density of inhabitants and density of green areas and the highest positive coefficient, indicating that there is greater probability of an increase in density as the density of green areas also increases.
B and C. Paicaví and Vasco de Gama: The Paicaví and Vasco de Gama urban wetlands behave similarly, which is why they were evaluated together. Once again, type 1 (medium-density residential fabric) was the dependent variable, with five explanatory variables, obtaining an R2 of 0.43, which shows an excellent balance. The variable with the greatest effect is also the density of green areas, which had a negative value this time (−1.42), showing that when the surroundings are less green and more urbanized, densification rises, which is also affected by the slightly positive effect of road and highway density.
D. Los Batros: In the case of Los Batros, type 3 was used (low-density residential fabric) as a dependent variable, with five respective explanatory variables. This included the type 11 urban fabric (agricultural plantations), which represents a large part of the land. It shows a balanced R2 of 0.68, making it the most balanced model, where the positive construction permit variable has the greatest coefficient of 1.30, explaining why the low-density fabric increases with construction permits along with road and highway density.
E. Boca Maule: The Boca Maule wetland used type 1 (Medium-density residential fabric) as a dependent variable and six explanatory variables, obtaining a well-balanced R2 of 0.619, where the density of green areas explains the existence of medium-density fabrics with a positive coefficient, demonstrating that housing density has a lesser effect.
F. Colcura: In the case of the Colcura wetland, the most rural of the area’s wetlands, type 3 was used (low-density residential fabric) as the dependent variable, with four explanatory variables. A balanced R2 of 0.625 was obtained, explaining 60% variance. In this case, the density of the green area variable carries the most weight in the model, demonstrating a positive coefficient (4.8), repeating the relationship found between Rocuant-Andalién and Boca Maule.
4. Discussion
The growing interest in recovering wetlands in cities is primarily due to the ecosystem services that they provide, not only for recreational purposes but also as an ally to mitigate and adapt to climate change, such as through their capacity to capture carbon [22,23]. However, this capacity has decreased in cities due to the degradation that has been suffered at the hands of urbanization, as in the case of Concepción. In coastal cities, it is also important for coastline protection, especially for protection from coastal erosion that is caused by extreme events, making it a favorable alternative for restoring and recovering the waterfront to better defend against disasters. This has been demonstrated internationally, specifically in coastal US cities such as New York, which are threatened by rising sea levels, hurricanes, and storms. Given this complexity, one of the interventions has been the development of flood parks in wetlands as an essential response to mitigate natural disasters [44], and this solution is particularly relevant to Chile, which frequently experiences tsunamis and tidal waves.
The case of urban wetlands is more complex, as inland wetlands have a less natural environment and require architectural intervention and up-to-date regulations. Given the capacity to regulate disasters [45], the case of Chile is quite relevant, since despite being a country with great risk and high vulnerability to climate change, urban wetlands have not historically been protected from key threats such as the impact of real estate development, mostly low-density developments, fostered by territorial planning and a deficient regulatory urban framework [46]. Wetlands in cities have demonstrated an important role in mitigating extreme events in coastal areas [20], and their regulation capacity has also been valued by the population [47]. To repair this issue according to citizen demands, an unprecedented Urban Wetlands Protection Law (2020) was passed recently to define wetlands and to establish that these must be used rationally under the criteria of sustainability [48,49]. These criteria offer an opportunity for a new urban design, urban drainage, infrastructure, and their integration within Chilean cities, and they certainly cost less than the construction of artificial parks and traditional gray infrastructure solutions; therefore, they can strengthen future projects that are aimed at nature-based solutions for these spaces with blue−green infrastructure, for example, green stormwater infrastructure such as that planned for the city of Portland [50], a city with a similar level of rainfall to that of Concepción. In any case, after frequent and severe disasters faced by Chile, some green infrastructure examples have proliferated, including the Kaukari Park along the Copiapó River [51], the mitigation parks in Constitución and Dichato [52,53], among others.
According to the results of this study, the urban wetlands of Concepción have changed and have been primarily urbanized with low- and medium-density fabrics. It is important to pay attention to urban density, which has been shown to have an impact on biodiversity and the fragmentation of wetlands [37]. Densification is a key explanatory variable that has also had negative effects on water quality [54], especially in the Rocuant-Andalién wetland in the Bay of Concepcion [25]. According to the results, the most urbanized wetlands are Paicaví and Vasco Gama, areas that comprise medium-density family homes and that have also been densified with transport infrastructure that is meant for cars. Medium and low densities have been primarily associated with urban models that are less efficient in terms of sustainability due to the increased distance between homes and main urban centers, a phenomenon that is called urban sprawl [13]. However, in this case, despite the evidence on low and medium densification, a good amount of urban wetland surface area has survived urbanization, as they border open spaces with a greater availability of pasture lands, mixed forest, and forest plantations, especially in Rocuant-Andalién and Boca Maule. Regardless of the threats that are caused by urbanization, which certainly have a significant impact on the hydrological processes in aquatic environments [55], the spatial model has proven that urbanization with low- and medium-density fabrics are better correlated and can coexist with open spaces that are used for vegetation, which the urban model can use to its advantage through the restoration and planning of more natural green areas, hopefully without failing to consider the pressure of the effect of housing on transport infrastructure, particularly in Los Batros and Boca Maule.
Therefore, in urbanized environments, to ensure their existence and to recover their functions to benefit future generations, neighborhoods must be adapted to “eco-friendly” designs. The actions in each wetland must be distinctive according to the particular type of urbanization, type of wetlands (palustrine or non−tidal wetlands and marsh), and drainage conditions of each case. Thus, maintaining sufficient green areas and ensuring access is a challenge when planning for growing cities [56]. Green areas that are based on urban wetlands would provide accessibility to natural, open, green spaces that, in Chilean cities, have shown greater accessibility without formalization as such [57]. In the case of China, the city of Beijing developed the “Beijing City Master Planning (2004–2020),” which incorporates urban wetlands to improve the city’s ecological conditions while also providing recreational areas [27]. Likewise, studies propose that the design of parks that incorporate urban wetlands must combine certain basic principles, such as the protection of these wetlands and the rational use of resources, and that the construction of the infrastructure must not alter the natural environment. Thus, by maximizing both social and aesthetic benefits, this provides an alternative to offset the grey infrastructure that is common in cities [58], along with protecting the biodiversity sought by most visitors to the Xixi urban wetlands park in China [59].
Likewise, the incorporation of wetlands into the green area systems in urban cities would also provide great benefits for sustainability, as these spaces can be used for the treatment of city water, as a wildlife refuge and habitat, for restoration the of endemic plant species, etc. [60]. In New York, visitors to urban wetland parks valued the feeling of refuge, its compatibility with the area, and the chance to experience nature [61]. On the other hand, Du et al. (2019) [62] suggest that incorporating blue−green space into urban planning would allow for the integration and interaction of ecosystems such as bodies of water, helping improve the urban thermal environment, increasing permeability, decontaminating the air, and mitigating urban heat islands.
Considering this evidence, we recommend that for a coastal wetland that is as expansive as Rocuant-Andalién, even with its large vegetation surface area, there needs to be a protection process to avoid future losses as well as for the restoration of aquatic plants and the hydrological system that is in accordance with the Urban Wetlands Law and future conservation actions that are taken by the government. For the sections of highly urbanized borders that interact with the coast, a blue−green infrastructure is advisable to mitigate flooding due to tidal swells and tsunamis. For inland wetlands (palustrine), different actions can be taken according to the density of the urban fabric. In the case of Paicaví and Vasco de Gama, which have less space for expansion, we recommend an urban intervention that favors sustainable urban drainage and neighborhood accessibility, similar to in Llanquihue, another city in the south of Chile, where a green infrastructure plan was developed and began with an extensive citizen participation process to define three pillars: Restore, Inhabit, and Connect. It culminated with the activation of urban wetlands as public and biodiversity spaces, regulating their accessibility through raised pedestrian bridges to allow for ecological recovery and hybrid functionality [63]. For wetlands under pressure, such as Los Batros and Boca Maule, open parks should focus primarily on biodiversity, although this must be strengthened with mobility plans since the development of infrastructure has promoted the use of cars and the sustained fragmentation of spaces. In Colcura, as a more rural and coastal wetland that has expansive vegetation areas, an excellent option would be to promote the natural assets and interaction with cultural heritage circuits that already exist in the area. Finally, an even more relevant aspect thanks to the COVID-19 pandemic is that favoring access to natural spaces provides positive benefits for mental health, wellbeing, and social interaction [64]. In fact, Pouso et al. (2021), determined that blue−green spaces have had a significant effect on the mental health of the urban population since contact with nature helps to reduce the negative impacts of confinement thanks to the intangible benefits and ecosystem services that these spaces provide to cities.
5. Conclusions
This study provides evidence that urban wetlands in the Concepción metropolitan area (Chile) are presently disconnected from the predominant urban fabrics, meaning that the population is unable to enjoy the potential benefits that these natural paces can provide. However, these benefits may be felt low- and medium-density areas with green areas as long as these open vegetative areas are maintained in the environment, though it is important to mention that the effect of these constructions on water quality has yet to be studied.
The role played by urban wetlands in the mitigation and reduction of natural disasters, cultural and ecosystem services, biodiversity, urban drainage, and their aesthetic landscape qualities, among other things, are fundamental to achieving more sustainable cities. For this reason, it is essential to integrate these natural spaces within urban planning and city design through blue−green infrastructure. Blue−green spaces can also offset the effects of climate change in coastal cities.
These urban wetlands require a conservation and restoration process, along with investments in blue−green infrastructure to recover the ecological connectivity and interconnection of blue−green open spaces with residential fabrics, which would substantially improve the quality of life of the residents in those areas and their attachment to the metropolitan area of Concepción, for example, by improving and creating access to recreational and leisure spaces, while also promoting sustainable mobility via non-motorized transport methods that are compatible with the biodiversity of natural spaces to improve mental health and wellbeing.
Finally, the study contributes to the discussion on urban planning for water bodies in Chilean cities, especially in intermediate cities which are increasing in density, including blue and green spaces for people and how to improve sustainability and resilience by including urban wetlands as a nature-based solution to create water-sensitive cities.
Author Contributions
Conceptualization, C.R.Q.; methodology, C.R.Q.; software, F.J.; validation, F.J. and C.R.Q.; formal analysis, C.R.Q. and F.J.; investigation, C.R.Q.; resources, C.R.Q.; data curation, F.J.; writing—original draft preparation, C.R.Q. and F.J.; writing—review and editing, C.R.Q.; visualization, F.J.; supervision, C.R.Q.; project administration, C.R.Q.; funding acquisition, C.R.Q. All authors have read and agreed to the published version of the manuscript.
Funding
This research was funded by ANID FONDECYT, N° 1190251” and contribution of “The ANID FONDAP N° 15110020”.
Institutional Review Board Statement
The research project was conducted according to the guidelines of the Declaration of Helsinki, and approved by the Ethics Committee of social science, arts and humanities of Pontificia Universidad Católica de Chile (2019).
Informed Consent Statement
Not Applicable.
Data Availability Statement
Acknowledgments
The authors are grateful for the comments from the research team made up by Octavio Rojas, Paula Villagra, and Juan Munizaga.
Conflicts of Interest
The authors declare no conflict of interest.
References
- Chiabai, A.; Quiroga, S.; Martinez-Juarez, P.; Suárez, C.; García de Jalón, S.; Taylor, T. Exposure to green areas: Modelling health benefits in a context of study heterogeneity. Ecol. Econ. 2020, 167, 106401. [Google Scholar] [CrossRef]
- Hedblom, M.; Gunnarsson, B.; Iravani, B.; Knez, I.; Schaefer, M.; Thorsson, P.; Lundström, J.N. Reduction of physiological stress by urban green space in a multisensory virtual experiment. Sci. Rep. 2019, 9, 10113. [Google Scholar] [CrossRef] [Green Version]
- Tyrväinen, L.; Ojala, A.; Korpela, K.; Lanki, T.; Tsunetsugu, Y.; Kagawa, T. The influence of urban green environments on stress relief measures: A field experiment. J. Environ. Psychol. 2014, 38, 1–9. [Google Scholar] [CrossRef]
- Stigsdotter, U.A. Urban green spaces: Promoting health through city planning. In Proceedings of the Inspiring Global Environmental Standards and Ethical Practices, The National Association of Environmental Professionals, Alexandria, VA, USA, 16–19 April 2005. [Google Scholar]
- Moreno, C.; Wykes, T.; Galderisi, S.; Nordentoft, M.; Crossley, N.; Jones, N.; Cannon, M.; Correll, C.U.; Byrne, L.; Carr, S.; et al. How mental health care should change as a consequence of the COVID-19 pandemic. Lancet Psychiatry. 2020, 7, 813–824. [Google Scholar] [CrossRef]
- Ramírez-Ortiz, J.; Castro-Quintero, D.; Lerma-Córdoba, C.; Yela-Ceballos, F.; Escobar-Córdoba, F. Mental health consequences of the COVID-19 pandemic associated with social isolation. Colomb. J. Anesthesiol. 2020, 48. [Google Scholar] [CrossRef]
- Loftness, V.; Aziz, A.; Choi, J.; Kampschroer, K.; Powell, K.; Atkinson, M.; Heerwagen, J. The value of post-occupancy evaluation for building occupants and facility managers. Intell. Build. Int. 2009, 1, 249–268. [Google Scholar] [CrossRef]
- Gupta, K.; Roy, A.; Luthra, K.; Maithani, S. Mahavir GIS based analysis for assessing the accessibility at hierarchical levels of urban green spaces. Urban For. Urban Green. 2016, 18, 198–211. [Google Scholar] [CrossRef]
- Howard, E. To-Morrow: A Peaceful Path to Real Reform; Cambridge University Press: Cambridge, UK, 1989. [Google Scholar]
- Yuan, Z.; Zheng, X.; Lv, L.; Xue, C. From design to digital model: A quantitative analysis approach to Garden Cities theory. Ecol. Modell. 2014, 289, 26–35. [Google Scholar] [CrossRef]
- Li, J.; Wang, Q.; Xuan, Y.; Zhou, H. User demands analysis of Eco-city based on the Kano model—An application to China case study. PLoS ONE 2021, 16, e0248187. [Google Scholar] [CrossRef] [PubMed]
- Lin, Z. Ecological urbanism in East Asia: A comparative assessment of two eco-cities in Japan and China. Landsc. Urban Plan. 2018, 179, 90–102. [Google Scholar] [CrossRef]
- Muñiz, I.; Rojas, C. Urban form and spatial structure as determinants of per capita greenhouse gas emissions considering possible endogeneity and compensation behaviors. Environ. Impact Assess. Rev. 2019, 76, 79–87. [Google Scholar] [CrossRef]
- Gilles, E.; Ortiz, M.; Cadarso, M.-Á.; Monsalve, F.; Jiang, X. Opportunities for city carbon footprint reductions through imports source shifting: The case of Bogota. Resour. Conserv. Recycl. 2021, 172, 105684. [Google Scholar] [CrossRef]
- Gardner, R.C.; Barchiesi, S.; Beltrame, C.; Finlayson, C.M.; Galewski, T.; Harrison, I.; Paganini, M.; Perennou, C.; Pritchard, D.; Rosenqvist, A.; et al. State of the World’s Wetlands and Their Services to People: A Compilation of Recent Analyses. SSRN Electron. J. 2015. [Google Scholar] [CrossRef] [Green Version]
- Bouahim, S.; Rhazi, L.; Ernoul, L.; Mathevet, R.; Amami, B.; Er-Riyahi, S.; Muller, S.D.; Grillas, P. Combining vulnerability analysis and perceptions of ecosystem services in sensitive landscapes: A case from western Moroccan temporary wetlands. J. Nat. Conserv. 2015, 27, 1–9. [Google Scholar] [CrossRef]
- MEA (MIllennium Ecosystem Assessment). Ecosystems and Human Well-Being: Synthesis. In Ecosystems and Human Well-Being: Synthesis; Island Press: Washington, DC, USA, 2005. [Google Scholar]
- Darrah, S.E.; Shennan-Farpón, Y.; Loh, J.; Davidson, N.C.; Finlayson, C.M.; Gardner, R.C.; Walpole, M.J. Improvements to the Wetland Extent Trends (WET) index as a tool for monitoring natural and human-made wetlands. Ecol. Indic. 2019, 99, 294–298. [Google Scholar] [CrossRef]
- Martínez, C.; López, P.; Rojas, C.; Qüense, J.; Hidalgo, R.; Arenas, F. A sustainability index for anthropized and urbanized coasts: The case of Concón Bay, central Chile. Appl. Geogr. 2020, 116, 102166. [Google Scholar] [CrossRef]
- Rojas, C.; Munizaga, J.; Rojas, O.; Martínez, C.; Pino, J. Urban development versus wetland loss in a coastal Latin American city: Lessons for sustainable land use planning. Land Use Policy 2019, 80, 47–56. [Google Scholar] [CrossRef]
- Rojas, C. Urban wetland trends in three Latin American cities during the latest decades (2002–2020): Concón (Chile), Barranquilla (Colombia), and Lima (Perú). Wetl. Sci. Pract. 2020, 37, 283–293. [Google Scholar]
- Dabrowska-Zielinska, K.; Budzynska, M.; Tomaszewska, M.; Bartold, M.; Gatkowska, M.; Malek, I.; Turlej, K.; Napiorkowska, M. Monitoring Wetlands Ecosystems Using ALOS PALSAR (L-Band, HV) Supplemented by Optical Data: A Case Study of Biebrza Wetlands in Northeast Poland. Remote Sens. 2014, 6, 1605–1633. [Google Scholar] [CrossRef] [Green Version]
- Penatti, N.C.; de Almeida, T.I.R.; Ferreira, L.G.; Arantes, A.E.; Coe, M.T. Satellite-based hydrological dynamics of the world’s largest continuous wetland. Remote Sens. Environ. 2015, 170, 1–13. [Google Scholar] [CrossRef]
- Basu, T.; Das, A.; Pham, Q.B.; Al-Ansari, N.; Linh, N.T.T.; Lagerwall, G. Development of an integrated peri-urban wetland degradation assessment approach for the Chatra Wetland in eastern India. Sci. Rep. 2021, 11, 4470. [Google Scholar] [CrossRef]
- Novoa, V.; Rojas, O.; Ahumada-Rudolph, R.; Sáez, K.; Fierro, P.; Rojas, C. Coastal Wetlands: Ecosystems Affected by Urbanization? Water 2020, 12, 698. [Google Scholar] [CrossRef] [Green Version]
- Athukorala, D.; Estoque, R.C.; Murayama, Y.; Matsushita, B. Impacts of Urbanization on the Muthurajawela Marsh and Negombo Lagoon, Sri Lanka: Implications for Landscape Planning towards a Sustainable Urban Wetland Ecosystem. Remote Sens. 2021, 13, 316. [Google Scholar] [CrossRef]
- Jia, H.; Ma, H.; Wei, M. Urban wetland planning: A case study in the Beijing central region. Ecol. Complex. 2011, 8, 213–221. [Google Scholar] [CrossRef]
- Rigolon, A. A complex landscape of inequity in access to urban parks: A literature review. Landsc. Urban Plan. 2016, 153, 160–169. [Google Scholar] [CrossRef]
- Neuvonen, M.; Sievänen, T.; Tönnes, S.; Koskela, T. Access to green areas and the frequency of visits—A case study in Helsinki. Urban For. Urban Green. 2007, 6, 235–247. [Google Scholar] [CrossRef]
- Liu, T.; Cai, B.; Peng, W.; Xiao, L.; Shi, H.; Wu, X.; Gao, H.; Jia, X. Association of neighborhood greenness exposure with cardiovascular diseases and biomarkers. Int. J. Hyg. Environ. Health. 2021, 234, 113738. [Google Scholar] [CrossRef] [PubMed]
- Gascon, M.; Triguero-Mas, M.; Martínez, D.; Dadvand, P.; Rojas-Rueda, D.; Plasència, A.; Nieuwenhuijsen, M.J. Residential green spaces and mortality: A systematic review. Environ. Int. 2016, 86, 60–67. [Google Scholar] [CrossRef] [PubMed] [Green Version]
- Mijic, A.; Brown, K. Integrating Green and Blue Spaces into Our Cities: Making It Happen; Grantham Institute: London, UK, 2019; Volume 30. [Google Scholar]
- Helminen, V.; Tiitu, M.; Kosonen, L.; Ristimäki, M. Identifying the areas of walking, transit and automobile urban fabrics in Finnish intermediate cities. Transp. Res. Interdiscip. Perspect. 2020, 8, 100257. [Google Scholar] [CrossRef]
- Angel, S.; Arango Franco, S.; Liu, Y.; Blei, A.M. The shape compactness of urban footprints. Prog. Plan. 2020, 139, 100429. [Google Scholar] [CrossRef]
- Rojas, C.; Pino, J.; Basnou, C.; Vivanco, M. Assessing land-use and -cover changes in relation to geographic factors and urban planning in the metropolitan area of Concepción (Chile). Implications for biodiversity conservation. Appl. Geogr. 2013, 39, 93–103. [Google Scholar] [CrossRef]
- Pauchard, A.; Aguayo, M.; Peña, E.; Urrutia, R. Multiple effects of urbanization on the biodiversity of developing countries: The case of a fast-growing metropolitan area (Concepción, Chile). Biol. Conserv. 2006, 127, 272–281. [Google Scholar] [CrossRef]
- Rojas, C.; Sepúlveda-Zúñiga, E.; Barbosa, O.; Rojas, O.; Martínez, C. Patrones de urbanización en la biodiversidad de humedales urbanos en Concepción metropolitano. Rev. Geogr. Norte Gd. 2015, 181–204. [Google Scholar] [CrossRef] [Green Version]
- Toledo, C. Construyendo metrópolis en Chile: El caso ruta del agua como piloto de gestión del territorio metropolitano en el Gran Concepción. Territ. Y Reg. 2020, 2, 15–23. [Google Scholar]
- Puchol-Salort, P.; O’Keeffe, J.; van Reeuwijk, M.; Mijic, A. An urban planning sustainability framework: Systems approach to blue green urban design. Sustain. Cities Soc. 2021, 66, 102677. [Google Scholar] [CrossRef]
- Ministerio de Medio Ambiente. Programa Inventario Nacional de Humedales 2020. Available online: https://humedaleschile.mma.gob.cl/inventario-humadales/ (accessed on 8 January 2021).
- Villagra-Islas, P.; Alves, S. Open space and their attributes, uses and restorative qualities in an earthquake emergency scenario: The case of Concepción, Chile. Urban For. Urban Green. 2016, 19, 56–67. [Google Scholar] [CrossRef]
- IDEAM. Leyenda Nacional de Coberturas de la Tierra. In Metodología CORINE Land Cover Adaptada Para Colombia Escala 1:100.000; Instituto de Hidrología, Meteorología y Estudios Ambientales: Bogotá, Colombia, 2010; 72p. [Google Scholar]
- Rojas, C.; Díaz, S.; Munizaga, J. Urban fabric patterns on urban wetland. In Advances Studies in Efficient Environmental Design and City Planning. Advanced in Science, Technologhy & Innovation (IEREK Interdisciplinary Series for Sustainable Development); Trapani, F., Mohareb, N., Rosso, F., Kolokotsa, D., Maruthaveeran, S., Ghoneem, M., Eds.; Springer: Cham, Switzerland, 2021; pp. 477–485. [Google Scholar]
- Marois, D.E.; Mitsch, W.J. Coastal protection from tsunamis and cyclones provided by mangrove wetlands—A review. Int. J. Biodivers. Sci. Ecosyst. Serv. Manag. 2015, 11, 71–83. [Google Scholar] [CrossRef]
- Mitsch, W.J.; Bernal, B.; Hernandez, M.E. Ecosystem services of wetlands. Int. J. Biodivers. Sci. Ecosyst. Serv. Manag. 2015, 11. [Google Scholar] [CrossRef] [Green Version]
- Herrmann Lunecke, M.G. Planificación territorial y mitigación de impacto de tsunami en Chile después del 27 Febrero 2010. Rev. Urban. 2016, 34, 20–33. [Google Scholar] [CrossRef] [Green Version]
- Rojas, O.; Zamorano, M.; Saez, K.; Rojas, C.; Vega, C.; Arriagada, L.; Basnou, C. Social Perception of Ecosystem Services in a Coastal Wetland Post-Earthquake: A Case Study in Chile. Sustainability 2017, 9, 1983. [Google Scholar] [CrossRef] [Green Version]
- De Urresti, A. Humedales Urbanos Historia de una ley pionera y ciudadana de protección ambiental. In Senado de Chile; Vicepresidencia del Senado, Ediciones Centro de Extensión del Senado: Valparaíso, Chile, 2019. [Google Scholar]
- Valenzuela, C. Apostillas a la Ley 21.202, que modifica diversos cuerpos legales con el objetivo de proteger los humedales urbanos. Rev. Derecho Ambient. 2021, 15, 123–144. [Google Scholar] [CrossRef]
- Conflictos por el Agua en Chile: El Gran Capital Contra las Comunidades Locales. Análisis Comparativo de las Cuencas de los ríos Huasco (Desierto de Atacama) y Baker (Patagonia Austral)—Dialnet. Available online: https://dialnet.unirioja.es/servlet/articulo?codigo=3211523 (accessed on 23 March 2020).
- Fernández, T.; Courard, P. Parque Kaukari del río Copiapó. ARQ 2018, 70–85. [Google Scholar] [CrossRef] [Green Version]
- Contreras Gatica, Y.; Arriagada Sickinger, C. Reconstrucción exclusionaria. Lo comunitario y las políticas públicas en ciudades menores e intermedias chilenas afectadas por el terremoto y tsunami del 27F 2010: Los casos de Constitución y Dichato. Rev. Geogr. Norte Gd. 2016, 64, 83–107. [Google Scholar] [CrossRef]
- Cartes Siade, I. Dichato, desde la crisis a la reconstrucción. Un modelo de gestión de riesgo y resiliencia. Urbano 2013, 16, 33–40. [Google Scholar]
- Chang, H.; Makido, Y.; Foster, E. Effects of land use change, wetland fragmentation, and best management practices on total suspended solids concentrations in an urbanizing Oregon watershed, USA. J. Environ. Manag. 2021, 282, 111962. [Google Scholar] [CrossRef] [PubMed]
- Bunster, T.; Gironás, J.; Rojas, C.; Bonilla, C. Impacts of Urbanization and Land Use Change over Water Resources. In Water Resources of Chile; Fernández, B., Gironás, J., Eds.; Springer International Publishing: Cham, Switzerland, 2021; pp. 365–387. ISBN 978-3-030-56901-3. [Google Scholar]
- Jalkanen, J.; Fabritius, H.; Vierikko, K.; Moilanen, A.; Toivonen, T. Analyzing fair access to urban green areas using multimodal accessibility measures and spatial prioritization. Appl. Geogr. 2020, 124, 102320. [Google Scholar] [CrossRef]
- Rojas, C.; Páez, A.; Barbosa, O.; Carrasco, J. Accessibility to urban green spaces in Chilean cities using adaptive thresholds. J. Transp. Geogr. 2016, 57, 227–240. [Google Scholar] [CrossRef]
- Song, S.; Albert, C.; Prominski, M. Exploring integrated design guidelines for urban wetland parks in China. Urban For. Urban Green. 2020, 53, 126712. [Google Scholar] [CrossRef]
- Yang, J. The heterogeneous preferences for conservation and management in urban wetland parks: A case study from China. Urban For. Urban Green. 2021, 60, 127064. [Google Scholar] [CrossRef]
- Stefanakis, A. The Role of Constructed Wetlands as Green Infrastructure for Sustainable Urban Water Management. Sustainability 2019, 11, 6981. [Google Scholar] [CrossRef] [Green Version]
- Sonti, N.F.; Campbell, L.K.; Svendsen, E.S.; Johnson, M.L.; Novem Auyeung, D.S. Fear and fascination: Use and perceptions of New York City’s forests, wetlands, and landscaped park areas. Urban For. Urban Green. 2020, 49, 126601. [Google Scholar] [CrossRef]
- Du, H.; Cai, Y.; Zhou, F.; Jiang, H.; Jiang, W.; Xu, Y. Urban blue-green space planning based on thermal environment simulation: A case study of Shanghai, China. Ecol. Indic. 2019, 106, 105501. [Google Scholar] [CrossRef]
- Moreno, O. Infraestructura verde urbana. Estrategias de planificación y diseño del paisaje para la resiliencia y adaptabilidad socioecológica de ciudades regional en Chile. El caso de Llanquihue. In From the South. Global Perspectives on Landscape and Territory Edition; Ediciones Universidad del Desarrollo: Santiago de Chile, Chile, 2019. [Google Scholar]
- Enssle, F.; Kabisch, N. Urban green spaces for the social interaction, health and well-being of older people—An integrated view of urban ecosystem services and socio-environmental justice. Environ. Sci. Policy 2020, 109, 36–44. [Google Scholar] [CrossRef]
Figure 1.
Study area: “La Ruta del Agua”. (A) Rocuant—Andalién marsh; (B) Vasco de Gama; (C) Paicaví; (D) Los Batros; (E) Boca Maule; (F) Colcura.
Figure 1.
Study area: “La Ruta del Agua”. (A) Rocuant—Andalién marsh; (B) Vasco de Gama; (C) Paicaví; (D) Los Batros; (E) Boca Maule; (F) Colcura.

Figure 2.
Methodological summary.

Figure 3.
Characterization of the urban-natural fabrics of wetlands. (A) Rocuant-Andalién; (B,C) Vasco de Gama and Paicaví; (D) Los Batros; (E) Boca Maule; (F) Colcura.
Figure 3.
Characterization of the urban-natural fabrics of wetlands. (A) Rocuant-Andalién; (B,C) Vasco de Gama and Paicaví; (D) Los Batros; (E) Boca Maule; (F) Colcura.

Figure 4.
Geographical distribution of OLS for “Ruta del Agua” Wetlands (The OLS model represents an overall parameter of the average influence of the explanatory variables on the dependent variable. Figure 4 shows that there are zones with a greater R2, which means that the variables better explain the behavior of the medium- and low-density urban fabric here, where a negative R2 means that the variables fail to explain such behavior, such as in non-urbanized areas. The proximity of urbanized areas to the wetlands with a positive R2 reflects the zones where these natural spaces face strong pressure from human activity and must be considered fundamental to the comprehensive planning of blue–green infrastructure). (A) Rocuant-Andalién; (B,C) Vasco de Gama and Paicaví; (D) Los Batros; (E) Boca Maule; (F) Colcura.


Table 1.
Categories and types of urban fabrics and land uses.
| Category of Urban Fabric | Type of Urban Fabric | Definition | Example |
|---|---|---|---|
| Continuous Urban Fabric | (1) Medium-density residential fabric | Urban spaces with artificial surface area of 50% to 80%, with a low proportion of vegetation and bare soil. It is composed of single-family homes of up to two stories. |  |
| (2) Residential fabric in blocks 2.1: New 2.2: Old | Urban spaces with artificial surface area of 50% to 80%, with large collective housing high-rise buildings. Cat 1: Social housing in blocks. Cat 2: Modern buildings, five stories and up. |  | |
| Discontinuous Urban Fabric | (3) Low-density residential fabric 3.1: Residential complexes 3.2: Grouped suburban country plots | Spaces composed of constructions and green areas, with individual constructions of up to two floors plus a loft. Occupation between 50% and 80%. Cat 1: Urbanized areas with low density, medium-lower and lower-class homes. Cat 2: Good infrastructure, aimed at middle-upper and upper-class homes. |  |
| (4) Disperse residential fabric | Spaces composed of constructions and green areas, with isolated individual constructions of under two stories, with an occupation between 15% and 50%. These may be isolated suburban country plots or residential complexes with poor infrastructure in remote areas. |  | |
| Services and equipment | (5) Healthcare | Constructions and infrastructure intended for healthcare: doctors’ offices, hospitals, etc. |  |
| (6) Educational | Educational establishment infrastructure of all kinds. |  | |
| (7) Other urban uses 7.1: Church 7.2: Police 7.3: Fire Station 7.4: Other (city, etc.) | Composed of social centers, neighborhood associations, churches, fire station, police, tourist, and cultural areas, etc. |  | |
| (8) Commercial and industrial zones | Areas with artificial infrastructure with no presence or dominance of green areas; used for commerce and industries. |  | |
| Green areas and non-agricultural recreation areas | (9) Green urban areas | Areas covered in vegetation, located within urban areas, such as parks, squares, cemeteries. |  |
| (10) Sports areas | Areas intended for sports activities, amusement parks, and recreation and leisure activities; inside and outside the urban fabric. |  | |
| Agricultural and livestock zones | (11) Agricultural plantations | Areas intended for temporary or permanent plantations near urban areas. |  |
| (12) Forest plantations | Vegetation cover consisting of artificial plantations with human intervention. |  | |
| Natural areas | (13) Forest | Natural areas composed of a series of native tree species, with high, medium, and low density. |  |
| (14) Open areas with low vegetation | Area with low-density and low-height vegetation, such as herbs and/or bushes. |  | |
| (15) Open areas with bare ground | Spaces without vegetation cover, composed of bare soil, sandy areas, dunes, rocky outcrop, etc. |  | |
| (16) Coastal wetland areas | Areas of coastal zones with permanent or temporary presence of bodies of water, such as rivers, lakes, canals, wetlands, etc. |  |
Table 2.
Types of urban fabrics and land uses.
| Andalién | Paicaví-Vasco de Gama | Los Batros | Boca Maule | Colcura | ||||||
|---|---|---|---|---|---|---|---|---|---|---|
| Urban Fabrics and Urban Land Uses | Ha | % | Ha | % | Ha | % | Ha | % | Ha | % |
| Low-density residential fabric | 82 | 3.5 | 83 | 8.3 | 233 | 14 | 158.4 | 15.6 | 54 | 8.9 |
| Medium-density residential fabric | 146 | 6.2 | 206 | 21 | 59 | 3.4 | 115.1 | 11.3 | 9 | 1.4 |
| Disperse residential fabric | 5 | 0.2 | 10 | 1 | 55 | 3.2 | 10.7 | 1 | 0 | 0 |
| Residential fabric in blocks | 2 | 0.1 | 63 | 6.4 | 22 | 1.3 | 4.7 | 0.5 | 0 | 0 |
| Commercial and industrial zones | 140 | 6 | 335 | 34 | 59 | 3.4 | 64.8 | 6.4 | 31 | 5.2 |
| Open areas with low vegetation | 803 | 34 | 96 | 9.6 | 272 | 16 | 131.9 | 13 | 37 | 6.1 |
| Open areas with bare ground | 158 | 6.8 | 14 | 1.4 | 65 | 3.8 | 128.3 | 12.6 | 81 | 13.4 |
| Sports areas | 11 | 0.5 | 29 | 2.9 | 11 | 0.6 | 18.2 | 1.8 | 2 | 0.3 |
| Coastal wetlands | 748 | 32 | 12 | 1.2 | 343 | 20 | 247.5 | 24.4 | 133 | 22.1 |
| Green urban areas | 13 | 0.5 | 37 | 3.8 | 39 | 2.3 | 14.4 | 1.4 | 0 | 0 |
| Forest | 15 | 0.7 | 24 | 2.4 | 18 | 1 | 13.9 | 1.4 | 27 | 4.6 |
| Agricultural plantations | 16 | 0.7 | 0 | 0 | 157 | 9.1 | 5.7 | 0.6 | 0 | 0 |
| Educational | 12 | 0.5 | 65 | 6.5 | 16 | 0.9 | 10.1 | 1 | 1 | 0.2 |
| Forest plantations | 184 | 7.9 | 0 | 0 | 365 | 21 | 89.8 | 8.9 | 227 | 37.7 |
| Health | 1 | 0 | 4 | 0.4 | 0 | 0 | 0.7 | 0.1 | 0 | 0 |
| Other urban uses | 1 | 0 | 18 | 1.8 | 7 | 0.4 | 1.4 | 0.1 | 0 | |
Table 3.
Summary of OLS model results for the Concepcion wetlands.
| Wetland | Rocuant-Andalién | |||||||
| Dependent Variable | Medium-Density Residential Fabric | No. of Observations | 573 | |||||
| Akaike’s Information Criterion (AICc) | 4281.46 | Adjusted R-Squared (d): | 0.574749 | |||||
| Variable | Coefficient (a) | StdError | t-Statistic | Probability | Robust_SE | Robust_t | Robust_Pr | VIF |
| Intercept | 1.479578 | 0.603576 | 2.451355 | 0.014520 * | 0.341604 | 4.331266 | 0.000021 * | −−−−−−−− |
| UF (8) Commercial | −0.077781 | 0.030034 | −2.589762 | 0.009844 * | 0.023914 | −3.252481 | 0.001226 * | 1.024641 |
| DW | −0.004292 | 0.001314 | −3.266029 | 0.001171 * | 0.001209 | −3.551688 | 0.000428 * | 1.098586 |
| PD | 0.202241 | 0.017155 | 11.788753 | 0.000000 * | 0.065895 | 3.069135 | 0.002261 * | 2.239917 |
| GA | 27.61484 | 3.163336 | 8.729656 | 0.000000 * | 8.769027 | 3.149134 | 0.001737 * | 1.298518 |
| SC | 0.01919 | 0.004671 | 4.107877 | 0.000052 * | 0.01436 | 1.336309 | 0.181994 | 2.139414 |
| Wetland | Vasco de Gama and Paicaví | |||||||
| Dependent Variable | Medium-Density Residential Fabric | No. of Observations | 229 | |||||
| Akaike’s Information Criterion (AICc) | 1924.43 | Adjusted R-Squared (d): | 0.437780 | |||||
| Variable | Coefficient (a) | StdError | t-Statistic | Probability | Robust_SE | Robust_t | Robust_Pr | VIF |
| Intercept | 0.58516 | 2.185359 | 0.267764 | 0.789133 | 1.801237 | 0.324866 | 0.745597 | −−−−−−−− |
| DR | 0.010105 | 0.002935 | 3.442485 | 0.000700 * | 0.002734 | 3.69566 | 0.000286 * | 1.165158 |
| DW | −0.01438 | 0.003374 | −4.261519 | 0.000034 * | 0.003209 | −4.480949 | 0.000014 * | 1.105671 |
| PD | 0.036331 | 0.019897 | 1.825942 | 0.069199 | 0.021786 | 1.667633 | 0.096802 | 1.382216 |
| GA | −1.423271 | 1.440658 | −0.987931 | 0.324247 | 0.782351 | −1.819223 | 0.070222 | 1.022536 |
| SC | 0.062238 | 0.006427 | 9.683684 | 0.000000 * | 0.008261 | 7.533562 | 0.000000 * | 1.332181 |
| Wetland | Los Batros | |||||||
| Dependent Variable | Low-Density Residential Fabric | No. of Observations | 357 | |||||
| Akaike’s Information Criterion (AICc) | 2829.48 | Adjusted R-Squared (d): | 0.692092 | |||||
| Variable | Coefficient (a) | StdError | t-Statistic | Probability | Robust_SE | Robust_t | Robust_Pr | VIF |
| Intercept | −4.416449 | 2.492263 | −1.772064 | 0.077262 | 2.204961 | −2.00296 | 0.045948 * | −−−−−−−− |
| Land use Agricultural | −0.094866 | 0.036419 | −2.604849 | 0.009578 * | 0.02459 | −3.857895 | 0.000145 * | 1.113709 |
| DR | 0.003053 | 0.000932 | 3.276515 | 0.001170 * | 0.00084 | 3.633749 | 0.000333 * | 1.310147 |
| DW | −0.010435 | 0.002133 | −4.891931 | 0.000002 * | 0.002213 | −4.714317 | 0.000005 * | 1.142465 |
| DC | 0.001445 | 0.000697 | 2.072198 | 0.038971 * | 0.000742 | 1.945934 | 0.052461 | 1.060735 |
| BP | 1.306881 | 0.291555 | 4.48245 | 0.000012 * | 0.450045 | 2.903889 | 0.003925 * | 1.263293 |
| PD | 0.041848 | 0.017654 | 2.37042 | 0.018298 * | 0.023473 | 1.782853 | 0.075484 | 1.512545 |
| SC | 0.098315 | 0.005166 | 19.030168 | 0.000000 * | 0.008312 | 11.828637 | 0.000000 * | 1.736653 |
| Wetland | Boca Maule | |||||||
| Dependent variable | Medium-Density Residential Fabric | No. of Observations | 199 | |||||
| Akaike’s Information Criterion (AICc) | 1595.38 | Adjusted R-Squared (d): | 0.619829 | |||||
| Variable | Coefficient (a) | StdError | t-Statistic | Probability | Robust_SE | Robust_t | Robust_Pr | VIF |
| Intercept | −12.333295 | 6.249969 | −1.973337 | 0.049888 * | 3.99988 | −3.083416 | 0.002356 * | −−−−−−−− |
| DR | 0.00265 | 0.001708 | 1.55107 | 0.122543 | 0.001047 | 2.531566 | 0.012149 * | 2.858122 |
| DC | 0.004346 | 0.002406 | 1.806327 | 0.072437 | 0.002291 | 1.896477 | 0.059398 | 3.539482 |
| BP | 0.166251 | 0.087164 | 1.907328 | 0.05797 | 0.048656 | 3.416839 | 0.000784 * | 1.197356 |
| DD | 0.537628 | 0.087482 | 6.145548 | 0.000000 * | 0.12766 | 4.211402 | 0.000043 * | 2.224324 |
| GA | 21.521305 | 3.578551 | 6.013972 | 0.000000 * | 5.00599 | 4.299111 | 0.000031 * | 1.417597 |
| SC | 0.019234 | 0.00684 | 2.811806 | 0.005439 * | 0.010076 | 1.908937 | 0.057761 | 1.91318 |
| Wetland | Colcura | |||||||
| Dependent Variable | Low-Density Residential Fabric | No. of Observations | 120 | |||||
| Akaike’s Information Criterion (AICc) | 898.590344 | Adjusted R-Squared (d): | 0.625410 | |||||
| Variable | Coefficient (a) | StdError | t-Statistic | Probability | Robust_SE | Robust_t | Robust_Pr | VIF |
| Intercept | −1.478911 | 1.59619 | −0.926526 | 0.356105 | 1.327025 | −1.114455 | 0.267404 | −−−−−−−− |
| DR | 0.002968 | 0.002847 | 1.042518 | 0.299352 | 0.002089 | 1.420563 | 0.158157 | 1.138438 |
| PD | 0.321759 | 0.03921 | 8.206065 | 0.000012 * | 0.071776 | 4.482846 | 0.000020 * | 1.352942 |
| GA | 4.846815 | 5.635868 | 0.859994 | 0.391573 | 7.171373 | 0.675856 | 0.500487 | 1.032187 |
| SC | 0.048614 | 0.008622 | 5.638533 | 0.000112 * | 0.015297 | 3.178003 | 0.001911 * | 1.520436 |
* Less than 0.05 is significant.
Publisher’s Note: MDPI stays neutral with regard to jurisdictional claims in published maps and institutional affiliations. |
© 2021 by the authors. Licensee MDPI, Basel, Switzerland. This article is an open access article distributed under the terms and conditions of the Creative Commons Attribution (CC BY) license (https://creativecommons.org/licenses/by/4.0/).
Share and Cite
MDPI and ACS Style
Rojas Quezada, C.; Jorquera, F. Urban Fabrics to Eco-Friendly Blue–Green for Urban Wetland Development. Sustainability 2021, 13, 13745. https://doi.org/10.3390/su132413745
AMA Style
Rojas Quezada C, Jorquera F. Urban Fabrics to Eco-Friendly Blue–Green for Urban Wetland Development. Sustainability. 2021; 13(24):13745. https://doi.org/10.3390/su132413745
Chicago/Turabian StyleRojas Quezada, Carolina, and Felipe Jorquera. 2021. "Urban Fabrics to Eco-Friendly Blue–Green for Urban Wetland Development" Sustainability 13, no. 24: 13745. https://doi.org/10.3390/su132413745
Note that from the first issue of 2016, this journal uses article numbers instead of page numbers. See further details here.