
Has the COVID-19 Pandemic Affected Maritime Connectivity? An Estimation for China and the Polar Silk Road Countries


1
School of Economics and Management, Harbin Engineering University, Harbin 150001, China
2
Institute of Management and Agribusiness, Moscow State University of Food Production, 125080 Moscow, Russia
3
Customs Department, RUDN University, 117198 Moscow, Russia
*
Author to whom correspondence should be addressed.
Sustainability 2021, 13(6), 3521; https://doi.org/10.3390/su13063521
Submission received: 26 February 2021
/
Revised: 16 March 2021
/
Accepted: 20 March 2021
/
Published: 22 March 2021
(This article belongs to the Special Issue Blue Economy and Resilient Development: Natural Resources, Shipping, People, and Environment)
Abstract
:In light of about 80% of international freight traffic carried by sea, maritime supply chains’ stability is pivotal to global connectivity. For over a year now, the transboundary mobility of vessels and cargoes has been restricted by diverse forms of the COVID-19 containment measures applied by national governments, while the lockdowns of people, businesses, and economic activities have significantly affected the growth prospects of various maritime connectivity initiatives. This study investigates how the pandemic-related public health, trade, and market factors have shifted the connectivity patterns in the Polar Silk Road (PSR) transport corridor between China, South Korea, Japan, Russia, and four economies of Northern Europe. The causality links between the Shipping Connectivity Index (SCI) and the number of COVID-19 cases and deaths, trade volumes with China and the rest of the world, and price indexes of minerals, fuels, food, and agricultural products are revealed separately for eight countries and thirty-five ports. The study algorithm is built on the consecutive application of the Augmented Dickey-Fuller (ADF) and the Phillips-Perron (PP) stationarity tests, the Autoregressive Distributed Lag (ARDL) method, the Fully-Modified Ordinary Least Squares (FMOLS) and the Dynamic Ordinary Least Squares (DOLS) robustness checks, and the Toda-Yamamoto causality test. Tight trade-connectivity links are recorded in all locations along the China-PSR transport corridor in 2015–2019, but in 2020, the relationships weakened. Bidirectional influences between the number of COVID-19 cases and connectivity parameters demonstrate the maritime sector’s sensitivity to safety regulations and bring into focus the role of cargo shipping in the transboundary spread of the virus. The authors’ four-stage approach contributes to the establishment of a methodology framework that may equip stakeholders with insights about potential risks to maritime connectivity in the China-PSR maritime trade in the course of the pandemic.
1. Introduction
In just a few months, the COVID-19 outbreak has turned upside down nearly all kinds of economic activities and everyday interactions between people, businesses, and countries. By the first quarter of 2020, the disease had emerged from a health issue to a complex of economic and social problems, almost stopping travel and transboundary mobility and causing unprecedented lockdowns and other painful disruptions to supply chains and global trade [1]. According to the United Nations [2], by the second quarter of 2020, 90% of the world economy had suffered from various kinds of lockdowns. At about the same time, the International Energy Agency [3] reported that nearly 54% of the global population was affected by restrictions to mobility and other forms of social activities and mass gatherings [4]. To a greater or lesser extent, most countries closed their national borders—not only for tourists but also for various types of products [5,6,7]. Since the bulk of intercountry freight traffic is accounted for by maritime transport [1,8], the maritime community has particularly severely suffered from the pandemic. The United Nations Conference on Trade and Development (UNCTAD) [1] expects the volume of international maritime trade to decline by 4.1% in 2020 amid the projected fall of the world GDP from 2.5% (the best-case scenario from the Word Trade Organization (WTO) [9]) to 6.0% forecasted by the Organization for Economic Co-operation and Development (OECD) [10]. On the other hand, as emphasized by the UNCTAD [1], Notteboom et al. [11], Van Tatenhove [12], Kolesnikova [13], and many other scholars, the pandemic has brought to the fore the utmost significance of maritime transport as an essential mean for ensuring the stability of global supply chains, continuing the delivery of major products across continents, and supporting connectivity between disjointed markets.
The OECD [14] allows about 70% of international trade for global value chains, with China predominating in many of them as either a producer, exporter, or importer of resources, intermediate commodities, or final products. Today, China makes up 16% of global GDP and accounts for 20% of world imports by sea [1]. Since the early 2000s, the shipping sector’s increase has been tightly linked to China’s skyrocketing economic growth. Considering the fact that China has been hit by the COVID-19 outbreak longer than any other country and practiced the world’s strictest virus containment measures (and even total lockdowns in the first half of 2020) it is conceivable that maritime trade has experienced a crushing loss [15]. The UNCTAD [1] records shockwaves across ports in China and worldwide in the forms of declined vessel movements, deployed port operations and warehousing capacities, and quarantine restrictions on vessels and crew [16].
These disruptions may cause shifts in the overall patterns of global maritime trade and value chains [17,18] and suspend China’s initiatives in the sphere of maritime connectivity. In 2013, China’s President Xi Jinping [19] proposed the Belt and Road Initiative (BRI) with the view to improve logistics, increase trade, and enhance market integration between participating countries [20]. The initial vision of the two constituent parts of the BRI (the Silk Road Economic Belt and the 21st Century Maritime Silk Road) was then expanded in the 2017 Vision for Maritime Cooperation under the Belt and Road Initiative [21] by designating three “blue economic passages”—the China-Indian Ocean-Africa-Mediterranean Sea Blue Economic Passage, the China-Oceania-South Pacific Blue Economic Passage, and the Polar Silk Road (PSR) via the Arctic Ocean [22].
Among the blue passages, the latter has remained the least explored in terms of its potential impact on changing the landscape of maritime trade and potential losses or gains for global maritime connectivity in the course of the pandemic. China’s Arctic Policy states that the PSR “facilitates connectivity and sustainable economic and social development of the Arctic” [23] by opening up an economic passage between China and Europe through Russia’s Northern Sea Route (NSR) [24,25]. Many scholars have studied the conditions and requirements for trans-Arctic shipping routes to be economically feasible [26,27,28], analyzed freight traffic between Europe, Russia, China, and other countries of Asia [29,30,31], and modeled future volumes of transit and cabotage cargo flows with account for climate change [32,33,34,35,36], exploration of mineral and hydrocarbon resources in the High North [37,38,39,40,41,42], and perspectives of bulk and container transport [35,43,44,45,46]. Before the COVID-19 outbreak hit the world, China had planned to redirect up to 1% of its maritime trade to the PSR by the early 2020s [47]. However, with the pandemic emerging into a global economic threat, there have emerged a number of new issues that could derail the PSR initiative [48]. The effects of these new contributing factors must be adequately studied. While the overall impact of the COVID-19 outbreak on maritime trade remains clouded, the PSR-related estimates have appeared to be particularly scarce and fragmented. The China-PSR maritime trade studies have not comprehensively broken trade flows down by categories of cargo. A breakdown by ports along the route from China to Europe (including Russia’s NSR ports) is almost missing. Against this background, we attempted to fill the existing lacunas by revealing the pandemic’s implications for maritime connectivity and trade in the High North.
2. Materials and Methods
2.1. Countries and Ports
This study includes China and seven countries of Northeast Asia and Northern Europe (in alphabetical order, Denmark (including Greenland), Iceland, Japan, Norway, Russia, South Korea, and Sweden). In each country, we selected major ports located along the potential PSR corridor (in China—largest ports in the northeastern coastal provinces) (Figure 1).
2.2. Variables and Data
Across the established array of localities, we aim to estimate the possible economic effects of the COVID-19 pandemic on the integration of individual countries and ports into shipping networks with China (in the case of China—into the PSR shipping network). A country’s integration level into global shipping networks is commonly measured by the shipping connectivity index (SCI). According to the UNCTAD [49] and the MDS Transmodal [50], the SCI captures the transport connectivity of a country with its counterparts through maritime trade. The index aggregates six parameters of a country’s maritime connectivity, such as the number of ship calls per month, deployed capacity of transport vessels, the number of regular shipping services to and from the country, the number of shipping companies that provide such services, the average deadweight of the vessels deployed by shipping services, and the number of countries that are connected to the country through shipping. The SCI is set at 100 for the maximum value of a country’s connectivity in the first quarter of 2006, which was China. Respectively, transport connectivity of individual ports is measured by the port shipping connectivity index (PSCI) [49]. Previously, neither the SCI nor the PSCI has been employed to study transport connectivity in the PSR. Still, both indexes have been extensively used as reliable reflections of maritime connectivity in many global-scale studies [17,51,52,53], as well as local estimations of maritime trade in Asia [54,55,56] and Europe [57,58,59].
To reflect the complexity of the pandemic-related factors and their possible influences on the SCI and the PSCI, we used three dimensions of independent variables: direct effects of the pandemic, effects of trade, and market effects (Table 1).
- As the pandemic is still progressing (at the time of this writing, January 2021), it is hardly possible to establish an unambiguous relationship between the spread of the disease, lockdown and containment measures, market fluctuations, economic slowdown, and trade activities. Nevertheless, many scholars, including Ding et al. [60], Baber [61], Erokhin and Gao [62], Ceylan et al. [63], and Mityakov [64], demonstrated the applicability of the number of registered COVID-19 cases in international comparisons of the economic effects of the pandemic. In earlier studies of other outbreaks (SARS, MERS, etc.), Bakalis et al. [65], Poudel et al. [66], and Bhargava et al. [67] also found that economic and trade activities could be associated with morbidity and mortality rates. The confirmed COVID-19 cases and death counts were employed by Nallon [16] to calculate the potential risk of COVID-19 spread related to individual ports. Therefore, we use the monthly number of new confirmed COVID-19 cases (X1) and the monthly number of new confirmed COVID-19 deaths (X2) to capture the pandemic’s direct effects on the degree of maritime connectivity.
- Regarding the effects of trade on maritime connectivity, we avoid using UNCTAD’s seaborne trade measure to ensure the cointegration between the variables. As reported by Liang and Liu [68], Hu et al. [69], Bertho et al. [70], and Chang et al. [56], seaborne trade directly relates to maritime connectivity, and thus it cannot be used as an independent variable in our study. Instead, the influences of trade activities on the SCI and the PSCI are reflected by the country’s monthly total exports and imports. Apart from preventing the multicollinearity problem, taking total outbound and inbound trade flows as variables allows us to check whether the role of maritime trade in the total trade turnover of a country has changed during the pandemic. Expressly, we can assume that stronger relationships between shipping connectivity indexes from one side and export and imports from the other can mean a reorientation of total trade towards the maritime sector. To differentiate between the total trade with the world and intra-PSR trade flows, we employ the parameters of total exports to the world (X3) and exports to China (X5) (for China, X5 designates exports to PSR countries) along with total imports from the world (X4) and imports from China (X6) (for China, X6 specifies imports from PSR countries).
- The pandemic has dramatically affected daily economic activities and transportation worldwide [71,72,73]. Generally, as reported by Černikovaitė and Karazijienė [74], Leach et al. [75], Egger et al. [76], and other scholars, the COVID-driven transformations of the economic environment have been reflected in the behavior patterns of businesses and consumers, i.e., supply and demand shifts in the global market. The most common approach to tracking market volatilities is to monitor prices. That is why we employed the Commodity Price Index (CPI), an average of monthly quotations at a commodity’s main marketplace. According to the UNCTAD [77], the CPI is a fixed-base Laspeyres index, where the weights are proportional to the individual commodities’ shares in total merchandise exports of a country in the base period (2014–2016). Four independent variables are included in the study to capture the categories of cargo that dominate in the Asia-Russia-Europe transit via the Northern Sea Route (NSR), the so-far primary operating transport passage in the Arctic Ocean [78]: X7–minerals, ores, and metals; X8–fuels; X9–food products; X10–agricultural raw materials and oilseeds.

Table 1.
Variables included in the study.
| Index | Variable | Unit of Measure | Definition | Source of Data |
|---|---|---|---|---|
| Y | Shipping Connectivity Index (SCI) or Port Shipping Connectivity Index (PSCI) | Points | A degree of a country’s (port’s) integration into global shipping networks | UNCTAD [49,79], MDS Transmodal [50] |
| X1 | Number of new confirmed COVID-19 cases | Number of cases | Monthly new confirmed COVID-19 cases in a country | Johns Hopkins University of Medicine [80], Our World in Data [81] |
| X2 | Number of new confirmed COVID-19 deaths | Number of deaths | Monthly new confirmed COVID-19 deaths in a country | Johns Hopkins University of Medicine [80], Our World in Data [81] |
| X3 | Exports to the world | $ million | Monthly total exports from a country to the world | UNCTAD [79] |
| X4 | Imports from the world | $ million | Monthly total imports to a country from the world | UNCTAD [79] |
| X5 | Exports to a country | $ million | Monthly total exports from a country to China (for China–monthly total exports to PSR countries) | UNCTAD [79] |
| X6 | Imports from a country | $ million | Monthly total imports to a country from China (for China–monthly total imports from PSR countries | UNCTAD [79] |
| X7 | Commodity Price Index: minerals | Points | Index of monthly prices of minerals, ores, and non-precious metals exported by a country (aluminum, copper, iron ore, lead, manganese ore, nickel, phosphate rock, tin, zinc) | UNCTAD [79] |
| X8 | Commodity Price Index: fuels | Points | Index of monthly prices of fuels exported by a country (coal, crude oil, natural gas, including liquefied natural gas) | UNCTAD [79] |
| X9 | Commodity Price Index: food | Points | Index of monthly prices of food products exported by a country (meat and meat products, milk and dairy products, fish and seafood products, sugar, wheat) | UNCTAD [79] |
| X10 | Commodity Price Index: agriculture | Points | Index of monthly prices of agricultural raw materials and oilseeds exported by a country (palm oil, soybean meal, soybean oil, soybeans, sunflower oil) | UNCTAD [79] |
Source: Authors’ development.
To reveal the pandemic-driven effects of the independent variables on maritime connectivity, the calculations are made separately for the two periods. First, we find the Y-X3–10 relationships in 2015–2019 (January–September in each year, 45 observations in total). Then, we add variables X1 and X2 and calculate the Y-X1–10 model for the period from January 2020 (when COVID-19 cases were first confirmed outside China) till the end of September 2020 (availability of data for all variables included in the study). In addition to differentiating between the pre-pandemic and pandemic periods, we make separate country-level (eight countries) and port-level (thirty-five ports) calculations, as described below.
2.3. Methodology Framework
The study goes along the four stages as depicted in Figure 2. We start with checking a cointegration in the established datasets, then investigate short-run and long-run interactions between dependent and independent variables, test the robustness of the results, and complete the study by revealing the causality directions between Y and each of X1–10 variables.
Before the dataset is used in the analysis, it is crucial to confirm the stationarity of the dataset and the cointegration between the selected variables [82,83]. At Stage 1, we check the dataset’s stationarity by implementing two commonly used methods, the Augmented Dickey-Fuller (ADF) test [84] and the Phillips-Perron (PP) test [85]. The applicability of the combination of the two methods to the short-run and long-run inter-country comparisons of trade parameters and prices have been demonstrated by many scholars, including Chang et al. [82,86], Hoarau [87], Herwartz and Reimer [88], and Aliyev et al. [89].
Having confirmed the cointegration between Y and independent variables, we apply the autoregressive distributed lag (ARDL) method [90]. Since the early 2000s, this technique has been extensively used in revealing short- and long-run relationships between various macroeconomic parameters, including in trade-related studies [91,92,93,94,95], investigations of market volatilities [96,97,98,99], and, most recently, estimations of the economic effects of the COVID-19 pandemic and other outbreaks [62,100]. Two ARDL models are established for studying the Y-X3–10 relationships in 2015–2019 (Equation (1)) and the Y-X1–10 interactions in 2020 (Equation (2)). If F-statistics is larger than the upper critical bounds value [I(1)], the series are cointegrated. If it is below the lower critical bounds [I(0)], the variables are not cointegrated.
where Δ = first difference operator; = constant term; = short-run elasticities of the variables; i = ARDL model lag order; = error correction term; = error disturbance; t = time.
At Stage 3, robustness checks of the short-run and long-run ARDL results are made by implementing a combination of the fully-modified ordinary least squares (FMOLS) and the dynamic ordinary least squares (DOLS) methods, which is an approach previously tested by Yuzbashkandi and Sadi [101], Pasha and Ramzan [102], Erokhin and Gao [62], Adebayo [95], and many other authors. The selection of the FMOLS is explained by the fact that the method allows one to receive consistent parameters even in the small samples in the short-run [62]. For the 2020 array with nine observations, it is a particularly valuable characteristic of the method. Furthermore, as evidenced by Priyankara [103] and Bashier and Siam [104], the FMOLS effectively addresses the problems of endogeneity and serial correlation, which ensures heterogeneity in the variables. The use of the DOLS in combination with the FMOLS helps to estimate the equilibrium that is corrected for potential simultaneity bias among explanatory variables [105]. The use of the DOLS is also advantageous in our study since it applies to small samples in the short term [106].
Stage 4 completes the study’s calculation by finding the direction of causalities between Y and X3–10 (2015–2019 model) and Y and X1–10 (2020 model). The Toda-Yamamoto causality test [107] is used, as previously practiced in investigating causal linkages between economic parameters and non-economic influences of exogenous factors, including the COVID-19 pandemic, by Belaid et al. [108], Erokhin and Gao [62], Ben Amar et al. [109], Amiri and Ventelou [110], and Soytas et al. [111]. The TY value demonstrates a strong causality link between the variables in case of the significance at 1% level (5%—above average, 10%—average, all other cases–weak). In a [YXn; XnY] pair, the causality can be unidirectional (direct or reverse), bidirectional, or neutral. Based on the parameters of strength and direction of the causality link, we compare the 2015–2019 and the 2020 models to reveal changes in the Y-Xn relationships that can be attributed to the influence of the COVID-19 pandemic on maritime connectivity.
3. Results
3.1. Stationarity of Data
The values of the SCI (eight countries) and the PSCI (35 ports) are calculated separately for the 2015–2019 model (45 observations) and the 2020 model (nine observations) (Appendix A, Table A1). The X3–10 and X1–10 arrays are established accordingly. The implementation of the ADF and the PP methods to the two arrays of data (2015–2019—see Appendix B, Table A2; 2020—see Appendix B, Table A3) allows us to confirm that all selected variables are stationary at a level of either I(0) or I(1). In both models, the parameter of F-statistics is above the upper bound (Table 2). Therefore, at Stage 1, we find that the preconditions for co-integration between Y and X3–10 (2015–2019 dataset) and Y and X1–10 (2020 dataset) exist in all countries and ports included in the study. The datasets’ stationarity and the co-integration between the variables justify the appropriateness of the models for further analysis.
3.2. Interactions between Variables
Since the study aims to reveal the fluctuations in Y-Xn relations caused by the pandemic in 2020, the ARDL analysis starts with estimating the short-run patterns. In 2015–2019, the strongest effect on the growth of Y is caused by an increase in trade volumes with the world. For both exports X3 and imports X4, this effect is the most significant in Japan, Iceland, and South Korea (Table 3), where the contribution of maritime transport to overall trade turnover was exceptionally high. In China, the influence on maritime connectivity of trade activities with PSR countries is statistically significant, especially in Shanghai, Qingdao, and Dalian (Appendix C, Table A4). When other variables remain constant, a growth of aggregate exports from China to the seven PSR countries by 5% results in the increase in the SCI by 0.25% (0.22% in the case of imports, respectively). Among PSR countries included in the study, maritime connectivity strongly depends on trade with China in Japan, South Korea, and Norway.
The influences of X7–10 on Y in the 2015–2019 model are divergent. Thus, we see a relatively strong direct relationship between maritime connectivity and mineral prices in Iceland, Norway, and Russia (major exporters of ores and other minerals) and Japan and South Korea (importers of scarce mineral resources). The strongest Y-X7 link is recorded in Nuuk (Greenland), Reydharfjordur (Iceland), and Niigata (Japan). The impact of oil prices on Y is weaker than that of mineral prices, along with a reverse relationship in China, Japan, and South Korea. In these countries, a decline in the fuels CPI is associated with more imports and, consequently, an increase in the SCI (the PSCI in Dalian, Lianyungang, Qingdao, Gwangyang, Pusan, and Ulsan). Similar negative relationships between prices and maritime connectivity are observed in [Y; X9] and [Y; X10] pairs in China, South Korea, and Japan, who are net importers of food and agricultural products.
In 2020, the strengths of many Y-Xn linkages declined. Weaker associations are recorded between maritime connectivity on one side and exports and imports on the other in China, Russia, and Nordic countries (Table 4). Smaller ports experience more considerable losses, for example, Rizhao, Lianyungang, Qinhuangdao, and Weihai in China, Hammerfest and Tromso in Norway, and most of Russia’s ports in the Northern Sea Route (Appendix C, Table A5). In Japan and South Korea, whose foreign trade primarily relies on maritime transport, the Y-X3 and Y-X4 links became tighter in January–September 2020 compared to the average values in January–September 2015–2019. However, the strengthening of the trade-connectivity linkage is specific to bigger ports (Niigata and Pusan), while in smaller ones, the Y-X3–4 association has been weakened (Hakata and Kitakyushu in Japan and Gwangyang and Ulsan in South Korea).
A downward trend is also observed for the influence of China-PSR trade on maritime connectivity. Across all seven countries, exports to China and imports from China contribute less to the SCI index in 2020 than in 2015–2019. In China, an increase in the value of exports to PSR countries by 5% is associated with a growth of maritime connectivity by 0.24%, a decline by 0.01 percentage point compared to the 2015–2019 model. An equal increase in imports results in a growth of the SCI value by 0.20%—a loss of 0.02 percentage points. The most profound drops occur in Shanghai (0.28 percentage points for X5 and 0.36 percentage points for X6), Qingdao (0.11 and 0.13 percentage points, respectively), and Yantai (0.10 and 0.08 percentage points, respectively).
The long-run ARDL models confirm the short-run estimates with very few exceptions. In 2015–2019, the long-run contribution of trade with PSR countries to the value of China’s maritime connectivity is weaker compared to the short-run estimations (Table 5). In 2020, however, the relationship between China’s SCI score and X5–6 becomes tighter (Table 6). On the other hand, in some PSR countries, the role of either exports to China (Iceland, Sweden) or imports from China (South Korea) in 2020 increases compared to the average 2015–2019 values. Thus, the Y-X5 link becomes stronger in Reydharfjordur (Iceland), Kitakyushu (Japan), and Ulsan (South Korea), while the strength of the Y-X6 relationship increases in Reykjavik and Reydharfjordur (Iceland), Gwangyang and Pusan (South Korea), Gothenburg (Sweden), Murmansk (Russia), and Dalian (China) (Appendix D, Table A6 and Table A7).
In both short-run and long-run ARDL estimations for the 2020 model (Table 4 and Table 6), we see how the values of the maritime connectivity at the country and port levels are affected by the number of confirmed COVID-19 cases and deaths (or rather lockdowns and restrictions imposed to maritime transportation due to the pandemic). It is safe to assume that the pandemic-related logistics constraints are reflected in the connectivity index body through a decrease in the number of ship calls at ports or a breakdown of shipping services between countries. Still, we identify associations between X1–2 and Y in all eight countries, though of varying strength and direction. The strongest negative link between Y and X1 (an increase in the number of COVID-19 cases is associated with a decrease in maritime connectivity) is observed in Japan and South Korea, the two countries that have been most severely hit by the COVID-19 outbreak among those included in the study. In China, where the number of COVID-19 cases has been much lower compared to that in the countries of Asia, Northern Europe, and Russia (while the spread of the virus was curbed in the first half of 2020), an adverse effect of X1 on Y is negligible. In those countries where the lockdowns have been relatively mild (Sweden, Russia) or the number of COVID-19 cases has remained low (Iceland, Greenland), the Y-X1–2 linkages are weak.
3.3. Robustness Test
The employment of the FMOLS and DOLS tests demonstrates the ARDL estimates’ robustness in both the 2015–2019 and the 2020 models. The number of new confirmed COVID-19 cases is confirmed to result in lower maritime connectivity levels in Japan and South Korea (significance at 1% level) and, to a lesser extent, in Norway, Denmark, and China (Table 7).
The impact of the number of new confirmed COVID-19 deaths on the SCI is noticeably lower across all eight economies. This difference can be attributed to the fact that governments have been attempting to curb the transboundary spread of the virus by introducing restrictions based on the number of new cases. The number of deaths is an indicator of how national health care systems have coped with the pandemic, rather than a parameter of stringency of logistics and economic restrictions.
When comparing the 2020 estimations with the 2015–2019 FMOLS and DOLS test results (Table 8), we should emphasize tighter linkages between maritime connectivity and trade-related variables in the pre-pandemic period. The prevalence of statistically strong interplays between Y and X3–4 is confirmed in Japan, South Korea, and Iceland. The China-PSR trade paradigm is particularly relevant for maritime connectivity in Japan and South Korea (significance at 1% level for both exports and imports), Norway and Iceland (significance at 5% level), and Denmark, Russia, and Sweden (significance at 5% level for exports to China). In the case of China, the robustness test does not show an essential strengthening of Y-X5–6 linkages in 2020 compared to 2015–2019, but the interplays in [Y; X5] and [Y; X6] pairs remain statistically strong both before and during the pandemic.
Regarding prices of minerals, fuels, and food and agricultural products, the FMOLS-DOLS test confirms earlier revealed ARDL estimates. We see that in net importing economies, a decrease in prices exerts a reverse influence on the maritime connectivity. The strongest effects of this kind are observed in Japan, South Korea, and China for food and agricultural products, as well as in China, Denmark, Iceland, Sweden, and South Korea for oil, natural gas, and coal. In net exporting countries, the prices-connectivity relationship is commonly direct, for example, in Iceland, Russia, Norway, Sweden, and Denmark for minerals, Norway and Russia for fuels, and Denmark, Iceland, Norway, Sweden, and Russia for food and agricultural products.
3.4. Causality Directions
The TY test demonstrates the most significant causality flowing from the number of new confirmed COVID-19 cases to maritime connectivity in South Korea, Japan, and China. As revealed earlier, the number of COVID-19 deaths has no real impact on changes in the SCI score (Table 9).
Among the ten Xn variables included in the study, the most decisive influence on Y is exerted by exports to and imports from the world, particularly in countries where maritime transport dominates as a means of freight traffic (Japan, South Korea, Iceland). In some [Y; X3] and [Y; X4] pairs, we see bidirectional interactions between the variables with a particularly strong influence of Y on either exports or imports in 2020. Reasoning from this finding, we can assume that the parameters that compose the SCI have gained significance amid the pandemic and have directly affected the value of foreign trade operations at ports (for example, through restrictions to some shipping services, quarantine requirements to vessels, cargo, and crew, or reduced number of ship calls). We should also stress the reverse YX1 causality link in Japan, South Korea, China, Russia, and Denmark, which could signify the role maritime transportation has played in the transboundary spread of the virus.
To a considerable degree, causality links in the [Y; X5] and [Y; X6] pairs iterate those between maritime connectivity and trade with the world—the impact of Y on the China-PSR trade grows, while the reverse causality flowing from trade to connectivity weakens. In 2020, trade with China still exerts a statistically strong influence on the SCI score in Northern Europe (Denmark, Iceland, Norway) and Russia. In Japan and South Korea, the impact of connectivity on trade with China surpasses that of trade on connectivity evidenced in 2015–2019. A similar trend is observed on China’s side in trade with PSR countries, but both X5Y and X6Y causality links remain strong.
The causalities between prices and maritime connectivity become weaker in January–September 2020 compared to 2015–2019. Among X7–10 variables, we see the weakest influence of minerals prices on the SCI across all eight countries. The X8Y causality link strengthens in Japan, South Korea, and China, which could probably designate the increase in fuel purchases amid falling global prices to establish reserves. The reasons, directions, and strengths of particular causality links in 2020 compared to the pre-pandemic period are detailed and discussed in the next section.
4. Discussion
Possible consequences of the COVID-19 pandemic to maritime connectivity are addressed as changes in causality linkages between variables in the 2020 model compared to the 2015–2019 model. As the TY framework assumes, these changes can be reflected through either the direction of causality, the strength of causality, or both (Table 10).
Proceeding from breaking the array of independent variables down to the pandemic-related, trade, and market segments (X1–2, X3–6, and X7–10, respectively), possible influences on maritime connectivity in the course of the COVID-19 outbreak are further addressed separately.
4.1. Pandemic Effects
Unsurprisingly, both the ARDL analysis and the TY causality test show that the COVID-19 outbreak can be associated with monthly changes in the SCI scores that have been observed by the UNCTAD [1], research and statistics entities [112,113,114], and many scholars worldwide [16,115,116,117]. However, in contrast to Samli [118], Koyuncu et al. [119], and some other authors who estimated the pandemic impacts on commerce at container ports, we do not observe strong linkages between the number of COVID-19 cases and the overall SCI score. Across the countries and ports included in the study, the causality flowing from the number of new COVID-19 cases to maritime connectivity is either weak or average (Japan and China). Only in South Korea, the strength of the causality is estimated as above average, but it is bidirectional at the same time. Bidirectional links are also observed in China and Japan, while in Denmark and Russia, connectivity parameters affect the spread of the virus, and not the other way around.
It is safe to assume that the reverse or bidirectional interactions between the number of COVID-19 cases in a country and the maritime connectivity are attributed to the roles that certain constituents of the SCI (the number of ship calls, the number of regular shipping services from and to the country, the number of countries that are connected to the country through shipping) could play in the transboundary spread of the virus. According to the UNCTAD [1], the pandemic led to fewer port calls for most vessel types during the first half of 2020, which contributed to a breaking of virus transmission chains, but resulted in significant drops in maritime connectivity scores in China, Norway, Iceland, Russia, South Korea, and Sweden in January–June 2020 (Appendix A, Table A1). As demonstrated by Hsiang et al. [7], Deb et al. [120], and Chinazzi et al. [121], travel restrictions, mandatory quarantines, and other containment measures applied to maritime transportation have had a decisive influence on the reduction of the rate of virus transmission. Nevertheless, in South Korea and Japan (to a lesser extent, in Denmark, Russia, and China), we observe a distinct causality flowing from the SCI parameters to the number of new confirmed COVID-19 cases.
A new concern has emerged as researchers confirmed that the virus could survive on frozen foods [122]. Since fall 2020, Chinese sanitary authorities have been tracing the presence of viral genetic material in meat, fish, and seafood cold chains across the country [123,124]. Most of the local outbreaks since then (Qingdao, Dalian, Shanghai) have been directly associated with imported cold-chain products at ports (fish and seafood products from Russia, Norway, Indonesia, and Ecuador and beef and chicken wings from Brazil) [123]. In September 2020, China introduced precautionary measures against aquatic products from Norway [125] and then closed all ports to fish imports from Russia in December 2020 [126] to prevent the spread of the virus. It should be expected that the SCI scores for Chinese, Russian, and other PSR ports will continue to be depressed until import bans and other COVID-19 containment measures are lifted.
4.2. Trade Effects
Some experts argue that such safety-related restrictions to maritime trade significantly add to the deglobalization shift that has accelerated in recent years amid trade tensions between China and the USA, and a new rise of protectionist policies across the world [127,128,129,130,131]. Minárik and Čiderová [54], Ibn-Mohammed et al. [132], and Qin et al. [133] demonstrate how trade has succumbed to regional loci in the course of the pandemic, while supply chains have been reshaped, fragmented, and geographically dispersed due to restrictions to transboundary transportation. The Flock Freight [134] provides a growing number of examples of shortened supply chains with elements of nearshoring, reshoring, and redundancy (maintaining excess inventory). The UNCTAD [1] even forecasts a shift away from single country-centric sourcing and China’s weaker role in certain maritime supply chains that both could happen due to the disruptions brought by the COVID-19 outbreak.
In support of these estimations, our results show much weaker X3Y and X4Y causality links in 2020 compared to 2015–2019 in some countries and ports included in the study. In China (mainly in smaller ports like Rizhao, Lianyungang, Qinhuangdao, and Weihai), the impacts of exports and imports on the SCI score drop from above average to average. South Korea’s Ulsan also goes down from strong to above average causality link between trade volumes and the maritime connectivity index. Simultaneously, we do not record substantial changes in trade-connectivity causality across Northern Europe, while in Russia, both exports and imports have strengthened their contribution to the overall national SCI score. This can be explained by the fact that supplies of minerals and fuels from Russia, Norway, and Nordic countries have not been so much disrupted in 2020 compared to South Korea’s, Japan’s, or China’s hi-tech and manufacture exports [133]. In most of the NSR ports in Russia, as well as in Norway, Iceland, Denmark, and Sweden, we see the SCI rebounds in Q3 2020 compared to the first half of the year.
A good part of these exports go to China, which designates above average or average causalities flowing from both X5 and X6 to Y in all PSR countries except Russia—which extensively trades with China’s northwestern provinces through land border crossing points in Siberia and the Far East. Our calculations thus allow us to support the findings of Vidya and Prabheesh [135], who conclude that in many maritime supply chains, China’s central position has not been as affected by the pandemic. According to Qin et al. [133], even in the course of the COVID-19 outbreak, China has remained one of the major sources of foreign value-add in total gross exports in Japan, South Korea, Russia, and other countries. Although Che et al. [136] evidenced a decline in China’s trade with countries that suffered the most from the pandemic, we see that in Japan and South Korea, a contribution of trade with China to maritime connectivity has remained strong. The UNCTAD [1] emphasizes that China’s maritime supply chains have appeared to be more resilient throughout the pandemic experience than other locations. In this sense, tighter connectivity between China and PSR economies contradicts many of the pandemic-related deglobalization and fragmentation fears, and instead establishes a foundation for China to continue developing the PSR initiative in the post-COVID era.
4.3. Market Effects
Minerals, fuels, and agricultural products are major categories of cargo transported via the Asia-Russia-Europe maritime corridor, but their influences on maritime connectivity in PSR countries are markedly different. For minerals, we observe insignificant changes in the already weak causality linkages between prices and the SCI scores. This well agrees with UNCTAD’s estimation [1] that the pandemic-related reductions in mining and industrial activity had a minor impact on dry bulk trade in iron ore (78% of transit shipping in the NSR in 2020 [78]). Sand [137] associated slumps in construction and steel manufacturing in 2020 with declines in bulk trade in steel products, cement, and scrap metal. However, since China-PSR maritime trade in these commodities is negligible, we do not record visible changes in the X7Y causality link. The causality link’s strength decreases down to average in Russia and Denmark and weak in Sweden and Norway.
Trade in fuels, on the contrary, has been severely affected by the pandemic, while oil prices have turned out to be far more perceptible to the slowdown of economic activities compared to mineral prices [138,139,140]. Global oil demand has been depressed with restrictions on travel and transport and industrial activity cuts across the world [1]. China’s imports of coal declined due to weaker power demand and lower oil and gas prices that have reduced the competitiveness of coal power generation. Global demand for liquefied natural gas has also come under pressure during the first quarter of 2020, while simultaneously the UNCTAD [1] reported that liquefied natural gas and liquefied petroleum gas carriers and tankers continued to record increases in port calls. A surplus in fuel production has filled oil and gas inventories to such an extent that many vessels were used as floating storage [1]. The latter accords with strengthening the X8Y causality link revealed in Japan and South Korea, which established reserves of oil and gas amid lower prices [141,142]. For instance, in Pusan, South Korea, the SCI score lost only two points in Q2 2020 and then restored in Q3 2020 amid the increase in port and terminal utilization due to a rise in demand for storage capacities.
This trend is clearly traced in the case of the relationship between maritime connectivity and prices of food and agricultural products. The causality links between Y and X9 and X10 become more assertive in 2020 compared to 2015–2019, with causalities flowing in both directions from prices to connectivity and backward. The most significant gains are observed in South Korea and Japan, the net importers of food products and agricultural raw materials. As reported by the UNCTAD [1], many shippers used advance yard storage in South Korea’s, Japan’s, and China’s ports not only for fuels, but consumer commodities, food products, and grains. They then started moving goods early in spring and summer 2020, in anticipation of a resumption in demand and future commodity price developments. Large transit hubs like Pusan, Shanghai, Qingdao, Gothenburg, and Hakata have even benefited from lockdowns when storage space at ports has been used in cases where transit shipping has been suspended. Many studies have demonstrated emerging threats to global food security [62,143] and tremendous disruptions in agricultural supply chains [144,145] due to the pandemic. Notwithstanding that Wang et al. [146] and Cao et al. [147] expect that the impacts of supply disruption would be short-lived, development of warehousing and storage capacities at ports along the PSR should be considered a fundamental issue to ensure the sufficiency of safety stocks and inventories. The improvement of port infrastructure connectivity, logistics performance [68], and diversification in maritime routes [1] will allow China and its counterparts to avoid localized disruptions, establish a multiple-location trade network in the High North, and enhance the resilience of supply chains globally.
5. Conclusions
The COVID-19 outbreak has caused unprecedented disruption to global supply chains. Lockdowns of people and businesses along with restrictions on transboundary mobility and transport have resulted in a significant loss in international trade, much of which has manifested itself in the maritime sector. Assessing the pandemic’s influence on maritime connectivity entails a great deal of uncertainty due to a variety of public health, economic, social, logistics, political, and other factors that take on new significance. This is why segmentation of maritime trade landscape and modeling causality links between maritime connectivity and smaller arrays of contributing factors could become viable analysis options.
In the case of the China-PSR trade corridor, we attempted to investigate how different maritime connectivity parameters have been affected in January–September 2020 compared to the respective periods in 2015–2019. The study was performed at two levels in eight countries and thirty-five ports. The changes in the SCI (national level) and the PSCI (port level) were studied against ten independent variables, including the number of COVID-19 cases and deaths, trade volumes with China and the rest of the world, and price indexes of major categories of products transported via the NSR as the major throughway in the Arctic (minerals, fuels, and food and agricultural products). The consecutive application of the ADF and the PP tests, the ARDL method, the FMOLS and the DOLS robustness checks, and the TY causality test in 2015–2019 and 2020 allowed us to investigate differences in the short-run and long-run interactions and reveal the pandemic-related transformations in the causality directions between the variables. Major findings flowing from this study can be summarized as follows.
- The number of COVID-19 cases is found to exert a more decisive influence on the maritime connectivity in South Korea, Japan, and China, which experienced the outbreak earlier compared to Nordic countries and Russia, as well as introduced stricter containment measures. The bidirectional relationship between the number of cases and the SCI allows us to assume the contribution of maritime connectivity factors to the transboundary spread of the virus.
- The number of COVID-19 deaths has a negligible impact on the maritime connectivity that can be explained by the fact that governments have been introducing restrictions based on the number of new cases rather than deaths.
- Tight links between the value of trade with the world and the SCI index are revealed across all locations included in the study in the pre-pandemic period, but in 2020, the relationships become weaker amid the influence of non-economic factors.
- The China-PSR trade patterns significantly affect the maritime connectivity in all countries except Russia, where a bulk of trade with China is carried by rail through the land border. Similar to trade with the world, the influence of trade with China on maritime connectivity has weakened in the course of the pandemic.
- While the trade-SCI linkages have become less noticeable, the reverse causality flowing from the connectivity parameters to trade value has intensified with a reduced number of ship calls at ports, quarantine requirements to vessels and crew, and other virus containment measures applied to shipping services.
- Bigger hubs have been able to rebound sooner in their PSCI scores, rising in demand for storage capacity during shipping suspension, while smaller ports continue experiencing depressing effects of restrictions to transit shipping even in the third quarter of 2020. Therefore, we can assume that in times of sudden disruptions in logistics chains, ports with scarcer connections suffer more compared to diversified hubs. However, that depends on how the market situation matches the specialization of a particular port. For instance, in most of the NSR ports, the PSCI has not been much affected due to their narrow specialization on outbound freights (minerals and fuels, for which trade has declined to a lesser degree compared to manufacture and consumer products).
- Prices have exerted divergent influence on maritime connectivity for exporters and importers. In net importers, the SCI score has been supported by more intensive imports amid falling global prices, while net exporters have experienced a negative influence of consumption slowdown on their maritime connectivity indexes.
It is tough to tell when exactly the pandemic will be curbed, restrictions on transboundary travels and transportation will be lifted, and the global economy will recover. Nevertheless, we see that the China-PSR trade pattern has a substantial potential in terms of the maritime connectivity between countries and ports and the reliance of counterparts on trade with each other. In the 2020 model, the calculation was made for a short array of data covering only three quarters of the year, but the COVID-19 pandemic will obviously have a lasting impact on freight shipping. With the updates of the data on the number of COVID-19 cases, market information, and dynamics of maritime trade between China, Russia, Northern Europe, and Asia, the estimations could become more precise. The adjustments of calculations along with the continuous monitoring of causal interactions between variables will equip stakeholders with insights about the status of maritime connectivity in the China-PSR trade, potential risks, and implications on trade and commerce.
Author Contributions
G.T. and V.E. designed the research framework; G.T. conceptualized the materials and methods; A.A. and M.K. performed the data collection; V.E., A.A., and M.K. analyzed the data; V.E. wrote the paper. All authors have read and agreed to the published version of the manuscript.
Funding
This research and the APC were funded by the National Social Sciences Fund of China (grant no. 18BGJ004).
Data Availability Statement
The data presented in this study are available on request from the corresponding author.
Conflicts of Interest
The authors declare no conflict of interest. The founding sponsor had no role in the design of the study; in the collection, analyses, or interpretation of data; in the writing of the manuscript, and in the decision to publish the results.
Appendix A
Table A1.
Shipping connectivity and Port shipping connectivity indexes, 2015–2019 and 2020.
| Countries/Ports | 2015–2019, Average | 2020 | ||||
|---|---|---|---|---|---|---|
| January–March | April–June | July–September | January–March | April–June | July–September | |
| China | 144.25600 | 146.40976 | 147.93279 | 158.37064 | 156.22624 | 160.29146 |
| China: Dalian | 60.93514 | 61.86997 | 61.57053 | 62.50721 | 62.87025 | 62.95251 |
| China: Lianyungang | 33.31145 | 35.07333 | 34.77936 | 41.43848 | 46.19355 | 41.28514 |
| China: Qingdao | 86.18790 | 87.76649 | 90.39664 | 97.98079 | 95.50218 | 96.02562 |
| China: Qinhuangdao | 6.99576 | 7.58951 | 8.90611 | 8.11250 | 8.11250 | 8.11250 |
| China: Rizhao | 11.56061 | 11.86857 | 12.41058 | 14.76849 | 14.66254 | 13.20044 |
| China: Shanghai | 127.02952 | 129.25465 | 130.75849 | 136.85170 | 134.51027 | 138.91384 |
| China: Weihai | 2.41896 | 2.43323 | 2.05983 | 2.00949 | 2.00949 | 2.00949 |
| China: Yantai | 14.92416 | 14.10571 | 13.91985 | 13.04158 | 13.04158 | 12.51689 |
| Denmark | 45.09137 | 45.06750 | 45.65967 | 46.58867 | 46.23473 | 46.33711 |
| Denmark: Aarhus | 42.61198 | 42.66091 | 43.46878 | 44.91011 | 44.92916 | 44.83680 |
| Denmark: Copenhagen | 5.19696 | 4.73303 | 4.56877 | 4.33206 | 4.52781 | 4.72332 |
| Denmark, Greenland: Nuuk | 2.00112 | 2.00106 | 2.01526 | 2.02933 | 2.02933 | 5.08021 |
| Iceland | 5.31360 | 5.29465 | 5.31737 | 6.13933 | 6.01947 | 6.96187 |
| Iceland: Reydharfjordur | 3.79390 | 3.66378 | 3.91174 | 3.82918 | 4.62143 | 4.62143 |
| Iceland: Reykjavik | 5.20064 | 5.21542 | 5.17170 | 5.80252 | 5.53034 | 6.47786 |
| Japan | 75.34626 | 72.88415 | 71.77790 | 78.78389 | 88.64641 | 88.70137 |
| Japan: Akita | 3.34431 | 3.32231 | 3.67081 | 3.81099 | 4.02925 | 4.46471 |
| Japan: Hakata | 19.33510 | 19.04703 | 19.40562 | 18.41141 | 17.49040 | 17.45937 |
| Japan: Kitakyushu | 3.60891 | 3.94439 | 3.84279 | 7.40050 | 5.79934 | 3.64653 |
| Japan: Niigata | 5.75781 | 5.66677 | 5.77444 | 5.79424 | 5.60332 | 5.61266 |
| Norway | 9.71469 | 9.86324 | 10.22606 | 10.63827 | 9.63687 | 10.16871 |
| Norway: Bergen | 5.04260 | 5.16227 | 5.21057 | 5.87044 | 4.87413 | 5.05370 |
| Norway: Hammerfest | 1.57109 | 1.57109 | 1.57109 | 1.51746 | 1.17813 | 1.17813 |
| Norway: Stavanger | 2.32561 | 2.31488 | 2.29814 | 2.55296 | 2.55296 | 3.07447 |
| Norway: Tromso | 1.96436 | 1.96436 | 1.96436 | 1.91074 | 1.17813 | 1.17813 |
| Norway: Trondheim | 1.75531 | 1.79821 | 1.79821 | 1.17973 | 1.17813 | 2.06056 |
| Russia | 46.07389 | 43.19898 | 42.36271 | 35.98139 | 33.90037 | 33.46525 |
| Russia: Anadyr | 0.96594 | 0.96594 | 0.96633 | 0.73057 | 0.73056 | 0.73054 |
| Russia: Arkhangelsk | 0.56784 | 0.55588 | 0.55588 | 0.55586 | 0.55583 | 0.55580 |
| Russia: Dudinka | 1.63985 | 1.63982 | 1.63979 | 1.63980 | 1.63982 | 1.62975 |
| Russia: Murmansk | 3.17882 | 3.18298 | 3.17740 | 3.16982 | 3.17005 | 3.17249 |
| Russia: Petropavlovsk | 2.13561 | 2.14458 | 2.07056 | 1.78557 | 1.78504 | 1.78592 |
| Russia: Pevek | 1.13678 | 1.13679 | 1.13672 | 1.13668 | 1.13670 | 1.13674 |
| Russia: Sabetta | 0.49093 | 0.50922 | 0.50593 | 0.51891 | 0.50478 | 0.51293 |
| Russia: Vladivostok | 16.14067 | 14.07223 | 14.00720 | 13.93689 | 13.45200 | 13.78345 |
| South Korea | 98.44056 | 99.90325 | 101.46473 | 108.39640 | 106.95343 | 107.55277 |
| South Korea: Gwangyang | 60.50077 | 60.79394 | 61.83644 | 66.80079 | 65.30716 | 60.35533 |
| South Korea: Pusan | 108.68804 | 110.22309 | 111.70417 | 118.73122 | 116.39475 | 117.09869 |
| South Korea: Ulsan | 18.87085 | 18.95059 | 19.09108 | 23.73320 | 20.69843 | 19.27688 |
| Sweden | 46.62914 | 46.01937 | 47.93833 | 48.59986 | 47.64887 | 48.41985 |
| Sweden: Gothenburg | 41.34901 | 40.80150 | 42.72292 | 42.28518 | 42.34241 | 41.79951 |
| Sweden: Halmstad | 2.93740 | 3.58594 | 3.27535 | 3.16433 | 1.99846 | 2.72541 |
Source: Authors’ development based on [79].
Appendix B
Table A2.
ADF and PP results, countries, 2015–2019.
| Country | Parameter | Y | X3 | X4 | X5 | X6 | X7 | X8 | X9 | X10 |
|---|---|---|---|---|---|---|---|---|---|---|
| China | ADF level | −1.46 ** | −4.18 ** | −2.43 *** | −0.28 ** | −1.36 * | −2.40 ** | −3.12 *** | −0.97 * | −2.57 *** |
| ADF first difference | −3.17 ** | −2.64 *** | −3.29 ** | −1.27 * | −3.18 | −1.97 *** | −1.80 ** | −1.23 * | −3.60 ** | |
| PP level | −4.20 * | −3.80 ** | −2.15 *** | −0.94 ** | −1.15 * | −2.86 ** | −4.23 *** | −1.74 | −2.08 *** | |
| PP first difference | −3.88 ** | −2.95 *** | −3.50 ** | −2.23 * | −2.94 | −1.05 *** | −2.95 ** | −0.60 ** | −3.15 ** | |
| Denmark | ADF level | −2.47 | −3.43 * | −1.26 * | −1.48 *** | −0.62 ** | −3.48 *** | −0.19 * | −2.15 * | −2.42 * |
| ADF first difference | −1.63 * | −2.19 ** | −0.80 ** | −2.03 ** | −1.23 * | −4.62 *** | −1.28 | −1.96 * | −1.69 ** | |
| PP level | −1.94 ** | −3.51 ** | −1.38 * | −1.93 *** | −0.80 ** | −3.23 ** | −0.56 * | −0.48 ** | −2.81 * | |
| PP first difference | −1.05 * | −2.58 * | −0.57 ** | −2.66 ** | −1.75 * | −4.19 *** | −1.44 | −1.57 * | −1.85 ** | |
| Iceland | ADF level | −0.56 *** | −1.33 ** | −2.00 *** | −0.49 *** | −0.55 *** | −2.48 *** | −0.75 * | −0.73 * | −1.33 |
| ADF first difference | −1.18 ** | −0.87 *** | −1.69 ** | −1.11 ** | −2.17 * | −3.70 *** | −2.52 | −0.95 * | −2.02 * | |
| PP level | −0.97 *** | −2.46 ** | −2.93 *** | −0.85 *** | −1.36 ** | −2.57 ** | −0.48 * | −0.22 * | −1.94 | |
| PP first difference | −1.42 ** | −1.39 ** | −1.02 ** | −2.34 ** | −2.19 * | −4.64 ** | −1.76 | −1.08 | −0.76 ** | |
| Japan | ADF level | −2.14 * | −4.40 ** | −3.42 ** | −2.30 *** | −3.03 ** | −0.86 * | −0.41 ** | −2.16 ** | −0.30 |
| ADF first difference | −2.71 ** | −3.81 *** | −2.91 *** | −4.18 ** | −2.48 * | −1.43 ** | −1.03 * | −1.94 * | −1.00 * | |
| PP level | −1.85 ** | −4.28 ** | −1.48 ** | −2.45 *** | −2.22 ** | −0.90 * | −0.69 ** | −2.37 ** | −0.95 | |
| PP first difference | −2.06 ** | −2.65 *** | −2.05 *** | −3.13 ** | −1.40 * | −2.16 | −2.17 | −0.66 *** | −1.38 * | |
| Norway | ADF level | −0.97 | −1.94 * | −0.73 ** | −1.76 ** | −1.14 | −3.25 *** | −4.90 *** | −2.05 *** | −2.73 ** |
| ADF first difference | −1.23 | −3.12 ** | −1.34 * | −2.39 *** | −2.37 * | −2.98 ** | −2.38 ** | −4.78 *** | −1.49 *** | |
| PP level | −1.01 * | −2.83 * | −0.49 *** | −1.97 ** | −1.28 * | −4.42 *** | −3.45 *** | −2.64 *** | −2.04 ** | |
| PP first difference | −1.30 * | −1.47 ** | −1.05 * | −3.00 *** | −1.63 ** | −3.11 ** | −2.06 ** | −3.19 *** | −1.12 *** | |
| Russia | ADF level | −3.58 ** | −2.20 *** | −3.10 *** | −4.01 * | −2.35 * | −4.66 *** | −4.77 *** | −2.57 ** | −3.46 ** |
| ADF first difference | −2.74 ** | −1.95 ** | −2.53 ** | −3.22 ** | −1.46 ** | −3.85 *** | −3.83 *** | −3.33 * | −2.98 ** | |
| PP level | −3.99 ** | −2.41 *** | −4.24 *** | −4.29 * | −2.97 * | −3.79 *** | −4.50 *** | −2.41 ** | −2.35 ** | |
| PP first difference | −1.16 * | −1.53 ** | −2.17 ** | −3.06 ** | −1.09 ** | −4.52 ** | −4.91 *** | −2.84 *** | −3.81 *** | |
| South Korea | ADF level | −2.86 *** | −4.46 * | −2.03 * | −1.21 *** | −3.14 * | −0.78 * | −1.25 * | −4.12 * | −1.06 *** |
| ADF first difference | −3.42 *** | −3.82 * | −1.75 ** | −2.35 ** | −2.22 ** | −0.97 ** | −2.42 ** | −3.90 * | −2.93 ** | |
| PP level | −3.11 ** | −2.17 | −2.84 * | −1.94 *** | −3.85 * | −1.49 | −1.38 * | −3.65 ** | −1.17 *** | |
| PP first difference | −2.95 *** | −3.04 | −1.15 ** | −2.70 ** | −2.37 ** | −1.05 | −0.57 *** | −4.08 * | −2.36 ** | |
| Sweden | ADF level | −0.87 *** | −2.43 ** | −0.99 ** | −1.27 | −1.79 *** | −2.30 ** | −1.12 ** | −1.40 *** | −1.68 * |
| ADF first difference | −1.59 *** | −1.95 ** | −2.53 * | −3.15 | −0.96 ** | −3.21 ** | −2.09 * | −0.73 *** | −2.00 ** | |
| PP level | −1.28 ** | −1.37 *** | −1.74 ** | −0.44 * | −1.45 *** | −2.58 * | −1.50 ** | −1.99 ** | −1.55 * | |
| PP first difference | −0.94 ** | −2.18 *** | −2.06 * | −2.96 | −2.13 ** | −3.42 | −2.86 * | −1.54 ** | −2.42 ** |
Note: *, **, *** = significance at 10% level, 5% level, and 1% level, respectively. Source: Authors’ calculation.
Table A3.
ADF and PP results, countries, 2020.
| Country | Parameter | Y | X1 | X2 | X3 | X4 | X5 | X6 | X7 | X8 | X9 | X10 |
|---|---|---|---|---|---|---|---|---|---|---|---|---|
| China | ADF level | −1.20 ** | −1.54 *** | −1.05 *** | −3.14 ** | −2.95 ** | −0.47 ** | −1.55 * | −2.14 ** | −3.43 ** | −1.12 ** | −2.93 *** |
| ADF first difference | −2.78 * | −1.09 ** | −1.36 ** | −3.03 *** | −2.03 ** | −1.51 * | −4.20 | −2.01 *** | −2.74 *** | −1.48 * | −3.00 ** | |
| PP level | −3.35 * | −2.42 ** | −2.28 *** | −2.50 *** | −1.90 *** | −1.90 ** | −1.26 * | −1.70 *** | −3.05 ** | −1.07 | −2.21 *** | |
| PP first difference | −2.36 ** | −1.76 ** | −1.25 ** | −3.27 ** | −2.86 ** | −2.02 * | −2.81 | −1.97 ** | −3.19 ** | −0.83 ** | −3.44 ** | |
| Denmark | ADF level | −2.12 | −0.98 * | −1.37 * | −2.98 ** | −1.12 * | −1.37 *** | −0.78 ** | −3.18 *** | −0.88 * | −2.36 * | −2.58 * |
| ADF first difference | −1.28 * | −1.41 * | −1.29 | −1.43 ** | −0.73 ** | −2.34 ** | −1.05 * | −4.04 ** | −1.51 | −1.45 * | −1.92 ** | |
| PP level | −1.51 ** | −0.72 * | −1.94 * | −2.04 ** | −1.84 * | −1.85 *** | −0.92 ** | −3.22 ** | −0.62 * | −0.55 *** | −2.04 * | |
| PP first difference | −1.23 * | −1.15 | −0.38 ** | −3.19 * | −0.91 ** | −2.04 ** | −1.64 * | −4.85 ** | −1.75 | −1.76 * | −1.71 ** | |
| Iceland | ADF level | −1.17 ** | −0.57 | −1.44 * | −1.95 ** | −1.66 ** | −0.99 *** | −0.88 *** | −2.13 *** | −0.93 * | −0.94 * | −1.03 |
| ADF first difference | −1.32 ** | −2.28 | −0.80 ** | −1.01 ** | −1.09 ** | −1.26 ** | −2.53 * | −3.54 *** | −2.71 * | −0.82 * | −2.35 * | |
| PP level | −1.58 ** | −0.46 * | −0.95 | −2.30 ** | −2.17 *** | −1.80 ** | −1.70 ** | −2.02 ** | −0.80 * | −0.35 * | −1.74 | |
| PP first difference | −1.67 ** | −1.30 | −0.46 * | −1.26 ** | −1.40 ** | −2.25 ** | −2.01 * | −4.36 ** | −1.44 | −1.14 * | −0.65 ** | |
| Japan | ADF level | −2.40 ** | −2.43 ** | −1.82 ** | −3.72 ** | −3.19 ** | −2.00 *** | −3.34 ** | −1.18 * | −0.39 ** | −2.42 ** | −0.86 |
| ADF first difference | −2.05 ** | −3.58 ** | −2.13 * | −3.29 *** | −2.22 *** | −4.44 ** | −2.27 * | −1.27 ** | −1.27 * | −1.83 * | −1.12 * | |
| PP level | −1.62 ** | −2.94 *** | −1.50 ** | −2.14 *** | −1.00 ** | −2.51 *** | −2.18 ** | −1.22 * | −0.95 ** | −2.04 ** | −0.90 | |
| PP first difference | −1.98 ** | −1.56 *** | −2.74 * | −3.00 ** | −1.49 *** | −3.01 ** | −2.00 * | −2.39 | −1.91 * | −0.97 *** | −1.27 * | |
| Norway | ADF level | −0.85 | −1.16 * | −0.66 ** | −2.23 * | −0.86 ** | −1.86 ** | −1.55 | −3.00 *** | −4.82 *** | −1.16 *** | −2.58 ** |
| ADF first difference | −1.51 | −2.05 | −1.37 * | −2.95 ** | −1.28 * | −2.27 *** | −2.36 * | −2.54 ** | −2.83 ** | −4.72 ** | −2.17 ** | |
| PP level | −1.23 * | −1.77 * | −1.01 ** | −2.41 * | −0.74 *** | −1.73 ** | −1.39 * | −3.08 *** | −3.27 ** | −3.30 *** | −1.84 ** | |
| PP first difference | −1.47 * | −2.22 | −2.00 | −1.09 ** | −1.37 * | −2.92 *** | −1.05 ** | −2.47 ** | −2.65 ** | −3.64 *** | −1.75 *** | |
| Russia | ADF level | −2.99 ** | −2.58 ** | −2.45 ** | −2.43 ** | −2.83 *** | −4.19 * | −2.74 * | −4.25 *** | −4.18 *** | −2.09 ** | −3.03 ** |
| ADF first difference | −2.70 ** | −3.14 ** | −3.58 ** | −1.55 ** | −2.06 ** | −3.40 ** | −1.16 ** | −3.13 *** | −3.04 *** | −3.48 * | −2.64 ** | |
| PP level | −3.58 ** | −2.35 * | −2.10 * | −1.86 *** | −3.90 *** | −4.04 * | −2.38 * | −3.29 ** | −4.29 *** | −2.26 ** | −2.22 ** | |
| PP first difference | −1.03 * | −2.73 ** | −3.34 ** | −2.01 ** | −2.44 ** | −3.29 ** | −1.25 ** | −4.21 ** | −4.37 *** | −2.55 *** | −3.75 *** | |
| South Korea | ADF level | −2.75 *** | −4.40 ** | −4.22 ** | −4.17 * | −1.92 * | −1.58 *** | −2.59 ** | −0.80 * | −1.46 * | −4.00 * | −1.39 *** |
| ADF first difference | −3.14 *** | −3.27 *** | −4.71 ** | −3.33 * | −2.85 ** | −2.25 ** | −2.30 ** | −0.75 ** | −1.95 ** | −3.59 * | −2.18 ** | |
| PP level | −2.89 ** | −2.05 *** | −3.18 *** | −2.80 | −2.25 * | −1.71 *** | −3.67 * | −1.06 | −1.57 ** | −3.47 ** | −1.42 *** | |
| PP first difference | −2.43 ** | −3.49 ** | −3.62 ** | −2.74 * | −1.04 ** | −2.53 ** | −2.41 ** | −1.77 | −0.86 *** | −4.23 * | −2.30 ** | |
| Sweden | ADF level | −1.32 ** | −1.98 | −2.04 * | −2.05 ** | −0.62 ** | −1.34 | −1.66 *** | −1.43 ** | −1.00 ** | −1.74 *** | −1.51 * |
| ADF first difference | −1.13 *** | −0.46 * | −1.28 * | −1.48 ** | −2.37 * | −3.00 * | −1.23 ** | −2.59 ** | −1.34 * | −0.88 *** | −1.45 *** | |
| PP level | −1.40 ** | −1.13 | −0.55 ** | −1.51 *** | −1.50 ** | −0.59 * | −1.50 *** | −1.40 ** | −1.82 ** | −1.51 ** | −1.68 * | |
| PP first difference | −1.25 ** | −0.80 * | −1.11 * | −2.16 *** | −1.33 * | −2.85 | −2.28 ** | −2.88 | −2.40 * | −1.65 ** | −2.11 ** |
Note: *, **, *** = significance at 10% level, 5% level, and 1% level, respectively. Source: Authors’ calculation.
Appendix C
Table A4.
ARDL short-run estimates, ports, 2015–2019.
| Port | Parameter | ∆X3 | ∆X4 | ∆X5 | ∆X6 | ∆X7 | ∆X8 | ∆X9 | ∆X10 | ECM |
|---|---|---|---|---|---|---|---|---|---|---|
| China: Dalian | Coefficient | 0.0994 | 0.2093 | 0.2187 | 0.2045 | 0.0594 | −0.1238 | −0.0457 | −0.1309 | 0.1566 |
| t-stat | 1.0298 | −3.1550 | −1.4885 | −2.0882 | 4.6982 | −2.0997 | 1.4409 | 2.1170 | 2.0297 | |
| Prob | 0.0827 *** | 0.4146 *** | 0.7209 ** | 0.5009 ** | 0.1597 * | 0.5505 ** | 0.1287 *** | 0.4691 *** | 0.1502 ** | |
| China: Lianyungang | Coefficient | 0.1725 | 0.2007 | 0.1044 | 0.1236 | 0.1809 | −0.0562 | 0.0662 | −0.0987 | 0.1419 |
| t-stat | −2.6009 | 3.4482 | −2.0841 | −2.9503 | −3.8751 | 1.7793 | 2.4091 | −3.6092 | −2.5446 | |
| Prob | 0.1388 ** | 0.3091 ** | 0.0529 * | 0.0987 * | 0.3350 * | 0.6720 * | 0.6348 ** | 0.0505 ** | 0.4091 * | |
| China: Qingdao | Coefficient | 0.2476 | 0.2453 | 0.3112 | 0.3598 | 0.0983 | −0.0186 | −0.3007 | −0.1559 | −0.3008 |
| t-stat | 1.5098 | 2.4458 | −4.2678 | −1.9942 | 2.0759 | 1.5631 | 3.6298 | −1.5774 | 1.7832 | |
| Prob | 0.4033 ** | 0.7346 ** | 0.0039 *** | 0.9387 *** | 0.3391 * | 0.8599 ** | 0.1127 *** | 0.2386 *** | 0.2557 ** | |
| China: Qinhuangdao | Coefficient | 0.2092 | 0.1900 | 0.1251 | 0.1409 | 0.0985 | 0.0134 | 0.0263 | −0.0112 | 0.0103 |
| t-stat | 2.6071 | 3.1462 | 1.0093 | 2.0000 | −2.5983 | 1.6673 | 2.6995 | 5.0064 | 3.6084 | |
| Prob | 0.2395 ** | 0.5884 ** | 0.0076 * | 0.7503 * | 0.4774 * | 0.5887 * | 0.2409 ** | 0.3081 ** | 0.1536 * | |
| China: Rizhao | Coefficient | 0.3993 | 0.3588 | 0.1092 | 0.1725 | 0.0070 | 0.1490 | 0.0135 | 0.0146 | 0.1597 |
| t-stat | 4.0075 | 2.4902 | −2.5557 | −1.4647 | 3.5371 | −2.5556 | −2.6734 | 2.7795 | 1.2285 | |
| Prob | 0.5982 ** | 0.5395 ** | 0.4998 * | 0.9098 * | 0.5893 * | 0.6729 * | 0.8995 * | 0.9806 ** | 0.2456 * | |
| China: Shanghai | Coefficient | 0.7300 | 0.7936 | 0.5781 | 0.6045 | 0.1400 | 0.2304 | 0.2289 | −0.2037 | −0.1877 |
| t-stat | 5.1486 | −1.2980 | 1.0008 | 2.6551 | −3.7735 | 2.6780 | −1.3485 | 2.1285 | −3.5832 | |
| Prob | 0.4995 *** | 0.0075 *** | 0.4790 *** | 0.8840 *** | 0.3809 ** | 0.7713 ** | 0.6737 *** | 0.7900 *** | 0.1709 *** | |
| China: Weihai | Coefficient | 0.3215 | 0.4098 | 0.1452 | 0.1793 | 0.0673 | 0.1694 | 0.1891 | 0.0476 | 0.1558 |
| t-stat | 4.6617 | 1.8403 | −4.7937 | −2.0041 | 3.7098 | 2.4843 | 2.1594 | −1.5285 | 3.3790 | |
| Prob | 0.4592 ** | 0.3704 ** | 0.1364 ** | 0.2055 ** | 0.7149 * | 0.7091 * | 0.0005 ** | 0.9287 ** | 0.4421 * | |
| China: Yantai | Coefficient | 0.2498 | 0.2591 | 0.1990 | 0.2286 | 0.1303 | 0.2002 | 0.0309 | −0.1098 | 0.0547 |
| t-stat | 3.6895 | −2.8390 | 2.5558 | 1.8930 | −2.5681 | 3.4673 | 2.1587 | −1.5556 | 2.0965 | |
| Prob | 0.0982 *** | 0.3498 *** | 0.4091 ** | 0.0089 ** | 0.3899 ** | 0.5508 ** | 0.3985 ** | 0.2018 ** | 0.2490 ** | |
| Denmark: Aarhus | Coefficient | 0.1506 | 0.1183 | 0.0552 | 0.0344 | 0.0710 | −0.0305 | 0.1335 | 0.0784 | −0.1257 |
| t-stat | 3.1377 | 2.2407 | 1.1147 | −2.0728 | 1.2745 | −3.4122 | 1.1784 | 2.1995 | 1.1346 | |
| Prob | 0.0793 *** | 0.9874 *** | 0.0005 * | 0.1482 * | 0.2993 * | 0.4355 * | 0.3985 ** | 0.3993 * | 0.2066 * | |
| Denmark: Copenhagen | Coefficient | 0.1285 | 0.1596 | 0.0134 | 0.0637 | 0.0226 | 0.0490 | 0.0621 | 0.1006 | −0.0557 |
| t-stat | −1.2759 | 2.8837 | −2.2861 | −4.0053 | 2.6298 | 4.8794 | 3.1784 | −1.5975 | −1.0086 | |
| Prob | 0.4102 *** | 0.5884 *** | 0.6390 * | 0.0394 * | 0.5094 * | 0.2609 * | 0.7985 * | 0.8585 * | 0.7723 * | |
| Denmark, Greenland: Nuuk | Coefficient | 0.7512 | 0.7056 | 0.1258 | 0.0115 | 0.5035 | −0.1223 | −0.0556 | −0.0144 | 0.1609 |
| t-stat | 3.5008 | 4.2224 | −1.0677 | 2.3379 | −1.7772 | 2.4000 | −1.4700 | −1.1863 | 2.2866 | |
| Prob | 0.5954 *** | 0.3983 *** | 0.2851 * | 0.2807 * | 0.3683 ** | 0.3875 * | 0.3653 * | 0.0005 * | 0.4124 * | |
| Iceland: Reydharfjordur | Coefficient | 0.4872 | 0.4085 | 0.2338 | 0.2561 | 0.5506 | −0.0206 | 0.0725 | 0.0236 | 0.0446 |
| t-stat | 3.1676 | 2.1674 | −1.0365 | 2.5974 | −1.4287 | 2.0565 | 2.1277 | 1.6905 | 1.3378 | |
| Prob | 0.2805 *** | 0.0875 *** | 0.2870 * | 0.3885 * | 0.1209 *** | 0.1274 * | 0.1443 * | 0.2553 * | 0.2785 ** | |
| Iceland: Reykjavik | Coefficient | 0.6609 | 0.6077 | 0.4924 | 0.2567 | 0.1558 | −0.0258 | 0.1408 | 0.0784 | 0.1309 |
| t-stat | 1.8642 | −2.4365 | −2.7385 | 2.3798 | −2.4097 | 1.4596 | 2.2895 | −2.0055 | 2.0554 | |
| Prob | 0.4900 *** | 0.5836 *** | 0.2294 ** | 0.5275 ** | 0.0050 ** | 0.4927 * | 0.2093 ** | 0.7053 ** | 0.2378 ** | |
| Japan: Akita | Coefficient | 0.5064 | 0.6235 | 0.2346 | 0.1999 | 0.1667 | 0.0238 | −0.0606 | −0.0437 | −0.1345 |
| t-stat | 2.0832 | 1.8509 | −3.1459 | −2.4875 | 2.2245 | −1.2977 | 2.5498 | 1.3865 | −1.6299 | |
| Prob | 0.0385 ** | 0.1274 ** | 0.3240 ** | 0.5083 ** | 0.0000 * | 0.2769 * | 0.0627 * | 0.2790 * | 0.4904 ** | |
| Japan: Hakata | Coefficient | 0.4226 | 0.4800 | 0.1665 | 0.2664 | 0.3239 | 0.0304 | 0.0524 | 0.0654 | 0.1297 |
| t-stat | 1.3094 | 2.5821 | 1.9974 | 2.5093 | 1.6008 | 4.6831 | 2.5563 | −2.6003 | 1.5556 | |
| Prob | 0.1317 ** | 0.2650 ** | 0.6339 ** | 0.3837 ** | 0.0236 * | 0.5583 * | 0.2741 * | 0.5995 * | 0.2804 ** | |
| Japan: Kitakyushu | Coefficient | 0.3735 | 0.4407 | 0.1509 | 0.1880 | 0.2013 | 0.1579 | 0.0337 | 0.0597 | −0.2579 |
| t-stat | 1.6220 | 2.6883 | −2.0096 | −2.4985 | 4.1794 | −1.6282 | 2.0084 | 1.4083 | 2.5458 | |
| Prob | 0.4087 ** | 0.0005 ** | 0.5584 ** | 0.3077 ** | 0.6231 ** | 0.4595 * | 0.2863 * | 0.2129 * | 0.4267 * | |
| Japan: Niigata | Coefficient | 0.2336 | 0.2551 | 0.2335 | 0.3134 | 0.0349 | 0.1543 | −0.1245 | −0.0450 | 0.0605 |
| t-stat | −2.5543 | −2.9835 | 3.9598 | 2.0075 | 1.8444 | 2.1886 | 1.3062 | 3.1582 | 1.3490 | |
| Prob | 0.0985 *** | 0.2987 *** | 0.7401 *** | 0.4982 *** | 0.3986 *** | 0.2583 * | 0.2750 ** | 0.2086 ** | 0.4558 ** | |
| Norway: Bergen | Coefficient | 0.2308 | 0.1347 | 0.2134 | 0.2086 | 0.1674 | 0.2996 | 0.1124 | 0.2057 | 0.4007 |
| t-stat | 2.1894 | −1.9845 | −2.6755 | −1.1455 | −2.6281 | 1.3285 | −1.8655 | −2.3348 | −3.3285 | |
| Prob | 0.1307 ** | 0.4808 ** | 0.5897 * | 0.8743 * | 0.3309 ** | 0.5281 ** | 0.2349 ** | 0.0293 ** | 0.5380 ** | |
| Norway: Hammerfest | Coefficient | 0.0565 | 0.0655 | 0.0775 | 0.0776 | 0.2496 | 0.2457 | 0.0985 | 0.3615 | 0.2236 |
| t-stat | 2.0296 | 3.2941 | −3.1709 | −2.3589 | 2.5414 | −2.3987 | −2.1294 | 3.0006 | −2.1137 | |
| Prob | 0.5991 ** | 0.9836 ** | 0.4386 * | 0.3034 * | 0.6083 * | 0.4446 ** | 0.0013 ** | 0.1257 ** | 0.2768 * | |
| Norway: Stavanger | Coefficient | 0.2783 | 0.2997 | 0.0688 | 0.0676 | 0.2379 | 0.2008 | 0.3872 | 0.2027 | 0.3566 |
| t-stat | 5.0046 | 2.0953 | 4.1763 | 1.5583 | −2.5245 | 1.5125 | 2.3409 | 1.1498 | 1.7495 | |
| Prob | 0.2098 *** | 0.4827 *** | 0.5266 ** | 0.4127 ** | 0.0488 ** | 0.2309 ** | 0.3874 ** | 0.1874 ** | 0.5574 ** | |
| Norway: Tromso | Coefficient | 0.2449 | 0.2690 | 0.1295 | 0.0985 | 0.1794 | 0.0738 | 0.0228 | 0.0500 | 0.2323 |
| t-stat | 2.6928 | −4.9007 | 1.5693 | 2.2187 | 1.8609 | −1.7995 | 3.1264 | 1.2046 | −2.8476 | |
| Prob | 0.3582 *** | 0.0006 *** | 0.3475 * | 0.3126 * | 0.3453 ** | 0.6297 * | 0.0996 * | 0.4529 * | 0.2001 ** | |
| Norway: Trondheim | Coefficient | 0.1308 | 0.2564 | 0.3290 | 0.2997 | 0.0775 | 0.1555 | 0.4003 | 0.1654 | 0.3829 |
| t-stat | −1.9387 | 1.5981 | 2.1138 | 1.3854 | −2.5498 | 3.6694 | 2.6595 | −3.5521 | 2.5444 | |
| Prob | 0.2006 *** | 0.4800 *** | 0.3685 ** | 0.1237 ** | 0.2846 ** | 0.3712 ** | 0.0054 ** | 0.4670 ** | 0.0657 *** | |
| Russia: Anadyr | Coefficient | 0.0745 | 0.0011 | 0.0054 | 0.0060 | 0.0664 | −0.0074 | −0.0011 | 0.0014 | −0.0565 |
| t-stat | −1.0043 | −2.8749 | −1.4976 | −2.2381 | 1.7539 | −2.0386 | 2.1554 | 3.4299 | 2.0657 | |
| Prob | 0.0428 * | 0.6066 * | 0.3453 * | 0.5199 * | 0.5665 ** | 0.2525 * | 0.6877 * | 0.5434 * | 0.6225 * | |
| Russia: Arkhangelsk | Coefficient | 0.0314 | 0.0258 | 0.0069 | 0.0234 | 0.1221 | −0.0066 | 0.2023 | 0.1285 | 0.0778 |
| t-stat | −2.5638 | −2.3987 | −2.9744 | 3.0445 | 2.8867 | 2.3854 | −1.6684 | −2.3254 | 2.0444 | |
| Prob | 0.5174 ** | 0.2216 ** | 0.0032 * | 0.6256 * | 0.4543 * | 0.2850 * | 0.0675 * | 0.6193 * | 0.3095 ** | |
| Russia: Dudinka | Coefficient | 0.0067 | 0.0011 | 0.0050 | 0.0013 | 0.1138 | 0.0157 | 0.0098 | 0.0069 | 0.0352 |
| t-stat | −3.1286 | 1.6598 | −2.4873 | −2.4736 | −1.4455 | 2.5180 | 1.5784 | 2.0575 | −1.5476 | |
| Prob | 0.0000 * | 0.4144 * | 0.3864 * | 0.5179 * | 0.0098 ** | 0.1442 * | 0.3591 * | 0.3443 * | 0.6564 * | |
| Russia: Murmansk | Coefficient | 0.1056 | 0.1316 | 0.0423 | 0.0122 | 0.1553 | 0.0205 | 0.1843 | 0.2114 | 0.2573 |
| t-stat | −2.5239 | −1.5830 | −1.6495 | 2.1540 | −2.2376 | −1.1222 | 2.1487 | −2.4986 | −2.0554 | |
| Prob | 0.6928 *** | 0.7455 *** | 0.2442 * | 0.0085 * | 0.4232 ** | 0.0000 ** | 0.6650 ** | 0.3000 ** | 0.1672 *** | |
| Russia: Petropavlovsk | Coefficient | 0.1392 | 0.1609 | 0.0219 | 0.0124 | 0.0664 | 0.0597 | 0.0045 | 0.0067 | 0.2012 |
| t-stat | −4.5667 | −2.1423 | 1.1113 | 2.5548 | −1.7459 | 2.6566 | 2.0027 | −2.5068 | 3.1478 | |
| Prob | 0.6400 * | 0.6998 * | 0.1854 * | 0.6512 * | 0.0051 ** | 0.2875 * | 0.1556 * | 0.4366 * | 0.5465 ** | |
| Russia: Pevek | Coefficient | 0.1614 | 0.0087 | 0.0107 | 0.0053 | 0.0234 | 0.0124 | 0.0064 | 0.0078 | 0.1504 |
| t-stat | 1.7958 | 1.3422 | 2.9876 | 1.4998 | −3.1343 | 2.6579 | −3.5538 | −1.4657 | −1.3227 | |
| Prob | 0.4123 * | 0.5673 * | 0.2333 * | 0.0413 * | 0.2265 ** | 0.4386 * | 0.2656 * | 0.5388 * | 0.5980 * | |
| Russia: Sabetta | Coefficient | 0.0501 | 0.0015 | 0.1254 | 0.0015 | 0.0076 | 0.2235 | 0.0012 | 0.0043 | 0.3670 |
| t-stat | 2.3472 | −2.3762 | 1.2775 | 2.5234 | 2.1121 | −4.2534 | −2.7754 | −3.0987 | 1.1231 | |
| Prob | 0.4653 ** | 0.6909 * | 0.5634 ** | 0.6498 * | 0.5398 * | 0.5767 ** | 0.4486 * | 0.6055 * | 0.3875 ** | |
| Russia: Vladivostok | Coefficient | 0.0638 | 0.2155 | 0.1552 | 0.2237 | 0.0423 | 0.0996 | 0.2667 | 0.2442 | 0.5234 |
| t-stat | 4.7754 | 2.0007 | −2.6578 | 3.3456 | −2.1364 | −2.3687 | 1.2355 | 1.0936 | 2.0669 | |
| Prob | 0.1906 *** | 0.3908 ** | 0.5234 *** | 0.3002 *** | 0.3172 * | 0.4522 ** | 0.2136 *** | 0.2573 *** | 0.4987 *** | |
| South Korea: Gwangyang | Coefficient | 0.4287 | 0.4065 | 0.3286 | 0.3314 | −0.0965 | −0.0940 | −0.0025 | −0.0074 | 0.4906 |
| t-stat | 2.5005 | 1.1749 | −2.0517 | −1.5000 | 3.9187 | −2.6053 | 1.8247 | −2.6819 | 2.4022 | |
| Prob | 0.9276 *** | 0.7378 ** | 0.4005 *** | 0.6249 *** | 0.0005 * | 0.1547 * | 0.1496 * | 0.2760 ** | 0.3795 ** | |
| South Korea: Pusan | Coefficient | 0.8340 | 0.8150 | 0.7349 | 0.6538 | −0.1396 | −0.1548 | −0.0102 | −0.0351 | 0.7007 |
| t-stat | −1.8733 | −2.1244 | −1.4380 | −2.5356 | 1.1487 | 2.5952 | −3.4783 | −1.4958 | −3.6541 | |
| Prob | 0.7612 *** | 0.6626 *** | 0.0095 *** | 0.0298 *** | 0.7395 ** | 0.3813 ** | 0.5849 ** | 0.0006 ** | 0.5328 *** | |
| South Korea: Ulsan | Coefficient | 0.6195 | 0.5892 | 0.5052 | 0.4872 | 0.0056 | −0.0865 | −0.0912 | −0.0873 | 0.5045 |
| t-stat | 4.0557 | 3.1505 | −1.9347 | −2.5360 | −3.9841 | −3.1260 | −2.0375 | −4.5941 | −1.3968 | |
| Prob | 0.3941 *** | 0.7984 *** | 0.0498 *** | 0.8375 *** | 0.1203 * | 0.4891 * | 0.2096 * | 0.7500 ** | 0.4093 ** | |
| Sweden: Gothenburg | Coefficient | 0.6827 | 0.7023 | 0.1854 | 0.1733 | 0.1660 | −0.0097 | 0.0150 | 0.0964 | −0.3264 |
| t-stat | −2.1793 | −1.0065 | −2.0057 | −3.4281 | 2.5377 | −1.3761 | 2.5891 | −1.3681 | −2.7813 | |
| Prob | 0.5482 *** | 0.6398 *** | 0.2941 ** | 0.0054 ** | 0.2198 ** | 0.3405 * | 0.0614 * | 0.2592 * | 0.8867 *** | |
| Sweden: Halmstad | Coefficient | 0.3864 | 0.4290 | 0.1519 | 0.1625 | 0.0634 | −0.0143 | 0.0523 | 0.0775 | 0.0810 |
| t-stat | −1.0709 | −3.5836 | −3.4015 | −1.3096 | 3.8765 | 2.0567 | 3.4175 | 1.8131 | −1.3986 | |
| Prob | 0.5298 *** | 0.4211 *** | 0.2366 ** | 0.4231 ** | 0.3891 ** | 0.1831 * | 0.0022 * | 0.4973 * | 0.5715 ** |
Note: *, **, *** = significance at 10% level, 5% level, and 1% level, respectively. Source: Authors’ calculation.
Table A5.
ARDL short-run estimates, ports, 2020.
| Port | Parameter | ∆X1 | ∆X2 | ∆X3 | ∆X4 | ∆X5 | ∆X6 | ∆X7 | ∆X8 | ∆X9 | ∆X10 | ECM |
|---|---|---|---|---|---|---|---|---|---|---|---|---|
| China: Dalian | Coefficient | −0.0108 | −0.0182 | 0.1113 | 0.1290 | 0.1528 | 0.1670 | 0.0342 | −0.1061 | −0.0100 | −0.1544 | 0.1305 |
| t-stat | 2.0817 | 3.1175 | 2.1865 | −4.4598 | 2.0483 | −3.2391 | 2.5378 | 1.3728 | 2.3597 | 3.0580 | 2.5988 | |
| Prob | 0.1982 ** | 0.0255 ** | 0.3034 ** | 0.3600 ** | 0.3015 * | 0.0045 ** | 0.3066 * | 0.3762 ** | 0.0198 *** | 0.1853 *** | 0.1264 ** | |
| China: Lianyungang | Coefficient | −0.0271 | −0.0390 | 0.0298 | 0.0357 | 0.0466 | 0.0322 | 0.1485 | −0.0394 | 0.0514 | −0.1098 | 0.1692 |
| t-stat | −3.4918 | −2.8776 | 3.1765 | 2.6873 | −1.7671 | −2.5094 | −2.0039 | 4.6380 | 2.5010 | −1.4511 | −3.9830 | |
| Prob | 0.3870 ** | 0.2871 ** | 0.0387 * | 0.0294 * | 0.0529 * | 0.1298 * | 0.2450 * | 0.0045 * | 0.4902 ** | 0.0387 ** | 0.2506 * | |
| China: Qingdao | Coefficient | 0.0189 | 0.0040 | 0.1011 | 0.1245 | 0.2067 | 0.2217 | 0.0551 | −0.0041 | −0.2697 | −0.1673 | −0.3567 |
| t-stat | 2.9876 | 2.0586 | 3.0284 | 3.1257 | −2.5083 | −3.0083 | 4.6348 | 3.5026 | 2.5553 | 3.0856 | 2.0854 | |
| Prob | 0.0281 * | 0.2877 * | 0.2975 * | 0.1654 * | 0.0005 ** | 0.0491 ** | 0.0000 * | 0.4817 ** | 0.0976 *** | 0.1299 *** | 0.2078 ** | |
| China: Qinhuangdao | Coefficient | −0.0677 | −0.0562 | 0.1876 | 0.1522 | 0.0742 | 0.0504 | 0.0723 | 0.0038 | 0.0144 | −0.0030 | 0.0035 |
| t-stat | −2.4980 | −3.5991 | 1.9550 | 3.0973 | 4.3311 | 3.6566 | −2.4475 | 1.5411 | 3.5095 | 4.7109 | 2.6419 | |
| Prob | 0.0485 * | 0.0593 * | 0.1183 ** | 0.3070 ** | 0.0760 * | 0.0872 * | 0.2559 * | 0.3904 * | 0.1567 ** | 0.2054 ** | 0.0754 * | |
| China: Rizhao | Coefficient | −0.1096 | −0.0987 | 0.1542 | 0.1276 | 0.0493 | 0.0910 | 0.0046 | 0.1053 | 0.0059 | 0.0102 | 0.1200 |
| t-stat | −4.8561 | −3.4982 | 2.7091 | 3.0188 | 2.0452 | 2.6413 | 1.9550 | −3.5085 | −2.4832 | 1.6598 | 3.1675 | |
| Prob | 0.5875 ** | 0.1824 ** | 0.2587 ** | 0.4900 ** | 0.0500 * | 0.1287 * | 0.1677 * | 0.0044 * | 0.6910 * | 0.0371 ** | 0.0444 * | |
| China: Shanghai | Coefficient | 0.1203 | 0.1186 | 0.3876 | 0.3497 | 0.2988 | 0.2462 | 0.1011 | 0.1876 | 0.1954 | −0.2459 | −0.2037 |
| t-stat | 2.8762 | 2.0590 | 4.6003 | 3.6065 | 1.5974 | 1.8005 | −4.7492 | 5.3009 | 3.0766 | 2.0076 | −4.1002 | |
| Prob | 0.3094 * | 0.5871 * | 0.3760 *** | 0.4012 *** | 0.2867 *** | 0.3041 *** | 0.0083 ** | 0.0487 ** | 0.2598 *** | 0.0834 *** | 0.1885 *** | |
| China: Weihai | Coefficient | −0.0087 | −0.0124 | 0.1165 | 0.1411 | 0.0313 | 0.0456 | 0.0544 | 0.1250 | 0.1608 | 0.0325 | 0.1341 |
| t-stat | −1.3905 | −2.4870 | 3.9841 | 3.0676 | −4.0606 | −3.3407 | 2.6715 | 3.5734 | 1.0075 | −3.4472 | 2.1765 | |
| Prob | 0.0094 ** | 0.0288 ** | 0.3690 ** | 0.4059 ** | 0.0512 ** | 0.2888 ** | 0.0817 * | 0.2986 * | 0.1842 ** | 0.0000 ** | 0.9874 * | |
| China: Yantai | Coefficient | −0.0582 | −0.0444 | 0.1033 | 0.0962 | 0.1003 | 0.1516 | 0.1249 | 0.1378 | 0.0411 | −0.1126 | 0.0368 |
| t-stat | 3.8654 | 2.5109 | 4.0845 | 3.7764 | 2.5764 | 3.0693 | −2.7308 | 4.1540 | 3.0697 | −1.6093 | 2.1677 | |
| Prob | 0.3751 ** | 0.4225 ** | 0.2870 ** | 0.0061 ** | 0.3986 ** | 0.2100 ** | 0.0031 ** | 0.3991 ** | 0.2134 ** | 0.0421 ** | 0.1295 ** | |
| Denmark: Aarhus | Coefficient | −0.0125 | −0.0056 | 0.3286 | 0.3064 | 0.0275 | 0.0186 | 0.0518 | −0.0186 | 0.1046 | 0.0587 | −0.1079 |
| t-stat | −4.3890 | −3.8271 | 5.0400 | 3.1286 | 1.3884 | −2.6931 | 1.4553 | −2.5583 | 3.0035 | 3.0683 | 2.5872 | |
| Prob | 0.2362 * | 0.3053 * | 0.5156 ** | 0.2791 ** | 0.2380 * | 0.3815 * | 0.1609 * | 0.3990 * | 0.2377 ** | 0.2609 * | 0.1884 * | |
| Denmark: Copenhagen | Coefficient | −0.1274 | −0.1040 | 0.2467 | 0.2075 | 0.0052 | 0.0457 | 0.0071 | 0.0155 | 0.0391 | 0.0846 | −0.0385 |
| t-stat | 2.0071 | 4.8638 | −1.1865 | 2.9666 | −3.1409 | −4.9062 | 2.3645 | 1.6984 | 2.5986 | −2.6122 | −1.4096 | |
| Prob | 0.0385 ** | 0.1787 ** | 0.4003 ** | 0.3781 ** | 0.8726 * | 0.0498 * | 0.3096 * | 0.0682 * | 0.3352 * | 0.4823 * | 0.3193 * | |
| Denmark, Greenland: Nuuk | Coefficient | 0.0383 | 0.0446 | 0.7199 | 0.6483 | 0.0954 | 0.0073 | 0.4338 | −0.0870 | −0.0275 | −0.0081 | 0.1487 |
| t-stat | −1.4984 | −2.0095 | 4.2311 | 3.9750 | 2.8600 | 3.9846 | −2.6094 | 3.5941 | −1.5900 | −3.1977 | 4.1550 | |
| Prob | 0.8780 * | 0.3967 * | 0.7820 *** | 0.5301 *** | 0.0016 * | 0.6019 * | 0.4487 ** | 0.1110 * | 0.4692 * | 0.5239 * | 0.3819 * | |
| Iceland: Reydharfjordur | Coefficient | 0.0298 | 0.0202 | 0.5083 | 0.3716 | 0.2609 | 0.2317 | 0.5790 | −0.0142 | 0.0613 | 0.0103 | 0.0204 |
| t-stat | −2.9334 | −2.0651 | 4.5800 | 3.0825 | −2.4485 | 4.0883 | −2.0554 | 1.4496 | 2.8088 | 1.3585 | 2.5985 | |
| Prob | 0.5912 * | 0.3894 * | 0.3109 *** | 0.2904 *** | 0.5886 * | 0.2076 * | 0.1195 *** | 0.0065 * | 0.0301 * | 0.2780 * | 0.1920 ** | |
| Iceland: Reykjavik | Coefficient | −0.0155 | −0.0097 | 0.6214 | 0.5575 | 0.3173 | 0.2800 | 0.1677 | −0.0097 | 0.1005 | 0.0497 | 0.1106 |
| t-stat | −3.5506 | 4.6090 | 3.1798 | −2.4900 | −1.6960 | 1.9964 | −3.1385 | 2.2853 | 3.8974 | −2.6982 | 3.6899 | |
| Prob | 0.1483 * | 0.3698 * | 0.7926 *** | 0.0187 *** | 0.1678 ** | 0.4209 ** | 0.2509 ** | 0.3880 * | 0.1296 ** | 0.3485 ** | 0.3871 ** | |
| Japan: Akita | Coefficient | −0.1047 | −0.0964 | 0.5388 | 0.6011 | 0.1855 | 0.2076 | 0.1240 | 0.0047 | −0.0371 | −0.0222 | −0.1102 |
| t-stat | −2.0739 | −1.3009 | 2.4150 | 3.0653 | −2.3920 | −3.5391 | 4.7921 | −2.1494 | 1.1986 | 2.1043 | −2.7198 | |
| Prob | 0.3017 ** | 0.4755 ** | 0.5237 ** | 0.0517 ** | 0.1904 ** | 0.4864 ** | 0.3417 * | 0.1000 * | 0.0412 * | 0.1498 * | 0.5931 ** | |
| Japan: Hakata | Coefficient | −0.0341 | −0.0865 | 0.4021 | 0.3500 | 0.1472 | 0.1558 | 0.3572 | 0.0155 | 0.0394 | 0.0417 | 0.1034 |
| t-stat | 4.2880 | 3.6901 | 1.9733 | 2.8499 | 3.0593 | 2.6312 | 1.5996 | 2.9709 | 1.4980 | −1.4020 | 1.8765 | |
| Prob | 0.4494 ** | 0.0007 ** | 0.0598 ** | 0.1784 ** | 0.5700 ** | 0.2909 ** | 0.0038 * | 0.4882 * | 0.2653 * | 0.4883 * | 0.0029 ** | |
| Japan: Kitakyushu | Coefficient | −0.2082 | −0.2136 | 0.3424 | 0.4065 | 0.1975 | 0.1607 | 0.2005 | 0.1003 | 0.0167 | 0.0269 | −0.2690 |
| t-stat | 3.5685 | −2.0071 | 1.5076 | 4.7702 | −1.4767 | −2.0041 | 3.5877 | −1.5987 | 3.2992 | 2.8840 | 3.3851 | |
| Prob | 0.1376 ** | 0.2500 ** | 0.8927 ** | 0.8534 ** | 0.3092 ** | 0.2868 ** | 0.4982 ** | 0.0781 * | 0.1558 * | 0.2641 * | 0.5980 * | |
| Japan: Niigata | Coefficient | 0.1595 | 0.1243 | 0.1980 | 0.2371 | 0.2206 | 0.2547 | 0.0523 | 0.1204 | −0.0861 | −0.0293 | 0.0416 |
| t-stat | 4.1284 | 2.0009 | −1.2956 | −2.0046 | 4.1475 | 1.5083 | 2.9084 | 4.0880 | 3.1822 | 4.1000 | 2.1950 | |
| Prob | 0.3002 ** | 0.2764 ** | 0.0045 *** | 0.0498 *** | 0.0016 *** | 0.1696 *** | 0.5081 *** | 0.3905 * | 0.0015 ** | 0.1729 ** | 0.2407 ** | |
| Norway: Bergen | Coefficient | −0.0103 | −0.0225 | 0.1286 | 0.1085 | 0.1690 | 0.1773 | 0.1503 | 0.2566 | 0.1408 | 0.1774 | 0.3718 |
| t-stat | −4.1852 | −3.0741 | 2.0954 | 3.1264 | −1.5821 | −2.2045 | −1.5938 | 2.0548 | −1.3056 | −2.0063 | −2.2595 | |
| Prob | 0.1084 ** | 0.4827 ** | 0.1008 ** | 0.3851 ** | 0.4593 * | 0.3841 * | 0.2855 ** | 0.7109 ** | 0.1297 ** | 0.5028 ** | 0.2091 ** | |
| Norway: Hammerfest | Coefficient | −0.0287 | −0.0113 | 0.0392 | 0.0506 | 0.0452 | 0.0587 | 0.2014 | 0.2065 | 0.0495 | 0.3125 | 0.2046 |
| t-stat | −3.7918 | −1.0584 | 2.9805 | 3.8562 | −4.0127 | −2.1084 | 1.5039 | −1.5003 | −3.0882 | 1.4995 | −3.0067 | |
| Prob | 0.3866 ** | 0.2095 ** | 0.6733 * | 0.3500 * | 0.2986 * | 0.3762 * | 0.5877 * | 0.4201 ** | 0.0000 ** | 0.0982 ** | 0.0038 * | |
| Norway: Stavanger | Coefficient | 0.0110 | 0.0273 | 0.2409 | 0.2307 | 0.0175 | 0.0385 | 0.1805 | 0.1699 | 0.3019 | 0.2543 | 0.3102 |
| t-stat | 2.1084 | 1.9820 | 4.9864 | 1.3986 | 3.0386 | 2.4761 | −1.4082 | 2.4056 | 4.2066 | 3.0051 | 2.9047 | |
| Prob | 0.3872 * | 0.2574 * | 0.5001 ** | 0.3403 ** | 0.4501 ** | 0.5720 ** | 0.0060 ** | 0.1785 ** | 0.3874 ** | 0.5052 ** | 0.3855 ** | |
| Norway: Tromso | Coefficient | −0.0490 | −0.0502 | 0.2288 | 0.1954 | 0.0787 | 0.0644 | 0.1513 | 0.0284 | 0.0135 | 0.0498 | 0.1984 |
| t-stat | 1.8723 | 3.0001 | 2.6505 | 3.0843 | 2.0004 | 4.3965 | 3.8601 | −2.6097 | 1.0741 | 3.1110 | −2.4091 | |
| Prob | 0.0986 ** | 0.4985 ** | 0.0041 ** | 0.2671 ** | 0.3096 * | 0.4861 * | 0.2312 ** | 0.3550 * | 0.2864 * | 0.3509 * | 0.4986 ** | |
| Norway: Trondheim | Coefficient | 0.0564 | 0.0632 | 0.1152 | 0.1605 | 0.2851 | 0.2550 | 0.0397 | 0.1296 | 0.3750 | 0.2076 | 0.4097 |
| t-stat | 3.2951 | 2.4077 | 3.4096 | 2.2472 | 3.0448 | 2.1977 | −1.5085 | 4.5402 | 1.8563 | −2.0985 | 3.0950 | |
| Prob | 0.0007 ** | 0.0134 ** | 0.2509 *** | 0.4854 *** | 0.2099 ** | 0.3296 ** | 0.4994 ** | 0.3347 ** | 0.5097 ** | 0.1209 ** | 0.0036 *** | |
| Russia: Anadyr | Coefficient | 0.0015 | 0.0019 | 0.0553 | 0.0002 | 0.0038 | 0.0005 | 0.0408 | −0.0003 | −0.0002 | 0.0005 | −0.0481 |
| t-stat | 3.1408 | 2.4801 | −2.1984 | −1.8508 | −2.0045 | −1.0672 | 3.7055 | −4.1834 | 3.8591 | 2.5281 | 1.0833 | |
| Prob | 0.2981 * | 0.0975 * | 0.3061 * | 0.4009 * | 0.3072 * | 0.6820 * | 0.3097 ** | 0.2751 * | 0.6953 * | 0.6509 * | 0.5802 * | |
| Russia: Arkhangelsk | Coefficient | −0.0196 | −0.0207 | 0.0187 | 0.0206 | 0.0054 | 0.0098 | 0.0829 | −0.0040 | 0.1497 | 0.1025 | 0.0496 |
| t-stat | 2.0507 | 3.8502 | −1.3955 | −2.0412 | −4.9287 | 5.0945 | 2.7756 | 3.9852 | −1.5054 | −2.0064 | 3.1247 | |
| Prob | 0.0829 ** | 0.3813 ** | 0.4409 ** | 0.0389 ** | 0.5845 * | 0.5699 * | 0.7281 * | 0.8555 * | 0.0582 * | 0.7177 * | 0.2986 ** | |
| Russia: Dudinka | Coefficient | 0.0062 | 0.0108 | 0.0052 | 0.0005 | 0.0059 | 0.0002 | 0.0665 | 0.0104 | 0.0051 | 0.0040 | 0.0182 |
| t-stat | −1.4078 | −2.5095 | 4.0581 | 2.9770 | 3.9006 | −4.5281 | −1.9664 | 3.8911 | 2.6096 | 4.9873 | −1.9503 | |
| Prob | 0.3769 * | 0.4401 * | 0.7200 * | 0.3086 * | 0.4071 * | 0.5069 * | 0.0052 ** | 0.0837 * | 0.2223 * | 0.5019 * | 0.0849 * | |
| Russia: Murmansk | Coefficient | −0.0295 | −0.0180 | 0.1149 | 0.1509 | 0.0297 | 0.0104 | 0.1147 | 0.0124 | 0.1614 | 0.1808 | 0.2580 |
| t-stat | 4.5096 | 2.5985 | −1.4085 | −3.0955 | −1.0583 | 2.0588 | 1.0095 | 2.0985 | 3.0009 | −2.4621 | −4.9076 | |
| Prob | 0.4507 ** | 0.3811 ** | 0.3222 *** | 0.4086 *** | 0.5929 * | 0.0061 * | 0.3376 ** | 0.5902 * | 0.6871 ** | 0.2984 ** | 0.0791 *** | |
| Russia: Petropavlovsk | Coefficient | 0.0663 | 0.0504 | 0.1146 | 0.1532 | 0.0135 | 0.0067 | 0.0508 | 0.0396 | 0.0023 | 0.0040 | 0.1573 |
| t-stat | 2.0000 | 2.3856 | −3.5041 | −2.0698 | 1.0532 | 4.9433 | −2.9870 | 1.6084 | 2.6830 | −3.8045 | 2.0005 | |
| Prob | 0.5288 * | 0.6902 * | 0.0057 * | 0.1904 * | 0.0994 * | 0.7502 * | 0.3099 ** | 0.0087 * | 0.1481 * | 0.5409 * | 0.4873 ** | |
| Russia: Pevek | Coefficient | 0.0075 | 0.0104 | 0.2094 | 0.0066 | 0.0061 | 0.0013 | 0.0114 | 0.0058 | 0.0014 | 0.0023 | 0.1106 |
| t-stat | −1.9409 | −3.8700 | 2.8895 | 1.0587 | 3.0855 | 2.9555 | −2.0065 | 3.1335 | −4.9722 | −2.5561 | −3.6091 | |
| Prob | 0.0663 * | 0.4426 * | 0.5873 * | 0.4200 * | 0.0000 * | 0.0000 * | 0.1982 ** | 0.5987 * | 0.0003 * | 0.4093 * | 0.3863 * | |
| Russia: Sabetta | Coefficient | 0.0207 | 0.0195 | 0.0396 | 0.0008 | 0.0897 | 0.0002 | 0.0058 | 0.1804 | 0.0004 | 0.0002 | 0.3472 |
| t-stat | −2.2060 | −1.4809 | 2.9487 | 4.0596 | 3.1774 | 2.1247 | 3.0871 | −5.0822 | −3.8961 | −4.2247 | 3.6053 | |
| Prob | 0.4791 * | 0.2853 * | 0.0035 ** | 0.7091 * | 0.6908 ** | 0.7883 * | 0.0039 * | 0.9431 ** | 0.2907 * | 0.6148 * | 0.5686 ** | |
| Russia: Vladivostok | Coefficient | −0.0593 | −0.0355 | 0.0340 | 0.1985 | 0.1345 | 0.1590 | 0.0292 | 0.0853 | 0.2480 | 0.2175 | 0.4112 |
| t-stat | 3.1134 | 1.4094 | 2.0556 | 3.5444 | 1.9800 | 4.9801 | −2.0440 | −3.5104 | 4.1564 | 3.9962 | 2.2275 | |
| Prob | 0.0988 ** | 0.0527 ** | 0.0974 *** | 0.1307 ** | 0.4877 *** | 0.2874 *** | 0.0598 * | 0.1365 * | 0.3902 *** | 0.8271 *** | 0.3609 *** | |
| South Korea: Gwangyang | Coefficient | −0.0570 | −0.0651 | 0.3406 | 0.3053 | 0.3415 | 0.3076 | −0.0817 | −0.0993 | −0.0018 | −0.0036 | 0.2808 |
| t-stat | −3.5442 | −2.2309 | 4.1158 | 3.4724 | −1.5982 | −2.7951 | 2.0041 | −1.5081 | 2.5814 | 3.4140 | 1.7377 | |
| Prob | 0.8691 ** | 0.4255 ** | 0.3754 ** | 0.5160 ** | 0.4773 *** | 0.5870 *** | 0.0482 * | 0.5802 * | 0.1263 * | 0.0006 ** | 0.1283 ** | |
| South Korea: Pusan | Coefficient | 0.0814 | 0.0642 | 0.8115 | 0.8359 | 0.6776 | 0.6015 | −0.1405 | −0.1620 | −0.0057 | −0.0114 | 0.6217 |
| t-stat | 1.8693 | 2.7993 | 4.6346 | 3.0045 | −3.6871 | −1.9865 | 2.0481 | 3.6111 | −1.5548 | −2.6932 | −4.8994 | |
| Prob | 0.0809 ** | 0.5581 ** | 0.9500 *** | 0.8198 *** | 0.6900 *** | 0.5824 *** | 0.3870 ** | 0.4816 ** | 0.8347 ** | 0.5918 ** | 0.6000 *** | |
| South Korea: Ulsan | Coefficient | −0.0474 | −0.0576 | 0.5209 | 0.5573 | 0.5116 | 0.4370 | 0.0045 | −0.0954 | −0.0664 | −0.0407 | 0.5836 |
| t-stat | 3.5500 | 1.4732 | 3.5664 | 4.0560 | −2.8095 | −1.4567 | −3.9582 | −2.0585 | −3.4493 | −2.3763 | −3.1371 | |
| Prob | 0.3571 ** | 0.5918 ** | 0.6816 *** | 0.4176 *** | 0.5983 *** | 0.4442 *** | 0.9185 * | 0.7203 * | 0.0037 * | 0.0448 ** | 0.2795 ** | |
| Sweden: Gothenburg | Coefficient | 0.0045 | 0.0037 | 0.7054 | 0.7650 | 0.1619 | 0.1890 | 0.1581 | −0.0018 | 0.0136 | 0.0744 | −0.3028 |
| t-stat | 1.5828 | 2.5336 | −4.9007 | −3.1974 | −1.8592 | −2.2971 | 1.8429 | −3.0284 | 1.7083 | 2.1286 | −3.1401 | |
| Prob | 0.3752 * | 0.4975 * | 0.8162 *** | 0.7005 *** | 0.6866 ** | 0.2309 ** | 0.4105 ** | 0.1562 * | 0.0000 * | 0.0287 * | 0.5982 *** | |
| Sweden: Halmstad | Coefficient | 0.0006 | 0.0004 | 0.3569 | 0.4021 | 0.1047 | 0.1456 | 0.0368 | −0.0035 | 0.0275 | 0.0805 | 0.0485 |
| t-stat | 3.7099 | 2.8671 | −3.0988 | −2.6810 | −4.6438 | −2.0974 | 2.0815 | 4.4911 | 2.6092 | 3.8881 | −2.7002 | |
| Prob | 0.3812 * | 0.4502 * | 0.4713 *** | 0.5658 *** | 0.1870 ** | 0.2619 ** | 0.5092 ** | 0.2976 * | 0.4983 * | 0.2550 * | 0.2976 ** |
Note: *, **, *** = significance at 10% level, 5% level, and 1% level, respectively. Source: Authors’ calculation.
Appendix D
Table A6.
ARDL long-run estimates, ports, 2015–2019.
| Port | Parameter | X3 | X4 | X5 | X6 | X7 | X8 | X9 | X10 | Constant |
|---|---|---|---|---|---|---|---|---|---|---|
| China: Dalian | Coefficient | 0.1235 | 0.2248 | 0.2035 | 0.1944 | 0.0720 | −0.1424 | −0.0565 | −0.1527 | 3.2765 |
| t-stat | 1.2741 *** | −3.4297 *** | −1.9264 ** | −2.3273 ** | 3.8319 * | −1.8300 ** | 1.7347 *** | 2.3091 *** | 2.2281 | |
| China: Lianyungang | Coefficient | 0.1638 | 0.2134 | 0.1386 | 0.1307 | 0.2015 | −0.0748 | 0.0548 | −0.1132 | 2.4523 |
| t-stat | −2.4371 ** | 2.9999 ** | −2.3982 * | −3.2591 * | −3.4778 * | 1.9756 * | 2.7232 ** | −3.4544 ** | 3.1742 | |
| China: Qingdao | Coefficient | 0.2655 | 0.2318 | 0.3445 | 0.3616 | 0.1232 | −0.0375 | −0.3111 | −0.1459 | −4.1376 |
| t-stat | 1.4967 ** | 2.6805 ** | −4.5940 *** | −1.8367 *** | 2.3719 * | 1.7622 ** | 3.4780 *** | −1.3254 *** | −1.5005 | |
| China: Qinhuangdao | Coefficient | 0.2352 | 0.2002 | 0.1453 | 0.1542 | 0.0863 | 0.0283 | 0.0387 | −0.0371 | 5.1893 |
| t-stat | 2.8307 ** | 3.1531 ** | 1.2763 * | 2.5395 * | −2.1279 * | 1.4721 * | 1.0724 ** | 4.3864 ** | 3.4722 | |
| China: Rizhao | Coefficient | 0.4176 | 0.3726 | 0.1280 | 0.1666 | 0.0084 | 0.1637 | 0.0255 | 0.0169 | 4.8531 |
| t-stat | 4.3809 ** | 2.0827 ** | −2.3195 * | −2.0874 * | 3.4807 * | −2.1489 * | −2.2987 * | 2.3206 ** | 3.3678 * | |
| China: Shanghai | Coefficient | 0.7254 | 0.7742 | 0.5683 | 0.5967 | 0.1798 | 0.2483 | 0.2659 | −0.3215 | −5.2730 |
| t-stat | 4.9512 *** | −2.3945 *** | 1.1700 *** | 2.4843 *** | −3.4615 ** | 2.3311 ** | −1.0315 *** | 3.8843 *** | −3.1662 | |
| China: Weihai | Coefficient | 0.3017 | 0.4276 | 0.1635 | 0.1955 | 0.0564 | 0.1829 | 0.1946 | 0.0636 | 2.2113 |
| t-stat | 4.5200 ** | 1.6991 ** | −4.2046 ** | −2.2316 ** | 3.2851 * | 2.1272 * | 3.0271 ** | −1.8200 ** | 3.6585 | |
| China: Yantai | Coefficient | 0.2784 | 0.2465 | 0.1739 | 0.2341 | 0.1529 | 0.2585 | 0.0555 | −0.1478 | 4.3971 |
| t-stat | 3.0773 *** | −2.5710 *** | 3.2285 ** | 1.7275 ** | −2.3004 ** | 3.1964 ** | 2.7232 ** | −2.7193 ** | 2.2276 | |
| Denmark: Aarhus | Coefficient | 0.1845 | 0.1344 | 0.0722 | 0.0624 | 0.0965 | −0.0421 | 0.1617 | 0.0995 | −3.5323 |
| t-stat | 2.3808 *** | 2.5956 *** | 1.5310 * | −2.2937 * | 1.5312 * | −3.1375 * | 1.2534 ** | 2.3852 * | 1.5905 | |
| Denmark: Copenhagen | Coefficient | 0.1402 | 0.1732 | 0.0255 | 0.0813 | 0.0400 | 0.0667 | 0.0511 | 0.1267 | −4.6628 |
| t-stat | −1.5213 *** | 3.1648 *** | −2.0176 * | −4.2565 * | 2.1406 * | 4.5489 * | 2.7042 * | −1.8553 * | −2.7390 | |
| Denmark, Greenland: Nuuk | Coefficient | 0.7235 | 0.6857 | 0.1523 | 0.0246 | 0.5275 | −0.1382 | −0.0756 | −0.0250 | 5.2034 |
| t-stat | 3.0804 *** | 4.1621 *** | −1.4592 * | 2.4521 * | −1.9221 ** | 2.3176 * | −1.3413 * | −1.5126 * | 3.5615 | |
| Iceland: Reydharfjordur | Coefficient | 0.5156 | 0.4275 | 0.2551 | 0.2472 | 0.5384 | −0.0347 | 0.0614 | 0.0411 | 2.3587 |
| t-stat | 2.7443 *** | 2.6310 *** | −1.2964 * | 2.8333 * | −1.6565 *** | 2.4251 * | 2.7256 * | 1.8324 * | 2.0671 | |
| Iceland: Reykjavik | Coefficient | 0.6842 | 0.6198 | 0.4823 | 0.2755 | 0.1716 | −0.0423 | 0.1399 | 0.0638 | 4.2592 |
| t-stat | 2.1763 *** | −2.5334 *** | −2.5562 ** | 2.6216 ** | −2.6288 ** | 1.7262 * | 3.1762 ** | −1.8230 ** | 3.7460 | |
| Japan: Akita | Coefficient | 0.5111 | 0.6087 | 0.2431 | 0.2284 | 0.1803 | 0.0479 | −0.0843 | −0.0655 | −4.5829 |
| t-stat | 2.2875 ** | 2.7918 ** | −3.3827 ** | −2.5197 ** | 2.6951 * | −1.6035 * | 2.4114 * | 1.5314 * | −2.7044 | |
| Japan: Hakata | Coefficient | 0.4584 | 0.4975 | 0.1963 | 0.2512 | 0.3560 | 0.0671 | 0.0782 | 0.0821 | 4.8276 |
| t-stat | 1.7721 ** | 2.8512 ** | 3.0008 ** | 2.4908 ** | 1.9542 * | 3.2556 * | 2.3907 * | −2.6630 * | 2.7921 | |
| Japan: Kitakyushu | Coefficient | 0.3927 | 0.4584 | 0.1746 | 0.2165 | 0.2294 | 0.1777 | 0.0653 | 0.0882 | −5.6415 |
| t-stat | 1.8409 ** | 2.9116 ** | −2.3875 ** | −2.1840 ** | 4.5517 ** | −1.8623 * | 2.7621 * | 1.7313 * | −4.5526 | |
| Japan: Niigata | Coefficient | 0.2752 | 0.2460 | 0.2861 | 0.3485 | 0.0514 | 0.1405 | −0.1584 | −0.0621 | 3.3840 |
| t-stat | −2.8150 *** | −2.3854 *** | 3.3705 *** | 2.6832 *** | 1.7280 *** | 2.7334 * | 1.7335 ** | 3.5992 ** | 2.0052 | |
| Norway: Bergen | Coefficient | 0.2516 | 0.1563 | 0.2440 | 0.2186 | 0.1843 | 0.3247 | 0.1360 | 0.2239 | 3.5287 |
| t-stat | 2.3543 ** | −2.1885 ** | −2.2598 * | −1.4934 * | −3.7609 ** | 1.6111 ** | −2.3952 ** | −2.5251 ** | 2.1645 | |
| Norway: Hammerfest | Coefficient | 0.0744 | 0.0800 | 0.0961 | 0.0709 | 0.2665 | 0.2330 | 0.0941 | 0.3883 | 5.3054 |
| t-stat | 2.3187 ** | 3.5816 ** | −3.0335 * | −2.5882 * | 2.9174 * | −3.5792 ** | −2.5304 ** | 3.4737 ** | 3.5287 | |
| Norway: Stavanger | Coefficient | 0.2995 | 0.3447 | 0.0927 | 0.0731 | 0.2652 | 0.1755 | 0.4265 | 0.2385 | 4.2556 |
| t-stat | 4.1850 *** | 2.5643 *** | 4.4436 ** | 1.8520 ** | −3.0186 ** | 1.7234 ** | 2.8667 ** | 1.7114 ** | 2.0081 | |
| Norway: Tromso | Coefficient | 0.2713 | 0.2862 | 0.1543 | 0.1256 | 0.1913 | 0.0996 | 0.0309 | 0.0622 | 3.4619 |
| t-stat | 2.2246 *** | −4.5505 *** | 2.6285 * | 2.7095 * | 1.7200 ** | −2.2838 * | 3.5176 * | 2.3787 * | 2.0387 | |
| Norway: Trondheim | Coefficient | 0.1637 | 0.2739 | 0.3612 | 0.3330 | 0.0908 | 0.1831 | 0.4274 | 0.1916 | 5.1862 |
| t-stat | −2.3062 *** | 1.8174 *** | 2.7556 ** | 1.8621 ** | −3.1634 ** | 4.2559 ** | 2.2965 ** | −3.0001 ** | 4.6559 | |
| Russia: Anadyr | Coefficient | 0.0706 | 0.0032 | 0.00109 | 0.0075 | 0.0837 | −0.0112 | −0.0030 | 0.0028 | −3.1780 |
| t-stat | −2.5873 * | −3.5985 * | −1.3917 * | −2.6173 * | 1.4095 ** | −2.3887 * | 2.6774 * | 2.1795 * | −2.5545 | |
| Russia: Arkhangelsk | Coefficient | 0.0581 | 0.0374 | 0.0095 | 0.0457 | 0.1520 | −0.0135 | 0.2487 | 0.1553 | 5.2761 |
| t-stat | −2.3995 ** | −2.0456 ** | −3.5286 * | 3.6812 * | 3.2293 * | 2.7697 * | −1.9990 * | −2.0046 * | 4.6882 | |
| Russia: Dudinka | Coefficient | 0.0089 | 0.0037 | 0.0077 | 0.0065 | 0.1671 | 0.0202 | 0.00116 | 0.0122 | 3.4550 |
| t-stat | −3.3553 * | 1.8820 * | −2.8148 * | −2.9153 * | −1.8729 ** | 2.8151 * | 1.5370 * | 2.7609 * | 2.7166 | |
| Russia: Murmansk | Coefficient | 0.1417 | 0.1815 | 0.0621 | 0.0120 | 0.1773 | 0.0266 | 0.11744 | 0.2751 | 6.3375 |
| t-stat | −3.0815 *** | −2.0058 *** | −1.8130 * | 2.4839 * | −2.0194 ** | −1.7810 ** | 2.7151 ** | −2.0365 ** | 5.0949 | |
| Russia: Petropavlovsk | Coefficient | 0.1550 | 0.1732 | 0.0445 | 0.0278 | 0.0709 | 0.0628 | 0.0076 | 0.0090 | 3.5812 |
| t-stat | −4.2656 * | −2.8954 * | 1.8182 * | 3.3365 * | −1.6845 ** | 3.1475 * | 2.6187 * | −2.1154 * | 3.2980 | |
| Russia: Pevek | Coefficient | 0.1822 | 0.00135 | 0.0163 | 0.0189 | 0.0200 | 0.0447 | 0.0103 | 0.0067 | 4.3167 |
| t-stat | 1.9457 * | 1.6089 * | 3.8265 * | 1.7704 * | −3.5287 ** | 2.1860 * | −3.1498 * | −1.5980 * | 2.0095 | |
| Russia: Sabetta | Coefficient | 0.0663 | 0.0043 | 0.1664 | 0.0091 | 0.0084 | 0.2788 | 0.0060 | 0.0069 | 3.7599 |
| t-stat | 2.5055 ** | −2.0787 * | 1.9875 ** | 2.4980 * | 2.5112 * | −4.5909 ** | −3.1693 * | −3.4897 * | 2.4631 | |
| Russia: Vladivostok | Coefficient | 0.0884 | 0.2352 | 0.1713 | 0.2054 | 0.0535 | 0.1275 | 0.2926 | 0.2112 | 6.2680 |
| t-stat | 4.4591 *** | 2.3716 ** | −2.5361 *** | 3.8276 *** | −2.6289 * | −2.5804 ** | 1.2017 *** | 1.7975 *** | 5.3799 | |
| South Korea: Gwangyang | Coefficient | 0.4516 | 0.4285 | 0.3590 | 0.3082 | −0.0904 | −0.1126 | −0.0132 | −0.0089 | 3.2795 |
| t-stat | 2.8029 *** | 1.5296 ** | −2.3983 *** | −1.6396 *** | 4.8275 * | −2.8227 * | 1.5541 * | −2.4002 ** | 2.7891 | |
| South Korea: Pusan | Coefficient | 0.8217 | 0.7814 | 0.7093 | 0.6619 | −0.1541 | −0.1773 | −0.0158 | −0.0594 | 5.3987 |
| t-stat | −2.0039 *** | −2.5870 *** | −1.4069 *** | −2.9276 *** | 1.8266 ** | 2.0095 ** | −4.5203 ** | −1.8886 ** | 3.1963 | |
| South Korea: Ulsan | Coefficient | 0.6573 | 0.5718 | 0.5608 | 0.4767 | 0.0134 | −0.0874 | −0.1227 | −0.0995 | 4.0440 |
| t-stat | 4.1280 *** | 3.0052 *** | −2.4816 *** | −2.0086 *** | −4.5598 * | −3.2790 * | −2.4986 * | −4.2644 ** | 3.8215 | |
| Sweden: Gothenburg | Coefficient | 0.7031 | 0.7394 | 0.2001 | 0.1670 | 0.1783 | −0.0144 | 0.0169 | 0.0931 | 6.4778 |
| t-stat | −2.3827 *** | −1.6590 *** | −2.3857 ** | −3.5281 ** | 3.5990 ** | −1.8976 * | 2.1024 * | −1.5509 * | 4.6380 | |
| Sweden: Halmstad | Coefficient | 0.4136 | 0.4322 | 0.1760 | 0.1574 | 0.0775 | −0.0353 | 0.0665 | 0.0963 | 5.1385 |
| t-stat | −1.4789 *** | −3.2971 *** | −3.9178 ** | −1.6660 ** | 4.9836 ** | 2.4812 * | 3.0009 * | 1.5987 * | 3.0041 |
Note: *, **, *** = significance at 10% level, 5% level, and 1% level, respectively. Source: Authors’ calculation.
Table A7.
ARDL long-run estimates, ports, 2020.
| Port | Parameter | X1 | X2 | X3 | X4 | X5 | X6 | X7 | X8 | X9 | X10 | Constant |
|---|---|---|---|---|---|---|---|---|---|---|---|---|
| China: Dalian | Coefficient | −0.0157 | −0.0245 | 0.1470 | 0.1568 | 0.1773 | 0.1982 | 0.0561 | −0.1450 | −0.0239 | −0.1725 | 3.7612 |
| t-stat | 2.2249 ** | 3.0019 ** | 2.9387 ** | −4.0012 ** | 2.6981 * | −3.5099 ** | 2.8512 * | 1.9563 ** | 2.0045 *** | 3.2986 *** | 2.6546 | |
| China: Lianyungang | Coefficient | −0.0358 | −0.0442 | 0.0528 | 0.0647 | 0.0425 | 0.0513 | 0.1630 | −0.0672 | 0.0730 | −0.1379 | 6.3715 |
| t-stat | −3.2905 ** | −2.5990 ** | 3.6111 * | 2.1295 * | −1.6056 * | −2.6276 * | −2.4389 * | 4.1508 * | 2.6884 ** | −1.5203 ** | 4.2100 | |
| China: Qingdao | Coefficient | 0.0312 | 0.0054 | 0.1452 | 0.1555 | 0.2234 | 0.2521 | 0.0618 | −0.0083 | −0.2953 | −0.1476 | −5.8761 |
| t-stat | 3.1649 * | 2.5189 * | 3.3765 * | 3.6186 * | −2.6701 ** | −3.3478 ** | 4.7165 * | 3.4514 ** | 2.6197 *** | 3.2421 *** | −3.3409 | |
| China: Qinhuangdao | Coefficient | −0.0754 | −0.0548 | 0.2387 | 0.1752 | 0.0733 | 0.0567 | 0.0831 | 0.0097 | 0.0205 | −0.0044 | 5.1285 |
| t-stat | −2.6285 * | −3.7153 * | 1.7440 ** | 3.1508 ** | 4.5172 * | 3.3196 * | −2.2590 * | 1.3896 * | 4.0089 ** | 3.5217 ** | 4.0006 | |
| China: Rizhao | Coefficient | −0.1340 | −0.1195 | 0.1297 | 0.1201 | 0.0376 | 0.0935 | 0.0097 | 0.1582 | 0.0094 | 0.0190 | 4.1138 |
| t-stat | −4.2759 ** | −3.0164 ** | 2.2256 ** | 3.2378 ** | 2.1390 * | 2.8527 * | 1.8361 * | −3.4800 * | −2.7182 * | 1.3114 ** | 3.5706 | |
| China: Shanghai | Coefficient | 0.1304 | 0.1256 | 0.4150 | 0.3628 | 0.4209 | 0.2514 | 0.1523 | 0.2195 | 0.2156 | −0.2230 | −6.1713 |
| t-stat | 2.5981 * | 2.1294 * | 3.7598 *** | 3.4519 *** | 1.3871 *** | 1.5662 *** | −4.5299 ** | 5.3298 ** | 3.1590 *** | 2.1308 *** | −4.2992 | |
| China: Weihai | Coefficient | −0.0122 | −0.0237 | 0.1442 | 0.1753 | 0.0674 | 0.0751 | 0.0640 | 0.1483 | 0.1815 | 0.0427 | 5.7634 |
| t-stat | −1.5380 ** | −2.6908 ** | 4.5700 ** | 3.4729 ** | −4.2568 ** | −3.6225 ** | 2.8321 * | 3.2648 * | 1.2930 ** | −3.5113 ** | 2.5310 | |
| China: Yantai | Coefficient | −0.0503 | −0.0531 | 0.1256 | 0.0950 | 0.1241 | 0.1553 | 0.1452 | 0.1527 | 0.0505 | −0.1486 | 4.4456 |
| t-stat | 3.6125 ** | 2.7142 ** | 4.4003 ** | 3.6128 ** | 2.3987 ** | 3.1786 ** | −2.5009 ** | 4.7996 ** | 3.2913 ** | −2.7962 ** | 3.5897 | |
| Denmark: Aarhus | Coefficient | −0.0246 | −0.0097 | 0.3419 | 0.2915 | 0.0347 | 0.0224 | 0.0575 | −0.0192 | 0.1164 | 0.0740 | −5.1362 |
| t-stat | −4.4085 * | −3.7736 * | 5.3600 ** | 3.6262 ** | 1.5503 * | −2.2843 * | 1.6448 * | −2.4861 * | 3.7080 ** | 3.5123 * | −4.6251 | |
| Denmark: Copenhagen | Coefficient | −0.1566 | −0.1454 | 0.2503 | 0.2264 | 0.0060 | 0.0554 | 0.0083 | 0.0164 | 0.0435 | 0.0777 | −3.2587 |
| t-stat | 2.3051 ** | 4.7238 ** | −1.4967 ** | 2.7481 ** | −3.3714 * | −4.7006 * | 2.5091 * | 1.5226 * | 2.6172 * | −2.4553 * | −2.3521 | |
| Denmark, Greenland: Nuuk | Coefficient | 0.0366 | 0.0473 | 0.7351 | 0.6775 | 0.0921 | 0.0070 | 0.4516 | −0.0832 | −0.0299 | −0.0134 | 4.5600 |
| t-stat | −1.5827 * | −2.2518 * | 4.2879 *** | 3.8163 *** | 2.7265 * | 3.6198 * | −2.6315 ** | 3.4440 * | −1.7451 * | −3.5819 * | 4.2187 | |
| Iceland: Reydharfjordur | Coefficient | 0.0342 | 0.0215 | 0.5274 | 0.3969 | 0.2830 | 0.2697 | 0.5930 | −0.0156 | 0.0715 | 0.0147 | 5.0232 |
| t-stat | −2.4054 * | −2.7916 * | 4.2613 *** | 3.3514 *** | −2.5326 * | 4.4625 * | −2.4811 *** | 1.6822 * | 2.6380 * | 1.0000 * | 3.5714 | |
| Iceland: Reykjavik | Coefficient | −0.0236 | −0.0174 | 0.6532 | 0.5731 | 0.3003 | 0.2954 | 0.1850 | −0.0123 | 0.1486 | 0.0638 | 6.3522 |
| t-stat | −3.7198 * | 4.5261 * | 3.3899 *** | −2.5247 *** | −1.8345 ** | 1.9685 ** | −3.2747 ** | 2.4981 * | 3.5344 ** | −2.8625 ** | 5.4910 | |
| Japan: Akita | Coefficient | −0.1123 | −0.0909 | 0.5563 | 0.6215 | 0.1964 | 0.2240 | 0.1498 | 0.0086 | −0.0465 | −0.0341 | −3.5213 |
| t-stat | −2.5934 ** | −1.5487 ** | 2.5712 ** | 3.3408 ** | −2.5370 ** | −3.0567 ** | 4.4665 * | −2.4565 * | 1.3173 * | 2.4226 * | −2.3999 | |
| Japan: Hakata | Coefficient | −0.0405 | −0.0864 | 0.4340 | 0.3422 | 0.1635 | 0.1754 | 0.3613 | 0.0170 | 0.0381 | 0.0654 | 3.6280 |
| t-stat | 4.2984 ** | 3.7282 ** | 1.8651 ** | 2.8537 ** | 3.2049 ** | 2.6210 ** | 1.7506 * | 2.8418 * | 1.7399 * | −1.5980 * | 2.1341 | |
| Japan: Kitakyushu | Coefficient | −0.2316 | −0.2300 | 0.3145 | 0.4928 | 0.2250 | 0.1549 | 0.2407 | 0.1255 | 0.0182 | 0.0333 | −5.3826 |
| t-stat | 3.7388 ** | −2.2738 ** | 1.7507 ** | 4.5755 ** | −1.6131 ** | −2.1213 ** | 2.6628 ** | −1.5673 * | 3.1996 * | 2.0276 * | −3.0024 | |
| Japan: Niigata | Coefficient | 0.1775 | 0.1104 | 0.2158 | 0.2470 | 0.2015 | 0.2824 | 0.0600 | 0.1364 | −0.0975 | −0.0409 | 6.2345 |
| t-stat | 3.5172 ** | 1.7396 ** | −2.5573 *** | −3.6369 *** | 4.3862 *** | 2.5731 *** | 1.5382 *** | 4.7211 * | 2.7523 ** | 3.3278 ** | 4.6117 | |
| Norway: Bergen | Coefficient | −0.0164 | −0.0331 | 0.1485 | 0.1001 | 0.1884 | 0.1569 | 0.1754 | 0.2362 | 0.1565 | 0.1831 | 3.5220 |
| t-stat | −3.8526 ** | −3.5920 ** | 2.1567 ** | 2.8332 ** | −1.7210 * | −2.4352 * | −2.3709 ** | 2.5863 ** | −2.4207 ** | −2.7456 ** | 2.3476 | |
| Norway: Hammerfest | Coefficient | −0.0265 | −0.0326 | 0.0472 | 0.0743 | 0.0399 | 0.0545 | 0.2356 | 0.2134 | 0.0612 | 0.3007 | 5.9992 |
| t-stat | −3.4387 ** | −2.4187 ** | 3.4206 * | 2.6938 * | −3.4251 * | −2.5710 * | 2.4884 * | −1.6307 ** | −3.2655 ** | 1.6284 ** | 3.5475 | |
| Norway: Stavanger | Coefficient | 0.0153 | 0.0242 | 0.2580 | 0.2421 | 0.0166 | 0.0532 | 0.1775 | 0.1863 | 0.3350 | 0.2675 | 6.6820 |
| t-stat | 3.2854 * | 2.4966 * | 4.7364 ** | 1.6408 ** | 3.2489 ** | 2.3005 ** | −1.5113 ** | 2.5981 ** | 4.1673 ** | 3.2151 ** | 4.7532 | |
| Norway: Tromso | Coefficient | −0.0483 | −0.0574 | 0.2341 | 0.1752 | 0.0785 | 0.0519 | 0.1670 | 0.0445 | 0.0256 | 0.0662 | 5.5311 |
| t-stat | 2.5800 ** | 3.2856 ** | 2.7209 ** | 3.1954 ** | 2.3661 * | 3.5998 * | 3.4839 ** | −2.9113 * | 1.2749 * | 3.4806 * | 3.8006 | |
| Norway: Trondheim | Coefficient | 0.0677 | 0.0585 | 0.1217 | 0.1751 | 0.2630 | 0.2652 | 0.0523 | 0.1400 | 0.3675 | 0.2138 | 4.3717 |
| t-stat | 2.3692 ** | 3.6401 ** | 2.5962 *** | 2.3760 *** | 3.2624 ** | 2.2471 ** | −1.6296 ** | 4.1625 ** | 2.8841 ** | −2.1532 ** | 3.9552 | |
| Russia: Anadyr | Coefficient | 0.0018 | 0.0023 | 0.0562 | 0.0009 | 0.0065 | 0.0012 | 0.0550 | −0.0031 | −0.0042 | 0.0013 | −5.3276 |
| t-stat | 2.1535 * | 2.5184 * | −1.2396 * | −1.2536 * | −2.1427 * | −1.3074 * | 2.6186 ** | −3.5283 * | 4.0635 * | 2.1467 * | −4.4884 | |
| Russia: Arkhangelsk | Coefficient | −0.0332 | −0.0411 | 0.0357 | 0.0448 | 0.0125 | 0.0231 | 0.0824 | −0.0057 | 0.1621 | 0.1274 | 4.1235 |
| t-stat | 2.1574 ** | 3.6275 ** | −2.5583 ** | −3.5751 ** | −4.8266 * | 5.2408 * | 1.6200 * | 4.8652 * | −2.6333 * | −3.6755 * | 3.0053 | |
| Russia: Dudinka | Coefficient | 0.0095 | 0.0127 | 0.0234 | 0.0032 | 0.0070 | 0.0035 | 0.0844 | 0.0159 | 0.0167 | 0.0281 | 3.2344 |
| t-stat | −2.3746 * | −2.4993 * | 4.3857 * | 2.6350 * | 3.5416 * | −4.3683 * | −1.7268 ** | 3.7004 * | 2.5758 * | 4.5006 * | 2.1206 | |
| Russia: Murmansk | Coefficient | −0.0443 | −0.0325 | 0.1342 | 0.1781 | 0.0453 | 0.0328 | 0.1367 | 0.0335 | 0.1862 | 0.1775 | 6.1731 |
| t-stat | 4.1986 ** | 3.6174 ** | −2.6315 *** | −3.4277 *** | −2.2200 * | 2.3990 * | 1.2708 ** | 2.2847 * | 3.4721 ** | −2.2740 ** | 4.5255 | |
| Russia: Petropavlovsk | Coefficient | 0.0857 | 0.0546 | 0.1473 | 0.1624 | 0.0366 | 0.0247 | 0.0612 | 0.0554 | 0.0135 | 0.0076 | 3.2346 |
| t-stat | 2.2249 * | 2.3358 * | −3.8821 * | −2.5290 * | 1.2987 * | 4.5224 * | −2.2775 ** | 1.7189 * | 2.5000 * | −3.5227 * | 2.9672 | |
| Russia: Pevek | Coefficient | 0.0070 | 0.0122 | 0.2425 | 0.0258 | 0.0021 | 0.0046 | 0.0230 | 0.0337 | 0.0255 | 0.0088 | 5.3381 |
| t-stat | −1.8421 * | −3.4339 * | 2.5190 * | 1.3912 * | 3.3059 * | 2.4483 * | −2.3995 ** | 3.2694 * | −4.7141 * | −2.1945 * | 4.0053 | |
| Russia: Sabetta | Coefficient | 0.0243 | 0.0330 | 0.0527 | 0.0035 | 0.1232 | 0.0024 | 0.0113 | 0.2055 | 0.0013 | 0.0005 | 4.1225 |
| t-stat | −2.5992 * | −1.7268 * | 2.3981 ** | 4.2664 * | 3.0676 ** | 2.8495 * | 3.4887 * | −5.1837 ** | −3.4416 * | −4.3663 * | 3.3406 | |
| Russia: Vladivostok | Coefficient | −0.0884 | −0.0561 | 0.0402 | 0.2145 | 0.1567 | 0.1783 | 0.0285 | 0.0996 | 0.2743 | 0.2284 | 6.5893 |
| t-stat | 3.2056 ** | 1.5725 ** | 2.6843 *** | 3.3003 ** | 1.3280 *** | 4.5871 *** | −2.1264 * | −3.4720 * | 4.0065 *** | 3.4071 *** | 5.2444 | |
| South Korea: Gwangyang | Coefficient | −0.0664 | −0.0852 | 0.3643 | 0.3315 | 0.3364 | 0.3142 | −0.1398 | −0.1145 | −0.0020 | −0.0074 | 4.3718 |
| t-stat | −3.2817 ** | −2.5006 ** | 4.1509 ** | 3.4782 ** | −1.7016 *** | −3.5290 *** | 2.2750 * | −2.4988 * | 3.4285 * | 3.5311 ** | 2.2269 | |
| South Korea: Pusan | Coefficient | 0.0953 | 0.0714 | 0.8165 | 0.8554 | 0.6571 | 0.6794 | −0.1562 | −0.1724 | −0.0055 | −0.0247 | 6.1378 |
| t-stat | 1.7136 ** | 2.2485 ** | 4.9127 *** | 4.2942 *** | −3.2704 *** | −1.6228 *** | 2.3007 ** | 3.7506 ** | −1.4682 ** | −2.8156 ** | 4.4093 | |
| South Korea: Ulsan | Coefficient | −0.0676 | −0.0608 | 0.5153 | 0.5429 | 0.5620 | 0.4475 | 0.0063 | −0.1164 | −0.0725 | −0.0637 | 5.7107 |
| t-stat | 3.3175 ** | 1.2601 ** | 3.4274 *** | 4.1212 *** | −2.0053 *** | −1.7312 *** | −3.9279 * | −2.1505 * | −3.1000 * | −2.4861 ** | 3.2123 | |
| Sweden: Gothenburg | Coefficient | 0.0068 | 0.0052 | 0.6987 | 0.7425 | 0.1850 | 0.1874 | 0.1637 | −0.0032 | 0.0145 | 0.0957 | −4.1752 |
| t-stat | 1.3791 * | 2.4720 * | −4.2405 *** | −3.6029 *** | −1.7442 ** | −2.4933 ** | 1.7446 ** | −3.1268 * | 1.5286 * | 2.3864 * | −3.6973 | |
| Sweden: Halmstad | Coefficient | 0.0005 | 0.0007 | 0.3316 | 0.4254 | 0.1261 | 0.1100 | 0.0432 | −0.0047 | 0.0530 | 0.0813 | 2.2097 |
| t-stat | 3.3796 * | 2.4305 * | −3.2777 *** | −2.7315 *** | −4.5985 ** | −2.6013 ** | 2.3615 ** | 4.5841 * | 2.7998 * | 3.7286 * | 2.0585 |
Note: *, **,*** = significance at 10% level, 5% level, and 1% level, respectively. Source: Authors’ calculation.
References
- United Nations Conference on Trade and Development. Review of Maritime Transport; United Nations Publications: New York, NY, USA, 2020. [Google Scholar]
- United Nations. World Economic Situation and Prospects as of Mid-2020; United Nations: New York, NY, USA, 2020. [Google Scholar]
- International Energy Agency. Global Energy Review 2020: The Impacts of the COVID-19 Crisis on Global Energy Demand and CO2 Emissions; International Energy Agency: Paris, France, 2020. [Google Scholar]
- Wang, C.; Horby, P.W.; Hayden, F.G.; Gao, G.F. A Novel Coronavirus Outbreak of Global Health Concern. Lancet 2020, 395, 470–473. [Google Scholar] [CrossRef] [Green Version]
- Chang, S.L.; Harding, N.; Zachreson, C.; Cliff, O.; Prokopenko, M. Modelling Transmission and Control of the COVID-19 Pandemic in Australia. Nat. Commun. 2020, 11, 5710. [Google Scholar] [CrossRef]
- Liu, J.; Hao, J.; Sun, Y.; Shi, Z. Network Analysis of Population Flow Among Major Cities and Its Influence on COVID-19 Transmission in China. Cities 2021, 112, 103138. [Google Scholar] [CrossRef]
- Hsiang, S.; Allen, D.; Annan-Phan, S.; Bell, K.; Bolliger, I.; Chong, T.; Druckenmiller, H.; Huang, L.Y.; Hultgren, A.; Krasovich, E.; et al. The Effect of Large-Scale Anti-Contagion Policies on the COVID-19 Pandemic. Nature 2020, 584, 262–267. [Google Scholar] [CrossRef]
- Monios, J.; Wilmsmeier, G. Deep Adaptation to Climate Change in the Maritime Transport Sector: A New Paradigm for Maritime Economics? Marit. Policy Manag. 2020, 47, 853–872. [Google Scholar] [CrossRef]
- World Trade Organization. World Trade Statistical Review 2020; World Trade Organization: Geneva, Switzerland, 2020. [Google Scholar]
- Organisation for Economic Co-Operation and Development. OECD Economic Outlook: Volume 2020; OECD Publishing: Paris, France, 2020. [Google Scholar]
- Notteboom, T.; Pallis, T.; Rodrigue, J.-P. Disruptions and Resilience in Global Container Shipping and Ports: The COVID-19 Pandemic versus the 2008-2009 Financial Crisis. Marit. Econ. Logist. 2021. [Google Scholar] [CrossRef]
- Van Tatenhove, J.P.M. COVID-19 and European Maritime Futures: Different Pathways to Deal with the Pandemic. Marit. Stud. 2021, 20, 63–74. [Google Scholar] [CrossRef]
- Kolesnikova, M. EU Maritime Economy and COVID-19. Contemp. Eur. 2020, 4, 102–111. [Google Scholar] [CrossRef]
- Organisation for Economic Co-Operation and Development. COVID-19 and Global Value Chains: Policy Options to Build. More Resilient Production Networks; OECD Publishing: Paris, France, 2020. [Google Scholar]
- Liu, X.; Liu, Y.; Yan, Y. China Macroeconomic Report 2020: China’s Macroeconomy Is on the Rebound Under the Impact of COVID-19. Econ. Political Stud. 2020, 8, 395–435. [Google Scholar] [CrossRef]
- Nallon, E. COVID-19: A Maritime Perspective. Available online: https://www.maritime-executive.com/blog/covid-19-a-maritime-perspective-1 (accessed on 12 February 2021).
- Mishra, V.K.; Dutta, B.; Goh, M.; Figueira, J.R.; Greco, S. A Robust Ranking of Maritime Connectivity: Revisiting UNCTAD’s Liner Shipping Connectivity Index (LSCI). Marit. Econ. Logist. 2021. [Google Scholar] [CrossRef]
- Handfield, R.; Graham, G.; Burns, L. Corona Virus, Tariffs, Trade Wars and Supply Chain Evolutionary Design. Int. J. Oper. Prod. Manag. 2020, 40, 1649–1660. [Google Scholar] [CrossRef]
- Xi, J. The Governance of China II; Foreign Languages Press: Beijing, China, 2017. [Google Scholar]
- Wiederer, C.K. Logistics Infrastructure Along the Belt and Road Initiative Economies; World Bank Group: Washington, DC, USA, 2018. [Google Scholar]
- State Council of the People’s Republic of China. Vision for Maritime Cooperation under the Belt and Road Initiative. Available online: http://english.www.gov.cn/archive/publications/2017/06/20/content_281475691873460.htm (accessed on 8 February 2021).
- Zhao, L. 3 Sea Routes Planned for Belt & Road Initiative. Available online: http://english.www.gov.cn/state_council/ministries/2017/06/21/content_281475692760102.htm (accessed on 8 February 2021).
- State Council of the People’s Republic of China. China’s Arctic Policy. The State Council Information Office of the People’s Republic of China; The State Council of the People’s Republic of China: Beijing, China, 2018.
- Tillman, H.; Yang, J.; Nielsson, E.T. The Polar Silk Road: China’s New Frontier of International Cooperation. China Q. Int. Strateg. Stud. 2018, 4, 345–362. [Google Scholar] [CrossRef]
- Gao, T. Going North: China’s Role in the Arctic Blue Economic Corridor. In Handbook of Research on International Collaboration, Economic Development, and Sustainability in the Arctic; Erokhin, V., Gao, T., Zhang, X., Eds.; IGI Global: Hershey, PA, USA, 2019; pp. 133–161. [Google Scholar] [CrossRef]
- Bennett, M. North by Northeast: Toward an Asian-Arctic Region. Eurasian Geogr. Econ. 2014, 55, 71–93. [Google Scholar] [CrossRef]
- Stephenson, S.R.; Brigham, L.; Smith, L.C. Marine Accessibility along Russia’s Northern Sea Route. Polar Geogr. 2013, 37, 111–133. [Google Scholar] [CrossRef]
- Meng, Q.; Zhang, Y.; Xu, M. Viability of Transarctic Shipping Routes: A Literature Review from the Navigational and Commercial Perspectives. Marit. Policy Manag. 2017, 44, 16–41. [Google Scholar] [CrossRef]
- Guy, E.; Lasserre, F. Commercial Shipping in the Arctic: New Perspectives, Challenges, and Regulations. Polar Rec. 2016, 3, 1–11. [Google Scholar] [CrossRef]
- Jorgensen-Dahl, A. Future of Resources and Shipping in the Arctic; Centre for High North Logistics: Kirkenes, Norway, 2010. [Google Scholar]
- Zhang, Y.; Meng, Q.; Zhang, L. Is the Northern Sea Route Attractive to Shipping Companies? Some Insights from Recent Ship Traffic Data. Mar. Policy 2016, 73, 53–60. [Google Scholar] [CrossRef]
- Ng, A.K.Y.; Andrews, J.; Babb, D.; Lin, Y.; Becker, A. Implications of Climate Change for Shipping: Opening the Arctic Seas. Wires Clim. Chang. 2018, 9, ee507. [Google Scholar] [CrossRef]
- Becker, A.; Ng, A.K.Y.; McEvoy, D.; Mullett, J. Implications of Climate Change for Shipping: Ports and Supply Chains. Wires Clim. Chang. 2018, 9, ee508. [Google Scholar] [CrossRef] [Green Version]
- Erokhin, V.; Gao, T.; Zhang, X. Handbook of Research on International Collaboration, Economic Development, and Sustainability in the Arctic; IGI Global: Hershey, PA, USA, 2019. [Google Scholar] [CrossRef]
- Xu, H.; Yin, Z.; Jia, D.; Jin, F.; Ouyang, H. The Potential Seasonal Alternative of Asia-Europe Container Service via Northern Sea Route under the Arctic Sea Ice Retreat. Marit. Policy Manag. 2011, 38, 541–560. [Google Scholar] [CrossRef]
- Cao, Y.; Yu, M.; Hui, F.; Zhang, J.; Cheng, X. Review of Navigability Changes in Trans-Arctic Routes. Chin. Sci. Bull. 2021, 66, 21–33. [Google Scholar] [CrossRef]
- Farre, A.B.; Stephenson, S.R.; Chen, L.; Czub, M.; Dai, Y.; Demchev, D.; Efimov, Y.; Graczyk, P.; Grythe, H.; Keil, K.; et al. Commercial Arctic Shipping through the Northeast Passage: Routes, Resources, Governance, Technology, and Infrastructure. Polar Geogr. 2014, 37, 298–324. [Google Scholar] [CrossRef]
- Kikkas, K. International Transport Corridors and the Arctic. Mod. Innov. Res. 2015, 6, 178–184. [Google Scholar]
- Zalyvsky, N. The Northern Sea Route: The Potential of Expectations and the Real Functioning Problems. Arct. North 2015, 20, 32–50. [Google Scholar] [CrossRef]
- Fisenko, A. Geopolitical, Transportation and Economic Aspects of Development the Northern Sea Route in Russia. Transp. Bus. Russ. 2013, 107, 235–238. [Google Scholar]
- Zelentsov, V. Development of Arctic Transportation in Russia. Asia-Pac. J. Mar. Sci. Educ. 2012, 2, 9–16. [Google Scholar]
- Erokhin, V.; Gao, T.; Zhang, X. Arctic Blue Economic Corridor: China’s Role in the Development of a New Connectivity Paradigm in the North. In Arctic Yearbook 2018. Arctic Development: In Theory and in Practice; Heininen, L., Exner-Pirot, H., Eds.; Northern Research Forum: Akureyri, Iceland, 2018; pp. 456–474. [Google Scholar]
- Lasserre, F. Case Studies of Shipping along Arctic Routes. Analysis and Profitability Perspectives for the Container Sector. Transp. Res. Part. A Policy Pract. 2014, 66, 144–161. [Google Scholar] [CrossRef]
- Cariou, P.; Faury, O. Relevance of the Northern Sea Route (NSR) for Bulk Shipping. Transp. Res. Part. A Policy Pract. 2015, 78, 337–346. [Google Scholar] [CrossRef]
- Zhao, H.; Hu, H.; Lin, Y. Study on China-EU Container Shipping Network in the Context of Northern Sea Route. J. Transp. Geogr. 2016, 53, 50–60. [Google Scholar] [CrossRef]
- Peng, Y.; Li, Z.; Zhang, X.; Bao, Q.; Li, X. Prediction on Freight Function Structure of China’s Coastal Ports Under the Polar Silk Road: A Cargo Attraction Potential Perspective. Eurasian Geogr. Econ. 2020. [Google Scholar] [CrossRef]
- Erokhin, V.; Gao, T. Northern Sea Route: An Alternative Transport Corridor within China’s Belt and Road Initiative. In The Belt and Road Initiative: Law, Economics, and Politics; Chaisse, J., Gorski, J., Eds.; Brill Nijhoff: Leiden, The Netherlands, 2018; pp. 146–167. [Google Scholar]
- Enderwick, P. Viewpoint–Could the Belt and Road Initiative Be Derailed? An Analysis of Impediments to Completion. Crit. Perspect. Int. Bus. 2020. [Google Scholar] [CrossRef]
- United Nations Conference on Trade and Development. Liner Shipping Connectivity Index, Quarterly. Available online: https://unctad.org/system/files/official-document/statcpbmn1_en.pdf (accessed on 10 February 2021).
- MDS Transmodal. Data and Models. Available online: https://www.mdst.co.uk/data (accessed on 9 February 2021).
- Lin, P.-C.; Kuo, S.-Y.; Chang, J.-H. The Direct and Spillover Effects of Liner Shipping Connectivity on Merchandise Trade. Marit. Bus. Rev. 2020, 5, 159–173. [Google Scholar] [CrossRef]
- Bartholdi, J.; Jarumaneeroj, P.; Ramudhin, A. A New Connectivity Index for Container Ports. Marit. Econ. Logist. 2016, 18, 231–249. [Google Scholar] [CrossRef] [Green Version]
- Fugazza, M.; Hoffmann, J. Liner Shipping Connectivity as Determinant of Trade. J. Shipp. Trade 2017, 2, 1. [Google Scholar] [CrossRef] [Green Version]
- Minárik, M.; Čiderová, D. The “New Global”: The Role of Cargo Maritime Transport of Goods with focus on the Transportation Corridor between Southeast Asia and Northwestern Europe. Shs Web Conf. 2021, 92, 09010. [Google Scholar] [CrossRef]
- Frazila, R.B.; Zukhruf, F. Measuring Connectivity for Domestic Maritime Transport Network. J. East. Asia Soc. Transp. Stud. 2015, 11, 2363–2376. [Google Scholar] [CrossRef]
- Chang, S.; Huang, Y.; Shang, K.; Chiang, W. Impacts of Regional Integration and Maritime Transport on Trade: With Special Reference to RCEP. Marit. Bus. Rev. 2020, 5, 143–158. [Google Scholar] [CrossRef]
- Şeker, A. The Impacts of Liner Shipping Connectivity and Economic Growth on International Trade Case of European Countries and Turkey. In Handbook of Research on the Applications of International Transportation and Logistics for World Trade; Ceyhun, G.Ç., Ed.; IGI Global: Hershey, PA, USA, 2019; pp. 139–150. [Google Scholar] [CrossRef]
- Panahi, R.; Ghasemi, A.; Golpira, A. Future of Container Shipping in Iranian Ports: Traffic and Connectivity Index Forecast. J. Adv. Transp. 2017, 1, 5847372. [Google Scholar] [CrossRef] [Green Version]
- Jouili, T.A. Determinants of Liner Shipping Connectivity. Int. J. Adv. Appl. Sci. 2019, 6, 5–10. [Google Scholar] [CrossRef]
- Ding, W.; Levine, R.; Lin, C.; Xie, W. Corporate Immunity to the COVID-19 Pandemic; National Bureau of Economic Research: Cambridge, MA, USA, 2020. [Google Scholar] [CrossRef]
- Baber, H. Spillover Effect of COVID19 on the Global Economy. Transnatl. Mark. J. 2020, 8, 177–196. [Google Scholar] [CrossRef]
- Erokhin, V.; Gao, T. Impacts of COVID-19 on Trade and Economic Aspects of Food Security: Evidence from 45 Developing Countries. Int. J. Environ. Res. Public Health 2020, 17, 5775. [Google Scholar] [CrossRef] [PubMed]
- Ceylan, R.F.; Ozkan, B.; Mulazimogullari, E. Historical Evidence for Economic Effects of COVID-19. Eur. J. Health Econ. 2020, 21, 817–823. [Google Scholar] [CrossRef] [PubMed]
- Mityakov, S. COVID-19: Distribution Modeling and Economic Effects. Dev. Secur. 2020, 6, 4–17. [Google Scholar] [CrossRef]
- Bakalis, S.; Valdramidis, V.P.; Argyropoulos, D.; Ahrne, L.; Chen, J.; Cullen, P.J.; Cummins, E.; Datta, A.K.; Emmanouilidis, C.; Foster, T.; et al. Perspectives from CO+RE: How COVID-19 Changed Our Food Systems and Food Security Paradigms. Curr. Res. Food Sci. 2020, 3, 166–172. [Google Scholar] [CrossRef]
- Poudel, P.B.; Poudel, M.R.; Gautam, A.; Phuyal, S.; Tiwari, C.K.; Bashyal, N.; Bashyal, S. COVID-19 and Its Global Impact on Food and Agriculture. J. Biol. Today’s World 2020, 9, 221. [Google Scholar] [CrossRef]
- Bhargava, A.; Jamison, D.T.; Lau, L.J.; Murray, C.J. Modeling the Effects of Health on Economic Growth. J. Health Econ. 2001, 20, 423–440. [Google Scholar] [CrossRef]
- Liang, R.; Liu, Z. Port Infrastructure Connectivity, Logistics Performance and Seaborne Trade on Economic Growth: An Empirical Analysis on “21st-Century Maritime Silk Road”. J. Coast. Res. 2020, 106, 319–324. [Google Scholar] [CrossRef]
- Hu, Z.; Liu, C.; Chen, W.; Wang, Y.; Wei, C. Maritime Convention and Fluctuation between Vietnam and China: A Data-Driven Study. Res. Transp. Bus. Manag. 2020, 34, 100414. [Google Scholar] [CrossRef]
- Bertho, F.; Borchert, I.; Mattoon, A. The Trade Reducing Effects of Restrictions on Liner Shipping. J. Comp. Econ. 2016, 44, 231–242. [Google Scholar] [CrossRef] [Green Version]
- Ceylan, R.F.; Ozkan, B. The Economic Effects of Epidemics: From SARS and MERS to COVID-19. Res. J. Adv. Humanit. 2020, 1, 21–29. [Google Scholar]
- Siddique, A.; Shahzad, A.; Lawler, J.; Mahmoud, K.A.; Lee, D.; Ali, N.; Bilal, M.; Rasool, K. Unprecedented Environmental and Energy Impacts and Challenges of COVID-19 Pandemic. Environ. Res. 2021, 193, 110443. [Google Scholar] [CrossRef] [PubMed]
- Verma, C.; Alrefaee, S.H.; Quraishi, M.A.; Ebenso, E.E.; Hussain, C.M. Environmental, Safety and Economic Risks of COVID-19 Pandemic in Petroleum Industries: A Prospective. J. Pet. Sci. Eng. 2021, 198, 108161. [Google Scholar] [CrossRef]
- Černikovaitė, M.; Karazijienė, Ž. Social-Economic Effects of the COVID-19 Pandemic in Lithuania. Shs Web Conf. 2021, 92, 01006. [Google Scholar] [CrossRef]
- Leach, M.; MacGregor, H.; Scoones, I.; Wilkinson, A. Post-Pandemic Transformations: How and Why COVID-19 Requires Us to Rethink Development. World Dev. 2021, 138, 105233. [Google Scholar] [CrossRef]
- Egger, D.; Miguel, E.; Warren, S.; Shenoy, A.; Elliott, K.; Parkerson, D.; Mobarak, M.; Fink, G.; Udry, C.; Walker, M.; et al. Falling Living Standards during the COVID-19 Crisis: Quantitative Evidence from Nine Developing Countries. Sci. Adv. 2021, 7, eabe0997. [Google Scholar] [CrossRef]
- United Nations Conference on Trade and Development. UNCTAD Commodity Price Index. Methodological Note. Available online: https://unctadstat.unctad.org/wds/TableViewer/summary.aspx (accessed on 9 February 2021).
- Rosatom. Northern Sea Route 2020; Rosatom: Moscow, Russia, 2021. [Google Scholar]
- United Nations Conference on Trade and Development. Data Center. Available online: https://unctadstat.unctad.org/EN/ (accessed on 8 February 2021).
- Johns Hopkins University of Medicine. COVID-19 Dashboard. Available online: https://coronavirus.jhu.edu/map.html (accessed on 10 February 2021).
- Our World in Data. Coronavirus (COVID-19) Deaths. Available online: https://ourworldindata.org/covid-deaths?country=IND~USA~GBR~CAN~DEU~FRA#citation-citation (accessed on 10 February 2021).
- Chang, T.; Lee, K.-C.; Kang, S.-C.; Liu, W.-C. Is Per Capita Real GDP Stationary in Latin American Countries? Evidence from a Panel Stationary Test with Structural Breaks. Econ. Bull. 2008, 31, 1–12. [Google Scholar]
- Bahmani-Oskooee, M.; Chang, T.; Wu, T. Revisiting Purchasing Power Parity in African Countries: Panel Stationary Test with Sharp and Smooth Breaks. Appl. Financ. Econ. 2014, 24, 1429–1438. [Google Scholar] [CrossRef]
- Dickey, D.A.; Fuller, W.A. Likelihood Ratio Statistics for Autoregressive Time Series with a Unit Root. Econometrica 1981, 49, 1057–1072. [Google Scholar] [CrossRef]
- Phillips, P.C.; Perron, P. Testing for a Unit Root in Time Series Regression. Biometrika 1988, 75, 335–346. [Google Scholar] [CrossRef]
- Chang, T.; Chiang, G.; Zhang, Y. Is Volume Index of GDP Per Capita Stationary in OECD Countries? Panel Stationary Tests with Structural Breaks. Econ. Bull. 2009, 29, 588–598. [Google Scholar]
- Hoarau, J.-F. Testing PPP for Central American Real Exchange Rates. Evidence from New Panel Data Stationary Tests with Structural Breaks. Econ. Bull. 2008, 21, 1–5. [Google Scholar]
- Herwartz, H.; Reimers, H.E. Panel Nonstationary Tests of the Fisher Hypothesis: An Analysis of 114 Economies during the Period 1960–2004. Appl. Econom. Int. Dev. 2006, 6, 37–55. [Google Scholar]
- Aliyev, K.; Dehning, B.; Nadirov, O. Modelling the Impact of Fiscal Policy on Non-Oil GDP in a Resource Rich Country: Evidence from Azerbaijan. Acta Univ. Agric. Et Silvic. Mendel. Brun. 2016, 64, 1869–1878. [Google Scholar] [CrossRef] [Green Version]
- Pesaran, M.H.; Shin, Y.; Smith, R.J. Bounds Testing Approaches to the Analysis of Level Relationships. J. Appl. Econom. 2001, 16, 289–326. [Google Scholar] [CrossRef]
- Duasa, J. The Determinants of Malaysian Trade Balance: An ARDL Bound Testing Approach. Glob. Econ. Rev. 2007, 36, 89–102. [Google Scholar] [CrossRef]
- Ghosh, S. Import Demand of Crude Oil and Economic Growth: Evidence from India. Energy Policy 2009, 37, 699–702. [Google Scholar] [CrossRef]
- Raghuramapatruni, R.; Chaitanya, R.V.S. An Appraisal of the Impact of International Trade on Economic Growth of India–through the ARDL Approach. Int. J. Econ. Bus. Adm. 2020, 8, 376–387. [Google Scholar] [CrossRef]
- Oluwafemi, I.J.; Laseinde, O.T. Macroeconomic as Basis of Economic Growth: An ARDL Approach. J. Phys. Conf. Ser. 2019, 1378, 042073. [Google Scholar] [CrossRef]
- Adebayo, T.S. New Insights into Export-Growth Nexus: Wavelet and Causality Approaches. Asian J. Econ. Bus. Account. 2020, 15, 32–44. [Google Scholar] [CrossRef]
- Rhee, H.J. ARDL-Bounds Testing Approaches to the Factor Price Equalization: The Case of Korea, U.S. and Japan. Int. Area Stud. Rev. 2011, 15, 101–123. [Google Scholar]
- Alqaralleh, H. Stock Return-Inflation Nexus; Revisited Evidence Based on Nonlinear ARDL. J. Appl. Econ. 2020, 23, 66–74. [Google Scholar] [CrossRef] [Green Version]
- Musa, A.B.; Danlami, I.A.; Elijah, S. The Asymmetric Effect of Currency Devaluation on Inflation in Malaysia; Evidence from Non-Linear ARDL. Int. J. Recent Technol. Eng. 2019, 8, 455–460. [Google Scholar]
- Ebrahimi, P.; Alipour, H.; Gholampour, A.; Ahmadi, M. Social Networks, Exchange Rate Fluctuation, and Economic Growth: ARDL Approach. Tékhne Rev. Appl. Manag. Stud. 2019, 17, 1–9. [Google Scholar] [CrossRef] [Green Version]
- Omotayo, O.H.; Ayomitunde, A.T.; Afolakemi, A.O.; Aromoke, O.O. Health, Agricultural Expenditure and Economic Growth in Nigeria: ARDL and ECM Approach. Int. J. New Econ. Soc. Sci. 2019, 10, 127–138. [Google Scholar] [CrossRef]
- Yuzbashkandi, S.S.; Sadi, M.A. Petroleum Production Impacts on the Economic Growth of the OPEC Countries: Panel ARDL Approach. SN Appl. Sci. 2020, 2, 693. [Google Scholar] [CrossRef] [Green Version]
- Pasha, A.; Ramzan, M. Asymmetric Impact of Economic Value-Added Dynamics on Market Value of Stocks in Pakistan Stock Exchange, a New Evidence from Panel Cointegration, FMOLS and DOLS. Cogent Bus. Manag. 2019, 6, 1653544. [Google Scholar] [CrossRef]
- Priyankara, E.A.C. The Long-run Effect of Services Exports on Total Factor Productivity Growth in Sri Lanka: Based on ARDL, FMOLS, CCR, and DOLS Approaches. Int. J. Acad. Res. Bus. Soc. Sci. 2018, 8, 240–258. [Google Scholar] [CrossRef]
- Bashier, A.A.; Siam, A.J. Immigration and Economic Growth in Jordan: FMOLS Approach. Int. J. Humanit. Soc. Sci. Educ. 2014, 9, 85–92. [Google Scholar]
- Stock, J.H.; Watson, M. A Simple Estimator of Cointegrating Vectors in Higher Order Integrated Systems. Econometrica 1993, 61, 783–820. [Google Scholar] [CrossRef]
- Kurozumi, E.; Hayakawa, K. Asymptotic Properties of the Efficient Estimators for Cointegrating Regression Models with Serially Dependent Errors. J. Econom. 2009, 149, 118–135. [Google Scholar] [CrossRef] [Green Version]
- Toda, H.Y.; Yamamoto, T. Statistical Inference in Vector Autoregressions with Possibly Integrated Processes. J. Econom. 1995, 66, 225–250. [Google Scholar] [CrossRef]
- Belaid, F.; Ben Amar, A.; Goutte, S.; Guesmi, K. Emerging and Advanced Economies Markets Behaviour during the COVID-19 Crisis Era. Int. J. Financ. Econ. 2021. [Google Scholar] [CrossRef]
- Ben Amar, A.; Hachicha, N.; Halouani, N. Is There a Shift Contagion among Stock Markets during the COVID-19 Crisis? Further Insights from TYDL Causality Test. Int. Rev. Appl. Econ. 2020, 35, 188–209. [Google Scholar] [CrossRef]
- Amiri, A.; Ventelou, B. Granger Causality between Total Expenditure on Health and GDP in OECD: Evidence from the Toda-Yamamoto Approach. Econ. Lett. 2012, 116, 541–544. [Google Scholar] [CrossRef]
- Soytas, U.; Sari, R.; Hammoudeh, S.; Hacihasanoglu, E. World Oil Prices, Precious Metal Prices and Macroeconomy in Turkey. Energy Policy 2009, 37, 5557–5566. [Google Scholar] [CrossRef]
- International Maritime Organization. Coronavirus Disease (COVID-19) Pandemic. Available online: https://www.imo.org/en/MediaCentre/HotTopics/Pages/Coronavirus.aspx (accessed on 19 February 2021).
- International Chamber of Shipping. COVID-19. Available online: https://www.ics-shipping.org/supporting-shipping/covid/ (accessed on 19 February 2021).
- McKibbin, W.; Fernando, R. The Global Macroeconomic Impacts of COVID-19: Seven Scenarios; Australian National University: Canberra, Australia, 2020. [Google Scholar] [CrossRef] [Green Version]
- Doumbia-Henry, C. Shipping and COVID-19: Protecting Seafarers as Frontline Workers. Wmu J. Marit. Aff. 2020, 19, 279–293. [Google Scholar] [CrossRef]
- Gutsulyak, V. Legal Regulation of Merchant Ships Entering Foreign Ports in Conditions of the COVID-19 Pandemic. State Law 2020, 7, 100–110. [Google Scholar] [CrossRef]
- Taskin, M. Assessment of the Effects of COVID-19 Pandemic on Time Charter Contracts in the Context of “Off-Hire” Clause. Istanb. Hukuk Mecm. 2020, 78, 333–362. [Google Scholar]
- Samli, K.Y. The Effects of the COVID-19 Pandemic on Maritime Carrier’s Liability and Right to Recover Freight Charges. Istanb. Hukuk Mecm. 2020, 78, 299–331. [Google Scholar] [CrossRef]
- Koyuncu, K.; Tavacioğlu, L.; Gökmen, N.; Arican, U.C. Forecasting COVID-19 Impact on RWI/ISL Container Throughput Index by Using SARIMA Models. Marit. Policy Manag. 2021. [Google Scholar] [CrossRef]
- Deb, P.; Furceri, D.; Ostry, J.O.; Tawk, N. The Economic Effects of COVID-19 Containment Measure; International Monetary Fund: Washington, DC, USA, 2020. [Google Scholar]
- Chinazzi, M.; Davis, J.T.; Ajelli, M.; Gioannini, C.; Litvinova, M.; Merler, S.; Pastore, Y.; Piontti, A.; Mu, K.; Rossi, L.; et al. The Effect of Travel Restrictions on the Spread of the 2019 Novel Coronavirus (COVID-19) Outbreak. Science 2020, 368, 395–400. [Google Scholar] [CrossRef] [Green Version]
- Glatter, R. Covid-19 Coronavirus Can Survive in Frozen Meat and Fish for up to 3 Weeks, Study Finds. Available online: https://www.forbes.com/sites/robertglatter/2020/08/23/covid-19-coronavirus-can-survive-on-frozen-meat-and-fish-for-up-to-3-weeks-study-finds/?sh=28d543088774 (accessed on 20 February 2021).
- Gan, N. China Turns Its Attention to Frozen Foods in Battle to Eliminate Virus Threat, but Experts Remain Skeptical. Available online: https://edition.cnn.com/2020/11/13/health/china-frozen-food-coronavirus-intl-hnk/index.html (accessed on 20 February 2021).
- Seaman, T. China Finds Live Coronavirus Trace on Fish Packaging in World First. Available online: https://www.undercurrentnews.com/2020/10/17/china-finds-live-coronavirus-trace-on-fish-packaging-in-world-first/ (accessed on 20 February 2021).
- Xinhuanet. China Suspends Imports from Norwegian Aquatic Producer over Coronavirus. Available online: http://xinhuanet.com/english/2020-09/23/c_139390020.htm (accessed on 20 February 2021).
- News.ru. China Closes Ports for Fish Imports from Russia. Available online: https://news.ru/en/economics/china-closes-ports-for-fish-imports-from-russia/ (accessed on 20 February 2021).
- Sergeev, G. The Twilight of Neoliberal Globalization. Terra Econ. 2020, 18, 67–77. [Google Scholar] [CrossRef]
- Garcia-Weil, A. COVID-19 and Its Effects on the Asymmetry of the EU-China Relations: Towards a New Economic Paradigm? Araucaria. Rev. Iberoam. Filos. PolíticaHumanid. Y Relac. Int. 2020, 22, 405–432. [Google Scholar] [CrossRef]
- Perrone, A. COVID-19: Crisis of Globalization and “Revenge of the Border”. The Effects of the Pandemic on the World Economic and Political Future. Doc. Geogr. 2020, 1, 307–320. [Google Scholar] [CrossRef]
- He, L.; Lin, X.; Zhang, Z. The Impact of De-Globalization on China’s Economic Transformation: Evidence from Manufacturing Sector. J. Policy Modeling 2020, 42, 628–660. [Google Scholar] [CrossRef]
- Albertoni, N.; Wise, C. International Trade Norms in the Age of Covid-19 Nationalism on the Rise? Fudan J. Humanit. Soc. Sci. 2020, 14, 41–66. [Google Scholar] [CrossRef]
- Ibn-Mohammed, T.; Mustapha, K.B.; Godsell, J.; Adamu, Z.; Babatunde, K.A.; Akintade, D.D.; Acquaye, A.; Fujii, H.; Ndiaye, M.M.; Yamoah, F.A.; et al. A Critical Analysis of the Impacts of CIVID-19 on the Global Economy and Ecosystems and Opportunities for Circular Economy Strategies. Resour. Conserv. Recycl. 2021, 164, 105169. [Google Scholar] [CrossRef] [PubMed]
- Qin, M.; Liu, X.; Zhou, X. COVID-19 Shock and Global Value Chains: Is There a Substitute for China? Emerg. Mark. Financ. Trade 2020, 56, 3588–3598. [Google Scholar] [CrossRef]
- Flock Freight. How to Build a Pandemic-Proof Global Supply Chain. Available online: https://www.sdcexec.com/risk-compliance/whitepaper/21136210/flock-freight-how-to-build-a-pandemicproof-global-supply-chain (accessed on 12 February 2021).
- Vidya, C.T.; Prabheesh, K.P. Implications of COVID-19 Pandemic on the Global Trade Networks. Emerg. Mark. Financ. Trade 2020, 56, 2408–2421. [Google Scholar] [CrossRef]
- Che, Y.; Liu, W.; Zhang, Y.; Zhao, L. China’s Exports during the Global COVID-19 Pandemic. Front. Econ. China 2020, 15, 541–574. [Google Scholar] [CrossRef]
- Sand, P. Dry Bulk Shipping: No Quick Recovery for the Dry Bulk Market as COVID-19 Digs Deeper. Available online: https://www.bimco.org/news/market_analysis/2020/20200526_dry_bulk_shipping (accessed on 12 February 2021).
- Adekoya, O.; Oliyide, J. The Hedging Effectiveness of Industrial Metals Against Different Oil Shocks: Evidence from the Four Newly Developed Oil Shocks Datasets. Resour. Policy 2020, 69, 101831. [Google Scholar] [CrossRef]
- Wu, C.; Wang, X.; Luo, S.; Shan, J.; Wang, F. Influencing Factors Analysis of Crude Oil Futures Price Volatility Based on Mixed-Frequency Data. Appl. Sci. 2020, 10, 8393. [Google Scholar] [CrossRef]
- Demirer, R.; Gupta, R.; Pierdzioch, C.; Shahzad, S.J.H. The Predictive Power of Oil Price Shocks on Realized Volatility of Oil: A Note. Resour. Policy 2020, 69, 101856. [Google Scholar] [CrossRef]
- Nyga-Lukaszewska, H.; Aruga, K. Energy Prices and COVID-Immunity: The Case of Crude Oil and Natural Gas Prices in the US and Japan. Energies 2020, 13, 6300. [Google Scholar] [CrossRef]
- Moon, J.; Jung, T.Y. A Critical Review of Korea’s Long-Term Contract for Renewable Energy Auctions: The Relationship between the Import Price of Liquefied Natural Gas and System Marginal Price. Util. Policy 2020, 67, 101132. [Google Scholar] [CrossRef]
- Ge, J.; Polhill, G.; Macdiarmid, J.; Fitton, N.; Smith, P.; Clark, H.; Dawson, T.; Aphale, M. Food and Nutrition Security Under Global Trade: A Relation-Driven Agent-Based Global Trade Model. R. Soc. Open Sci. 2021, 8, 201587. [Google Scholar] [CrossRef]
- Lin, B.; Zhang, Y. Impact of the COVID-19 Pandemic on Agricultural Exports. J. Integr. Agric. 2020, 19, 2937–2945. [Google Scholar] [CrossRef]
- Froehlich, H.; Gentry, R.; Lester, S.; Cottrell, R.; Fay, G.; Branch, T.; Gephart, J.; White, E.; Baum, J. Securing a Sustainable Future for US Seafood in the Wake of a Global Crisis. Mar. Policy 2021, 124, 104328. [Google Scholar] [CrossRef]
- Wang, Y.; Wang, J.; Wang, X. COVID-19, Supply Chain Disruption and China’s Hog Market: A Dynamic Analysis. China Agric. Econ. Rev. 2020, 12, 427–443. [Google Scholar] [CrossRef]
- Cao, L.; Li, T.; Wang, R.; Zhu, J. Impact of COVID-19 on China’s Agricultural Trade. China Agric. Econ. Rev. 2020, 13, 1–21. [Google Scholar] [CrossRef]
Figure 1.
Countries and ports included in the study. Note: 1 = China: Dalian; 2= China: Lianyungang; 3 = China: Qingdao; 4 = China: Qinhuangdao; 5 = China: Rizhao; 6 = China: Shanghai; 7 = China: Weihai; 8 = China: Yantai; 9 = Denmark: Aarhus; 10 = Denmark: Copenhagen; 11 = Greenland: Nuuk; 12 = Iceland: Reydharfjordur; 13 = Iceland: Reykjavik; 14 = Japan: Akita; 15 = Japan: Hakata; 16 = Japan: Kitakyushu; 17 = Japan: Niigata; 18 = Norway: Bergen; 19 = Norway: Hammerfest; 20 = Norway: Stavanger; 21 = Norway: Tromso; 22 = Norway: Trondheim; 23 = Russia: Anadyr; 24 = Russia: Arkhangelsk; 25 = Russia: Dudinka; 26 = Russia: Murmansk; 27 = Russia: Petropavlovsk; 28 = Russia: Pevek; 29 = Russia: Sabetta; 30 = Russia: Vladivostok; 31 = South Korea: Gwangyang; 32 = South Korea: Pusan; 33 = South Korea: Ulsan; 34 = Sweden: Gothenburg; 35 = Sweden: Halmstad. Source: Authors’ development.
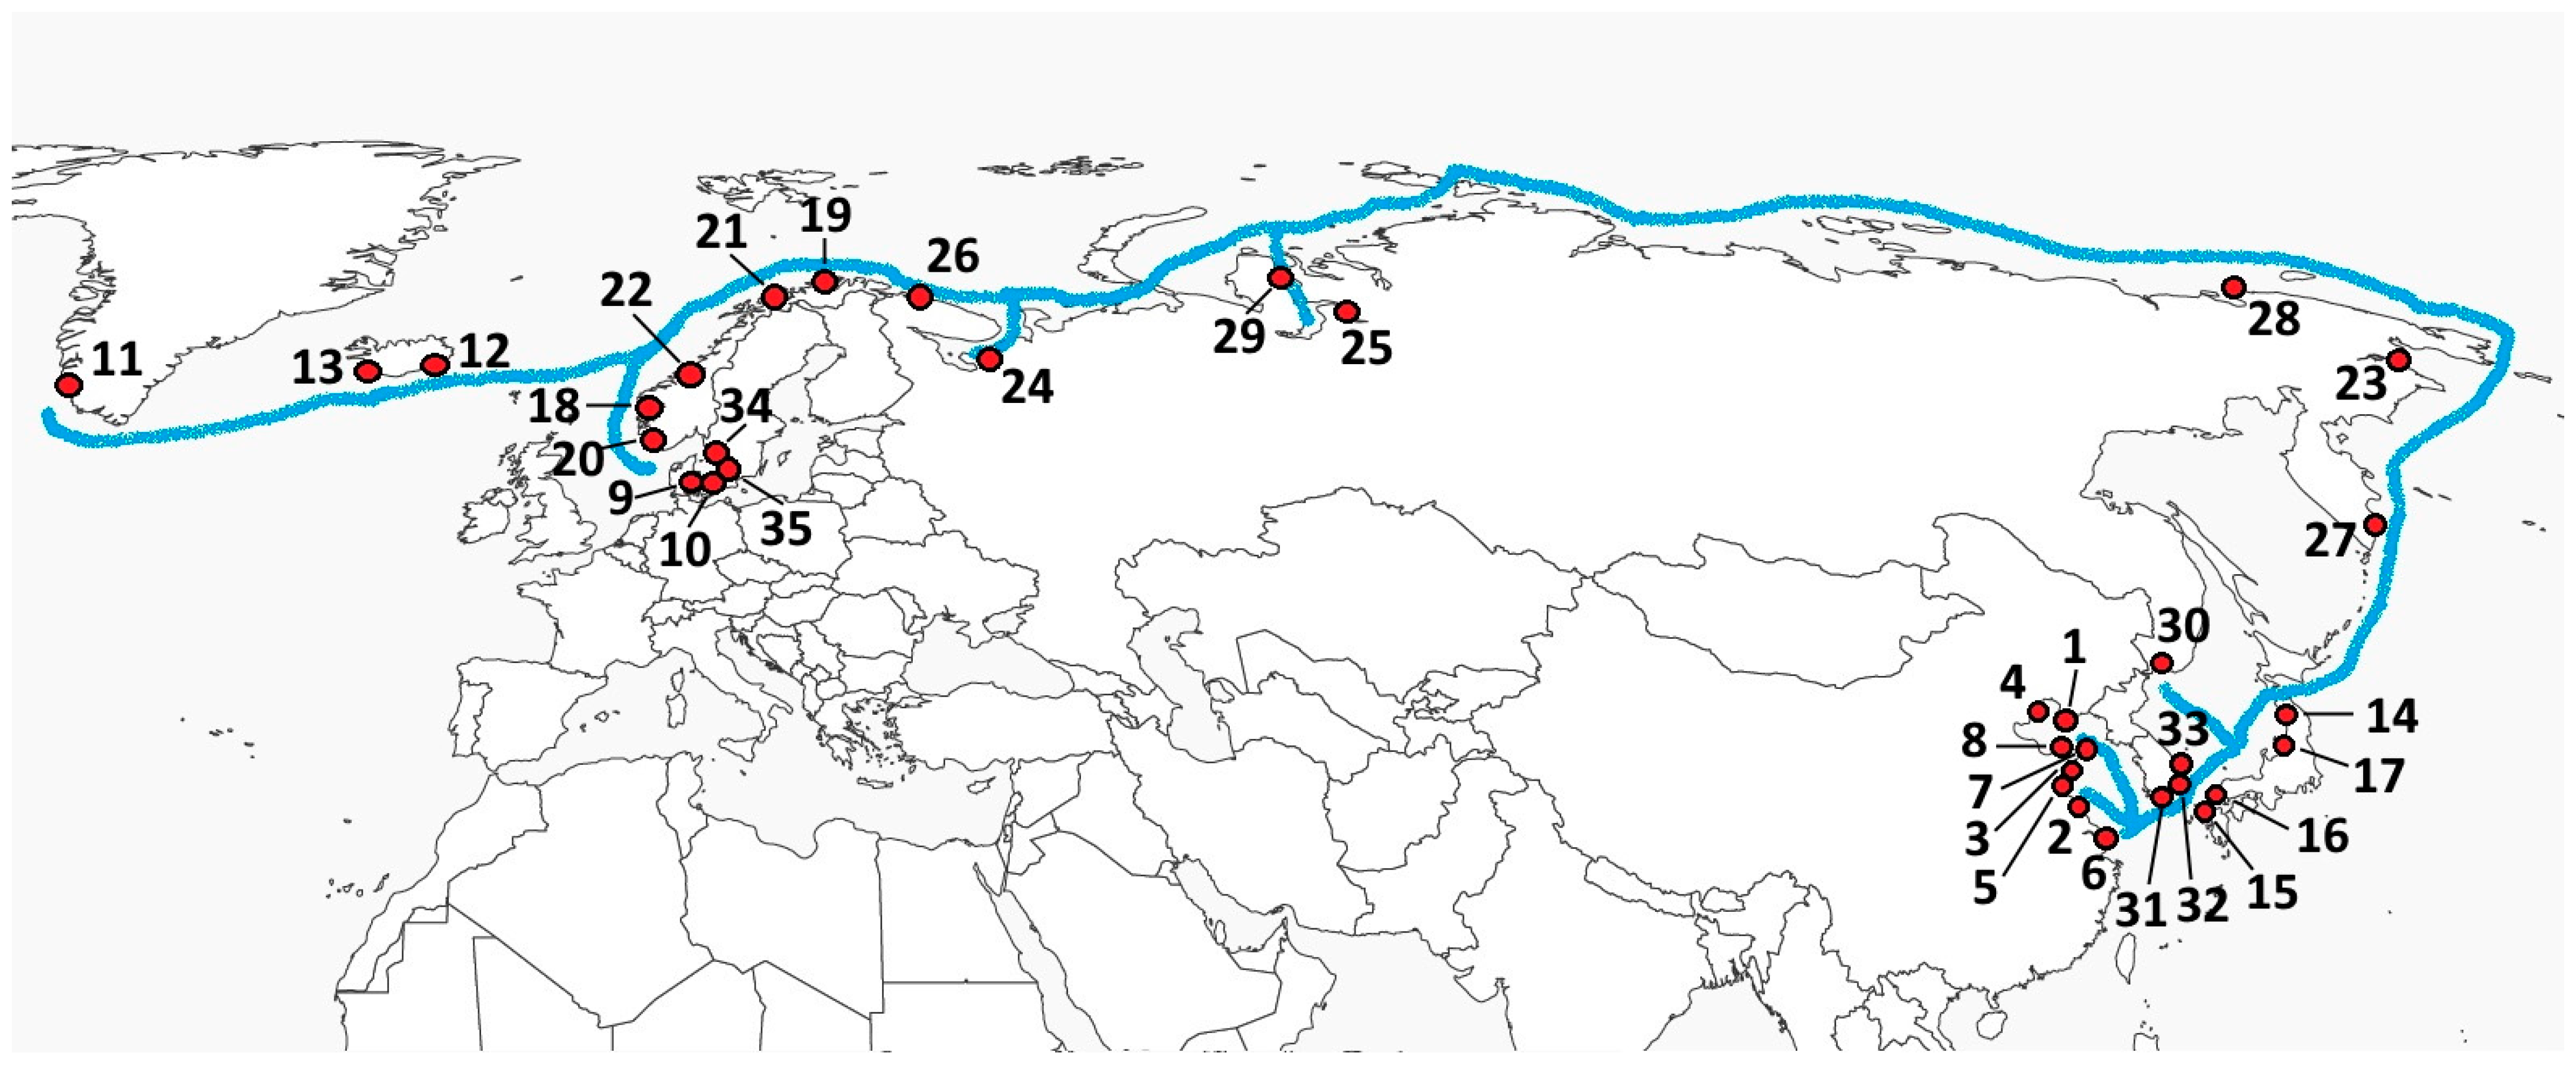
Figure 2.
Study algorithm. Source: Authors’ development.
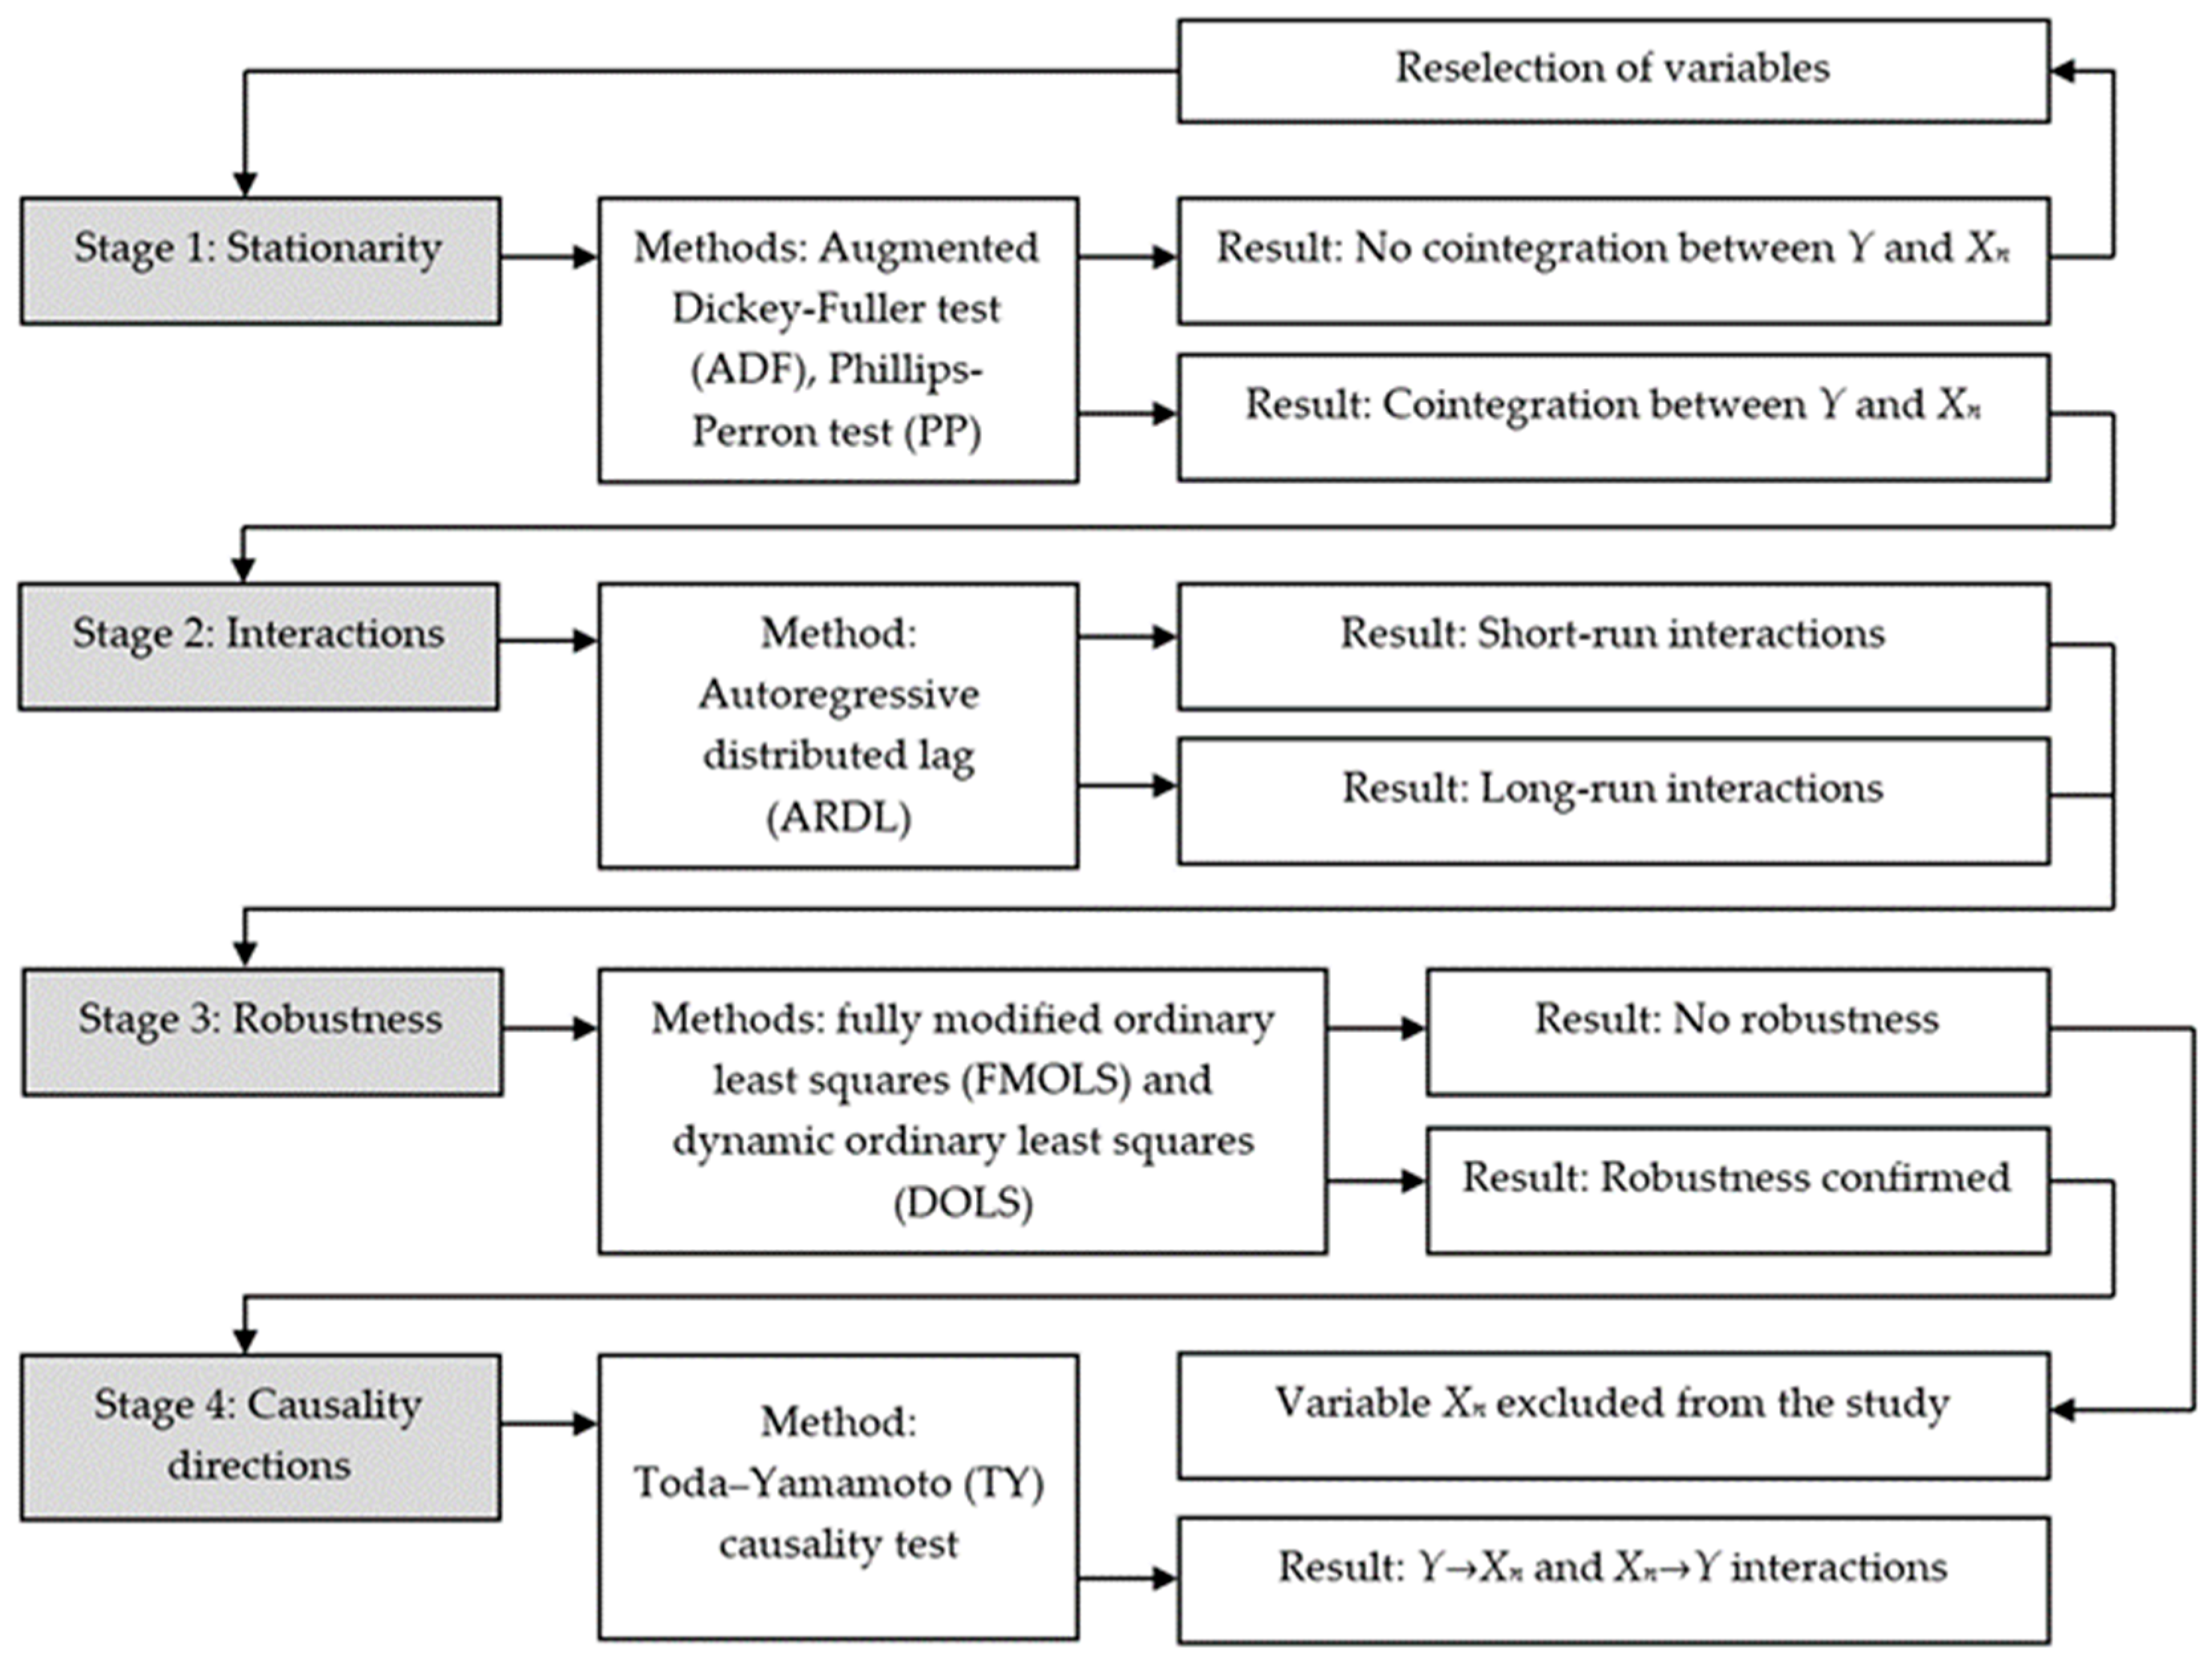
Table 2.
Bound test results, countries.
| Countries | F-Statistics | |
|---|---|---|
| 2015–2019 | 2020 | |
| China | 13.5743 | 14.0719 |
| Denmark | 10.1720 | 9.1427 |
| Iceland | 11.4866 | 8.3820 |
| Japan | 20.0552 | 21.5932 |
| Norway | 9.4003 | 10.6315 |
| Russia | 7.1465 | 8.4988 |
| South Korea | 14.9028 | 13.1100 |
| Sweden | 8.4991 | 9.1451 |
Source: Authors’ calculation.
Table 3.
ARDL short-run estimates, countries, 2015–2019.
| Country | Parameter | ∆X3 | ∆X4 | ∆X5 | ∆X6 | ∆X7 | ∆X8 | ∆X9 | ∆X10 | ECM |
|---|---|---|---|---|---|---|---|---|---|---|
| China | Coefficient | 0.1311 | 0.1785 | 0.2524 | 0.2206 | 0.0411 | −0.1552 | −0.0207 | −0.0561 | 0.2301 |
| t-stat | 3.2059 | −4.0693 | 2.9733 | −3.5291 | 1.5634 | 2.0591 | 3.1298 | 3.8298 | 2.7428 | |
| Prob | 0.4052 ** | 0.2951 ** | 0.6021 ** | 0.4904 ** | 0.2830 ** | 0.2756 ** | 0.2885 *** | 0.1407 *** | 0.1082 ** | |
| Denmark | Coefficient | 0.0820 | 0.1694 | 0.0846 | 0.0337 | 0.1029 | −0.0147 | 0.0759 | 0.0934 | −0.0503 |
| t-stat | 2.4392 | −2.2942 | 3.0920 | −3.1108 | 1.1406 | −4.8388 | 3.0746 | 4.5055 | 1.5509 | |
| Prob | 0.3501 ** | 0.2909 ** | 0.1701 ** | 0.2235 * | 0.1773 ** | 0.0440 * | 0.0005 ** | 0.0122 ** | 0.2182 * | |
| Iceland | Coefficient | 0.5100 | 0.4535 | 0.3335 | 0.1609 | 0.5002 | −0.0609 | 0.0642 | 0.0316 | 0.0335 |
| t-stat | −2.4027 | 3.5400 | −2.2852 | 2.5574 | −1.0043 | −3.6201 | 1.3866 | 2.0434 | 4.5820 | |
| Prob | 0.1823 *** | 0.7512 ** | 0.3977 ** | 0.1000 ** | 0.1904 *** | 0.0003 * | 0.0013 ** | 0.0608 ** | 0.0444 ** | |
| Japan | Coefficient | 0.7544 | 0.6524 | 0.3144 | 0.3207 | 0.5194 | 0.2451 | −0.1018 | −0.1527 | −0.1607 |
| t-stat | 1.4156 | 2.1003 | −3.5023 | −2.2909 | 1.3663 | 1.2945 | 2.4083 | 2.4091 | −2.3076 | |
| Prob | 0.3723 *** | 0.8201 *** | 0.4141 *** | 0.3410 *** | 0.3065 *** | 0.1777 ** | 0.3091 *** | 0.4866 *** | 0.6389 *** | |
| Norway | Coefficient | 0.0942 | 0.0805 | 0.1507 | 0.2154 | 0.2011 | 0.5519 | 0.0504 | 0.0238 | 0.2492 |
| t-stat | 2.2709 | 2.2664 | −1.1578 | −1.2388 | 1.7747 | 3.0004 | −2.4025 | −2.0777 | −1.4883 | |
| Prob | 0.1114 ** | 0.2005 ** | 0.1942 ** | 0.0000 ** | 0.3029 ** | 0.7035 *** | 0.0412 ** | 0.0561 ** | 0.1994 ** | |
| Russia | Coefficient | 0.0826 | 0.1904 | 0.0549 | 0.0662 | 0.1413 | −0.0501 | 0.0152 | 0.0105 | −0.3596 |
| t-stat | −2.1527 | −1.5388 | −2.0285 | −2.4019 | 2.0285 | −2.0483 | 3.7498 | 3.1023 | 3.8537 | |
| Prob | 0.3491 * | 0.4021 ** | 0.0083 ** | 0.2898 * | 0.2474 ** | 0.0015 ** | 0.1753 ** | 0.1591 * | 0.4374 * | |
| South Korea | Coefficient | 0.2409 | 0.3502 | 0.3046 | 0.2326 | 0.4140 | 0.0930 | −0.0502 | −0.1287 | 0.1665 |
| t-stat | 1.3000 | 1.5556 | 3.1774 | 1.5092 | 2.8287 | −1.6282 | 3.0006 | 2.4272 | 1.6097 | |
| Prob | 0.3917 *** | 0.4834 *** | 0.2395 *** | 0.3316 *** | 0.5286 ** | 0.0101 ** | 0.1284 *** | 0.1485 *** | 0.1116 *** | |
| Sweden | Coefficient | 0.2003 | 0.2013 | 0.2090 | 0.1700 | 0.1104 | −0.0674 | 0.0166 | 0.0903 | −0.2208 |
| t-stat | −4.4627 | −3.5508 | −1.3286 | −2.0446 | 2.0537 | −2.1260 | 2.0845 | 1.5396 | −2.2754 | |
| Prob | 0.2509 ** | 0.3627 ** | 0.1298 ** | 0.2679 * | 0.2952 ** | 0.1305 * | 0.0127 * | 0.1877 * | 0.1377 * |
Note: *, **, *** = significance at 10% level, 5% level, and 1% level, respectively. Source: Authors’ calculation.
Table 4.
ARDL short-run estimates, countries, 2020.
| Country | Parameter | ∆X1 | ∆X2 | ∆X3 | ∆X4 | ∆X5 | ∆X6 | ∆X7 | ∆X8 | ∆X9 | ∆X10 | ECM |
|---|---|---|---|---|---|---|---|---|---|---|---|---|
| China | Coefficient | −0.0172 | 0.0029 | 0.1205 | 0.1693 | 0.2412 | 0.1984 | 0.0255 | −0.1303 | −0.0145 | −0.0403 | 0.1977 |
| t-stat | 1.1928 | 2.4802 | 4.2918 | −5.4827 | 3.6980 | −4.0015 | 1.1983 | 2.4550 | 3.0961 | 4.9522 | 3.9584 | |
| Prob | 0.0193 * | 0.0337 ** | 0.5891 ** | 0.4094 ** | 0.2295 ** | 0.3791 ** | 0.0142 * | 0.1876 ** | 0.0198 *** | 0.0361 *** | 0.2951 ** | |
| Denmark | Coefficient | −0.0040 | −0.0101 | 0.0977 | 0.1185 | 0.0381 | 0.0270 | 0.1309 | −0.0095 | 0.0842 | 0.0720 | −0.0303 |
| t-stat | 3.2801 | 2.1798 | 2.9063 | −1.0391 | 3.8555 | −4.0053 | 2.6178 | −3.9487 | 4.4275 | 5.2973 | 2.4981 | |
| Prob | 0.1225 * | 0.3415 * | 0.2988 ** | 0.0794 ** | 0.1862 * | 0.2062 * | 0.0526 ** | 0.0293 * | 0.0860 * | 0.0056 * | 0.0922 * | |
| Iceland | Coefficient | 0.0027 | 0.0064 | 0.4954 | 0.4286 | 0.3004 | 0.1487 | 0.4550 | −0.0008 | 0.0555 | 0.0064 | 0.0193 |
| t-stat | 2.9024 | 3.0540 | −3.1171 | 4.6032 | −3.0978 | 3.8684 | −1.2095 | −2.5365 | 1.4736 | 2.9021 | 3.6466 | |
| Prob | 0.2870 * | 0.1996 * | 0.2095 *** | 0.3117 *** | 0.2719 ** | 0.1396 ** | 0.0281 *** | 0.0000 * | 0.0001 ** | 0.0003 ** | 0.0295 ** | |
| Japan | Coefficient | −0.3015 | −0.1855 | 0.7926 | 0.6860 | 0.2981 | 0.3106 | 0.5527 | 0.2117 | −0.1204 | −0.1835 | −0.1320 |
| t-stat | −3.5523 | −2.8473 | 1.5930 | 2.4877 | −3.9615 | −2.5493 | 1.4902 | 2.0836 | 3.9223 | 2.8504 | −1.4955 | |
| Prob | 0.4984 *** | 0.3861 *** | 0.5983 *** | 0.6994 *** | 0.2755 *** | 0.3987 *** | 0.2653 *** | 0.0584 ** | 0.1887 *** | 0.2309 *** | 0.3091 *** | |
| Norway | Coefficient | −0.0452 | −0.0384 | 0.0527 | 0.0695 | 0.1141 | 0.2095 | 0.1844 | 0.5763 | 0.0646 | 0.0053 | 0.2094 |
| t-stat | −1.0836 | −2.3918 | 3.1951 | 2.7070 | −1.0479 | −1.1704 | 2.0596 | 3.4609 | −1.2984 | −2.5918 | −1.0672 | |
| Prob | 0.1179 ** | 0.3251 ** | 0.0592 ** | 0.0486 ** | 0.0185 * | 0.0278 * | 0.1035 ** | 0.8848 *** | 0.0390 ** | 0.0442 ** | 0.0333 ** | |
| Russia | Coefficient | 0.0041 | 0.0292 | 0.0689 | 0.1274 | 0.0202 | 0.0385 | 0.1300 | −0.0487 | 0.0053 | 0.0127 | −0.3890 |
| t-stat | 4.8560 | 3.6005 | −2.0576 | −1.7066 | −2.2367 | −1.5092 | 2.5982 | −3.1052 | 1.5295 | 2.0004 | 4.1987 | |
| Prob | 0.2957 ** | 0.3146 ** | 0.2208 * | 0.3517 * | 0.1985 * | 0.0188 * | 0.2397 * | 0.0006 * | 0.0049 * | 0.1156 * | 0.4912 * | |
| South Korea | Coefficient | 0.0666 | 0.0718 | 0.2985 | 0.3020 | 0.2563 | 0.1900 | 0.4005 | 0.0825 | −0.0415 | −0.0923 | 0.1475 |
| t-stat | −2.1947 | −2.0987 | 1.6096 | 1.8044 | 2.0054 | 1.4553 | 2.6360 | −1.4044 | 2.4986 | 2.8921 | 1.8259 | |
| Prob | 0.3021 *** | 0.2451 *** | 0.1239 *** | 0.2508 *** | 0.1946 *** | 0.3409 *** | 0.6931 ** | 0.0036 ** | 0.0318 *** | 0.0197 *** | 0.0504 *** | |
| Sweden | Coefficient | 0.0003 | 0.0036 | 0.1753 | 0.2113 | 0.2291 | 0.1486 | 0.1054 | −0.0592 | 0.0014 | 0.0965 | −0.2095 |
| t-stat | 1.6398 | 2.4019 | −5.5094 | −4.3005 | −1.1982 | −2.3075 | 1.9945 | −3.0758 | 1.7095 | 2.0349 | −3.1199 | |
| Prob | 0.0520 * | 0.0481 * | 0.1398 ** | 0.1864 ** | 0.0097 * | 0.0392 * | 0.1708 ** | 0.0505 * | 0.0000 * | 0.0038 * | 0.0008 * |
Note: *, **, *** = significance at 10% level, 5% level, and 1% level, respectively. Source: Authors’ calculation.
Table 5.
ARDL long-run estimates, countries, 2015–2019.
| Country | Parameter | X3 | X4 | X5 | X6 | X7 | X8 | X9 | X10 | Constant |
|---|---|---|---|---|---|---|---|---|---|---|
| China | Coefficient | 0.1523 | 0.1620 | 0.2208 | 0.2019 | 0.0506 | −0.1713 | −0.0499 | −0.0668 | 3.2612 |
| t-stat | 3.4128 ** | −3.5982 ** | 2.5052 ** | −3.0276 ** | 1.3049 ** | 2.1445 ** | 3.4091 *** | 2.1367 *** | 2.1553 | |
| Denmark | Coefficient | 0.1859 | 0.1415 | 0.1100 | 0.0542 | 0.1233 | −0.0285 | 0.0521 | 0.0840 | −2.0788 |
| t-stat | 2.0024 ** | −2.1387 ** | 2.4719 ** | −3.6528 * | 1.5621 ** | −4.2872 * | 2.4865 ** | 4.1726 ** | −1.7262 | |
| Iceland | Coefficient | 0.5724 | 0.4736 | 0.3004 | 0.1811 | 0.6376 | −0.0883 | 0.0404 | 0.0551 | 5.1285 |
| t-stat | −2.3182 *** | 3.1671 ** | −1.8638 ** | 2.9512 ** | −1.8170 *** | −3.9166 * | 1.6523 ** | 2.6600 ** | 3.4109 | |
| Japan | Coefficient | 0.7169 | 0.6882 | 0.3230 | 0.3592 | 0.5441 | 0.2610 | −0.1332 | −0.1775 | −3.2458 |
| t-stat | 2.0584 *** | 2.8509 *** | −3.2099 *** | −2.6091 *** | 1.6730 *** | 1.5094 ** | 2.9615 *** | 1.3409 *** | −4.5091 | |
| Norway | Coefficient | 0.1002 | 0.0995 | 0.1784 | 0.2592 | 0.2240 | 0.5607 | 0.0612 | 0.0309 | 2.2493 |
| t-stat | 2.4081 ** | 2.1682 ** | −1.2955 ** | −1.4187 ** | 2.1483 ** | 3.3021 *** | −2.5443 ** | −2.3183 ** | 2.6991 | |
| Russia | Coefficient | 0.0995 | 0.2309 | 0.0707 | 0.0831 | 0.1715 | −0.0773 | 0.0170 | 0.0148 | −3.3399 |
| t-stat | −2.5023 * | −1.7192 ** | −2.1973 ** | −2.6886 * | 2.3091 ** | −2.4088 ** | 2.0493 ** | 4.8122 * | −3.2942 | |
| South Korea | Coefficient | 0.2677 | 0.3069 | 0.3330 | 0.2045 | 0.4509 | 0.0847 | −0.0742 | −0.1309 | 5.2700 |
| t-stat | 1.3920 *** | 1.8491 *** | 3.8186 *** | 2.2353 *** | 3.5412 ** | −2.0596 ** | 4.1827 *** | 2.5511 *** | 2.3818 | |
| Sweden | Coefficient | 0.2145 | 0.2346 | 0.2155 | 0.1764 | 0.1399 | −0.0472 | 0.0334 | 0.0916 | −5.0376 |
| t-stat | −4.8921 ** | −3.0830 ** | −1.9188 ** | −2.5616 * | 2.3984 ** | −1.0001 * | 3.5925 * | 1.6810 * | −3.5922 |
Note: *, **, *** = significance at 10% level, 5% level, and 1% level, respectively. Source: Authors’ calculation.
Table 6.
ARDL long-run estimates, countries, 2020.
| Country | Parameter | X1 | X2 | X3 | X4 | X5 | X6 | X7 | X8 | X9 | X10 | Constant |
|---|---|---|---|---|---|---|---|---|---|---|---|---|
| China | Coefficient | −0.0209 | 0.0045 | 0.1018 | 0.1576 | 0.2665 | 0.2301 | 0.0305 | −0.1447 | −0.0160 | −0.0562 | 5.2815 |
| t-stat | 1.5622 * | 1.9832 ** | 3.3090 ** | −5.8935 ** | 4.4587 ** | −4.5634 ** | 1.4986 * | 3.5981 ** | 3.2999 *** | 3.6645 *** | 3.1874 | |
| Denmark | Coefficient | −0.0113 | −0.0222 | 0.0626 | 0.1409 | 0.0453 | 0.0465 | 0.1003 | −0.0160 | 0.0764 | 0.0650 | −6.2966 |
| t-stat | 3.5620 * | 2.6874 * | 3.5527 ** | −1.5412 ** | 3.3300 * | −4.1384 * | 2.7056 ** | −3.4885 * | 4.6081 * | 5.4817 * | −1.1383 | |
| Iceland | Coefficient | 0.0098 | 0.0100 | 0.4215 | 0.4005 | 0.3196 | 0.1350 | 0.4084 | −0.0023 | 0.0508 | 0.0053 | 4.2650 |
| t-stat | 2.4091 * | 3.3958 * | −3.7402 *** | 3.7756 *** | −3.2091 ** | 3.4987 ** | −2.6019 *** | −2.9044 * | 1.7750 ** | 2.3601 ** | 2.5948 | |
| Japan | Coefficient | −0.3349 | −0.1505 | 0.7414 | 0.6629 | 0.2448 | 0.3231 | 0.5367 | 0.2340 | −0.1506 | −0.2064 | −3.4896 |
| t-stat | −3.0072 *** | −2.2061 *** | 1.7750 *** | 2.0026 *** | −3.5093 *** | −2.2297 *** | 1.5873 *** | 2.3851 ** | 4.6095 *** | 2.3091 *** | −4.7750 | |
| Norway | Coefficient | −0.0506 | −0.0512 | 0.0680 | 0.0804 | 0.1237 | 0.2095 | 0.2066 | 0.5391 | 0.0572 | 0.0088 | 3.2409 |
| t-stat | −1.2347 ** | −2.1985 ** | 3.0221 ** | 2.5875 ** | −1.2091 * | −1.1986 * | 2.3914 ** | 3.0056 *** | −2.4095 ** | −2.7093 ** | 2.1778 | |
| Russia | Coefficient | 0.0059 | 0.0308 | 0.0735 | 0.1509 | 0.0334 | 0.0405 | 0.1276 | −0.0627 | 0.0084 | 0.0103 | −4.0516 |
| t-stat | 4.0692 ** | 3.4813 ** | −2.3918 * | −1.5601 * | −2.5963 * | −1.2761 * | 2.1052 * | −3.6091 * | 1.0016 * | 2.3967 * | −3.0793 | |
| South Korea | Coefficient | −0.0987 | −0.0570 | 0.3408 | 0.2694 | 0.2409 | 0.2063 | 0.4168 | 0.0705 | −0.0506 | −0.0848 | 2.5908 |
| t-stat | −2.4094 *** | −2.3091 *** | 1.4915 *** | 1.6021 *** | 2.5710 *** | 1.7092 *** | 2.0594 ** | −2.9776 ** | 2.1741 *** | 2.3999 *** | 2.0007 | |
| Sweden | Coefficient | 0.0010 | 0.0052 | 0.1529 | 0.2073 | 0.2196 | 0.1500 | 0.1234 | −0.0601 | 0.0025 | 0.0807 | −4.0675 |
| t-stat | 2.3881 * | 2.0655 * | −4.1884 ** | −3.8996 ** | −1.3609 * | −2.4861 * | 1.8602 ** | −3.1498 * | 1.4082 * | 2.2061 * | −3.2981 |
Note: *, **, *** = significance at 10% level, 5% level, and 1% level, respectively. Source: Authors’ calculation.
Table 7.
FMOLS and DOLS tests results, countries, 2020.
| Country | Parameter | X1 | X2 | X3 | X4 | X5 | X6 | X7 | X8 | X9 | X10 | Constant |
|---|---|---|---|---|---|---|---|---|---|---|---|---|
| China | FMOLS coefficient | −0.0187 | 0.0041 | 0.1156 | 0.1344 | 0.2406 | 0.2220 | 0.0243 | −0.1316 | −0.0153 | −0.0504 | 5.1438 |
| FMOLS t-stat | 1.4153 * | 1.5385 ** | 3.0287 ** | −5.6193 ** | 4.2857 ** | −4.3451 ** | 1.0054 * | 3.2852 ** | 3.1709 *** | 3.3572 *** | 4.2065 | |
| DOLS coefficient | −0.0130 | 0.0054 | 0.0983 | 0.1197 | 0.2181 | 0.1956 | 0.0250 | −0.1247 | −0.0147 | −0.0427 | 5.0032 | |
| DOLS t-stat | 1.6831 * | 1.2042 ** | 2.4321 ** | −4.3852 ** | 4.0729 ** | −4.1328 ** | 1.0396 * | 2.7953 | 3.0865 *** | 3.1845 *** | 4.1739 | |
| Denmark | FMOLS coefficient | −0.0105 | −0.0016 | 0.0578 | 0.1354 | 0.0412 | 0.0424 | 0.0975 | −0.0140 | 0.0723 | 0.0631 | −6.3945 |
| FMOLS t-stat | 3.1548 * | 2.2000 * | 3.3132 ** | −1.3805 ** | 3.1844 * | −4.0538 * | 2.5214 ** | −3.2481 * | 4.4808 * | 5.1536 * | −3.0082 | |
| DOLS coefficient | −0.0127 | −0.0088 | 0.0615 | 0.1442 | 0.0383 | 0.0415 | 0.0827 | −0.0125 | 0.639 | 0.0528 | −5.2631 | |
| DOLS t-stat | 3.2740 * | 2.3523 * | 3.2057 ** | −1.2790 ** | 3.2567 * | −4.1782 * | 2.6064 ** | −3.1225 * | 4.2055 * | 5.2552 * | −4.3994 | |
| Iceland | FMOLS coefficient | 0.0084 | 0.0097 | 0.4153 | 0.3886 | 0.3093 | 0.1290 | 0.4158 | −0.0014 | 0.0457 | 0.0049 | 4.1486 |
| FMOLS t-stat | 2.1095 * | 3.1684 * | −3.2584 *** | 3.5940 *** | −3.1875 ** | 3.2368 ** | −2.3362 *** | −2.0740 ** | 1.6521 ** | 2.0748 ** | 3.5509 | |
| DOLS coefficient | 0.0069 | 0.0080 | 0.3968 | 0.3732 | 0.3149 | 0.1321 | 0.3967 | −0.0035 | 0.0553 | 0.0037 | 4.0043 | |
| DOLS t-stat | 2.3804 * | 3.2515 * | 0.4251 *** | 3.2049 *** | −3.2648 ** | 3.3489 ** | −2.1680 *** | −1.8589 ** | 1.4474 ** | 2.1485 ** | 3.2817 | |
| Japan | FMOLS coefficient | −0.3077 | −0.0339 | 0.6826 | 0.6537 | 0.2234 | 0.3006 | 0.5163 | −0.1144 | −0.1361 | −0.1750 | −4.6700 |
| FMOLS t-stat | −2.4985 *** | −2.0376 *** | 1.5485 *** | 2.1940 *** | −3.1555 *** | −2.1348 *** | 1.2850 *** | 2.0379 ** | 4.2683 *** | 2.1322 *** | −3.3574 | |
| DOLS coefficient | −0.3150 | −0.0532 | 0.7038 | 0.6218 | 0.2165 | 0.2872 | 0.4734 | −0.1352 | −0.1075 | −0.1894 | −4.2382 | |
| DOLS t-stat | −3.0064 *** | −2.1011 *** | 1.4624 *** | 2.0741 *** | −3.2902 *** | −2.3641 *** | 1.3258 *** | 2.1567 ** | 4.1954 *** | 2.2051 *** | −3.8595 | |
| Norway | FMOLS coefficient | −0.0487 | −0.0094 | 0.0635 | 0.0746 | 0.1053 | 0.2140 | 0.1846 | 0.5250 | 0.0495 | 0.0082 | 3.1570 |
| FMOLS t-stat | −1.0039 ** | −2.0830 ** | 3.0000 ** | 2.2566 ** | −1.1845 * | −1.1283 * | 2.2952 ** | 3.1227 *** | −2.2211 ** | −2.3549 ** | 2.2064 | |
| DOLS coefficient | −0.0406 | −0.0113 | 0.0597 | 0.7212 | 0.1190 | 0.2036 | 0.1703 | 0.4942 | 0.0468 | 0.0074 | 3.1282 | |
| DOLS t-stat | −1.0158 ** | −2.1947 ** | 3.0516 ** | 2.1337 ** | −1.0698 ** | −1.2562 ** | 2.1784 ** | 3.1396 *** | −2.1690 ** | −2.1513 ** | 2.3975 | |
| Russia | FMOLS coefficient | 0.0047 | 0.0286 | 0.0744 | 0.1368 | 0.0312 | 0.0395 | 0.1069 | 0.0648 | 0.0076 | 0.0114 | −4.0373 |
| FMOLS t-stat | 4.0254 ** | 3.3485 ** | −2.1586 * | −1.4195 * | −2.1877 * | −1.2136 * | 2.0625 * | −3.5351 * | 1.0350 * | 2.1538 * | −3.2480 | |
| DOLS coefficient | 0.0039 | 0.0251 | 0.0600 | 0.1206 | 0.0290 | 0.0253 | 0.1123 | −0.0774 | 0.0137 | 0.0152 | −4.1488 | |
| DOLS t-stat | 4.0160 ** | 3.1492 ** | −2.1173 ** | −1.3017 ** | −2.2184 * | −1.1545 * | 1.9258 * | −3.1695 * | 1.2594 * | 2.2705 * | −3.3694 | |
| South Korea | FMOLS coefficient | −0.0916 | −0.0134 | 0.3142 | 0.2355 | 0.2138 | 0.1850 | 0.3867 | −0.1684 | −0.0482 | −0.0758 | 2.6212 |
| FMOLS t-stat | −2.2475 *** | −2.4872 *** | 1.2676 *** | 1.4772 *** | 2.2754 *** | 1.4431 *** | 2.0258 ** | −2.4376 ** | 2.0863 *** | 2.1450 *** | 2.3597 | |
| DOLS coefficient | −0.0723 | −0.0165 | 0.2890 | 0.2142 | 0.1849 | 0.1942 | 0.4250 | −0.1593 | −0.0490 | −0.0649 | 2.5073 | |
| DOLS t-stat | −2.0649 *** | −2.1840 *** | 1.3574 *** | 1.2095 *** | 2.0687 *** | 1.5185 *** | 1.8637 ** | −2.5499 ** | 1.9317 *** | 2.2478 *** | 2.4826 | |
| Sweden | FMOLS coefficient | 0.0013 | 0.0048 | 0.1349 | 0.2146 | 0.1960 | 0.1414 | 0.1066 | −0.0583 | 0.0021 | 0.0796 | −4.0918 |
| FMOLS t-stat | 2.2454 * | 1.7487 * | −4.0268 ** | −3.6384 ** | −1.2694 * | −2.1342 * | 1.5284 ** | −3.0574 * | 1.3780 * | 2.1347 * | −3.4275 | |
| DOLS coefficient | 0.0017 | 0.0030 | 0.1253 | 0.1852 | 0.1775 | 0.1286 | 0.1127 | −0.0439 | 0.0033 | 0.0625 | −4.1207 | |
| DOLS t-stat | 2.1056 ** | 1.5389 ** | −3.7995 ** | −3.2591 ** | −1.3038 ** | −2.2963 * | 1.6435 ** | −2.5665 ** | 1.2684 * | 2.0000 ** | −3.3590 |
Note: *, **, *** = significance at 10% level, 5% level, and 1% level, respectively. Source: Authors’ calculation.
Table 8.
FMOLS and DOLS tests results, countries, 2015–2019.
| Country | Parameter | X3 | X4 | X5 | X6 | X7 | X8 | X9 | X10 | Constant |
|---|---|---|---|---|---|---|---|---|---|---|
| China | FMOLS coefficient | 0.1862 | 0.1527 | 0.2418 | 0.2135 | 0.0542 | −0.1893 | −0.0536 | −0.0624 | 3.3891 |
| FMOLS t-stat | 2.7265 ** | −3.8184 ** | 2.4633 ** | −3.1632 ** | 1.3490 ** | 2.2002 ** | 3.6289 *** | 2.2016 *** | 2.4400 | |
| DOLS coefficient | 0.1900 | 0.1301 | 0.2147 | 0.2470 | 0.0584 | −0.1625 | −0.0577 | −0.0680 | 3.1576 | |
| DOLS t-stat | 3.5528 ** | −2.3710 ** | 2.3592 ** | −3.0083 ** | 1.5746 ** | 2.0371 ** | 3.5825 *** | 2.4672 *** | 2.5965 | |
| Denmark | FMOLS coefficient | 0.1753 | 0.1569 | 0.1251 | 0.0536 | 0.1285 | −0.0310 | 0.0531 | 0.0865 | −2.1327 |
| FMOLS t-stat | 1.9791 ** | −2.1062 ** | 2.4604 ** | −3.7518 * | 1.5703 ** | −4.2592 * | 2.6094 ** | 4.1541 ** | −1.6056 | |
| DOLS coefficient | 0.1684 | 0.1638 | 0.1309 | 0.0522 | 0.1052 | −0.0286 | 0.0627 | 0.0970 | −2.1594 | |
| DOLS t-stat | 2.1550 ** | −2.0571 ** | 2.3700 ** | −3.6295 * | 1.6481 ** | −4.0007 * | 2.4862 ** | 3.8253 ** | −1.7380 | |
| Iceland | FMOLS coefficient | 0.5562 | 0.4506 | 0.3185 | 0.1900 | 0.6673 | −0.0924 | 0.0458 | 0.0586 | 5.2462 |
| FMOLS t-stat | −2.3673 *** | 3.0021 ** | −1.7370 ** | 2.8725 ** | −1.7241 *** | −3.8712 * | 1.7004 ** | 2.5432 ** | 3.5117 | |
| DOLS coefficient | 0.5159 | 0.4425 | 0.3213 | 0.1747 | 0.6208 | −0.0853 | 0.0573 | 0.0594 | 5.2085 | |
| DOLS t-stat | −2.4851 *** | 3.2174 ** | −1.6536 ** | 2.7582 ** | −1.6532 *** | −3.6905 * | 1.6841 ** | 2.6709 ** | 3.2439 | |
| Japan | FMOLS coefficient | 0.7083 | 0.6910 | 0.3057 | 0.3447 | 0.5613 | −0.1342 | −0.1463 | −0.1800 | −3.0557 |
| FMOLS t-stat | 2.1360 *** | 2.7382 *** | −3.1725 *** | −2.5184 *** | 1.7481 *** | 1.5397 *** | 3.1205 *** | 1.2941 *** | −4.4186 | |
| DOLS coefficient | 0.6749 | 0.6425 | 0.3158 | 0.3085 | 0.5357 | −0.1308 | −0.1738 | −0.1752 | −3.7305 | |
| DOLS t-stat | 2.5261 *** | 2.6957 *** | −3.2621 *** | −2.4850 *** | 1.6232 *** | 1.4841 *** | 3.3463 *** | 1.5384 *** | −3.8419 | |
| Norway | FMOLS coefficient | 0.1106 | 0.0844 | 0.1625 | 0.2492 | 0.2383 | 0.5325 | 0.0676 | 0.0375 | 2.3568 |
| FMOLS t-stat | 2.4295 ** | 2.2598 ** | −1.2463 ** | −1.3051 ** | 2.3966 ** | 3.2692 *** | −2.3315 ** | −2.1632 ** | 2.2571 | |
| DOLS coefficient | 0.0918 | 0.0793 | 0.1792 | 0.2174 | 0.2157 | 0.5046 | 0.0582 | 0.0491 | 2.4915 | |
| DOLS t-stat | 2.3704 *** | 2.3201 *** | −1.3758 ** | −1.2593 ** | 2.0582 ** | 3.0001 *** | −2.4071 ** | −2.0586 ** | 2.0868 | |
| Russia | FMOLS coefficient | 0.0937 | 0.2257 | 0.0759 | 0.0890 | 0.1693 | 0.0728 | 0.0185 | 0.0257 | −3.4036 |
| FMOLS t-stat | −2.7251 * | −1.8942 ** | −2.3682 ** | −2.4173 * | 2.5256 ** | −2.2735 ** | 2.1263 ** | 4.6280 * | −3.0157 | |
| DOLS coefficient | 0.0863 | 0.2084 | 0.0483 | 0.0752 | 0.1508 | −0.0594 | 0.0242 | 0.0199 | −3.3885 | |
| DOLS t-stat | −2.4009 ** | −1.7511 ** | −2.7500 ** | −2.1845 * | 2.4775 ** | −2.5002 ** | 2.0736 ** | 3.2875 ** | −2.8730 | |
| South Korea | FMOLS coefficient | 0.2416 | 0.2897 | 0.3149 | 0.1746 | 0.4369 | −0.1715 | −0.0695 | −0.1488 | 5.1404 |
| FMOLS t-stat | 1.1875 *** | 1.5096 *** | 3.7490 *** | 2.0289 *** | 3.1830 ** | −1.8154 ** | 4.0051 *** | 2.3269 *** | 3.9748 | |
| DOLS coefficient | 0.2193 | 0.2795 | 0.3287 | 0.1980 | 0.4068 | −0.1729 | −0.5704 | −0.1267 | 4.2541 | |
| DOLS t-stat | 1.0632 *** | 1.6006 *** | 3.4211 *** | 1.7176 *** | 3.0127 ** | −1.9952 ** | 3.9827 *** | 2.0946 *** | 3.8826 | |
| Sweden | FMOLS coefficient | 0.1709 | 0.2053 | 0.1900 | 0.1538 | 0.1247 | −0.0414 | 0.0285 | 0.0874 | −5.0107 |
| FMOLS t-stat | −4.5286 ** | −3.1602 ** | −1.7396 ** | −2.3871 * | 2.0093 ** | −1.1987 * | 3.1994 * | 1.3086 * | −3.2485 | |
| DOLS coefficient | 0.1047 | 0.1886 | 0.1794 | 0.1604 | 0.1309 | −0.0355 | 0.0305 | 0.0500 | −4.7526 | |
| DOLS t-stat | −3.9405 *** | −3.2943 *** | −1.5708 ** | −2.0175 * | 1.8548 ** | −1.2893 ** | 2.4685 ** | 1.4429 * | −3.5982 |
Note: *, **, *** = significance at 10% level, 5% level, and 1% level, respectively. Source: Authors’ calculation.
Table 9.
TY causality test results, countries, 2015–2019 and 2020.
| Causality Directions | Parameter | China | Denmark | Iceland | Japan | Norway | Russia | South Korea | Sweden | ||||||||
|---|---|---|---|---|---|---|---|---|---|---|---|---|---|---|---|---|---|
| 2015-19 | 2020 | 2015-19 | 2020 | 2015-19 | 2020 | 2015-19 | 2020 | 2015-19 | 2020 | 2015-19 | 2020 | 2015-19 | 2020 | 2015-19 | 2020 | ||
| YX1 | TS | 3.05 | 4.66 | 0.85 | 7.31 | 0.46 | 3.02 | 6.11 | 1.06 | ||||||||
| P | 0.09 * | 0.08 * | 0.66 | 0.04 ** | 0.77 | 0.09 * | 0.04 ** | 0.49 | |||||||||
| X1Y | TS | 5.58 | 1.53 | 0.64 | 3.04 | 0.58 | 0.39 | 5.80 | 0.90 | ||||||||
| P | 0.08 * | 0.27 | 0.79 | 0.08 * | 0.69 | 0.50 | 0.04 ** | 0.53 | |||||||||
| YX2 | TS | 1.86 | 1.04 | 0.62 | 1.10 | 0.37 | 0.86 | 0.83 | 1.01 | ||||||||
| P | 0.45 | 0.35 | 0.80 | 0.26 | 0.80 | 0.44 | 0.37 | 0.50 | |||||||||
| X2Y | TS | 0.72 | 0.90 | 0.55 | 1.39 | 0.51 | 0.30 | 3.25 | 0.86 | ||||||||
| P | 0.68 | 0.44 | 0.83 | 0.15 | 0.72 | 0.59 | 0.09 * | 0.54 | |||||||||
| YX3 | TS | 13.07 | 15.46 | 3.65 | 1.75 | 2.18 | 1.94 | 9.15 | 16.22 | 7.37 | 9.70 | 0.85 | 0.98 | 12.69 | 10.26 | 0.77 | 4.05 |
| P | 0.00 *** | 0.00 *** | 0.15 | 0.22 | 0.27 | 0.36 | 0.01 ** | 0.00 *** | 0.05 * | 0.03 ** | 0.44 | 0.40 | 0.02 ** | 0.01 ** | 0.37 | 0.06 * | |
| X3Y | TS | 8.88 | 6.84 | 6.46 | 7.15 | 9.09 | 9.95 | 13.56 | 13.25 | 5.29 | 5.83 | 0.63 | 3.21 | 19.67 | 7.42 | 3.88 | 2.23 |
| P | 0.03 ** | 0.06 * | 0.07 * | 0.07 * | 0.02 ** | 0.03 ** | 0.00 *** | 0.00 *** | 0.08 * | 0.07 * | 0.52 | 0.09 * | 0.00 *** | 0.03 ** | 0.06 * | 0.12 | |
| YX4 | TS | 10.50 | 13.09 | 2.98 | 1.26 | 2.00 | 1.14 | 10.95 | 14.40 | 4.31 | 8.88 | 1.14 | 1.18 | 12.25 | 15.42 | 0.66 | 1.47 |
| P | 0.02 ** | 0.00 *** | 0.28 | 0.30 | 0.31 | 0.57 | 0.00 *** | 0.00 *** | 0.09 * | 0.04 ** | 0.29 | 0.36 | 0.02 ** | 0.00 *** | 0.42 | 0.30 | |
| X4Y | TS | 10.98 | 7.25 | 6.12 | 7.00 | 8.16 | 8.52 | 12.04 | 13.13 | 7.02 | 7.69 | 1.66 | 3.90 | 17.50 | 6.84 | 2.79 | 3.79 |
| P | 0.02 ** | 0.05 * | 0.07 * | 0.07 * | 0.03 ** | 0.04 ** | 0.00 *** | 0.00 *** | 0.05 * | 0.05 * | 0.15 | 0.07 * | 0.00 *** | 0.04 ** | 0.08 * | 0.07 * | |
| YX5 | TS | 11.35 | 12.96 | 0.51 | 3.46 | 1.37 | 4.44 | 2.82 | 7.27 | 0.58 | 2.06 | 0.43 | 0.34 | 8.74 | 13.70 | 0.58 | 1.86 |
| P | 0.00 *** | 0.00 *** | 0.76 | 0.08 * | 0.40 | 0.09 * | 0.08 * | 0.04 ** | 0.79 | 0.22 | 0.62 | 0.52 | 0.05 * | 0.00 *** | 0.45 | 0.22 | |
| X5Y | TS | 6.72 | 5.24 | 7.84 | 9.41 | 11.24 | 11.17 | 9.55 | 4.54 | 10.13 | 5.20 | 1.00 | 1.41 | 10.01 | 4.95 | 3.13 | 3.54 |
| P | 0.04 ** | 0.08 * | 0.03 ** | 0.02 ** | 0.01 ** | 0.01 ** | 0.01 ** | 0.06 * | 0.01 ** | 0.07 * | 0.35 | 0.27 | 0.03 ** | 0.07 * | 0.07 * | 0.08 * | |
| YX6 | TS | 7.46 | 12.41 | 0.79 | 3.08 | 1.25 | 1.92 | 4.38 | 6.92 | 0.85 | 3.99 | 0.79 | 1.11 | 7.07 | 10.14 | 0.83 | 1.65 |
| P | 0.03 ** | 0.00 *** | 0.61 | 0.09 * | 0.43 | 0.37 | 0.05 * | 0.04 ** | 0.56 | 0.09 * | 0.48 | 0.38 | 0.06 * | 0.01 ** | 0.33 | 0.27 | |
| X6Y | TS | 6.05 | 7.77 | 5.40 | 5.99 | 6.28 | 6.03 | 7.47 | 3.80 | 6.55 | 7.05 | 0.27 | 0.24 | 14.32 | 4.37 | 2.04 | 2.12 |
| P | 0.04 ** | 0.04 ** | 0.08 * | 0.07 * | 0.06 * | 0.07 * | 0.02 ** | 0.07 * | 0.06 * | 0.05 * | 0.80 | 0.66 | 0.01 ** | 0.07 * | 0.09 * | 0.15 | |
| YX7 | TS | 3.22 | 2.23 | 3.47 | 0.95 | 0.97 | 0.90 | 0.68 | 0.70 | 2.83 | 2.10 | 3.71 | 4.78 | 1.13 | 0.74 | 1.14 | 3.11 |
| P | 0.09 * | 0.25 | 0.23 | 0.42 | 0.51 | 0.63 | 0.49 | 0.54 | 0.14 | 0.21 | 0.08 * | 0.05 * | 0.60 | 0.43 | 0.19 | 0.09 * | |
| X7Y | TS | 5.13 | 2.41 | 8.55 | 6.53 | 1.14 | 1.20 | 1.04 | 0.96 | 4.90 | 2.16 | 6.58 | 4.22 | 1.93 | 0.48 | 3.00 | 2.05 |
| P | 0.04 ** | 0.20 | 0.02 ** | 0.07 * | 0.48 | 0.55 | 0.30 | 0.49 | 0.08 * | 0.19 | 0.00 *** | 0.06 * | 0.41 | 0.52 | 0.07 * | 0.16 | |
| YX8 | TS | 1.37 | 1.29 | 2.20 | 0.49 | 0.76 | 0.73 | 0.41 | 0.22 | 4.27 | 11.71 | 2.84 | 3.78 | 1.74 | 1.06 | 0.93 | 1.18 |
| P | 0.43 | 0.51 | 0.37 | 0.68 | 0.59 | 0.71 | 0.62 | 0.83 | 0.09 * | 0.02 ** | 0.09 * | 0.07 * | 0.46 | 0.20 | 0.26 | 0.45 | |
| X8Y | TS | 5.90 | 4.97 | 3.14 | 0.82 | 1.27 | 0.88 | 2.24 | 5.37 | 21.40 | 18.48 | 5.97 | 6.16 | 9.84 | 9.99 | 1.07 | 0.97 |
| P | 0.04 ** | 0.08 * | 0.28 | 0.50 | 0.44 | 0.64 | 0.09 * | 0.04 ** | 0.00 *** | 0.00 *** | 0.03 ** | 0.02 ** | 0.04 ** | 0.01 ** | 0.21 | 0.51 | |
| YX9 | TS | 2.98 | 8.47 | 0.84 | 1.93 | 4.25 | 5.47 | 1.45 | 2.71 | 1.22 | 8.25 | 3.02 | 5.85 | 2.59 | 4.60 | 0.85 | 5.28 |
| P | 0.09 * | 0.03 ** | 0.55 | 0.16 | 0.15 | 0.08 * | 0.23 | 0.09 * | 0.32 | 0.04 ** | 0.09 * | 0.03 ** | 0.30 | 0.07 * | 0.32 | 0.03 ** | |
| X9Y | TS | 7.01 | 10.73 | 6.90 | 4.25 | 15.37 | 13.06 | 6.19 | 6.25 | 17.53 | 13.06 | 5.25 | 4.15 | 11.97 | 12.53 | 4.12 | 2.97 |
| P | 0.03 ** | 0.02 ** | 0.04 ** | 0.08 * | 0.00 *** | 0.00 *** | 0.03 ** | 0.04 ** | 0.00 *** | 0.01 ** | 0.04 ** | 0.06 * | 0.02 ** | 0.00 *** | 0.04 ** | 0.09 * | |
| YX10 | TS | 1.01 | 4.84 | 1.55 | 0.36 | 0.53 | 0.60 | 0.77 | 0.48 | 0.64 | 0.61 | 3.58 | 5.26 | 0.95 | 3.58 | 0.30 | 1.62 |
| P | 0.56 | 0.08 * | 0.47 | 0.70 | 0.68 | 0.81 | 0.45 | 0.77 | 0.71 | 0.64 | 0.08 * | 0.04 ** | 0.64 | 0.09 * | 0.59 | 0.28 | |
| X10Y | 9.67 | 11.86 | 5.02 | 1.61 | 0.82 | 0.66 | 4.30 | 9.96 | 0.73 | 0.42 | 5.01 | 3.69 | 5.33 | 7.27 | 0.69 | 0.50 | |
| P | 0.02 ** | 0.01 ** | 0.09 * | 0.27 | 0.57 | 0.77 | 0.05 * | 0.03 ** | 0.69 | 0.79 | 0.04 ** | 0.07 * | 0.08 * | 0.03 ** | 0.41 | 0.74 | |
Note: *, **, *** = significance at 10% level, 5% level, and 1% level, respectively; TS = test statistics; P = p value. Source: Authors’ calculation.
Table 10.
Strengths and directions of the Y-Xn causality links in 2015–2019 and 2020.
| Causality Directions | China | Denmark | Iceland | Japan | Norway | Russia | South Korea | Sweden | ||||||||
|---|---|---|---|---|---|---|---|---|---|---|---|---|---|---|---|---|
| 2015-19 | 2020 | 2015-19 | 2020 | 2015-19 | 2020 | 2015-19 | 2020 | 2015-19 | 2020 | 2015-19 | 2020 | 2015-19 | 2020 | 2015-19 | 2020 | |
| YX1 | A/BC | A/UC | W/NC | AA/BC | W/NC | A/UC | AA/BC | W/NC | ||||||||
| X1Y | A/BC | W/RC | W/NC | A/BC | W/NC | W/RC | AA/BC | W/NC | ||||||||
| YX2 | W/NC | W/NC | W/NC | W/NC | W/NC | W/NC | W/RC | W/NC | ||||||||
| X2Y | W/NC | W/NC | W/NC | W/NC | W/NC | W/NC | A/UC | W/NC | ||||||||
| YX3 | S/BC | S/BC | W/RC | W/RC | W/RC | W/RC | AA/BC | S/BC | A/BC | AA/BC | W/NC | W/RC | AA/BC | AA/BC | W/RC | A/UC |
| X3Y | AA/BC | A/BC | A/UC | A/UC | AA/UC | AA/UC | S/BC | S/BC | A/BC | A/BC | W/NC | A/UC | S/BC | AA/BC | A/UC | W/RC |
| YX4 | AA/BC | S/BC | W/RC | W/RC | W/RC | W/RC | S/BC | S/BC | A/BC | AA/BC | W/NC | W/RC | AA/BC | S/BC | W/RC | W/RC |
| X4Y | AA/BC | A/BC | A/UC | A/UC | AA/UC | AA/UC | S/BC | S/BC | A/BC | A/BC | W/NC | A/UC | S/BC | AA/BC | A/UC | A/UC |
| YX5 | S/BC | S/BC | W/RC | A/BC | W/RC | A/BC | A/BC | AA/BC | W/RC | W/RC | W/NC | W/NC | A/BC | S/BC | W/RC | W/RC |
| X5Y | AA/BC | A/BC | AA/UC | AA/BC | AA/UC | AA/BC | AA/BC | A/BC | AA/UC | A/UC | W/NC | W/NC | AA/BC | A/BC | A/UC | A/UC |
| YX6 | AA/BC | S/BC | W/RC | A/BC | W/RC | W/RC | A/BC | AA/BC | W/RC | A/BC | W/NC | W/NC | A/BC | AA/BC | W/RC | W/NC |
| X6Y | AA/BC | AA/BC | A/UC | A/BC | A/UC | A/UC | AA/BC | A/BC | A/UC | A/BC | W/NC | W/NC | AA/BC | A/BC | A/UC | W/NC |
| YX7 | A/BC | W/NC | W/RC | W/RC | W/NC | W/NC | W/NC | W/NC | W/RC | W/NC | A/BC | A/BC | W/NC | W/NC | W/RC | A/UC |
| X7Y | AA/BC | W/NC | AA/UC | A/UC | W/NC | W/NC | W/NC | W/NC | A/UC | W/NC | S/BC | A/BC | W/NC | W/NC | A/UC | W/RC |
| YX8 | W/RC | W/RC | W/NC | W/NC | W/NC | W/NC | W/RC | W/RC | A/BC | AA/BC | A/BC | A/BC | W/RC | W/RC | W/NC | W/NC |
| X8Y | AA/UC | A/UC | W/NC | W/NC | W/NC | W/NC | A/UC | AA/UC | S/BC | S/BC | AA/BC | AA/BC | AA/UC | AA/UC | W/NC | W/NC |
| YX9 | A/BC | AA/BC | W/RC | W/RC | W/RC | A/BC | W/RC | A/BC | W/RC | AA/BC | A/BC | AA/BC | W/RC | A/BC | W/RC | AA/BC |
| X9Y | AA/BC | AA/BC | AA/UC | A/UC | S/UC | S/BC | AA/UC | AA/BC | S/UC | AA/BC | AA/BC | A/BC | AA/UC | S/BC | AA/UC | A/BC |
| YX10 | W/RC | A/BC | W/RC | W/NC | W/NC | W/NC | W/RC | W/RC | W/NC | W/NC | A/BC | AA/BC | W/RC | A/BC | W/NC | W/NC |
| X10Y | AA/UC | AA/BC | A/UC | W/NC | W/NC | W/NC | A/UC | AA/UC | W/NC | W/NC | AA/BC | A/BC | A/UC | AA/BC | W/NC | W/NC |
Note: S = strong causality link; AA = above average strength of causality link; A = average strength of causality link; W = weak causality link; UC = unidirectional causality; BC = bidirectional causality; RC = reverse causality; NC = neutral causality. Source: Authors’ calculation.
Publisher’s Note: MDPI stays neutral with regard to jurisdictional claims in published maps and institutional affiliations. |
© 2021 by the authors. Licensee MDPI, Basel, Switzerland. This article is an open access article distributed under the terms and conditions of the Creative Commons Attribution (CC BY) license (http://creativecommons.org/licenses/by/4.0/).
Share and Cite
MDPI and ACS Style
Tianming, G.; Erokhin, V.; Arskiy, A.; Khudzhatov, M. Has the COVID-19 Pandemic Affected Maritime Connectivity? An Estimation for China and the Polar Silk Road Countries. Sustainability 2021, 13, 3521. https://doi.org/10.3390/su13063521
AMA Style
Tianming G, Erokhin V, Arskiy A, Khudzhatov M. Has the COVID-19 Pandemic Affected Maritime Connectivity? An Estimation for China and the Polar Silk Road Countries. Sustainability. 2021; 13(6):3521. https://doi.org/10.3390/su13063521
Chicago/Turabian StyleTianming, Gao, Vasilii Erokhin, Aleksandr Arskiy, and Mikail Khudzhatov. 2021. "Has the COVID-19 Pandemic Affected Maritime Connectivity? An Estimation for China and the Polar Silk Road Countries" Sustainability 13, no. 6: 3521. https://doi.org/10.3390/su13063521
Note that from the first issue of 2016, this journal uses article numbers instead of page numbers. See further details here.