
Blue Economy and Coastal Tourism: A Comprehensive Visualization Bibliometric Analysis


1
Hungarian University of Agriculture and Life Sciences (MATE), 2100 Godollo, Hungary
2
Faculty of Urban and Regional Planning, Cairo University, Giza 12613, Egypt
3
STIE Pariwisata API Yogyakarta, Yogyakarta 55281, Indonesia
4
5 Vanderbijlpark Campus, North-West University, Vanderbijlpark 1900, South Africa
*
Author to whom correspondence should be addressed.
Sustainability 2021, 13(7), 3650; https://doi.org/10.3390/su13073650
Submission received: 8 February 2021
/
Revised: 22 March 2021
/
Accepted: 22 March 2021
/
Published: 25 March 2021
(This article belongs to the Special Issue Blue Economy and Resilient Development: Natural Resources, Shipping, People, and Environment)
Abstract
:This paper aims to analyze the scientific production of the blue economy and coastal tourism research fields to identify research topics and publication patterns. Accordingly, bibliometric analysis was selected as a quantitative meta-analysis literature review method. Scopus was the main database for extracting the scientific production in blue economy and coastal tourism. Various bibliometrics analysis techniques were used to analyze 476 and 49 publications in blue economy and coastal tourism, respectively. The main results are summarized as follows: (i) the number of publications in the blue economy scientific sector has increased significantly, and (ii) contrarily, a relatively small body of blue economy literature is concerned with the coastal tourism sector despite its significant role in the blue economy.
1. Introduction
According to international organizations, the blue economy (BE) concept seeks to effectively manage water resources, especially seas and oceans, to preserve them as significant natural resources for current and future generations [1,2,3]. The BE includes all the economic activities that directly correlate with the oceans, such as fishing, shipbuilding, maritime transport, coastal tourism, etc. [2]. Although the “BE” term seems to be new, the water resources and the awareness of their importance have been around since prehistoric times. The importance of water resources on the Earth’s surface (oceans, seas, rivers, etc.) cannot be denied. Oceans cover two-thirds of the Earth’s surface, produce about 50% of the world’s oxygen, shape more than 95% of the biosphere, regulate the Earth’s surface temperature, provide people with food, and host various economic activities [3,4,5,6].
The roots of BE emergence can be directly and strongly linked to the sustainable development concept. Since the 1960s, the scientific community has paid attention to sustainable development, especially in environmental, economic, and social dimensions [7].
The United Nations hosted its first sustainable development conference in Stockholm in 1972 to advance sustainable development from the environmental perspective. The second United Nations conference, held in Rio in 1992 and focusing on the economic dimension of sustainable development, was followed by the Johannesburg conference in 2002, which looked at the value of achieving the social dimension of sustainable development [7,8].
Before the Rio +20 conference in 2012, the global financial crisis occurred, leading to the emergence of the green growth term on the world stage. Green growth aims to boost economic growth, considering environmental factors. Therefore, the Rio +20 summit had two key pillars: sustainable development and green economy [2,3,5,6]. Coastal states, in general, and Small Island Developing States (SIDS) confirmed the importance of paying attention to the oceans and their climate in achieving a green economy during the Rio +20 summit preparations [3]. Subsequently, the “Green Economy in a Blue World” report emerged, which is widely regarded as the beginning and cornerstone of the modern blue economy [2]. Therefore, it can be said that the blue economy is an extension of the green economy theme and the environmental dimension of economic activities.
The term “Blue Economy” first appeared in 2012, following the United Nations Conference on Sustainable Development (UNCSD), also known as Rio +20 or the Earth Summit [3]. As a result, global conferences and international meetings of regional and global organizations have debated the BE term and attempted to define it, resulting in many definitions. These BE definitions varied depending on the entity issuing the identification and its purposes. For example, the United Nations Environment Program (UNEP) launched the BE term at the level of island countries, especially the Caribbean islands, and BE was defined as “the economy that leads to human well-being and enhances social justice, while significantly reducing environmental risks and scarcity of resources” [2] (p. 3). OCED describes BE as “the sum of the economic activities of ocean-based industries, together with the assets, goods, and services provided by marine ecosystems” [1] (p. 2). Furthermore, the European Commission adopted BE as a new development strategy for EU member states, defining it as “an economy that includes the maritime economy and all economic activities related to the oceans, seas, and coasts” [9] (p. 5). In addition, according to the European Union’s initiative for sustainable development of BE, BE was considered a commitment and preservation of environmental aspects while developing various geographical areas and regions. This initiative also seeks to achieve three main goals: safer maritime domain, a smart BE able to achieve resilient development, and optimum utilization of water surfaces and their various resources [9].
The importance of the BE term is achieved from the conceptual kernel of this approach, enhancing the sustainability concept. The Sustainable Development Goals (SDGs), which are also known as the Global Agenda 2030, are related to BE [10]. The 14th Sustainable Development goal, “life below water,” seeks to promote the sustainable use and development of oceans, seas, marine resources, and ecosystems, which are the foundation of the BE approach and its economic sectors [10].
The concept of BE has presented a new perspective of the sustainable economic development in different countries or geographical areas such as coastal areas by using the oceans and marine resources at the various levels of development, regional, national, and international. BE depends on the growth of industries and activities based on marine and ocean resources, such as fisheries, shipping, ports, marine logistics, coastal, and recreational tourism [2,11,12]. Furthermore, there are many emerging sectors in BE such as renewable ocean and seas energy (wind, tides, waves, etc.), extraction of gas and oil from the seas and oceans, mining, aquaculture and marine, blue biotechnology, monitoring and controlling seas and oceans, conducting marine research, and others that are characterized by the use of cutting-edge technologies [13].
Because of this diversity in the economic sectors that formed BE, various classifications have emerged. Some international organizations have divided BE sectors into five main groups, while others divide it into six, seven, or 11 economic sectors. The main classification for BE sectors was developed by the European Union (EU), which divided BE into seven main sectors, named: “Marine Renewable Energy,” “Shipbuilding and Repair,” “Marine Living Resources,” “Maritime Transport,” “Marine Nonliving Resources,” “Port Activities,” and “Coastal Tourism” [14].
This paper aims to analyze the coastal tourism sector as a part of BE. According to the EU Blue Economy Report, BE sectors created nearly 5 million jobs and contributed EUR 218 billion in gross value added (GVA) in 2018 [9]. Coastal tourism is at the forefront of BE’s economic sectors, offering job opportunities or sharing in the gross value added (GVA) [9]. Figure 1 shows the participation percentage of the different BE sectors in providing job opportunities and GVA, where the coastal tourism sector appears as the largest valuable economic sector in BE [9].
Coastal tourism choice as one of the two main focused scientific fields in this research can be attributed to its importance as an economic sector of BE and its contribution in the global tourism industry. Approximately 30% of global tourism activities take place in coastal areas and regions [15]. According to the United Nations World Tourism Organization (UNWTO), one out of every two tourists traveled to the coastal area for tourism purposes [16]. Further, coastal tourism in coastal areas such as Small Island Developing States (SIDS) is considered the main source of supply of foreign exchange [3]. The coastal tourism sector contributes about USD 220 billion of ocean consumer products and services globally [11].
Coastal tourism covers various activities, patterns, and infrastructure, making it the heart of the scientific research area when analyzing and studying the tourism industry’s different patterns. It includes many tourism, recreation, and entertainment-oriented activities such as swimming, snorkeling, diving, beaches, recreational fishing, various water sports, cruises, sports competitions, recreational and sailing boats, etc. For example, as a critical sub-sector of coastal tourism, global cruise tourism has experienced massive growth in recent years, with a total 75% of growth in passenger numbers from 2008 to 2018 [14]. Simultaneously, a robust potential infrastructure serves the coastal tourism sector, such as accommodation, restaurants, tourist villages, hotels, ports, trade and shopping centers, logistic zones, and transportation hubs [11].
Aside from the positive aspects of coastal tourism, such as its enormous significance and effect on the global economy, there are some negative consequences of coastal tourism, especially in terms of the environment [17]. The main negative impacts of coastal tourism on the coastal area ecosystem are water pollution, beach and shoreline erosion, abuse and destruction of coral reefs, habitat destruction, extinction of certain threatened species, destruction of flora and fauna, increased plastic wastes, increased pressure on different energy resources, and physical and economic displacement of local communities [15,18,19].
It has been reported that the most important reasons that create these negative effects are the constant pressures on limited marine resources by various tourism activities, the expansion of urban development processes in coastal areas, and the permanent and continuous conflict between the priorities of development in coastal areas between the tourism sector and other economic sectors [15,17,18,19,20].
Because of these previous negative effects and in light of coastal tourism importance in the global economy, achieving sustainability is a pivotal matter. Therefore, it was necessary to apply the BE approach to achieve sustainability principles in coastal tourism.
This research sets out to study BE as one of the most important and latest approaches to achieving sustainable development related to water resources and shedding light on the coastal tourism sector. The bibliometric analysis as a meta-analysis literature review method was applied to achieve the purpose of the current study.
2. Materials and Methods
The quantitative method of bibliometric analysis was chosen for analyzing scientific production in BE in general and coastal tourism in particular, where it is considered one of the most reliable literature reviewing approaches [21]. Although it has been used since the 1890s [21], it appears to be a common literature review technique nowadays. The conceptual kernel of this method is to collect, describe, analyze, evaluate and monitor published academic papers on a particular research topic [21]. Using bibliometrics analysis in the current paper can be attributed to many reasons. Firstly, although most bibliometric analysis techniques are commonly used in topics with numerous publications over the years, this method is often reliable and valuable for analyzing the novel scientific areas to detect patterns and infer the future path for these topics [22]. Secondly, it is common as a literature review technique in the sustainable development scientific area [23,24,25,26,27,28]. Thirdly, the idea of bibliometric analysis is consistent with the aim of this research, which introduces the statistical measurement of BE and coastal tourism fields based on transparent and systematic techniques [22]. Finally, it is an objective, unbiased, and straightforward analysis [29].
This research applied a comprehensive bibliometric analysis based on three main analyzing levels: basic information of the extracted literature, basic contents of the extracted literature, and relation between bibliometric analysis units. Each level has different sub-levels of the analyzing process. Moreover, the two main focused scientific fields in this research (BE and coastal tourism) will be compared at each level. Coastal tourism, in particular, will be analyzed as one of the BE sectors.
Various software tools are used to conduct bibliometric analysis, such as HistCite [30], CitNetExplorer [31], VOSviewer [32], SciMAT [33], Science of Science (Sci2) [34], CiteSpace [35] and bibliometrix package in R [22]. However, according to Aria and Cuccurullo (2017), most of these tools did not have a complete workflow; in other words, some focused on analyzing bibliographic data, and others were designed to visualize the results and networks [22].
The bibliometric analysis in this research was developed using three separate software tools, R, CiteSpace, and VOSviewer, to overcome these obstacles. Furthermore, these three software tools are entirely free, giving preference and convenience in using different analytical tools that can be used without any commercial licenses [22,36]. Moreover, many scholars have used a combination of these programs to perform bibliometric analysis in various disciplines [24,37,38,39].
The bibliometrix package in the R programming environment was the first used software. R is a command-line programming language with open-source statistical packages and an ecosystem [40,41,42]. Compared to other scientific computation languages, scholars preferred R due to its ability to provide nearly comprehensive bibliometrics and scientometrics analysis [22], practical statistical algorithms, different numerical routes, and powerful visualization features [22]. CiteSpace and VOSviewer software are used to visualize all bibliometrics analysis outputs and develop conceptual and intellectual networks.
2.1. Data Collection
The imported data set of this research was extracted from Scopus (Elsevier’s abstract and citation database). Scopus was chosen as a research engine in this paper over Web of Science (WOS) for these reasons: (i) Scopus is considered the largest database of different types of peer-reviewed literature documents, such as articles, conference papers, books, and review papers [43,44], and (ii) many other scholars have used Scopus to perform bibliometrics analysis in their studies [27,45,46,47].
To collect the required raw data, the researchers used the following two basic terminology and Boolean operators for each of the two focused scientific fields in this research (i.e., BE and coastal tourism):
The keywords set in double quotation marks were identified as a “loose phrase” in Scopus. Further, the Boolean operators “OR” and “AND” were used to retrieve records that contained any of these words and identify papers with both terms, respectively [48]. Furthermore, the asterisk (*) in the coastal tourism search query was used to find different shapes of a word. The search refinement was quite limited in this study, where any records before 2012 were excluded as it was the official emergence year of the BE term. Papers from 2021 were also omitted because the scientific publication had just begun and was not yet complete. It is worthwhile mentioning that search queries in this study went through four rounds to reach the final form (Figure 2), and this was followed by a deep revision by the authors to be sure that the collected articles corresponded with the study aim.
While most previous bibliometric analysis studies used exclusion criteria to refine the collected data [23,49,50], we chose not to. Since the key scientific area of interest was BE (which appeared in 2012), we concentrated on gathering as many published papers in this field as possible. In addition, some exclusion criteria in bibliometric analysis studies would not be effective in this research, for example, the language of the collected papers, which is a continuous debate between scholars [51]. Some academics believe that the language criteria are the most important ones that affect the bibliometric analysis’s efficiency, and that it is necessary to focus on articles published in the English language only, while others believe that non-English articles have a “very low” impact on the bibliometric analysis studies since these articles count only in the overall data set, and their contributions in different bibliometric analysis levels are low [51]. In the current research, the contribution of non-English articles was not great and would not produce significantly different outcomes. For example, in the BE data set, there were 13 non-English papers out of 476 research papers that were analyzed (four Chinese, three Russian, three Spanish, two Italian, and one Portuguese). The same was observed in the coastal tourism data set, where out of 46 research papers, there were only three non-English papers (two Chinese and one Russian). Therefore, our research did not use exclusion criteria to ensure collecting the most significant number of research papers possible related to BE and coastal tourism, which in turn gave richness in results and achieved the research aim.
Moreover, it is worthy to note that a deep screening of the extracted data occurred as a sub-data collection analysis to identify records relevant to the coastal tourism sector within the entire BE literature.
2.2. Data Retrirval and Management
On 18 November 2020, the data set was extracted by the four researchers separately and uploaded in R, CiteSpace, and VOSviewer in parallel. In R, using a bibliometrix package, data was converted to a data frame before extracting the bibliographic information. CiteSpace and VOSviewer were used to create and visualize the results and networks. The researchers also discussed any conflicting information and clarified it.
2.3. Anlysis Levels
The data was subjected to three main levels of analysis, namely, basic information of the extracted literature, basic contents of the extracted literature, and relation between bibliometric analysis units, as mentioned previously. In every analysis level, the research used different bibliometric techniques with various structural concepts (see Table 1).
In the first level of analysis, termed as “basic information of the extracted literature,” the research presented a general overview of the extracted BE and coastal tourism literature. This analytical level included five central analysis units: scientific production analysis, source analysis, author analysis, document analysis, and country and institution analysis (see Table 1). In the second analysis level, called “basic contents of the extracted literature,” the research focused on the bibliometrics analysis related to the extracted scientific production content, such as keyword analysis and reference analysis (see Table 1). Finally, in the third bibliometric analysis level, the so-called “relation between bibliometric analysis units,” the research illustrated the relation between three different bibliometric analysis units using a three-fields plot.
In general, different bibliometric indicators and techniques were used in each analysis level and followed by co-citation, collaboration, and thematic networks based on specific features and algorithms.
3. Results and Discussion
It is worthwhile mentioning that the coastal tourism scientific production was part of the BE scientific production, as it was one of the sectors that structured this type of economy. For example, the total number of published articles in the BE research area was 476 in the selected period from 2012 to 2020, while the scientific production in the coastal tourism sector represented approximately 10% (n = 49) of the whole BE production. The coastal tourism sector production volume was poor compared to its importance as one of the most valuable and productive sectors in BE [9].
3.1. Basic Information of the Extracted Literature
3.1.1. Scientific Production Analysis
The quantity of published papers in any academic research field is considered a key indicator of bibliometric analysis [23,24]. According to the published BE articles, over the eight years there was a rapid growth in BE scientific production, about a 60.48% annual growth rate (see Figure 3). The least active year was 2012, with just three papers, since it was the first year using the BE term, while the most BE publications were published in 2020 (132 papers). The total number of citations for BE articles was 2420, with 5.084 average citations per document, reflecting the importance of this research area in recent years.
Compared to BE, scientific production in the coastal tourism sector was different. The production volume in this sector did not reflect its importance relative to the other six BE sectors, where the number of published articles was 49. According to Figure 3, applying the BE concept in coastal tourism development was not great, especially from 2012 to 2018. The scientific production in this sector stuck on a kind of plateau with about four articles per year. The situation improved in 2019 and 2020, when the number of published papers in the coastal tourism sector jumped significantly to 21 and 15, respectively.
3.1.2. Source Analysis
With regards to source analysis in BE, the extracted 476 papers were reported in 249 sources. Marine Policy/H-index (15), Frontiers in Marine Science/H-index (6), Journal of the Indian Ocean Region/H-index (7), Journal of Coastal Research/H-index (2), and Ocean and Coastal Management/H-index (5), were the most productive sources in the BE research area, with 42, 21, 20, 12 and 10 publications, respectively (see Figure 4). Although within the broad range of the published articles’ sources in the BE scientific field during the eight years only 5% (n = 12) sources had published more than five articles, which represented by the top five sources in addition to Sea Technology (NP = 10), Sustainability Science (NP = 10), Marine Technology Society Journal (NP = 9), Maritime Affairs (NP = 8), Dialogues in Human Geography (NP = 7), Journal of Political Ecology (NP = 7), and Journal of Ocean and Coastal Economics (NP = 6).
By investigating the Hirsch Index (H-index), which is defined as the journal’s number of publications (h), each of which has been cited by other articles at (n) time [52], it can be said that Marine Policy was the most valuable journal in BE field, either in terms of the total number of publications (NP) or the total number of citations (TC), or H-index.
Concerning the coastal tourism field, the extracted 49 papers were published in 39 sources. The most abundant sources in the coastal tourism sector were: Frontiers in Marine Science/H-index (2), Marine Policy/H-index (3), Journal of Coastal Research/H-index (0), Journal of the Indian Ocean Region/H-index (1), and Ocean and Coastal Management/H-index (2) with total publications of 4, 3, 2, 2 and 2, respectively (see Figure 4). Analogous to the BE field method, only one journal, Frontiers in Marine Science, published four articles, while other sources only published one to three.
Comparing the most productive sources in the two studied scientific areas (BE and coastal tourism), it was obvious that there was a great similarity between them, where Marine Policy, Journal of Coastal Research, Journal of the Indian Ocean Region, and Ocean and Coastal Management were the most productive sources in these two research areas (see Figure 4). However, in the coastal tourism sector, Journal Frontiers in Marine Science ranked at the top of the most productive journal list in this field, which was not recorded in the same list for the BE field, indicating the specialization of this journal in publishing articles related to coastal tourism among all other sources.
Figure 4 shows the relation between the number of publications (NP) and the number of total citations (TC) for sources in the two scientific fields (i.e., BE and coastal tourism). The total citations of the sources did not correspond to the order in which they appeared in the most productive sources list, whether for BE or coastal tourism. For instance, in the BE scientific field, Ocean and Coastal Management received 101 citations obtained by only 10 published articles and ranked fifth in terms of the total number of citations for sources (see Figure 4a). Furthermore, Journal of the Indian Ocean Region published two articles in the coastal tourism scientific research area, which were cited 17 times, while Frontiers in Marine Science journal published four articles in the same research area and received just 14 citations (see Figure 4b).
3.1.3. Author Analysis
Author analysis seeks to find the significant analysis features related to the authors in the collected research articles and identify the structure of the scientific community in a specific field [22,53]. For example, this research discussed three bibliometric techniques related to author analysis for each of the two focused research fields (i.e., BE and coastal tourism).
Firstly, the most relevant author analysis technique was part of citation bibliometric analysis, which aimed to address the following questions: Which authors are the most prolific in the research field? Who are the subject matter experts in the specific science field? [53]. The most prolific authors are determined based on the number of published articles, while the experts in the field are indicated based on the total number of citations.
According to BE scientific production, the total number of authors was 1584. The five most relevant authors based on the number of publications were Na Na (n = 13), Failler P (n = 7), Voyer M (n = 7), Bennett NJ (n = 6), and Morrissey K (n = 6). Regarding ranking authors based on the total number of citations, the top five authors who wrote high citation documents were Pauly D (TC = 140), Halpern BS (TC = 107), Campbell LM (TC = 104), Bennett NJ (TC = 92), and Sumaila UR (TC = 84). Comparing the top five authors based on the number of publications and the total citations in the BE field, we can see that the author’s number of publications did not reflect his or her number of citations. In other words, you can find that one author had more significant publications but received fewer citations than another author with fewer published articles. For example, the total 140 citations of Pauly D, which listed him at the top of the authors achieving the most citations, were obtained from just one published article, reflecting the specialization of some authors in the BE field.
Regarding the 49 published articles in the coastal tourism sector, about 147 authors published them. Cisneros-Montemayor Am, Kolesnikova M, Na Na, Potts T, and Aguilar-Manjarrez J were the most relevant authors in this scientific field with 2, 2, 2, 2, and 1 articles, respectively. Based on the total number of citations in the coastal tourism field, the top five authors were Cisneros-Montemayor Am (TC = 17), Pauly D (TC = 13), Halpern BS (TC = 12), Cheung WWL (TC = 11), and McKinley E (TC = 11). Looking at these two lists in the field of coastal tourism, except for Cisneros-Montemayor Am, the authors in the two lists are completely different, indicating the diversity of scholars who publish articles in the coastal tourism field.
Secondly, the co-author analysis technique is suggested to answer some leading questions: Do the authors collaborate from different disciplines or remain with their disciplinary boundaries? Do more productive authors collaborate frequently? [53]. This analysis technique is depicted by a network named “author collaboration network,” where nodes represent authors and links represent co-authorships [52].
Figure 5a presents the author collaboration network in the BE field, consisting of four primary colors: red, blue, green, and yellow; every color represents a cluster of authors with the same disciplinary area of interest under the BE umbrella. By examining this network, we can see that there was little interest from authors in the BE field to collaborate within different disciplinary boundaries. It was shown through the tangled links in the network between different clusters. In addition, the collaboration between some researchers from different groups was observed, such as the collaboration between Voyer M (green group) and Heron RL (blue cluster) and the collaboration between Foulton EA (yellow group) and the Cheung WWL (red group). It was noteworthy that most of the strong relationships that appeared from the link thickness were within the same cluster, indicating the extent of the excellent collaboration between authors in the same group to produce co-authored articles. Moreover, it is worth mentioning that there was an amazing collaboration between the most prolific authors (big nodes) in the BE field but inside the same cluster.
Figure 5b presents the author collaboration network in the coastal tourism field. It also has four main clusters: red, blue, green, and yellow. Unlike in the network in BE, it was found that most authors in the coastal tourism sector collaborated within the same cluster, resulting in a less tangled network with clean visualization and divided into four separate groups. This network in Figure 5b also shows a clear collaboration between the most productive authors in the coastal tourism sector and the same cluster, similar to the BE author collaboration network.
Thirdly, we studied the top author’s production during the time concerned with studying the relationship between three variables, namely: the author’s number of publications (NP), the author’s number of citations (TC), and the period (n) [54,55]. This analysis aimed to extrapolate the active periods in which the most significant number of articles and the greatest number of citations were produced and identify the authors responsible for the structure in the scientific research field [54].
Figure 6a depicts the top author’s production over time in the BE field. It highlights that in the second half of the focused timespan, precisely from 2017 to 2020, the majority of authors achieved their highest production volumes, either in the number of published articles or the number of total citations. Na Na and Morrissey K were also the earliest scholars who published about BE after the first appearance of the term in 2012, although they did not achieve outstanding citations for these publications. Although we set the study period at eight years (from 2012 to 2020) in the coastal tourism sector, the first published paper did not appear in the first three years; it was published in 2015, then the scientific production stopped from 2015 to 2018, before restarting again in 2019 and reaching its peak (see Figure 6b).
Some interesting notes can be mentioned by comparing the author analysis between BE and coastal tourism sector. First, analyzing the top relevant authors in these two research areas showed that, despite many authors in both research areas, the scientific production was not monopolized or dominated by particular scholars, and the total scientific production had an unequal distribution among the authors. Secondly, in the most relevant author analysis, the two lists for the two research areas (BE and coastal tourism) were almost different, although the scientific production of the coastal tourism was part of BE, reflecting the specialization in the tourism sector when it related to authors. Thirdly, there was a vivid difference between the author names in the two research areas appearing in the most relevant author lists, based either on the number of publications or the number of citations. Fourthly, 2019 was the most productive year in both scientific fields, in either the total number of publications or the total number of citations.
3.1.4. Document Analysis
In this part, the research focused on answering the main question related to the published documents: What are the most cited papers in the two focused selected scientific areas (BE and coastal tourism)? And what is the relation between them?
Firstly, by analyzing and extracting the 10 most cited papers published in the BE scientific area, we saw that the highest number of citations was 109, which was obtained by Silver JJ’s research paper entitled “Blue Economy and Competing Discourses in International Oceans Governance” [5]. Bueger C’s article entitled “What is maritime security?” [56] ranked second in the most cited papers in BE academic production, and it received around 91 citations. These two published papers achieved approximately 8% of the total citations obtained by all research papers in BE, and it is worth noting that these two papers were also published in the same year, 2015. One of the most intriguing observations from the list of the top 10 most cited articles in BE was that half of the list (n = 5) was published in one journal, Marine Policy. These five papers were in the second [5], fourth [57], sixth [58], eighth [59], and tenth rank of the list [60] (see Figure 7).
Secondly, regarding the 10 most cited research papers in the coastal tourism sector, Pinto H’s article entitled “Cooperation and the emergence of maritime clusters in the Atlantic: Analysis and implications of innovation and human capital for blue growth” [61] was ranked at the top of this list, with 39 citations. Hadjimichael M’s paper, which was published in 2018 entitled “A call for a blue degrowth: Unravelling the European Union’s fisheries and maritime policies” [62], came in second and obtained 27 citations. Noting the scientific sources in which the 10 most cited coastal tourism articles were published, it was revealed that the two papers at the top of the list were both published in the same journal, Marine Policy (see Figure 8), confirming the journal’s importance, not only as the most productive source, as previously stated, but also because its published articles had high citation rates compared to other journals.
Comparing the two lists of the 10 most cited papers in the BE and coastal tourism scientific fields, it was shown that there was no overlap between these two lists; in other words, no articles in coastal tourism scientific output had the potential to receive a large number of citations that would qualify them to be listed anywhere in the BE list. This indicated the weak percentage of scientific production in the coastal tourism field, and its invalid importance as a part of the scientific output of BE. Furthermore, the extrapolation of the 10 most cited papers list in the coastal tourism sector revealed another striking finding: only two of the ten articles included in the list discussed the tourism sector independently and separately [63,64]. However, the rest of the eight articles discussed coastal tourism as a sector within other sectors in the blue economy. In other words, these eight papers did not focus on the coastal tourism sector only, but in other BE sectors also, confirming the research conclusion related to the weakness of the relative importance of the coastal tourism scientific production as part of the BE scientific production, despite the importance of this sector in providing jobs and sharing in GVA [9].
3.1.5. Country and Institution Analysis
This analysis was considered one of the most noticeable bibliometrics analysis units, suggesting research collaboration and the flow of the scientific field between various entities (countries and institutions) [65].
Regarding the country collaboration network, BE literature was published by 124 countries. This diversity in the countries participating in the scientific production of BE (55% countries of the world) indicated the extended prosperity of the BE term as a future academic research topic in recent years, specifically from 2012 to the present day. Figure 9 represents the countries most contributing to the literature of the two focused scientific fields (BE and coastal tourism), where the circle size represents the country’s scientific production and lines represent the country collaborations [66]. According to Figure 9a, which depicts the country contributions in BE outputs, the United States of America ranked first with 126 articles, far from the second place obtained by the United Kingdom with 80 articles. Australia, Japan, South Africa, Italy, France, Canada, Spain and Portugal, ranked third to tenth with a total numbers of articles of 53, 48, 36, 35, 30, 30, 25, 23, respectively.
Moving to the countries that contributed in the coastal tourism output, in Figure 9b, it was shown that the most collaborative country was the United Kingdom with 12 publications, followed by South Africa (5), Australia (5), Portugal (4), Italy (4), and the United States of America (3).
The total number of institutions involved in BE and coastal tourism scientific production were 747 and 90 articles, respectively. In BE literature, Ocean University of China and University of British Columbia were the two most productive academic institutions with 17 articles each, followed by Kenya Marine and Fisheries Research Institute (16), University of Washington (13) and University of Wollongong (11), as shown in Table 2. Comparing the most productive institutions and countries in the BE scientific field, it was shown that these two listed corresponded, where United States, United Kingdom, Australia, China and South Africa placed at the top of these lists, either for countries or institutions.
According to the coastal tourism scientific production, Nelson Mandela University was the most productive institution with five publications, followed by Heriot–WATT University, Independent Researcher, Kenya Marine and Fisheries Research Institute, and Rhodes University, with two articles each, as shown in Table 2.
3.2. Basic Contents of the Extracted Literature
3.2.1. Keywords and Burst Analysis
In general, keywords are considered to be one of the most important components of any research paper that aims to identify the core research topics in different scientific research fields [65]. In biometric analysis, there are two types of keywords: (i) Author’s Keywords (DE) that are provided by authors, and (ii) Keywords Plus (ID), those produced by bibliometrics analysis software based on computer algorithms [67]. These two keyword categories were combined and analyzed together. Using CiteSpace software, the co-word analysis networks were mapped based on keywords frequency in the two studied research areas (BE and coastal tourism). Figure 10a shows the co-word analysis of BE literature; it shows that the most frequent keywords were blue economy (n = 197), sustainable development (n = 78), sustainability (n = 44), marine environment (n = 44), economics (n = 38), oceanography (n = 32), fishery (31), and blue growth (n = 30). This network also shows that the keywords that form the main conceptual kernel of BE, such as economy and sustainability, were ranked at the top of the most frequent keywords; this emphasizes the novelty of the BE scientific area, which has been under research since the term’s appearance in 2012. It also appears in this network that there was a clear absence of keywords that referred to coastal tourism, despite its importance as one of the most economically valuable BE sectors, as mentioned previously.
Figure 10b shows the co-word analysis of the coastal tourism scientific production. Sustainable development, blue growth, sustainability, fishery, environmental economics and tourism were the most frequent keywords with frequency numbers of 27, 10, 7, 6, 4, 4, 4, respectively. This network in Figure 10b also shows an analogy between its keywords and BE keywords, which seems to be logical because coastal tourism is an integral part of BE sectors, and it cannot be discussed in isolation from the general idea of BE. It is noteworthy that terms related to tourism appeared directly and clearly in this network, such as tourism, tourism development and coastal tourism. It is also worthwhile mentioning that there were some keywords related to the two research fields (BE and coastal tourism) that did not appear in the co-word analysis networks. For example, “sustainable tourism,” despite its direct and explicit link to the research field, was not represented by any node in the co-word analysis networks.
Burst term represents the sudden increase in using a keyword or citing a paper for a certain period of time, and it is vital to identify the research frontier for the focused scientific field [68]. Figure 11a shows a list of nine keywords extracted from BE literature and ranked by the strength of citation burst. The red lines refer to the keyword citation burst, while blue lines refer to the time. In BE scientific production, the top three keywords with the strongest citation bursts were economic activity (4.28), marine engineering (3.06), and coastal zone (2.81). Moreover, by looking to the time period columns in Figure 11a, it can be seen that the early papers published after the emergence of the BE term in 2012 were focused on the main BE pillars. For example, the keywords with the strongest citation bursts were coastal zone and natural resource. Recent studies have discussed the spatial dimension of the BE approach, where the strongest citation burst keywords were Indian Ocean and South Africa, and this depicts the development of BE research frontiers.
Moving to the top six strongest citation burst keywords in the coastal tourism scientific field, which appear in Figure 11b, it can be seen that the top-ranked keywords were climate change (1.39), economic activity (1.22), and economics (1.22). Also, by focusing on the relation between the keyword burst and the timespan, it can be concluded that the interest in coastal tourism as a part of BE scientific production appeared in recent years, since four out of the six keywords in Figure 11b appeared between 2019 and 2020 (climate change, marine environment, spatial planning and blue economy). Simultaneously, only two keywords with the strongest citation bursts appeared between 2016 and 2018 (economic activity and economics), which were not considered an early period of time, either.
3.2.2. Reference Analysis
Bibliometrics analysis has many variant indicators, and the co-cited references is one of most significant citation networks in this type of analysis [69]. The reference analysis identifies the articles that received the most citations and that are considered a key reference in the scientific field and highlights these articles’ authors [69,70]. Using CiteSpace, a co-cited reference network was built for the two focused scientific fields (BE and coastal tourism), as shown in Figure 12.
The co-cited reference clustering network related to BE literature is depicted in Figure 12a. The references that received the highest citations were authored by Silver JJ (2015) [5], Voyer M (2018) [12], Eikset A (2018) [7], Barbsegaard (2018) [71], Winder GM (2017) [72], and Hadjimichael M (2018) [62]. These articles were at the forefront of references cited by BE research papers’ authors.
The BE co-cited reference network was divided into nine co-citation clusters and categorized according to time (see Figure 13). The largest cluster was cluster (#0), which was labeled as “blue economy” and contained 110 references. The second largest cluster (#1) had 67 references and was also labeled “blue economy.” The third largest, so-called “Irish marine economy,” had 43 references. The rest of the clusters were “UK marine” (#3), “sustainable ocean economy” (#4), “marine resource” (#5), “oceans governance” (#6), and “marine science” (#7 and #8).
As is clear from Figure 13, the first two clusters had the same title, “blue economy,” and they also appeared in the early periods (2011 and 2014) directly after the release of the BE term. This indicates the focusing on references that discussed the definition of the BE concept in general without dealing with complex research studies or application of this approach and analyzing its results. It was also evident that most of the clusters flourished from 2014 to 2020, indicating the novelty of BE as a research field in recent years, which is expected to continue.
It is worthwhile mentioning that each cluster has its own silhouette value (S value), which is one of the structure metrics measuring the homogeneity of the created clusters and developed networks. It takes a value between (1, −1); the closer the S value to 1, the higher the precision and reliability of the cluster. Figure 13 shows the nine BE clusters’ S values, ranged between 0.99 (the highest value, cluster #8) and 7.99 (the lowest value, cluster #4). These high S values reflected the validity and reliability of these clusters, which can be trusted in conducting the reference network analysis.
Regarding the co-cited reference network of coastal tourism scientific production, the most cited references were authored by Silver JJ (2015) [5], Barbsegaard (2018) [71], Douvere F (2008) [73], and Kidow JT (2010) [74], as shown in Figure 12b These cited references were divided into four clusters and presented in a time-view co-cited reference network (see Figure 14). The largest cluster (#0) had 27 references and was labeled as “marine national park” with a 0.918 S value. The second largest cluster (#1), also called “marine national park,” had 16 references with a 0.961 S value. The third largest cluster (#2) had 15 references and was labeled as “blue economy” with a 0.89 S value. Finally, the fourth cluster (#3) had 15 references with a 0.919 S value and was labeled as “scientific research.”
Comparing the co-cited reference networks for the two focused scientific fields (BE and coastal tourism), a vivid similarity was seen between the cited references in these two networks, indicating there was no specialization in the references used in published research papers for both scientific fields.
3.3. Relation between Bibliometric Analysis Units
This third bibliometric analysis level demonstrates the relation between the different bibliometric analysis units used to extrapolate the most important observations based on this relationship. The three-fields plot, also known as a Sankey diagram, was the visualization diagram used to depict the relation between three different analytical units. Figure 15 shows the relation between keywords, authors, and sources in the BE scientific field as presented by a three-fields plot. By observing the flow between these three bibliometric analysis units, it can be seen that the main interests of BE scholars were blue economy, ocean economy and fisheries. Moreover, most BE articles were published by Bennett NJ, Voyer M, and Quirk G, while the most active source was Marine Policy.
Figure 16 shows the relation between the same three bibliometric analysis units (keywords, authors, and sources), but in coastal tourism literature. Blue economy was the most researched topic in the coastal tourism scientific field, and it was covered by the most scholars, such as Kolesnikov M and Potts T. Moreover, Natural Resources Forum was the leading source publishing articles in coastal tourism literature, based on its collaborations with various authors.
4. Conclusions
The literature on the blue economy (BE) scientific field has been increasing dramatically since the term’s emergence in the United Nations Conference on Sustainable Development (UNCSD) in 2012 (Rio +20). By reviewing the seven main sectors that formed the BE approach, we found that coastal tourism was the most active BE sector participating in providing job opportunities or sharing in the gross value added (GVA).
This paper aimed to identify and analyze global scientific production in both BE and coastal tourism. Bibliometric analysis was conducted to analyze 476 and 49 publications in BE and coastal tourism, respectively. These data sets were extracted from the Scopus database for 2012–2020, and they were analyzed using different bibliometric techniques and visualization tools, such as co-citation analysis, collaboration analysis, co-word analysis, burst analysis, and dynamics analysis. This paper focused on identifying the comprehensive principle in conducting this bibliometric analysis, so sets of different bibliometric units were precisely analyzed, such as authors, sources, documents, countries, institutions, references, and keywords. Also, this research used three main software packages to conduct the bibliometric analysis and visualize the results, R Programming Language, CiteSpace, and VOSviewer.
The BE bibliometric analysis results were very rich and had various core topics in different disciplines. Furthermore, it has increased significantly over recent years and this is expected to continue. This is in addition to the presence of many journals that participated in publishing BE articles, which reflect the diversity in the topics discussed relating to BE and prove the importance of its various economic sectors.
Through the author analysis of the research articles published in the BE field, we found that there was a collaboration between the most productive authors in this field, but it must be noted that this collaboration took place through specific disciplines within this field (BE sectors), and this reflects the lack of author collaboration between various BE sectors and only focuses on the enrichment of scientific research in each discipline. In the future, this may open the door to discussing the impact that will happen in the scientific production resulting from the collaboration between authors from different BE disciplines, which will enrich this field and create new ideas for future scientific research. Likewise, despite the official emergence of the BE term in 2012 and the abundance of scientific production in this field so far, the most prosperous period has been since 2017, when many scholars participated in publishing articles related to this field and received many citations.
By reviewing the analyses of BE scientific production throughout the countries and the academic institutions that participated in publishing, we found confirmation of the “universality/global” of this research field, and this was evidenced by the participation of about 55% of the countries of the world in the production of research articles related BE, in addition to the diversity of the countries that ranked at the top of the 10 most productive countries according to the scientific production of BE, where these countries represented five different continents (North America, Europe, Australia, Asia, and Africa).
Keyword and reference analysis for BE clearly showed that research trends in this field have gone in three directions: (i) economic and management dimension, which shows interest in economics, governance, fishery management, and decision making; (ii) environmental dimension, which shows interest in sustainable development, sustainability, marine environment, climate change, and blue growth; (iii) spatial dimension, which shows interest in ocean geography, spatial planning, and coastal zone. It also showed the novelty of the BE concept, as the word “blue economy” dominated as a major topic in most published articles with a far higher frequency than the nearest of other words. This indicated that this term still occupied the interest of scholars through its definition and origins; in other words, whatever the idea or the aim of the published articles, the authors discussed the BE definition and mentioned the roots of its appearance.
According to coastal tourism literature, a different manner was observed. In general, the coastal tourism scientific production was poor and most of the articles published in this field did not discuss coastal tourism separately, but discussed it in a combination with the other BE sectors, and this did not correspond with the importance of the coastal tourism sector in the BE approach. Bibliometrics analysis of coastal tourism showed the core topics and the future research interest in two scientific areas: (i) sustainable development, highlighting the negative effects of coastal tourism in the ocean ecosystem; (ii) economic development, which reflects the importance of the economic side of coastal tourism as one of the most significant sectors in the global tourism industry [15]. These two interest areas (sustainability and economy) are two main pillars in BE concept.
Table 3 shows the overall results of the different bibliometric analysis levels and units in this research, divided into the two main scientific fields, BE and coastal tourism.
5. Limitations and Future Research
The main limitations in this study are due to the bibliometric analysis, which was the selected literature review method that the research relied on in analyzing the scientific production of BE and coastal tourism. Using Scopus as the main database for collected literature in this study is considered the first limitation. Although Scopus is one of the largest and most reliable global databases, combining Scopus with other databases such as Web of Science (WOS) may give an opportunity for a deeper bibliometric analysis and thus will lead to better and more reliable results. Furthermore, often in the bibliometric analysis, exclusion criteria are used to refine the collected publications (e.g., paper language; type of documents), and although this research did not address any of these exclusion criteria, determining the time period for the research from 2012 to 2020 may be one of the limitations of this study.
In the future, this research could be conducted by using different research queries, timespan, or bibliometric analysis parameters. Furthermore, this study can be followed with content analysis or any other qualitative analysis methods that can present deep and new information or findings related to BE and coastal tourism.
Author Contributions
Conceptualization, M.K. and S.P.; methodology, M.K. and S.P.; validation, L.D.D.; investigation, M.K. and S.P.; resources, M.K. and S.P.; writing—original draft preparation, M.K. and S.P.; writing—review and editing, M.K., S.P. and L.D.D.; visualization, M.K.; supervision, L.D.D.; project administration, R.M. and L.D.D.; funding acquisition, R.M. and L.D.D. All authors have read and agreed to the published version of the manuscript.
Funding
This research received no external funding.
Institutional Review Board Statement
Not applicable.
Informed Consent Statement
Not applicable.
Data Availability Statement
The data presented in this study are available on request from the corresponding author.
Acknowledgments
This research is supported by the Hungarian University of Agriculture and Life Sciences (MATE), Cairo University, and STIE Pariwisata API of Indonesia. Also, the authors would like to thank Ebtehal Ahmed Abd-AlMoity (Faculty of Urban and Regional Planning, Cairo University, Egypt) for her continued help and support.
Conflicts of Interest
There is no conflict of interests related to this research.
References
- OECD (Ed.) The Ocean Economy in 2030; OECD Publishing: Paris, France, 2016; ISBN 978-92-64-25172-4. [Google Scholar]
- United Nations. Blue Economy Concept Paper; United Nations: New York, NY, USA, 2014. [Google Scholar]
- UNCTAD. The Oceans Economy: Opportunities and Challenges for Small Island Developing States; Unite Nations: New York, NY, USA, 2014; p. 40. [Google Scholar]
- Bigg, G.R.; Jickells, T.D.; Liss, P.S.; Osborn, T.J. The Role of the Oceans in Climate. Int. J. Climatol. 2003, 23, 1127–1159. [Google Scholar] [CrossRef]
- Silver, J.J.; Gray, N.J.; Campbell, L.M.; Fairbanks, L.W.; Gruby, R.L. Blue Economy and Competing Discourses in International Oceans Governance. J. Environ. Dev. 2015, 24, 135–160. [Google Scholar] [CrossRef]
- Smith-Godfrey, S. Defining the Blue Economy. Marit. Aff. J Natl. Marit. Found. India 2016, 12, 58–64. [Google Scholar] [CrossRef]
- Eikeset, A.M.; Mazzarella, A.B.; Davíðsdóttir, B.; Klinger, D.H.; Levin, S.A.; Rovenskaya, E.; Stenseth, N.C. What Is Blue Growth? The Semantics of “Sustainable Development” of Marine Environments. Mar. Policy 2018, 87, 177–179. [Google Scholar] [CrossRef]
- Ababouch, L. Fisheries and Aquaculture in the Context of Blue Economy; United Nations (Economic Commission of Africa): Dakar, Senegal, 2015; p. 16. [Google Scholar]
- European Commission. Annual Economic Report on the EU Blue Economy; European Commission: Brussels, Belgium, 2018. [Google Scholar]
- Lee, K.-H.; Noh, J.; Khim, J.S. The Blue Economy and the United Nations’ Sustainable Development Goals: Challenges and Opportunities. Environ. Int. 2020, 137, 105528. [Google Scholar] [CrossRef]
- Karani, P.; Failler, P. Comparative Coastal and Marine Tourism, Climate Change, and the Blue Economy in African Large Marine Ecosystems. Environ. Dev. 2020, 36, 100572. [Google Scholar] [CrossRef]
- Voyer, M. Shades of Blue: What Do Competing Interpretations of the Blue Economy Mean for Oceans Governance? J. Environ. Policy Plan. 2018, 23, 595–616. [Google Scholar] [CrossRef] [Green Version]
- Garland, M.; Axon, S.; Graziano, M.; Morrissey, J.; Heidkamp, C.P. The Blue Economy: Identifying Geographic Concepts and Sensitivities. Geogr. Compass 2019. [Google Scholar] [CrossRef] [Green Version]
- European Commission The EU Blue Economy Report 2020; Publications Office of the European Union: Luxembourg, 2020.
- Ghosh, T. Sustainable Coastal Tourism: Problems and Management Options. J. Geogr. Geol. 2012, 4, 163. [Google Scholar] [CrossRef]
- World Tourism Organization. Sustainable Tourism Governance and Management in Coastal Areas of Africa; UNWTO, Ed.; World Tourism Organization (UNWTO): Madrid, Spain, 2013; ISBN 978-92-844-1474-1. [Google Scholar]
- Nunes, L.J.R.; Raposo, M.A.M.; Gomes, C.J.P. The Impact of Tourism Activity on Coastal Biodiversity: A Case Study at Praia Da Cova Redonda (Algarve—Portugal). Environments 2020, 7, 88. [Google Scholar] [CrossRef]
- Mola, F.; Shafaei, F.; Mohamed, B. Tourism and the Environment: Issues of Concern and Sustainability of Southern Part of the Caspian Sea Coastal Areas. J. Sustain. Dev. 2012, 5, 2. [Google Scholar] [CrossRef]
- Tselentis, B.S.; Prokopiou, D.G.; Bousbouras, D.; Toanoglou, M. Environmental Impacts Caused by the Tourist Industry in Elafonisos Island and the Neapoli District, Greece. In Proceedings of the Ecosytems and Sustainable Development VI; WIT Press: Coimbra, Portugal, 2007; Volume I, pp. 375–385. [Google Scholar]
- Ghosh, T. Coastal Tourism: Opportunity and Sustainability. J. Sustain. Dev. 2011, 4, 67. [Google Scholar] [CrossRef] [Green Version]
- Osareh, F. Bibliometrics, Citation Analysis and Co-Citation Analysis: A Review of Literature I. Libri 1996, 46. [Google Scholar] [CrossRef]
- Aria, M.; Cuccurullo, C. Bibliometrix: An R-Tool for Comprehensive Science Mapping Analysis. J. Informetr. 2017, 11, 959–975. [Google Scholar] [CrossRef]
- Maditati, D.R.; Munim, Z.H.; Schramm, H.-J.; Kummer, S. A Review of Green Supply Chain Management: From Bibliometric Analysis to a Conceptual Framework and Future Research Directions. Resour. Conserv. Recycl. 2018, 139, 150–162. [Google Scholar] [CrossRef]
- Guo, Y.-M.; Huang, Z.-L.; Guo, J.; Li, H.; Guo, X.-R.; Nkeli, M.J. Bibliometric Analysis on Smart Cities Research. Sustainability 2019, 11, 3606. [Google Scholar] [CrossRef] [Green Version]
- Camón Luis, E.; Celma, D. Circular Economy. A Review and Bibliometric Analysis. Sustainability 2020, 12, 6381. [Google Scholar] [CrossRef]
- Qureshi, M.I.; Khan, N.; Qayyum, S.; Malik, S.; Hishan, S.S.; Ramayah, T. Classifications of Sustainable Manufacturing Practices in ASEAN Region: A Systematic Review and Bibliometric Analysis of the Past Decade of Research. Sustainability 2020, 12, 8950. [Google Scholar] [CrossRef]
- Hallinger, P.; Nguyen, V.-T. Mapping the Landscape and Structure of Research on Education for Sustainable Development: A Bibliometric Review. Sustainability 2020, 12, 1947. [Google Scholar] [CrossRef] [Green Version]
- Rosato, P.F.; Caputo, A.; Valente, D.; Pizzi, S. 2030 Agenda and Sustainable Business Models in Tourism: A Bibliometric Analysis. Ecol. Indic. 2021, 121, 106978. [Google Scholar] [CrossRef]
- Archambault, É.; Gagné, É.V. The Use of Bibliometrics in the Social Sciences and Humanities; Social Sciences and Humanities Research Council of Canada (SSHRCC): Ottawa, ON, Canada, 2004; p. 79. [Google Scholar]
- Garfield, E.; Paris, S.W.; Stock, W.G. HistCiteTM: A Software Tool for Informetric Analysis of Citation Linkage. Inf. Wiss. Prax. 2006, 10, 391. [Google Scholar]
- Van Eck, N.J.; Waltman, L. CitNetExplorer: A New Software Tool for Analyzing and Visualizing Citation Networks. J. Informetr. 2014, 8, 802–823. [Google Scholar] [CrossRef] [Green Version]
- Van Eck, N.J.; Waltman, L. Software Survey: VOSviewer, a Computer Program for Bibliometric Mapping. Scientometrics 2010, 84, 523–538. [Google Scholar] [CrossRef] [Green Version]
- Cobo, M.J.; López-Herrera, A.G.; Herrera-Viedma, E.; Herrera, F. SciMAT: A New Science Mapping Analysis Software Tool. J. Am. Soc. Inf. Sci. Technol. 2012, 63, 1609–1630. [Google Scholar] [CrossRef]
- Sci2 Team. Science of Science (Sci2) Tool. Indiana University and SciTech Strategies. Available online: https://sci2.cns.iu.edu (accessed on 12 December 2020).
- Chaomei Chen CiteSpace. Available online: https://citespace.podia.com/ (accessed on 12 December 2020).
- Guler, A.T.; Waaijer, C.J.F.; Mohammed, Y.; Palmblad, M. Automating Bibliometric Analyses Using Taverna Scientific Workflows: A Tutorial on Integrating Web Services. J. Informetr. 2016, 10, 830–841. [Google Scholar] [CrossRef] [Green Version]
- Tang, M.; Liao, H.; Wan, Z.; Herrera-Viedma, E.; Rosen, M. Ten Years of Sustainability (2009 to 2018): A Bibliometric Overview. Sustainability 2018, 10, 1655. [Google Scholar] [CrossRef]
- Zhao, L.; Tang, Z.; Zou, X. Mapping the Knowledge Domain of Smart-City Research: A Bibliometric and Scientometric Analysis. Sustainability 2019, 11, 6648. [Google Scholar] [CrossRef] [Green Version]
- Deng, W.; Liang, Q.; Li, J.; Wang, W. Science Mapping: A Bibliometric Analysis of Female Entrepreneurship Studies. Gender Manag. Int. J. 2020, 36, 61–86. [Google Scholar] [CrossRef]
- R Core Team R: A Language and Environment for Statistical Computing; R Foundation for Statistical Computing: Vienna, Austria, 2016.
- Venables, W.N.; Smith, D.M. An Introduction to R; R Foundation for Statistical Computing: Vienna, Austria, 2020. [Google Scholar]
- Massimo Aria; Corrado Cuccurullo Bibliometrix R-Package. Available online: https://bibliometrix.org/ (accessed on 20 December 2020).
- Salisbury, L. Web of Science and Scopus: A Comparative Review of Content and Searching Capabilities. Charlest. Advis. 2009, 11, 5–18. [Google Scholar]
- Elsevier Scopus Data|Curated. Connected. Complete. Available online: https://www.elsevier.com/solutions/scopus (accessed on 17 December 2020).
- Rabindra, K. Maharana Bibliometric Analysis of Orissa University of Agricultural Technology’s Research Output as Indexed in Scopus in 2008-2012. Chin. Librariansh. Int. Electron. J. 2013, 36, 10. [Google Scholar]
- Morandi, G.; Guido, D.; Tagliabue, A. A Bibliometric Study of Scientific Literature on the Dietary Therapies for Epilepsy in Scopus. Nutr. Neurosci. 2015, 18, 201–209. [Google Scholar] [CrossRef] [PubMed]
- De Netto, C.O.; Tello-Gamarra, J.E. Sharing Economy: A Bibliometric Analysis, Research Trends and Research Agenda. J. Technol. Manag. Innov. 2020, 15, 41–55. [Google Scholar] [CrossRef]
- Scopus Scopus Tip & Trick: Search Smarter, Find Faster. Available online: https://blog.scopus.com/posts/scopus-tip-trick-search-smarter-find-faster (accessed on 13 December 2020).
- Herrera-Franco, G.; Montalván-Burbano, N.; Carrión-Mero, P.; Apolo-Masache, B.; Jaya-Montalvo, M. Research Trends in Geotourism: A Bibliometric Analysis Using the Scopus Database. Geosciences 2020, 10, 379. [Google Scholar] [CrossRef]
- Rodríguez-Soler, R.; Uribe-Toril, J.; De Pablo Valenciano, J. Worldwide Trends in the Scientific Production on Rural Depopulation, a Bibliometric Analysis Using Bibliometrix R-Tool. Land Use Policy 2020, 97, 104787. [Google Scholar] [CrossRef]
- Van Raan, A.F.J. For Your Citations Only? Hot Topics in Bibliometric Analysis. Meas. Interdiscip. Res. Perspect. 2005, 3, 50–62. [Google Scholar] [CrossRef]
- Aria, M.; Cuccurullo, C. Biblioshiny: Bibliometrix for No Coders. Available online: https://www.bibliometrix.org/Biblioshiny.html (accessed on 20 December 2020).
- Zupic, I.; Čater, T. Bibliometric Methods in Management and Organization. Organ. Res. Methods 2015, 18, 429–472. [Google Scholar] [CrossRef]
- Agbo, F.J.; Oyelere, S.S.; Suhonen, J.; Tukiainen, M. Scientific Production and Thematic Breakthroughs in Smart Learning Environments: A Bibliometric Analysis. Smart Learn. Environ. 2021, 8, 1. [Google Scholar] [CrossRef]
- Forliano, C.; De Bernardi, P.; Yahiaoui, D. Entrepreneurial Universities: A Bibliometric Analysis within the Business and Management Domains. Technol. Forecast. Soc. Chang. 2021, 165, 120522. [Google Scholar] [CrossRef]
- Bueger, C. What Is Maritime Security? Marine Policy 2015, 6, 159–164. [Google Scholar] [CrossRef]
- Morrissey, K.; O’Donoghue, C. The Role of the Marine Sector in the Irish National Economy: An Input–Output Analysis. Mar. Policy 2013, 37, 230–238. [Google Scholar] [CrossRef] [Green Version]
- Raakjaer, J.; van Leeuwen, J.; van Tatenhove, J.; Hadjimichael, M. Ecosystem-Based Marine Management in European Regional Seas Calls for Nested Governance Structures and Coordination—A Policy Brief. Mar. Policy 2014, 50, 373–381. [Google Scholar] [CrossRef]
- Bennett, N.J. Navigating a Just and Inclusive Path towards Sustainable Oceans. Mar. Policy 2018, 97, 139–146. [Google Scholar] [CrossRef] [Green Version]
- Zhao, R. Defining and Quantifying China’s Ocean Economy. Mar. Policy 2014, 43, 164–173. [Google Scholar] [CrossRef]
- Pinto, H.; Cruz, A.R.; Combe, C. Cooperation and the Emergence of Maritime Clusters in the Atlantic: Analysis and Implications of Innovation and Human Capital for Blue Growth. Mar. Policy 2015, 57, 167–177. [Google Scholar] [CrossRef] [Green Version]
- Hadjimichael, M. A Call for a Blue Degrowth: Unravelling the European Union’s Fisheries and Maritime Policies. Mar. Policy 2018, 94, 158–164. [Google Scholar] [CrossRef] [Green Version]
- Cisneros-Montemayor, A.M.; Becerril-García, E.E.; Berdeja-Zavala, O.; Ayala-Bocos, A. Shark ecotourism in Mexico: Scientific research, conservation, and contribution to a Blue Economy. In Advances in Marine Biology; Elsevier: Amsterdam, The Netherlands, 2020; Volume 85, pp. 71–92. ISBN 978-0-12-822199-0. [Google Scholar]
- Dimopoulos, D.; Queiros, D.; van Zyl, C. Sinking Deeper: The Most Significant Risks Impacting the Dive Tourism Industry in the East African Marine Ecoregion. Ocean Coast. Manag. 2019, 181, 104897. [Google Scholar] [CrossRef]
- Gao, F.; Jia, X.; Zhao, Z.; Chen, C.-C.; Xu, F.; Geng, Z.; Song, X. Bibliometric Analysis on Tendency and Topics of Artificial Intelligence over Last Decade. Microsyst. Technol. 2019. [Google Scholar] [CrossRef]
- Wang, B.; Zhang, Q.; Cui, F. Scientific Research on Ecosystem Services and Human Well-Being: A Bibliometric Analysis. Ecol. Indic. 2021, 125, 107449. [Google Scholar] [CrossRef]
- Garfield, E. KeyWords PIus: 1S1’s Breakthrough Retrieval Method. Part 1. Expanding Your Searching Power on Current Contents on Diskette; Institute for Scientific Information: Philadelphia, PA, USA, 1990; Volume 32. [Google Scholar]
- Chen, C. CiteSpace II: Detecting and Visualizing Emerging Trends and Transient Patterns in Scientific Literature. J. Am. Soc. Inf. Sci. 2006, 57, 359–377. [Google Scholar] [CrossRef] [Green Version]
- Tang, C.; Liu, D.; Fan, Y.; Yu, J.; Li, C.; Su, J.; Wang, C. Visualization and Bibliometric Analysis of CAMP Signaling System Research Trends and Hotspots in Cancer. J. Cancer 2021, 12, 358–370. [Google Scholar] [CrossRef]
- Hui, J.; Wang, L.; Liu, R.; Yang, C.; Zhang, H.; He, S.; Chen, Z.; Wei, A. A Bibliometric Analysis of International Publication Trends in Premature Ejaculation Research (2008–2018). Int. J. Impot. Res. 2021, 33, 86–95. [Google Scholar] [CrossRef]
- Barbesgaard, M. Blue Growth: Savior or Ocean Grabbing? J. Peasant Stud. 2018, 45, 130–149. [Google Scholar] [CrossRef]
- Winder, G.M.; Le Heron, R. Assembling a Blue Economy Moment? Geographic Engagement with Globalizing Biological-Economic Relations in Multi-Use Marine Environments. Dialogues Hum. Geogr. 2017, 7, 3–26. [Google Scholar] [CrossRef] [Green Version]
- Douvere, F. The Importance of Marine Spatial Planning in Advancing Ecosystem-Based Sea Use Management. Mar. Policy 2008, 32, 762–771. [Google Scholar] [CrossRef]
- Kildow, J.T.; McIlgorm, A. The Importance of Estimating the Contribution of the Oceans to National Economies. Mar. Policy 2010, 34, 367–374. [Google Scholar] [CrossRef]
Figure 1.
Blue economy (BE) sectors contribution in the EU economy; (a) BE sector contributions in providing job opportunities; (b) BE sector contributions in the gross value added (GVA). Source: [9].
Figure 1.
Blue economy (BE) sectors contribution in the EU economy; (a) BE sector contributions in providing job opportunities; (b) BE sector contributions in the gross value added (GVA). Source: [9].

Figure 2.
The Boolean operators used to extract data sets from the Scopus database.

Figure 3.
The annual scientific production in BE and coastal tourism. Note: NP: number of publications. Source: researcher, derived from R Programming Language (bibliometrix package).
Figure 3.
The annual scientific production in BE and coastal tourism. Note: NP: number of publications. Source: researcher, derived from R Programming Language (bibliometrix package).

Figure 4.
The relation between the source number of publications (NP) and total citations (TC); (a) BE scientific field; (b) coastal tourism scientific field. Source: researcher, derived from R Programming Language (bibliometrix package).
Figure 4.
The relation between the source number of publications (NP) and total citations (TC); (a) BE scientific field; (b) coastal tourism scientific field. Source: researcher, derived from R Programming Language (bibliometrix package).

Figure 5.
Author collaboration network; (a) BE author collaboration network visualization; (b) coastal tourism author collaboration network visualization. Legend: Color: represents a cluster of disciplines of interest in the research field; Nodes: represent authors (node size based on TC); Links: represent co-authorships; Link Thickness: represents the co-authorships strength. Note: clusters formed based on three parameters in VOSviewer software (clusters resolution 0.06; minimum cluster size 1; merge small clusters). Source: researcher, derived from VOSviewer.

Figure 6.
Author scientific production over time; (a) BE scientific field; (b) coastal tourism scientific field. Legend: Line: represents author’s publishing timeline; Bubble Size: represents proportional to NP; Bubble Color Intensity: represents proportional to TC/year. Note: NP: number of publications; TC: total citations. Source: researcher, derived from R Programming Language (bibliometrix package).

Figure 7.
The top 10 cited articles in the BE literature. Legend: Left: authors of top 10 cited articles and publication year; Middle: bar charts of article’s number of citations; Right: titles of top 10 cited articles. Source: researcher, derived from R Programming Language (bibliometrix package).
Figure 7.
The top 10 cited articles in the BE literature. Legend: Left: authors of top 10 cited articles and publication year; Middle: bar charts of article’s number of citations; Right: titles of top 10 cited articles. Source: researcher, derived from R Programming Language (bibliometrix package).

Figure 8.
The top 10 cited articles in coastal tourism literature. Legend: Left: authors of top 10 cited articles and publication year; Middle: bar charts with article’s number of citations; Right: titles of top 10 cited articles. Source: researcher, derived from R Programming Language (bibliometrix package).

Figure 9.
Country collaboration network. (a) BE scientific field; (b) coastal tourism scientific field. Legend: Node: represents countries (the size of the node represents the country’s scientific production); Link: represents collaborative relations between countries; Colors: represent the temporal orders of co-occurrence links between countries (outside purple circle represents nodes with centrality above 0.1/key hub countries). Source: researcher, derived from CiteSpace.

Figure 10.
Co-word analysis. (a) BE scientific field; (b) coastal tourism scientific field. Legend: Node: represents keywords (the size of node represents the keywords frequency); Link: represents relations between keywords (keywords mentioned together in published articles); Colors: represent the temporal orders of appearance of keywords (lighter color means closer time); Outside circle: dark-red circle represents keywords with centrality above 0.1/pivotal keywords). Source: researcher, derived from CiteSpace.

Figure 11.
Keyword citation bursts. (a) BE scientific field; (b) coastal tourism scientific field. Legend: Blue line: represents the period of study; Red line: represents the citation burst period. Source: researcher, derived from CiteSpace.
Figure 11.
Keyword citation bursts. (a) BE scientific field; (b) coastal tourism scientific field. Legend: Blue line: represents the period of study; Red line: represents the citation burst period. Source: researcher, derived from CiteSpace.

Figure 12.
Co-cited reference network. (a) BE scientific field; (b) coastal tourism scientific field. Legend: Node: represents reference articles (the size of nodes represents the total citation of the references); Link: represents collaborative relations between reference articles; Colors: represent the temporal orders of co-occurrence links between reference articles (outside purple circle represents nodes with centrality above 0.1/key references articles). Source: researcher, derived from CiteSpace.

Figure 13.
Timeline view of clustered co-cited references in BE scientific field literature. Legend: Node: represents reference articles (the size of nodes represents the total citation of the references); Straight Lines: represent the clusters of references based on the clustering algorithm in CiteSpace; Curved lines: the time periods of cited reference articles. Source: researcher, derived from CiteSpace.

Figure 14.
Timeline view of clustered co-cited references in coastal tourism scientific field literature. Legend: Node: represents reference articles (the size of nodes represents the total citation of the references); Straight Lines: represent the clusters of references based on the clustering algorithm in CiteSpace; Curved lines: the time periods of cited reference articles. Source: researcher, derived from CiteSpace.

Figure 15.
Three-fields plot, relation between keywords (left), authors (middle), and sources (right) for BE literature. Source: researcher, derived from R Programming Language (biblioshiny: web interface of the bibliometrix package).
Figure 15.
Three-fields plot, relation between keywords (left), authors (middle), and sources (right) for BE literature. Source: researcher, derived from R Programming Language (biblioshiny: web interface of the bibliometrix package).

Figure 16.
Three-fields plot, relation between keywords (left), authors (middle), and sources (right) for coastal tourism literature. Source: researcher, derived from R Programming Language (biblioshiny: web interface of the bibliometrix package).
Figure 16.
Three-fields plot, relation between keywords (left), authors (middle), and sources (right) for coastal tourism literature. Source: researcher, derived from R Programming Language (biblioshiny: web interface of the bibliometrix package).


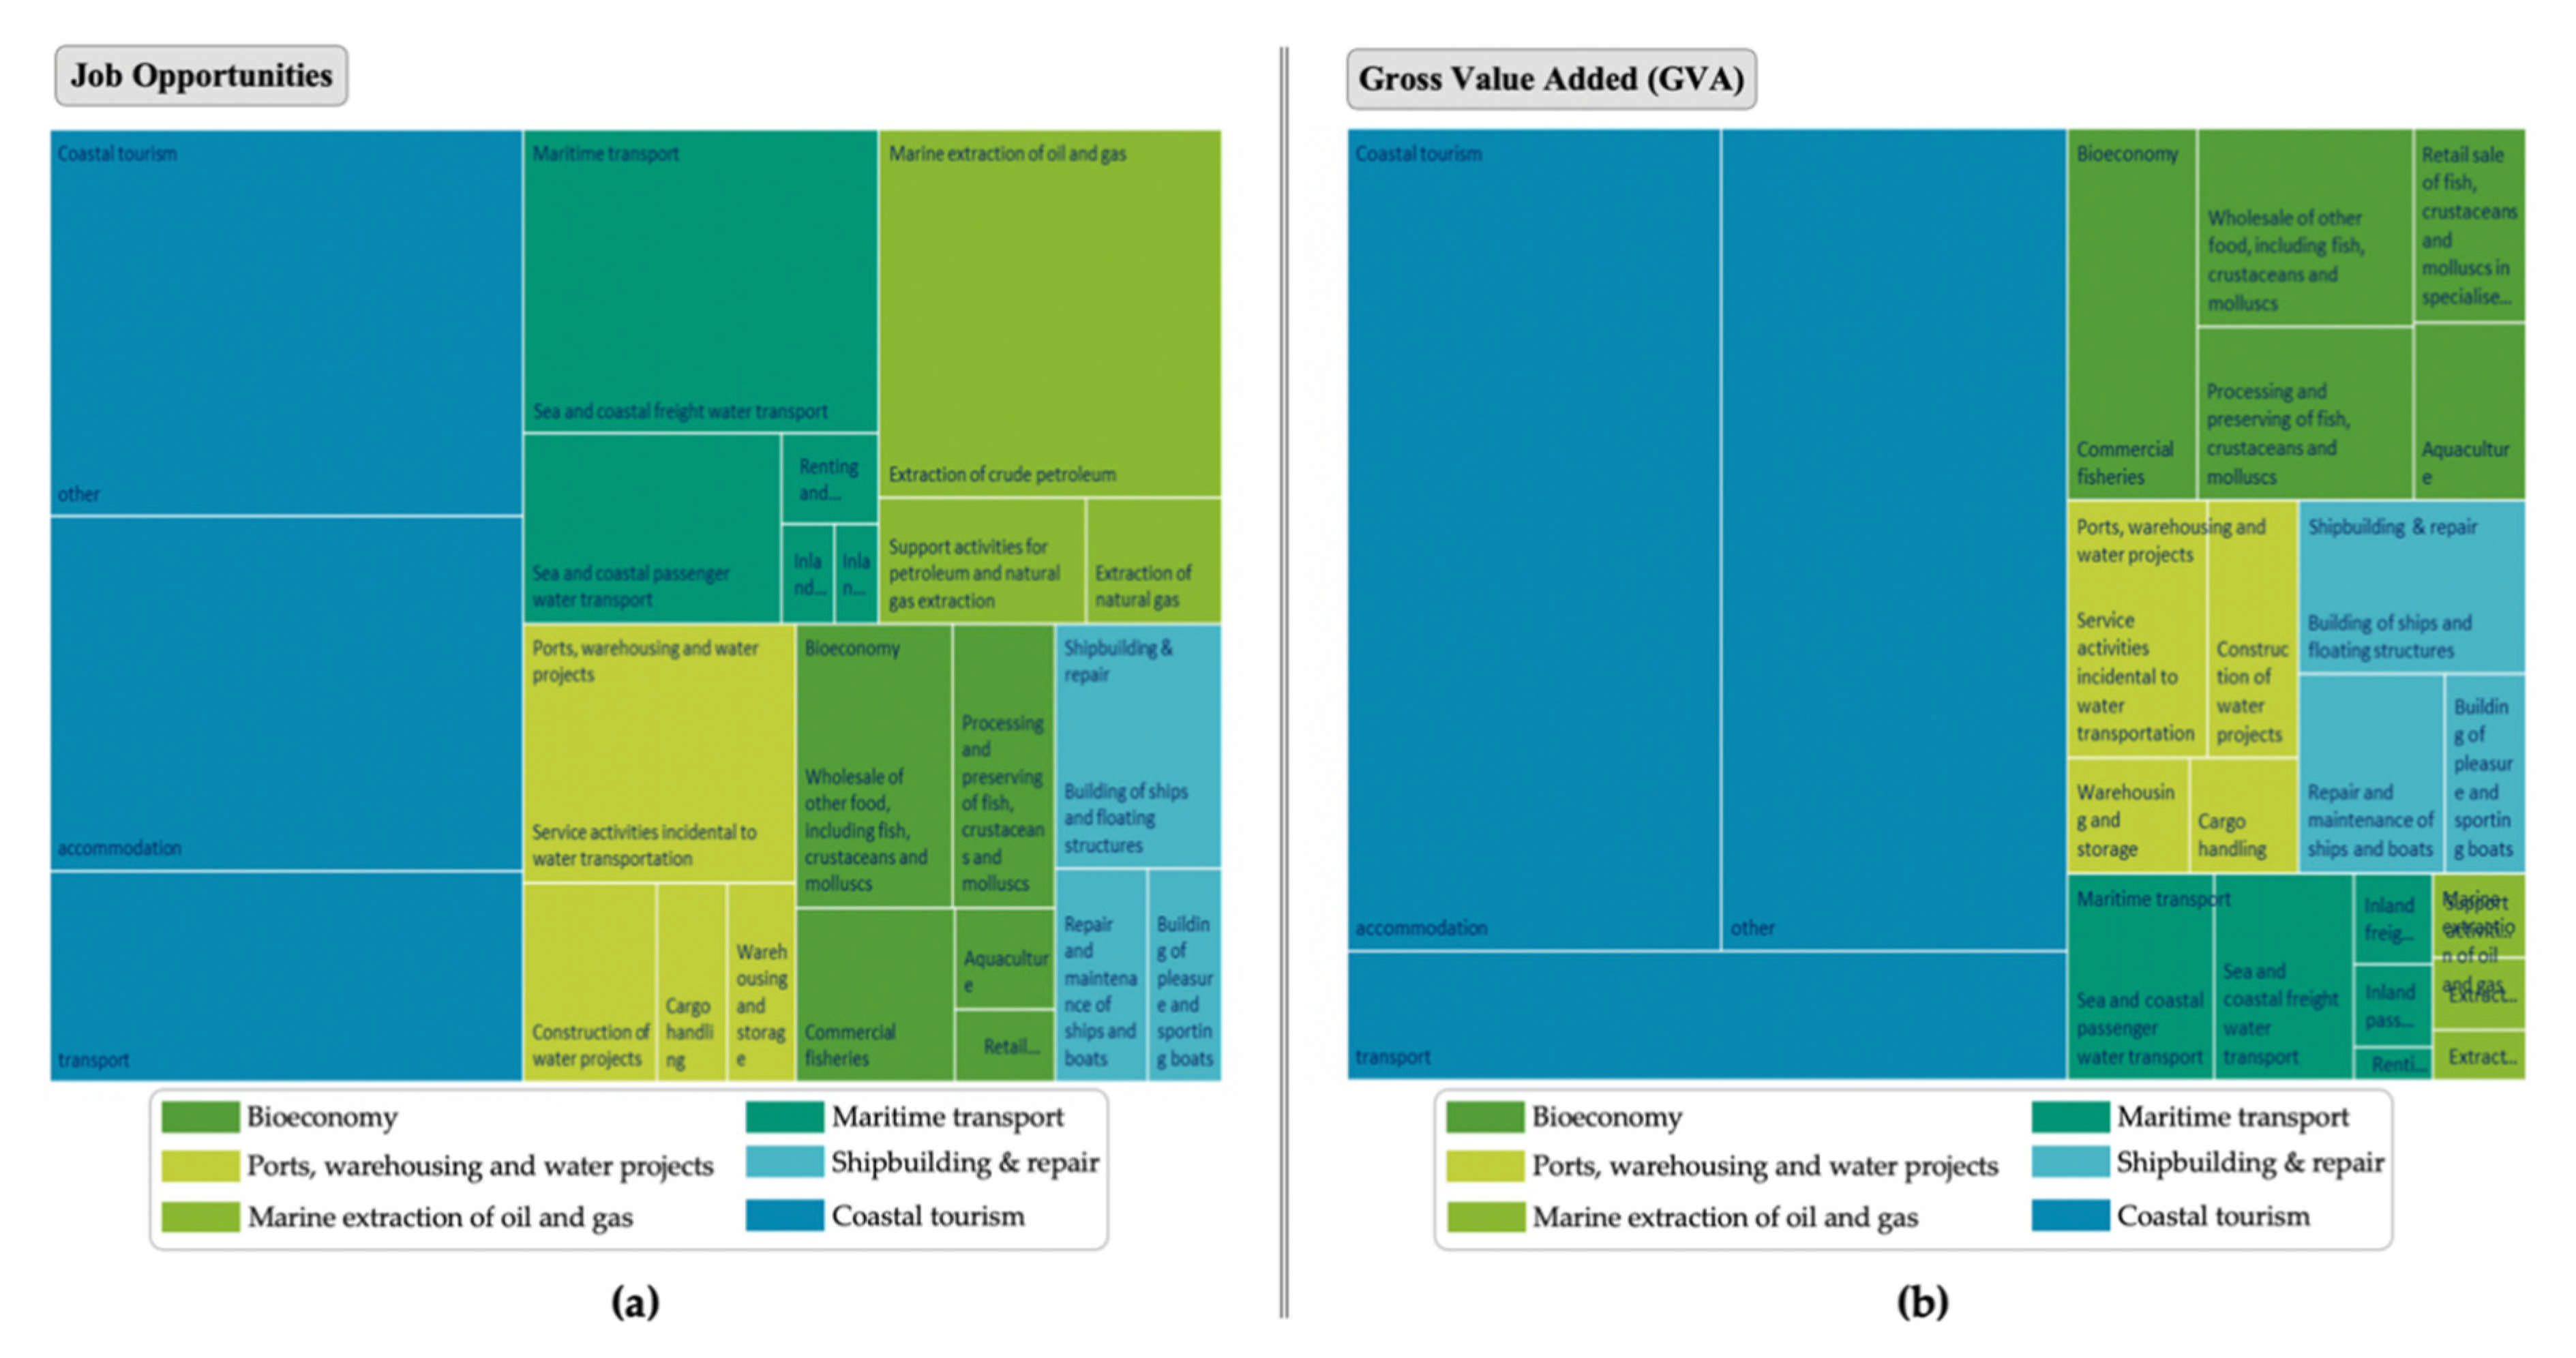
Table 1.
The bibliometric analysis, techniques, and software used in this study.
| Bibliometric Analysis | Bibliometric Analysis Scientific Fields | Bibliometric Technique Taxonomy | Visualization Technique | Used Software | ||
|---|---|---|---|---|---|---|
| Levels of Analysis | Units of Analysis | |||||
| Basic information of the extracted literature | Scientific production analysis | Blue Economy (BE) | Coastal Tourism | Annual scientific production | Statistical diagram bar chart | R language |
| Sources analysis | Most productive sources | Statistical diagram bar chart | R language | |||
| Sources dynamics analysis | Dynamic line graph | R language | ||||
| Authors analysis | Collaboration analysis | Network | VOSviewer | |||
| Authors production over time | Time-span line graph | R language | ||||
| Documents analysis | Most cited documents | Statistical diagram bar chart | R language | |||
| Countries and institutions analysis | Collaboration analysis | Network | CiteSpace | |||
| Basic contents of the extracted literature | Keywords and burst analysis | Co-word analysis | Network | CiteSpace | ||
| Burst analysis | Burst strength list | CiteSpace | ||||
| References analysis | Co-citation analysis | Network | CiteSpace | |||
| Relation between bibliometric analysis units | Relation analysis (keywords, authors, and sources) | Three-fields plot | R language | |||
Table 2.
The 10 most productive institutions in BE and coastal tourism literatures.
| Affiliations/Institutions (Blue Economy) | TP | Affiliations/Institutions (Coastal Tourism) | TP |
|---|---|---|---|
| Ocean University of China/CHINA | 17 | Nelson Mandela University/SOUTH AFRICA | 5 |
| University of British Columbia/COLUMBIA (British) | 17 | Heriot Watt University/SCOTLAND | 2 |
| Kenya Marine and Fisheries Research Institute/KENYA | 16 | Independent Researcher/NA | 2 |
| University of Washington/USA | 13 | Kenya Marine and Fisheries Research Institute/KENYA | 2 |
| University of Wollongong/AUSTRALIA | 11 | Rhodes University/SOUTH AFRICA | 2 |
| Duke University/USA | 9 | Universidad Autnoma De Baja California SUR/MEXICO | 2 |
| Nelson Mandela University/SOUTH AFRICA | 9 | Universiti Malaysia Terengganu/MALAYSIA | 2 |
| University of California/USA | 9 | University of Aberdeen/SCOTLAND | 2 |
| University of Tasmania/AUSTRALIA | 8 | University of Extremadura/SPAIN | 2 |
| Lancaster University/ENGLAND | 7 | University of Glasgow/SCOTLAND | 2 |
Note: TP: total publications (number). Source: researcher, derived from R Programming Language (bibliometrix package).
Table 3.
Overall bibliometric analysis results of BE and coastal tourism literatures.
| (a) Blue Economy | ||||||||||
| Ranking | Sources | Authors | Documents | Countries | Institutions | |||||
| Name | NP | Name | NP | Name | TC | Name | NP | Name | NP | |
| Top 1 | Marine Policy | 42 | Na Na | 13 | Silver JJ, 2015 (Blue Econo.) | 109 | USA | 126 | Ocean University of China | 17 |
| Top 2 | Frontiers in Marine Science | 21 | Failler P | 7 | Bueger C, 2015 (What is mar.) | 91 | UK | 80 | University of British Columbia | 17 |
| Top 3 | Journal of the Indian Ocean Region | 20 | Voyer M | 7 | Jobstvogt N, 2014 (Looking ble.) | 65 | Australia | 53 | Kenya Marine and Fisheries Research Institute | 16 |
| Top 4 | Journal of Coastal Research | 12 | Bennett Nj | 6 | Morrissey K, 2013 (The role o.) | 63 | Japan | 48 | University of Washington | 13 |
| Top 5 | Ocean and Coastal Management | 10 | Morrissey K | 6 | Winder GM, 207 (Assembling a.) | 50 | South Africa | 36 | University of Wollongong | 11 |
| (b) Coastal Tourism | ||||||||||
| Ranking | Sources | Authors | Documents | Countries | Institutions | |||||
| Name | NP | Name | NP | Name | TC | Name | NP | Name | NP | |
| Top 1 | Frontiers in Marine Science | 4 | Cisneros M | 2 | Pinto H, 2015 (Cooperation an.) | 39 | UK | 12 | Nelson Mandela University | 5 |
| Top 2 | Marine Policy | 3 | Kolesnikova M | 2 | Hadjimichael M, 2018 (A call fo.) | 27 | South Africa | 5 | Heriot Watt University | 2 |
| Top 3 | Journal of Coastal Research | 2 | Na Na | 2 | Llewellyn LE, 2016 (A roadma.) | 17 | Australia | 5 | Independent Researcher | 2 |
| Top 4 | Journal of the Indian Ocean Region | 2 | Potts T | 2 | Van Den Burg SWK, 2019 (Asses.) | 16 | Portugal | 4 | Kenya Marine and Fisheries Research Institute | 2 |
| Top 5 | Ocean and Coastal Management | 2 | Aguilar-M | 1 | Bari A, 2017 (Our oceans an.) | 13 | Italy | 4 | Rhodes University | 2 |
Note: NP: number of publications; TC: total citations. Source: researcher, derived from R Programming Language (bibliometrix package).
Publisher’s Note: MDPI stays neutral with regard to jurisdictional claims in published maps and institutional affiliations. |
© 2021 by the authors. Licensee MDPI, Basel, Switzerland. This article is an open access article distributed under the terms and conditions of the Creative Commons Attribution (CC BY) license (http://creativecommons.org/licenses/by/4.0/).
Share and Cite
MDPI and ACS Style
Kabil, M.; Priatmoko, S.; Magda, R.; Dávid, L.D. Blue Economy and Coastal Tourism: A Comprehensive Visualization Bibliometric Analysis. Sustainability 2021, 13, 3650. https://doi.org/10.3390/su13073650
AMA Style
Kabil M, Priatmoko S, Magda R, Dávid LD. Blue Economy and Coastal Tourism: A Comprehensive Visualization Bibliometric Analysis. Sustainability. 2021; 13(7):3650. https://doi.org/10.3390/su13073650
Chicago/Turabian StyleKabil, Moaaz, Setiawan Priatmoko, Róbert Magda, and Lóránt Dénes Dávid. 2021. "Blue Economy and Coastal Tourism: A Comprehensive Visualization Bibliometric Analysis" Sustainability 13, no. 7: 3650. https://doi.org/10.3390/su13073650
Note that from the first issue of 2016, this journal uses article numbers instead of page numbers. See further details here.