
Collapse of a Coastal Revetment Due to the Combined Effect of Anthropogenic and Natural Disturbances
by
 , ,
, ,
Jong Dae Do
1 ,
,
Jae-Youll Jin
1,
Weon Mu Jeong
2,
Byunggil Lee
1,
Jin Yong Choi
3 and
Yeon S. Chang
2,* 1
East Sea Environment Research Center, Korea Institute of Ocean Science and Technology, Uljin 36315, Korea
2
Maritime ICT R&D Center, Korea Institute of Ocean Science and Technology, Busan 49111, Korea
3
Marine Disaster Research Center, Korea Institute of Ocean Science and Technology, Busan 49111, Korea
*
Author to whom correspondence should be addressed.
Sustainability 2021, 13(7), 3712; https://doi.org/10.3390/su13073712
Submission received: 26 January 2021
/
Revised: 17 March 2021
/
Accepted: 23 March 2021
/
Published: 26 March 2021
(This article belongs to the Special Issue Sustainable Coastal Environment and Marine Science)
Abstract
:Coastal structures, such as revetments, are built to protect specific areas and facilities from the attack of extreme waves. However, unexpected environmental damage could be induced from these structures when inappropriately applied. Here, we present the results of measurements carried out using a video monitoring system, indicating the rapid collapse of a coastal revetment due to the attack of storm waves. The destruction occurred in sequence; that is, it was initiated by human activities, followed by a natural disaster. First, the beach in front of the revetment was eroded, even under moderate wave conditions, because sediments transported into this area were blocked by a rip-rap jetty. After the beach width was severely reduced due to the erosion, the revetment collapsed when storm waves attacked the area. The destruction seems accidental and inevitable because it was directly caused by the storm. However, it could have been avoided by predicting and preventing the erosion due to the jetty. This study provides insights into sequential processes that lead to the failure of coastal revetments, which could be applied for prevention of similar anthropogenic disasters.
1. Introduction
Coastal erosion affects the sustainability of coastal communities, structures, and ecosystems [1]. Sand particles can be easily transported by waves and currents, which lead to the erosion of sandy beaches [2]. In nature, the shape of a beach is not fixed, but it dynamically changes in response to environmental conditions that produce sediment transport in the cross- and/or longshore directions [3,4]. However, in general, the natural movement of sediment within a littoral cell does not cause serious erosion [5]. For example, a beach shoreline can significantly retreat when severe storm waves attack the coast [6]. However, the beach will naturally recover under mild wave conditions due to the onshore sediment transport following the storm [7,8]. Erosion of the beaches is often caused when the equilibrium in the littoral cell is broken by anthropogenic activities such as seaside road and hard stabilization during the construction of coastal infrastructures/structures. If a seaside road is constructed too close to the shore and disturbs the natural shoreline evolution, the equilibrium of the beach profile may be broken and the resulting erosion may cause serious damage to the beach and the road itself [9].
Appropriately designed hard stabilization can effectively protect areas from erosion. However, it often has side-effects, which worsen the beach status [10,11]. Seawalls and revetments are shore-parallel structures designed to protect specific properties/facilities from the attack of waves. However, they may cause damage in areas in which the energy of the reflected waves is concentrated. Groins and jetties are barriers that are built perpendicular to the shoreline. They effectively trap sand in areas with dominant longshore sediment transport. However, they may lead to an increased longshore variability that induces erosion on the downdraft side, and the resulting beach status may be deteriorated compared with that in the initial stage [11].
Regardless of the side-effects caused by hard stabilization, the structure itself is robust and rarely gets damaged, even under extreme conditions. However, the failure of coastal structures during severe wave conditions has been reported in previous studies. For example, the Great East Japan Earthquake generated a massive tsunami in the northwestern Pacific Ocean on 11 March 2011, which induced the failure of many coastal structures [12]. Seawalls, dikes, and breakwaters that were built along the eastern coast of Japan were overturned and partially or completely destroyed during the tsunami attack. The failure of the structures during this catastrophic event was mainly caused by wave overflows [13] and the scouring of the ground under the structure [13,14]. Ground shaking due to the earthquake and inundation due to the tsunami have also been suggested to be among the main causes of the destruction of coastal structures [15]. Failure of hard stabilization has also been observed under severe wave conditions, in addition to tsunamis [16,17], mainly caused by scouring due to wave erosion or by the overtopping due to storm surges.
In this study, we observed the failure of a revetment during consecutive attacks of storm waves. The revetment was constructed to stabilize a bank supporting a facility and, thus, was expected to be stable under severe wave conditions. However, the revetment collapsed due to the combined effect of human activity causing erosion and the natural storm attack. The sequential events that occurred over approximately 2 months were recorded by a video monitoring system (VMS), which was installed at the study site for the observation of long-term beach processes. The VMS technique has been usefully applied to monitor the shoreline response after stabilization [18] or to observe wave characteristics [19]. In addition to the VMS, the events were analyzed using wave data measured at the study site.
2. Materials and Methods
2.1. Hujeong Beach
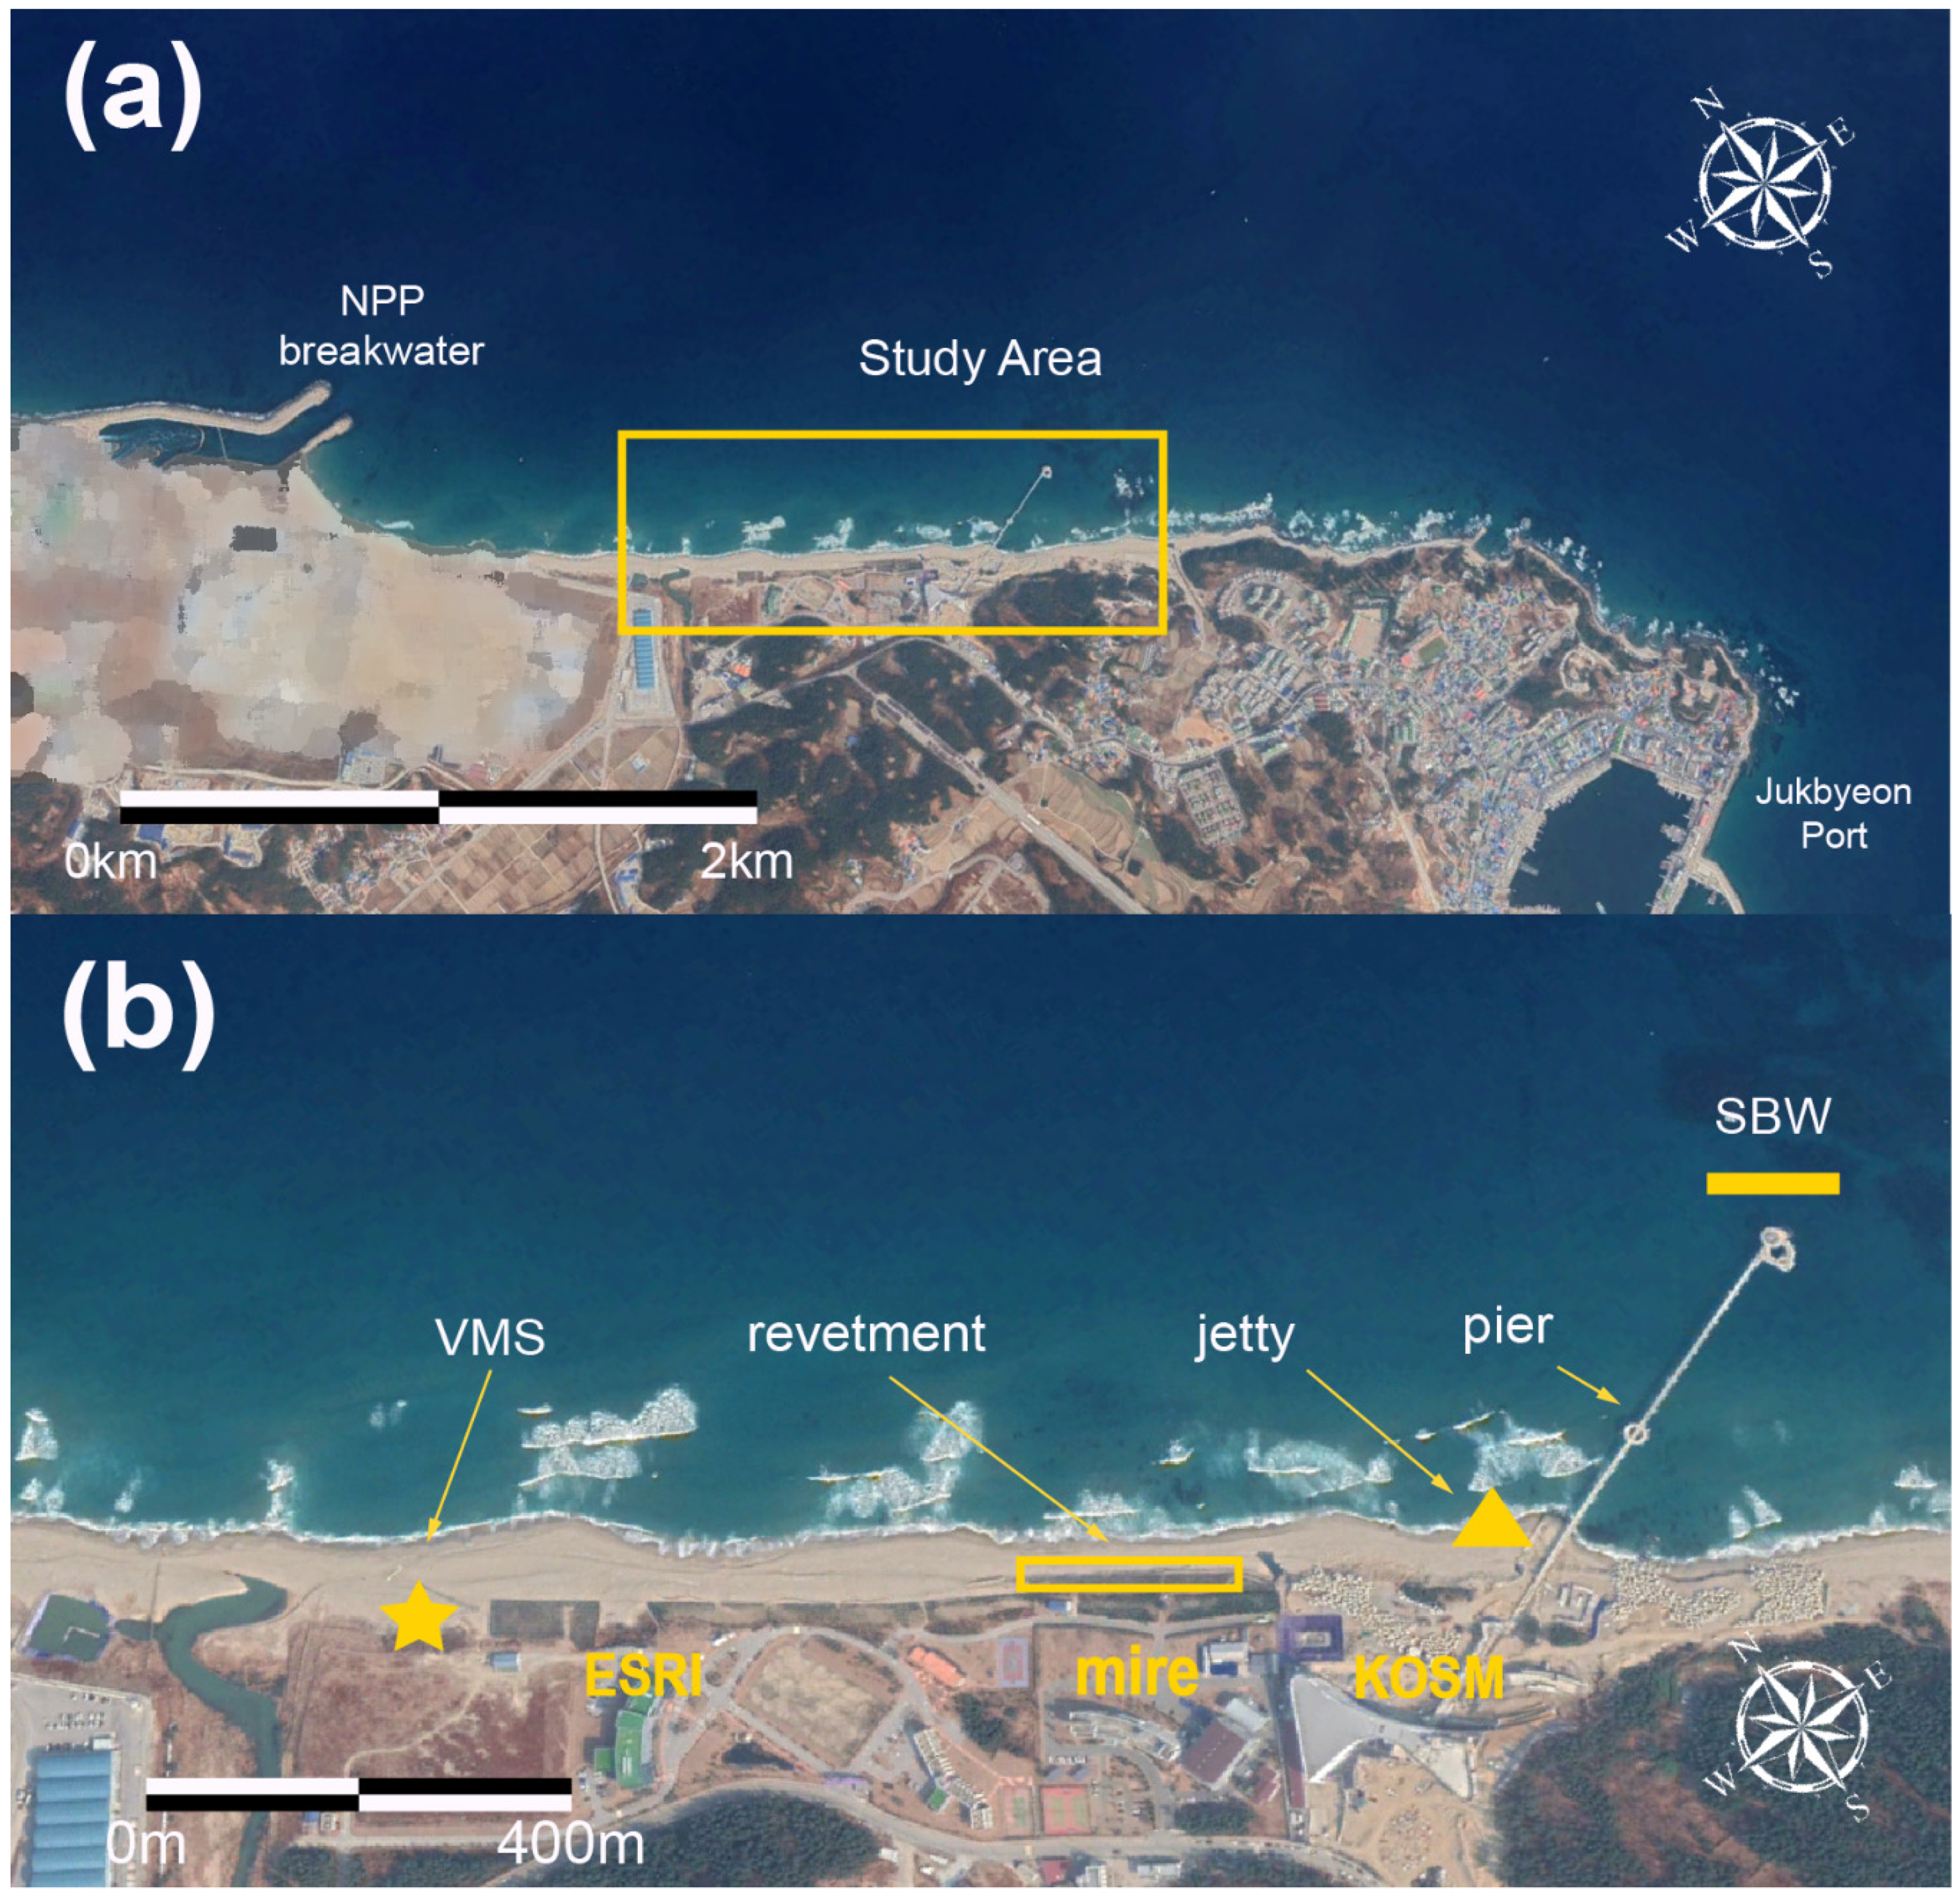
Hujeong Beach is a northeast-facing ~2.5 km long sandy beach in the middle of the east coast of Korea (Figure 1). The Hanul Nuclear Power Plant (NPP) and a cape connected to the Jukbyeon Port are located at the northern and southern ends of the beach, respectively. Before the Hanul NPP was constructed in the 1980s, the beach consisted of a littoral cell including the input of sediments from a river north of the beach, which was balanced by the sediment output through the cape. However, since the breakwaters of the NPP have been built, the balance has been broken and the beach has been eroded [20]. To understand the coastal processes in this area, various experiments have been performed by the East Sea Research Institute (ESRI) of the Korea Institute of Ocean Science and Technology (KIOST) using the VMS [20] and acoustic instruments [21]. The VMS was installed at the top of a 30 m high metal tower in the middle of Hujeong Beach (Figure 1).
Figure 1 also shows the locations of the Marine Industry Research Institute for East Sea Rim (MIRE) southeast of the ESRI and the revetment that was built on the bank in front of the MIRE to protect the facilities. The revetment was designed to withstand severe storm conditions. It was framed with concrete and fixed by boulders. The revetment was ~2 m high and ~200 m long. The average distance of the revetment to the shore was ~25 m. In 2019, the construction of the Korea National Ocean Science Museum (KOSM) was started in the southeast of the MIRE, with a planned opening in 2020. An underwater observatory will be installed ~250 m offshore from the coast and will be connected to KOSM by a pier (384 m). Because the observatory must be protected from waves, a submerged breakwater (SBW) was installed at a water of depth of 4–8 m using concrete tetrapods (Figure 1). For tetrapod transport and mooring of the carrier vessels, a temporary rip-rap jetty was built in March 2018. The jetty was removed after the SBW construction on 9 November 2019.
2.2. Video Monitoring and Wave Measurements
The VMS was installed at the top of a 30 m high metal tower in the middle of Hujeong Beach (Figure 2). It has been operated by KIOST since December 2016 to monitor beach processes. The VMS is equipped with eight cameras to cover the whole beach face along the coast of Hujeong Beach. The coverage of the VMS is ~2.4 km, and the angles of the cameras were set differently to exclude blind spots. The acquisition frequency of each camera is 1 s. However, only the first 10 min of data were used per hour, yielding 600 snapshots. To estimate the shoreline positions, the 600 snapshots were averaged to remove noise from wave breaking, providing hourly data for the beach. Because the images were not visible during the night, only 12–15 images were available per day. Once the snapshot data were averaged, the shoreline in the hourly data appeared as a narrow band due to the breaking in the swash zone. The shoreline positions were then extracted manually.
For wave measurement, a Nortek Acoustic Waves and Currents (AWAC) sensor has been moored at the location ~1.0 km away from the coast at ~19 m depth and has provided wave data since 1 July 2016. The measuring frequency of the AWAC sensor, which provides a directional spectrum to estimate the significant wave height (), peak wave period (), and direction () time series for the experimental site, is 2 Hz [20]. The wave data were estimated every 30 min continuously during the experimental periods, by constructing power density spectra on the basis of 2048 measuring points for each data burst that contained the first 17 min of data. In addition to the wave measurements, bathymetry data were measured using a single beam echosounder on 21 October 2018. The results from the bathymetry measurement are discussed in Section 4.
3. Results
3.1. Beach Erosion
Figure 3a–c show three images taken by the VMS on 15 March 2018 (before the jetty construction), 1 September 2018 (after the jetty construction), and 9 November 2019 (after the jetty removal. As shown in Figure 3b, the rip-rap jetty was constructed perpendicular to the shore, parallel to the observatory pier, thus preventing the movement of sand in the longshore direction. In addition, hundreds of tetrapods for the construction of the SBW were stacked on the beach facing the jetty. As shown in Figure 3a,c, the shoreline in front of the revetment insignificantly changed due to the jetty construction.
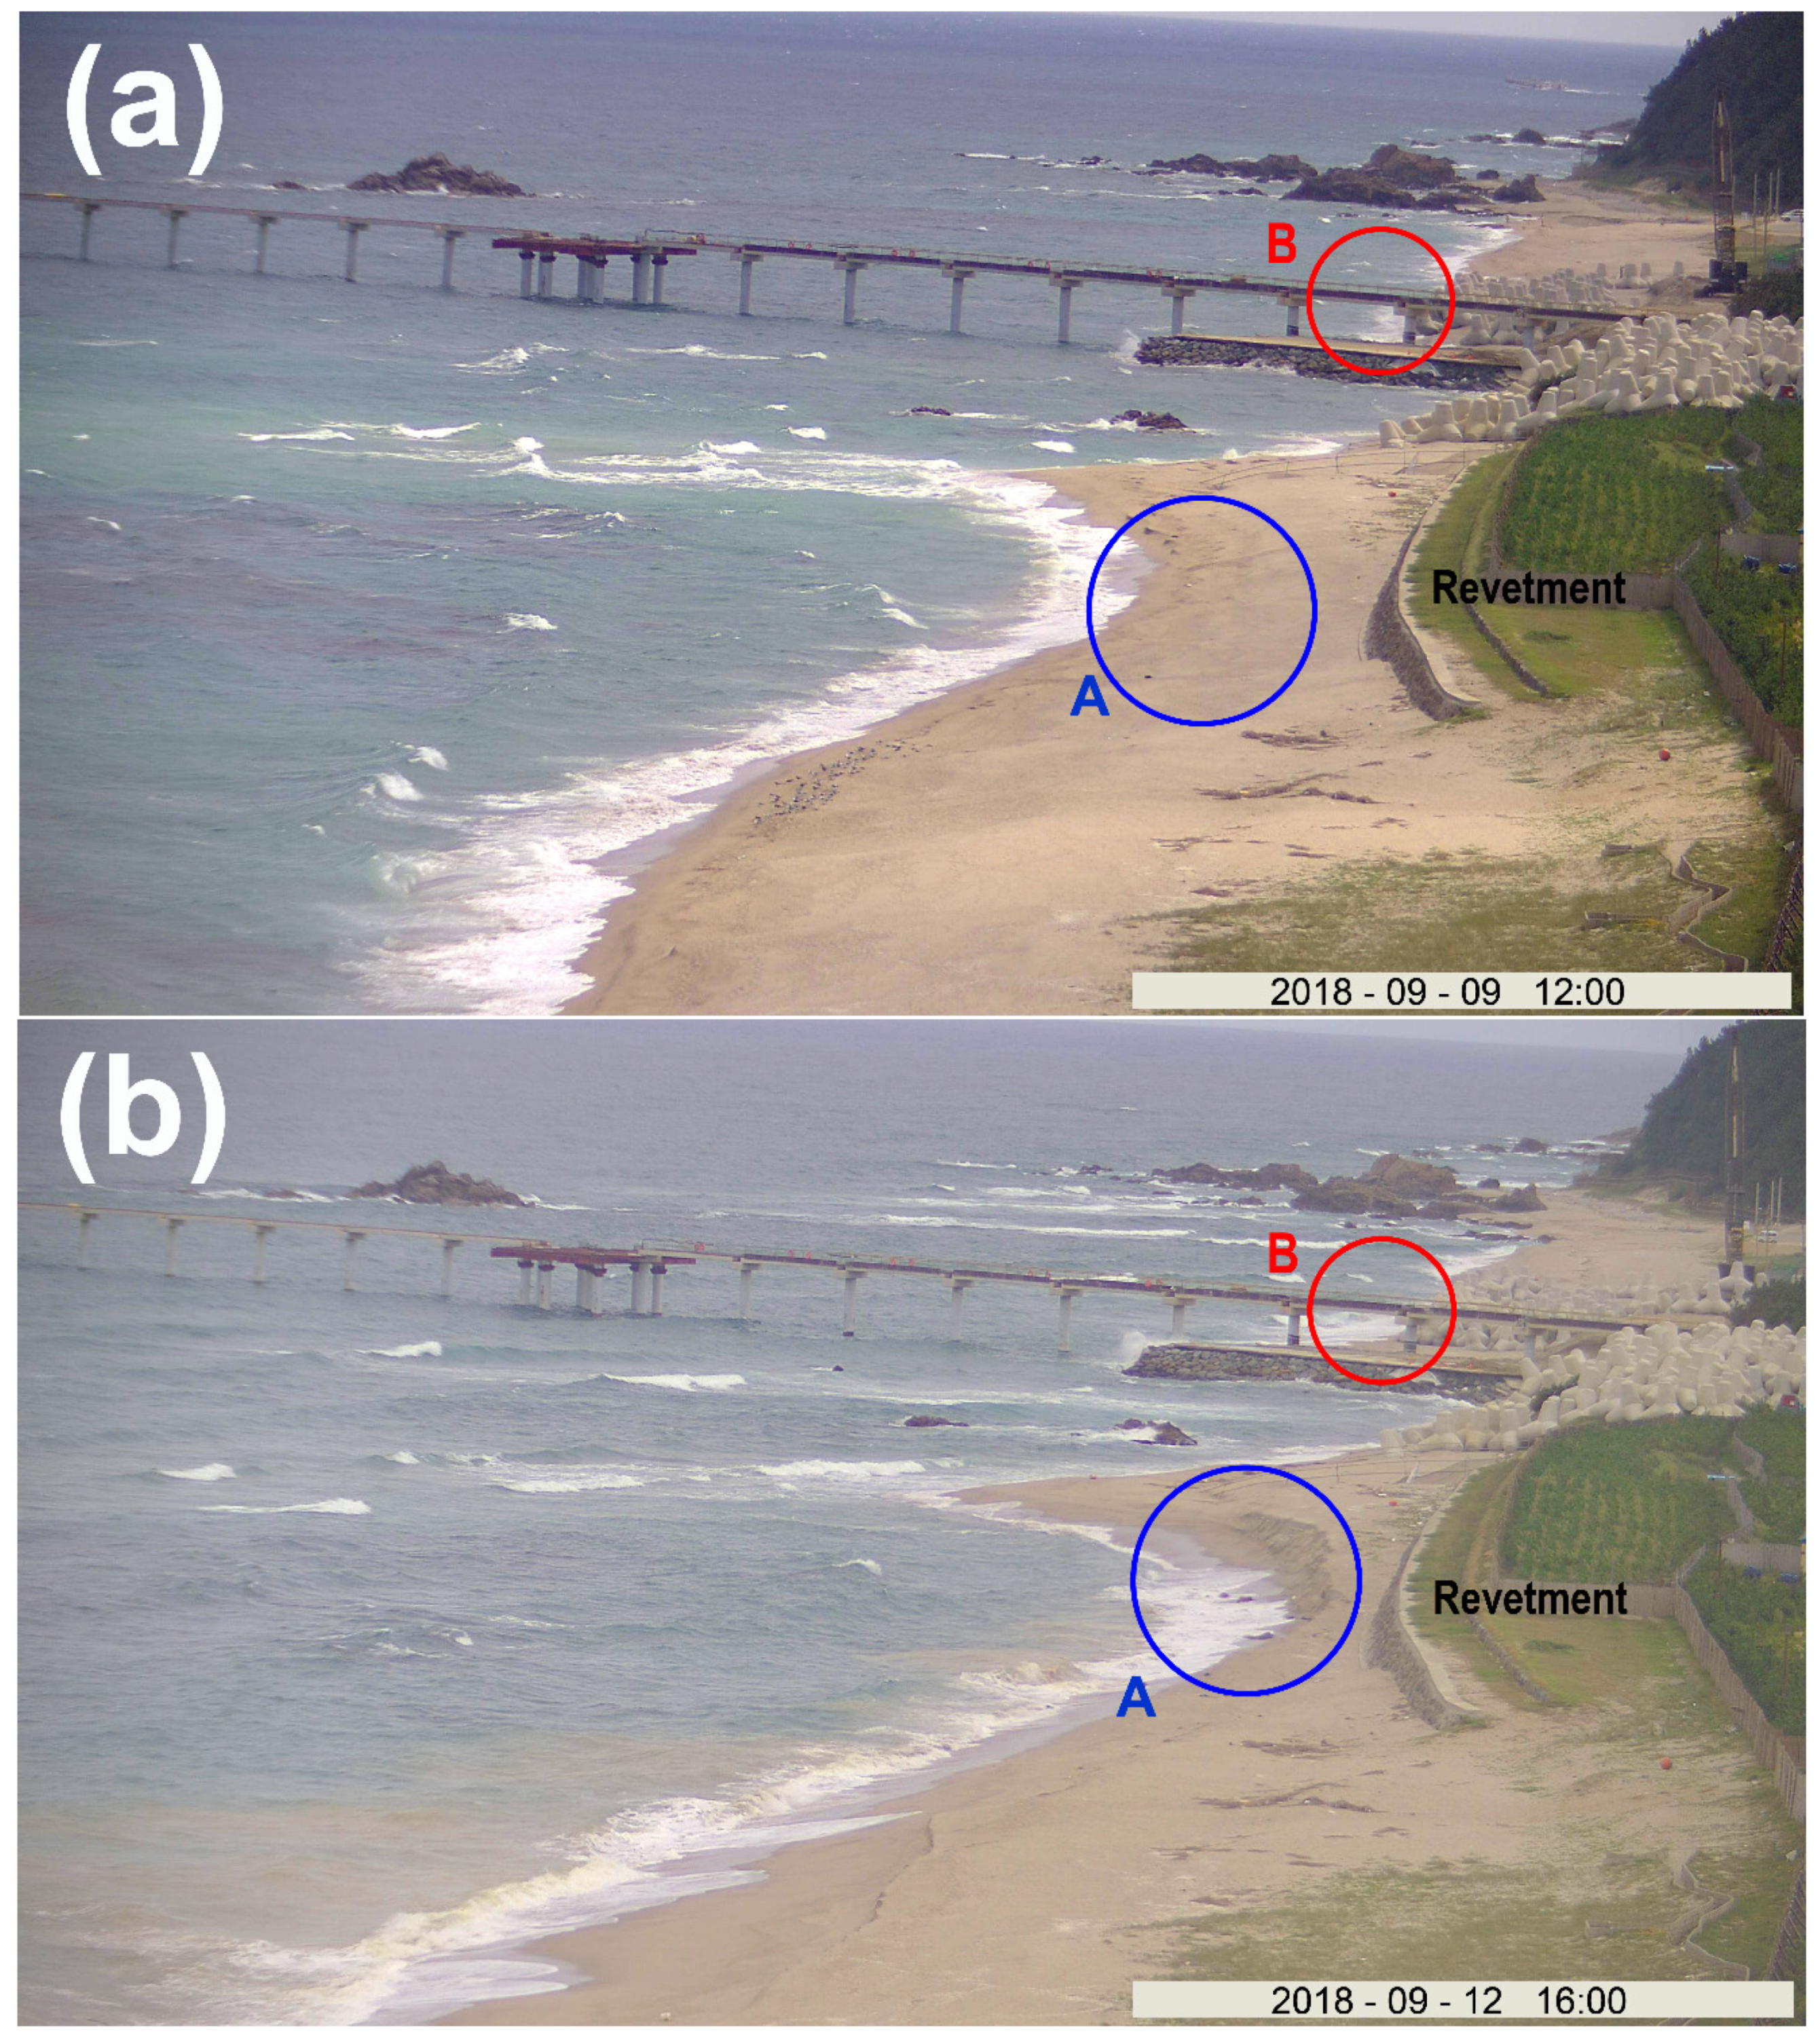
In early September, severe and rapid erosion occurred in front of the revetment, which led to its destruction. Figure 4a–c show that the area in front of the revetment (marked with the letter A) was rapidly and severely eroded over a period of 8 days from 9 to 17 September. Compared with Figure 3b (1 September), the shoreline in Figure 4a (9 September) significantly retreated toward the revetment.
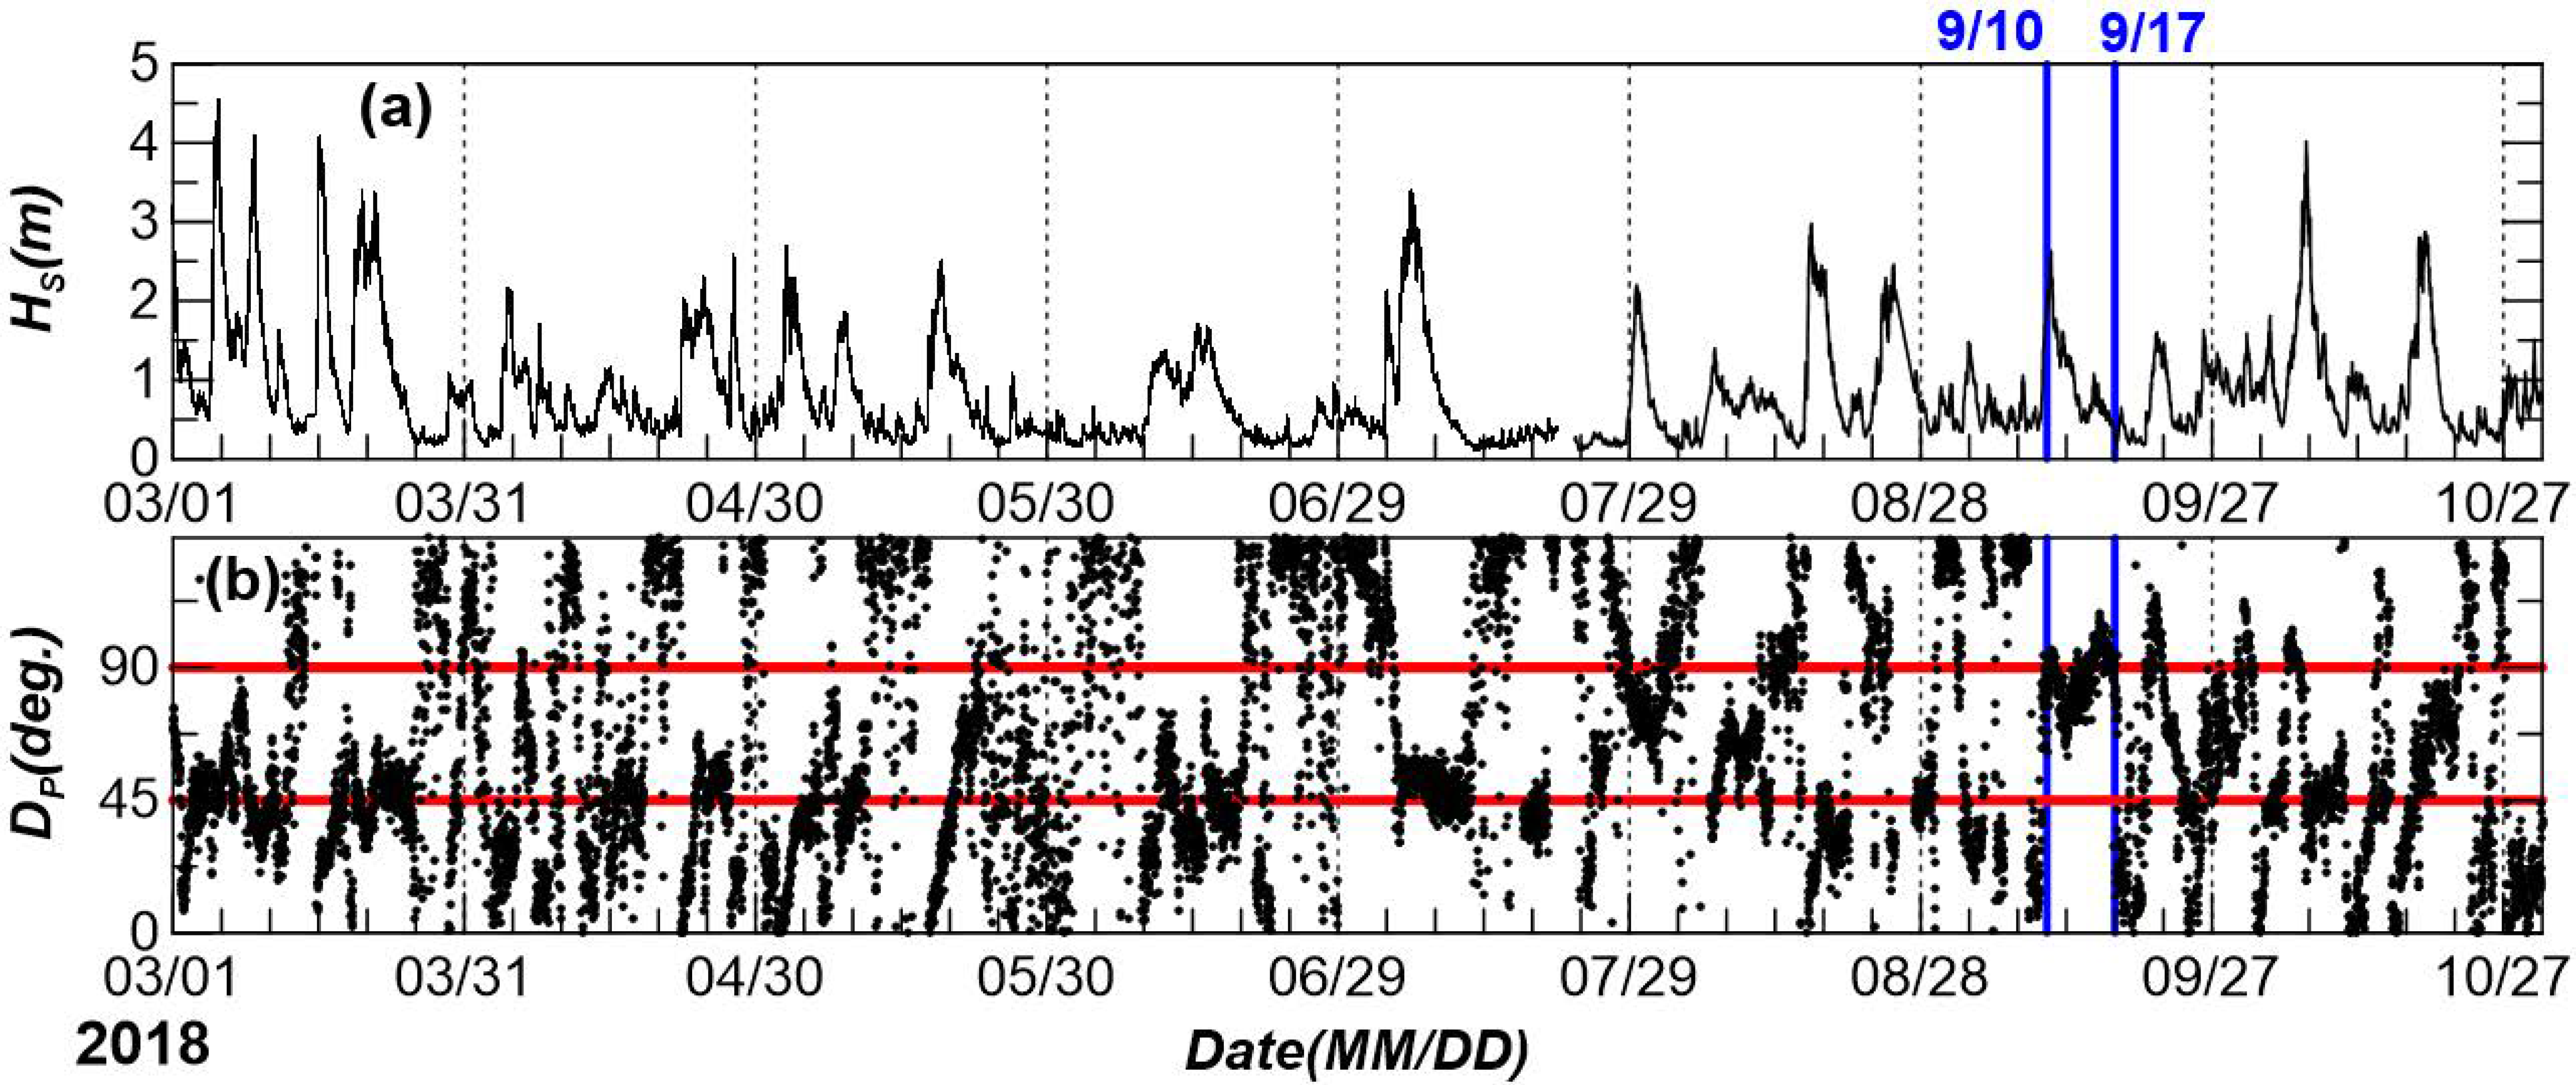
However, note that the rip-rat jetty was constructed in March 2018. This means that ~7 months passed between the jetty construction and the destruction of the revetment. In addition, the shoreline at location A was not severely eroded until 1 September 2018, as shown in Figure 3b. The significant wave height () and peak wave direction () time series measured near the study site from 1 March 2018, when the jetty was constructed, to 7 November 2019, when the jetty was removed, are plotted in Figure 5. In this period, storm waves with 2.0 m were frequently observed (Figure 5a). However, these high waves did not cause significant changes to the shoreline at location A regardless of the existence of the jetty. The wave propagation direction time series provides insights into the characteristic shoreline change in September (Figure 5b). The parameter is expressed in degrees with respect to the north (0°) in the clockwise direction such that the east and south are represented by 90° and 180°, respectively. Considering the orientation of the coastline, the waves approached in the shore-normal direction when 45°, as marked by the red line in Figure 5b. They approached at an angle of 45° from the shore-normal direction when 90°, as marked by the red line (“right” and “left” denote the right and left side of the beach with respect to the shore-normal direction, as marked in Figure 1). Figure 5b shows that the majority of the waves approached the shore in the normal direction before September 2018. Figure 6a shows a rose diagram including the histogram of and displaying the distribution of the wave heights and propagating directions from 1 March to 31 August 2018. It clearly shows that ~60% of the waves approached in the shore-normal direction, whereas ~25% of the waves approached in approximate shore-parallel direction. In addition, most of the high waves ( 1.0 m) approached in the shore-normal direction, whereas was less than 1 m when they approached in the shore-parallel direction, which indicates that the wave energy in the shore-normal direction was dominant before September.
However, note that severe shoreline erosion occurred at location A when changed to ~90° (Figure 4a–c). In Figure 7, and are plotted for a shorter time period from 1 September to 11 October 2018. The figure shows that increased to ~90° on September 9 (T1) and remained relatively constant for ~9 days until 17 September 2018 (T3), showing that the waves approached the shore at an angle of ~45° with respect to the shore-normal direction. Figure 5b shows that a long period in which remained ~90° for more than 3 days was not observed before September. Therefore, the severe erosion at location A was likely caused by the wave that approached the area at an angle of ~45° from the right side of the beach. It is known that the longshore sediment transport () is maximal at a wave propagation angle of 45° because [22]. Therefore, the erosion at location A when was ~90° in September might have been caused by strong longshore sediment motion. This hypothesis is supported by the wave height because significantly increased during the corresponding period, as shown in Figure 7a (the times at which the three VMS images in Figure 4a–c were taken are marked as T1, T2, and T3, respectively).
Additional evidence for the longshore sediment transport that caused the erosion at location A can be found at the other side of the jetty in area B (Figure 4a–c). Although the beach face was rapidly eroded at location A for a period of ~9 days, the shoreline significantly advanced toward the sea at location B. This indicates that the longshore sediment motion on the right side of the beach caused by the waves with ~90° was blocked by the jetty, causing the shoreline accretion at location B, whereas the sediment transport at location A continued and the erosion at this location intensified.
3.2. Revetment Collapse
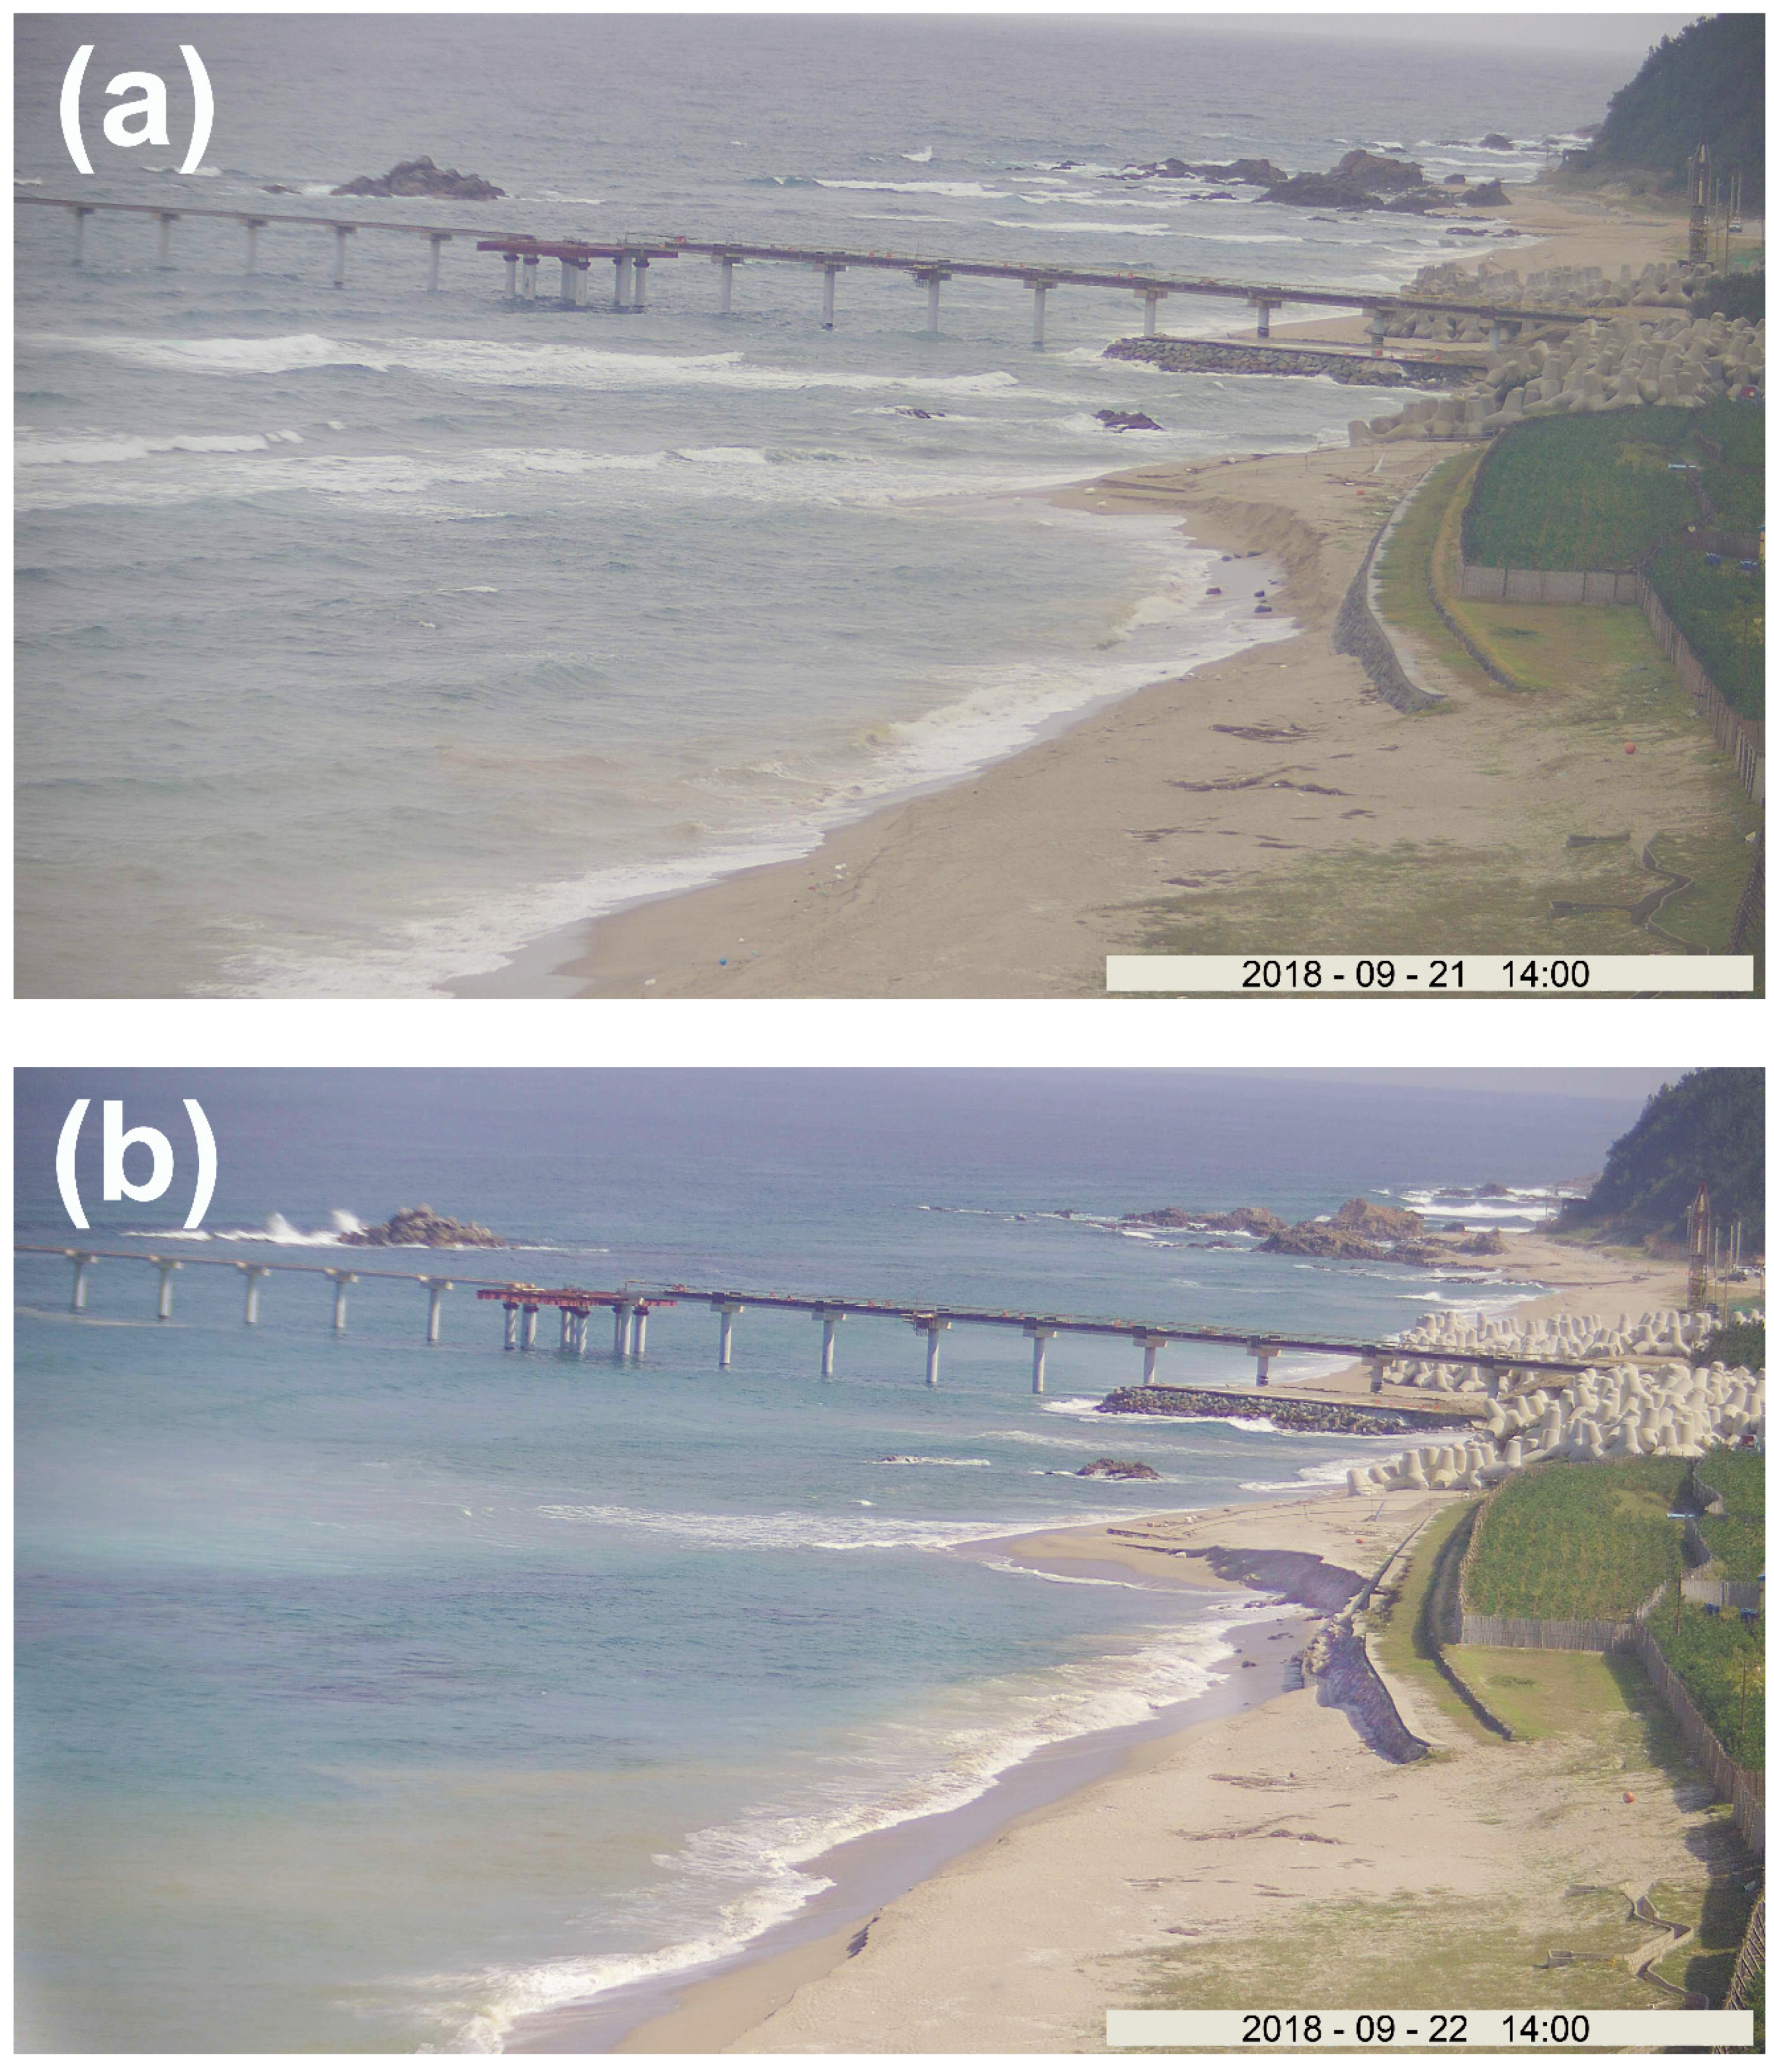
The first revetment damage occurred on 21 September 2018 (T4), and it completely collapsed on 6 October 2018 (T7). The wave propagation direction rapidly changed on 17 September when sharply decreased at T3 (Figure 7b). Subsequently, the wave conditions were calm with a value below 1 m until 21 September when increased to ~1.7 m and increased to ~90°. Figure 8a,b show the VMS images taken on 21–22 September 2018, marked as T4 and T5 in Figure 7a, respectively. The erosion at T4 was similar to that observed at T3. The shoreline at location A retreated close to the revetment and a scarp formed in front of it. Figure 8a shows that the wave conditions were rough at this time and breaking waves attacked the beach face in front of the revetment. Therefore, the beach was significantly eroded and no sediments remained in front of the revetment at T5, i.e., one day after T4 (Figure 8b). In addition, the revetment partially collapsed, as indicated by the observation of revetment debris at the beach face. Therefore, the revetment was likely damaged during the attack of the waves at T4. However, note that the wave energy at T4 was not maximal because was below 2 m. The revetment would not have been destroyed under these wave conditions unless severe erosion occurred in front of it.
After the revetment was first damaged on 22 September (T5), the high wave conditions continued until 26 September (Figure 7a) and the damage continued. Figure 8c shows the VMS image obtained on 4 October 2018 (T6). Compared with that taken at T5, the amount of debris at the beach face is increased, confirming the continuation of the revetment destruction after T5. During this period, the wave direction fluctuated instead of remaining constant at ~90°, and the width of the beach face at T6 slightly increased compared with that at T5. Typhoon Kong-rey that passed the Korean Peninsula on 6 October 2018 led to the most severe damage of the revetment. The time series in Figure 7a,b show that reached 4 m on 6 October 2018, and increased to ~90° on 5–6 October. Figure 8d shows the VMS image captured on 6 October (T7) when the area was hit by Typhoon Kong-rey. The image captures a moment during which a high breaking wave hit the revetment. The revetment completely collapsed after the typhoon passed. Figure 8e shows the VMS image taken on 9 October (T8), which clearly shows that the revetment was completely destroyed. Piles of debris were scattered at the beach face at the bottom of the revetment. Once the revetment was destroyed, the beach gradually recovered under milder wave conditions. The VMS image taken on 22 October 2018 shows that the shoreline significantly advanced toward the sea and the debris of the collapsed revetment remained behind the shoreline (Figure 8f).
In order to analyze the shoreline changes in a quantitative manner, the shoreline positions calculated by VMS on 1 September, 3 October, and 25 October are marked on a Google map in Figure 9 as these times denote the time before the erosion, when the erosion was in progress, and after the erosion, respectively. Note that the shoreline positions could be estimated only on the days with mild wave conditions. On days with harsh wave conditions, wide noise bands were observed in the swash zone due to wave breaking, which increased errors in detecting the shoreline positions manually. Therefore, the shoreline position data were not available when the erosion was most severe on T4 and T5. However, the positions in Figure 9 still prove that the shoreline was eroded in A from 1 September to October by a maximum retreat distance of ~10 m. After that, the shoreline in A was recovered until 25 October with a maximum advance distance of ~7 m. On the contrary, the shoreline positions in B did not change significantly, confirming the data from the images in Figure 8.
4. Discussion
Figure 10 compares the six photographs of the revetment taken on (a) 18 September, (b) 21 September (T4), (c) 22 September (T5), (d) 5 October, (e) 8 October, and (f) 21 November 2018. The revetment was built using boulders and cemented with concrete for the protection of the MIRE. It was expected to withstand attacks by storm waves. The effective wave height, (excess of the significant wave height for 12 h/year or 1.137% of the time considered), in this region is ~3.9 m (Do et al., 2019); thus, the revetment was at least expected to withstand the storm waves with height of . However, the results show that a part of the concrete top of the revetment was destroyed between T4 and T5 although the wave conditions were not extremely severe as was less than 2 m (Figure 7a). In addition, a larger part of the revetment was destructed on 5 October (between T6 and T7), when was less than 2 m, before the impact of Typhoon Kong-rey was maximal in the beach. In contrast, the revetment was not damaged earlier in March 2018 although extreme waves with higher than 4 m were observed (Figure 5a). Below, factors driving the revetment destruction at this specific time (T4–T8) are discussed on the basis of observations of simultaneously occurring processes.
The main cause of the beach erosion in front of the revetment was the construction of the rip-rap jetty. As shown in Figure 5b, the waves approached the shore mainly in the shore-normal direction. However, a considerable portion of the waves also approached in the shore-parallel direction. These obliquely incident waves likely caused the longshore sediment transport in this region and, thus, coastal structures constructed perpendicular to the shore, such as the jetty, could block the sediment motion along the shore, breaking the balance of the sediment budget. The jetty did not disturb the equilibrium under normal wave conditions until obliquely approaching waves caused abnormal erosion in front of the revetment. Figure 6b shows a rose diagram including the histogram of and for the period from T1 (9 September) to T4 (21 September). Compared with that shown in Figure 6a, a considerable number of waves were obliquely incident to the shore from the east. Therefore, longshore sediment transport was expected to occur to the northwest along the shore. However, the jetty blocked the sand movement, which resulted in the erosion in front of the revetment.
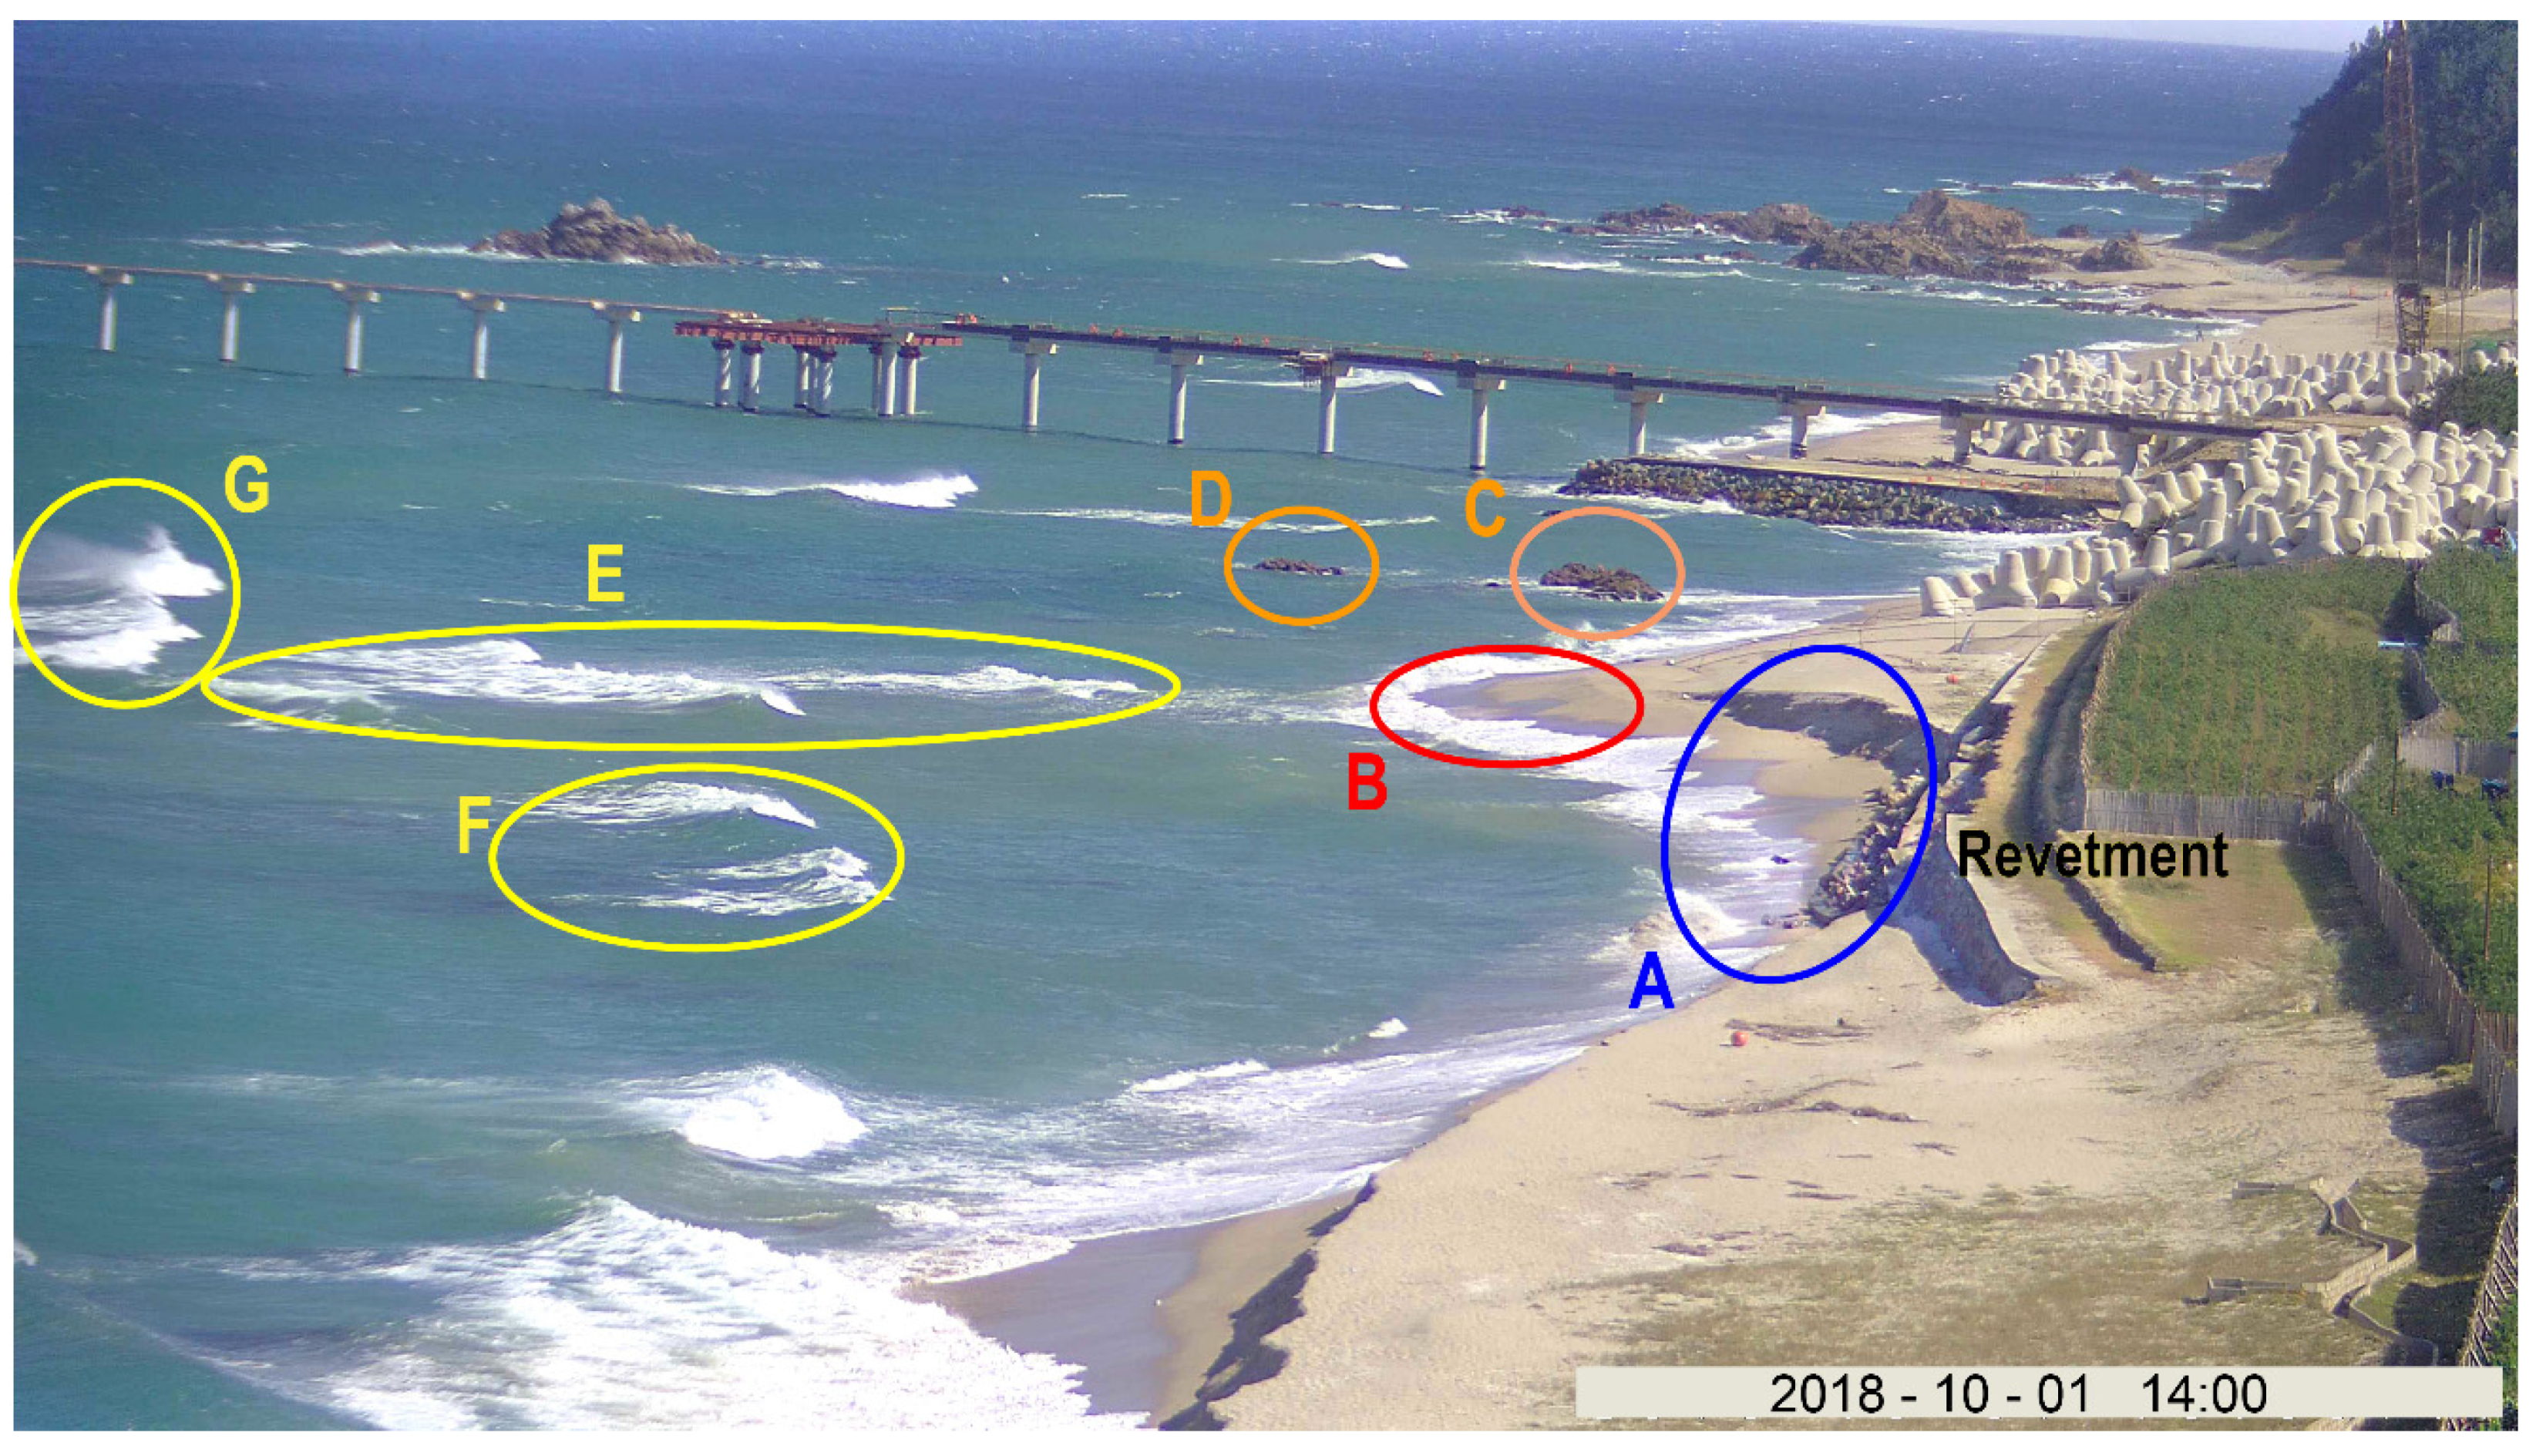
Another important factor that triggered the revetment destruction was the geography. Note that the shoreline only severely retreated in front of the revetment, whereas severe erosion was not observed in other areas. Figure 11 shows a photograph taken by the VMS on 1 October 2018. The shoreline was retreated at location A but not at location B. This unbalanced shoreline evolution is likely due to the protection of area B by the rocks in areas C and D. In addition, area E shows that the waves approaching area B started to break earlier than those approaching location A due to the shallower water depth. The same phenomenon can be observed in the two breaking areas F and G, indicating that the waves started to break at different locations in front of locations A and B, respectively.
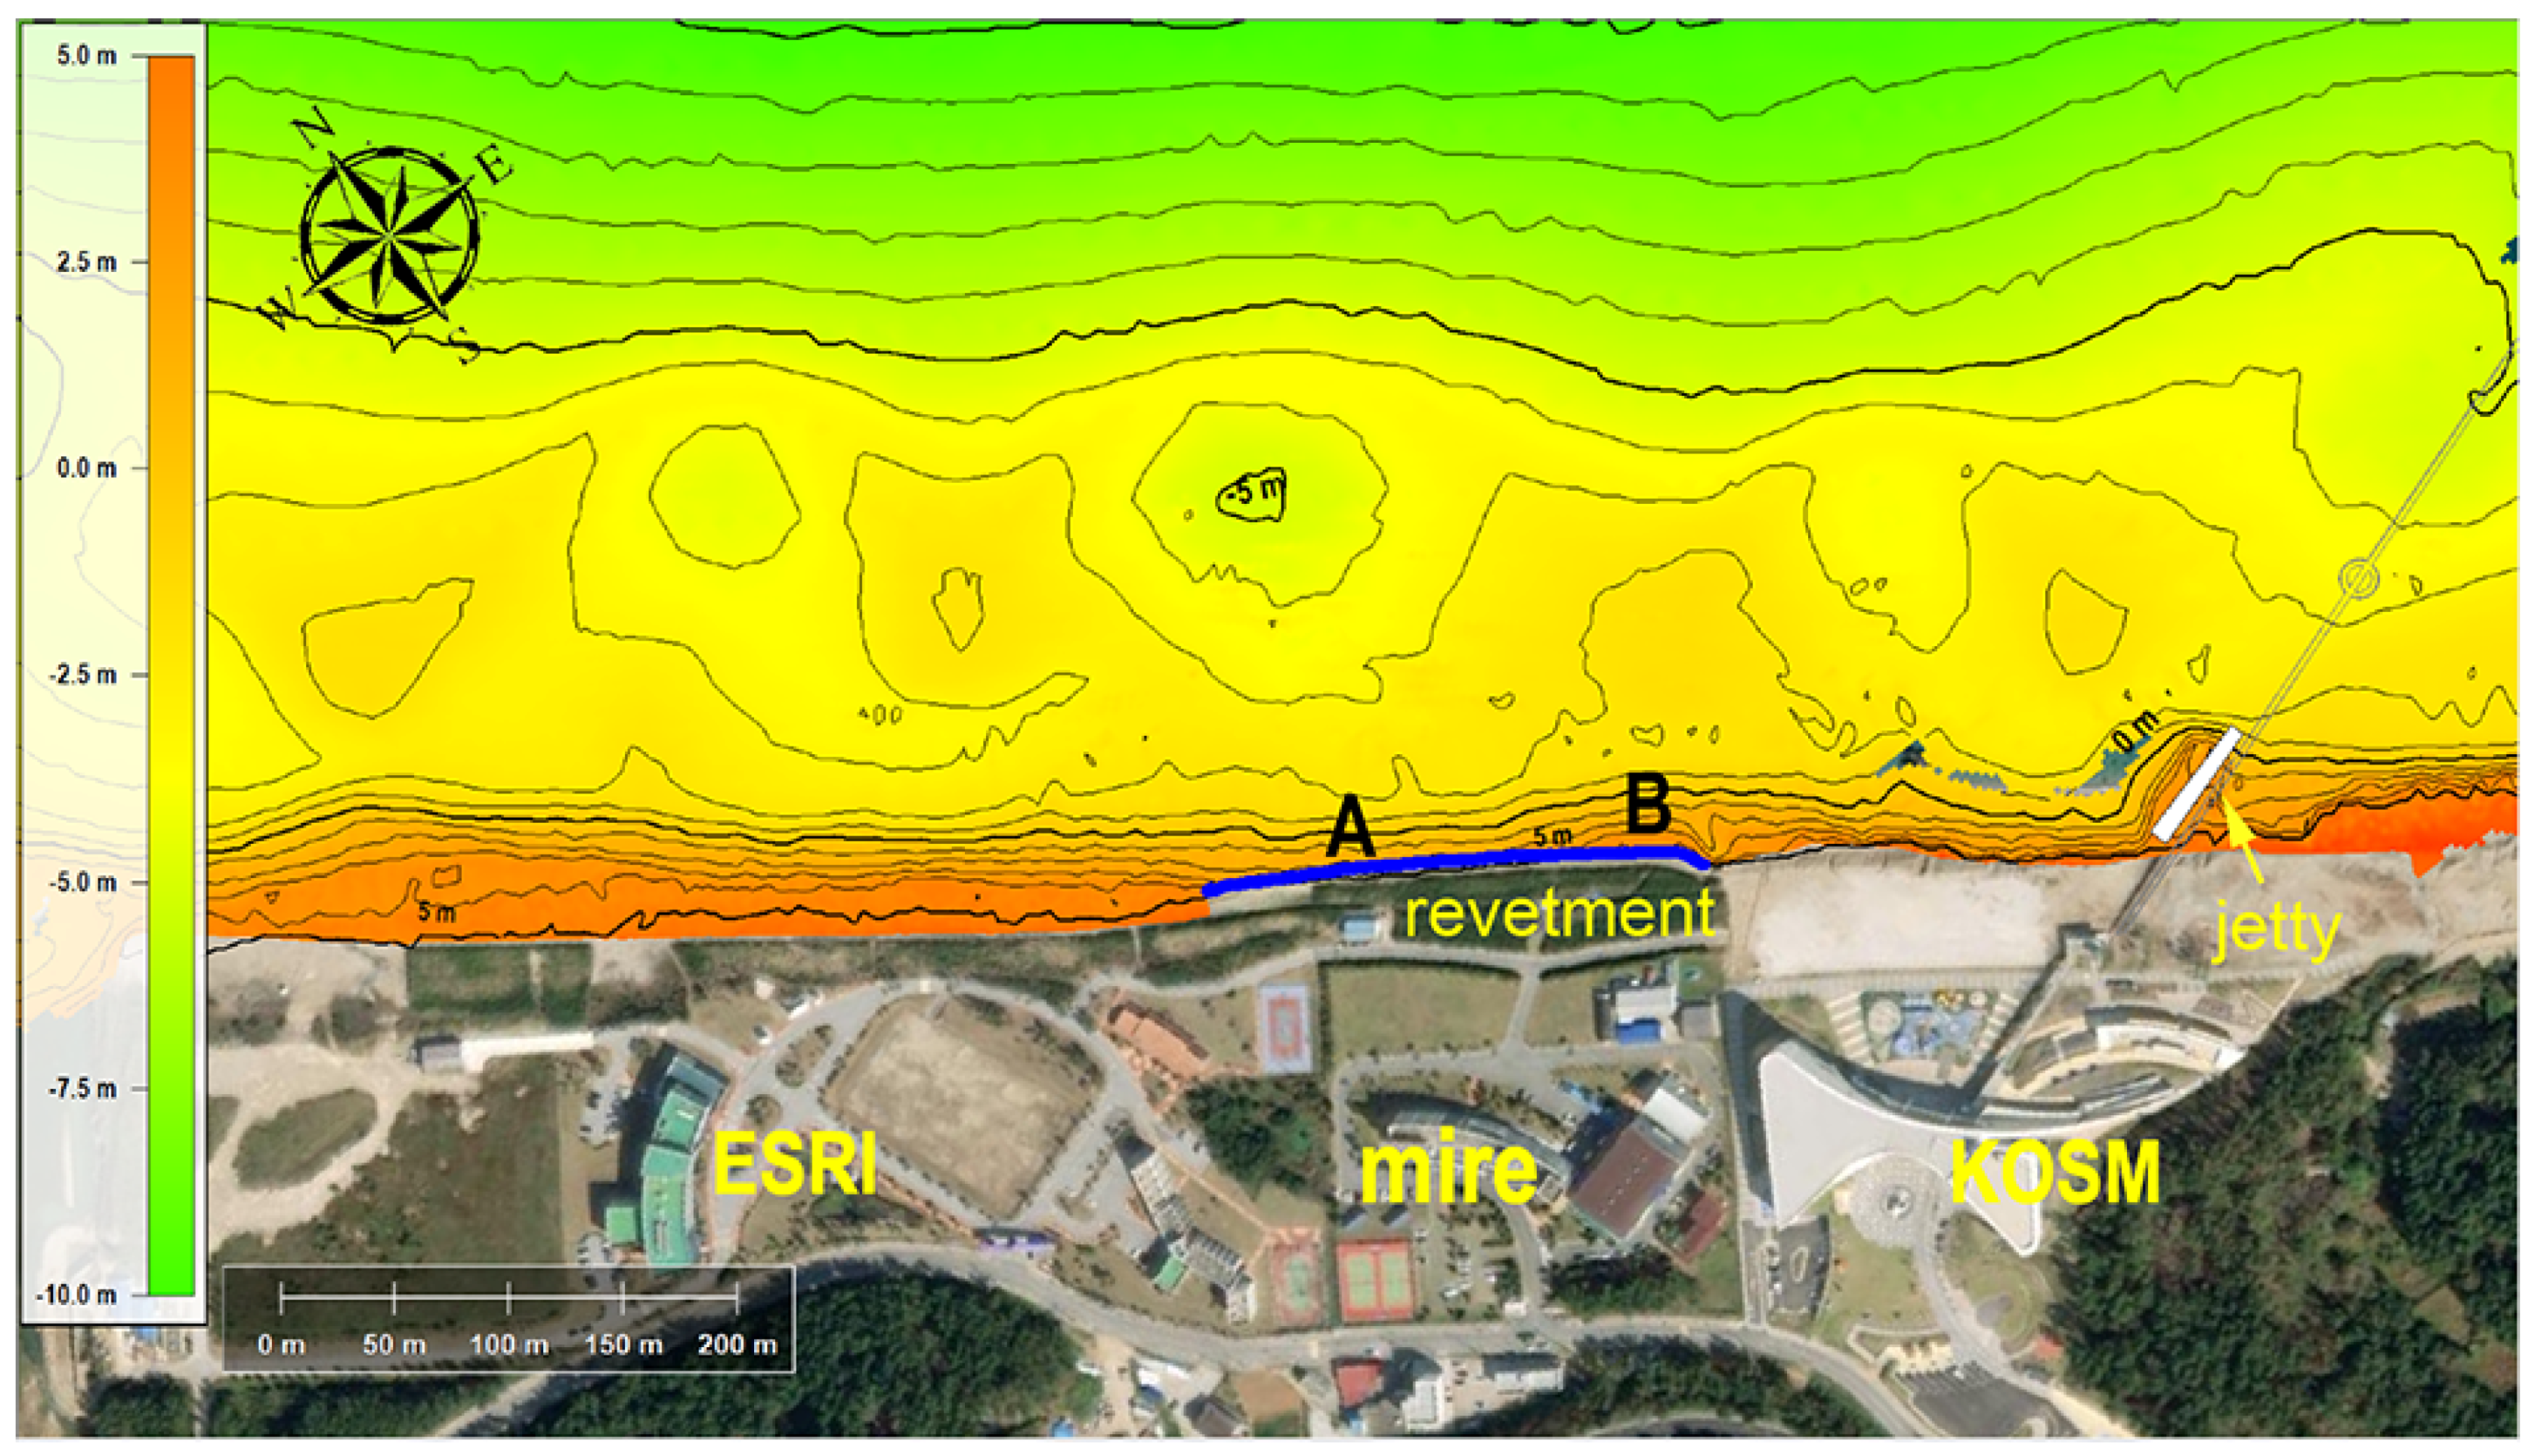
In order to examine the reason of difference in the wave breaking positions between E, F, and G, the water depth contours are plotted in Figure 12 using the bathymetry data measured by a single-beam echosounder on 21 October 2018. The figure shows that crescentic sandbars developed in the nearshore area of the experimental site where the water depth was shallower than 5 m. Because of these underwater structures that had a crescentic pattern, the water depth was deeper in front of location A where a sandbar bay developed, whereas it was shallower in front of B where a sandbar horn developed. This difference in water depth between the two locations confirms that the wave energy at location A was higher than that at location B, which additionally supports the concentration of erosion in the former area. It is noted, however, that the bathymetry in Figure 12 was measured at a time when the shoreline was considerably recovered after the erosion. Therefore, the data do not show the water depth information on the days when the severe erosion occurred in A exactly, and they only support the hypothesis extracted from the wave breaking pattern in Figure 11.
It is beyond a doubt that the most significant effect on the revetment was the repeated attacks of storm waves. Although the jetty construction and associated erosion provided an environment that could trigger the destruction of the revetment, they did not directly cause the destruction. The revetment collapsed when its durability decreased by repeated storm wave attacks within a short time frame. After the revetment was first damaged on 22 September 2018, two more storm waves attacked the beach on 30 September and 6 October. The succession of these storm events led to a continuous unstable status of the revetment; thus, the revetment was less durable and finally collapsed when Typhoon Kong-rey hit.
5. Conclusions
In this study, we presented observations of a sequential process indicating the collapse of a coastal revetment constructed along a beach bank to protect facilities at the Hujeong Beach located in the east coast of Korea. Images taken by a VMS installed at the top of a 30 m tower and wave measurements were used in this study. The main revetment collapse occurred during a storm wave event due to Typhoon Kong-rey on 6 October 2018, when the maximum wave height reached ~4 m. However, the revetment was constructed to withstand severe storm attacks in this region with effective wave heights of ~4 m. In fact, the revetment sustained previous attacks of storm waves under similar conditions.
The results of this study show that the revetment completely collapsed due to the main storm attack. However, it was repeatedly damaged by previous waves with heights below 2 m starting on 22 September 2018. Note that the beach face in front of the revetment was severely eroded and the shoreline retreated close to the revetment for ~10 days before the first damage on the revetment occurred, which indicates that the effect of the waves on the revetment was intensified by erosion. The erosion at this specific location was induced by the rip-rat jetty, which was constructed to moor ships. The jetty broke the equilibrium of the sediment budget in this area. Rapid and severe erosion occurred when obliquely approaching waves caused strong longshore sediment transport. However, the sand movement was blocked by the jetty such that the sediment could not be transported into the erosional area that geographically overlapped with the revetment. These simultaneous occurrences of anthropogenic and natural processes resulted in the collapse, which could have been prevented if the erosion would have been predicted regardless of inevitable natural causes of oblique waves and incidental storm attacks. The results of this study suggest that more careful investigations and considerations are required for the design of coastal interventions. In addition, innovative system must be developed for the precise and timely prediction of coastal wave conditions.
Author Contributions
Conceptualization, J.D.D., J.-Y.J., and Y.S.C.; methodology, J.D.D., B.L., and J.Y.C.; investigation, J.D.D., J.-Y.J., W.M.J., B.L., J.Y.C., and Y.S.C.; resources, J.D.D., J.-Y.J., and W.M.J.; data curation, J.D.D., B.L., and J.Y.C.; writing—original draft preparation, J.D.D. and Y.S.C.; writing—review and editing, J.-Y.J., W.M.J., and Y.S.C.; visualization, J.D.D. and B.L.; supervision, J.-Y.J., W.M.J., and Y.S.C.; project administration, J.D.D. and J.Y.C.; funding acquisition, J.Y.C., W.M.J., and Y.S.C. All authors read and agreed to the published version of the manuscript.
Funding
This study was supported by the Korea Institute of Ocean Science and Technology [grant number PE99931] and the Ministry of Oceans and Fisheries [grant number PM62220].
Institutional Review Board Statement
Not applicable.
Informed Consent Statement
Not applicable.
Data Availability Statement
The data presented in this study are openly available at https://doi.org/10.6084/m9.figshare.13466570.v1.
Conflicts of Interest
The authors declare no conflict of interest.
References
- Mentaschi, L.; Vousdoukas, M.I.; Pekel, J.F.; Voukouvalas, E.; Feyen, L. Global long-term observations of coastal erosion and accretion. Sci. Rep. 2018, 8, 12876. [Google Scholar] [CrossRef] [PubMed] [Green Version]
- Uda, T. Japan’s Beach Erosion: Reality and Future Measures; World Scientific: Singapore, 2010. [Google Scholar]
- DEAN, R.G. Cross-shore sediment transport processes. In Advances In Coastal And Ocean Engineering; World Scientific: Singapore, 1995; Volume 1, pp. 159–220. [Google Scholar]
- Davidson-Arnott, R.; Bauer, B.; Houser, C. Introduction to Coastal Processes and Geomorphology; Cambridge University Press: Cambridge, UK, 2019. [Google Scholar]
- Kamphuis, J.W. Introduction to Coastal Engineering and Management; World Scientific: Singapore, 2020; Volume 48. [Google Scholar]
- Forbes, D.L.; Parkes, G.S.; Manson, G.K.; Ketch, L.A. Storms and shoreline retreat in the southern Gulf of St. Lawrence. Mar. Geol. 2004, 210, 169–204. [Google Scholar] [CrossRef]
- Brooks, S.M.; Spencer, T.; Christie, E.K. Storm impacts and shoreline recovery: Mechanisms and controls in the southern North Sea. Geomorphology 2017, 283, 48–60. [Google Scholar] [CrossRef] [Green Version]
- Davidson, M.A.; Turner, I.L.; Splinter, K.D.; Harley, M.D. Annual prediction of shoreline erosion and subsequent recovery. Coast. Eng. 2017, 130, 14–25. [Google Scholar] [CrossRef] [Green Version]
- Kim, K.-H. Mitigation of Beach Erosion after Coastal Road Construction. J. Coast. Res. 2011, 27. [Google Scholar] [CrossRef]
- Bush, D.M.; Pilkey, O.H.; Neal, W.J. Coastal Topography, Human Impact on. In Marine Policy & Economics; Academic Press: Cambridge, MA, USA, 2010; pp. 581–590. [Google Scholar]
- Van Rijn, L.C. Coastal erosion and control. Ocean Coast. Manag. 2011, 54, 867–887. [Google Scholar] [CrossRef]
- Fraser, S.; Raby, A.; Pomonis, A.; Goda, K.; Chian, S.C.; Macabuag, J.; Offord, M.; Saito, K.; Sammonds, P. Tsunami damage to coastal defences and buildings in the March 11th 2011 M w 9.0 Great East Japan earthquake and tsunami. Bull. Earthq. Eng. 2012, 11, 205–239. [Google Scholar] [CrossRef]
- Jayaratne, R.; Premaratne, B.; Mikami, T.; Matsuba, S.; Shibayama, T.; Esteban, M.; Marriott, M. Destruction of Coastal Structures after the 2011 Great East Japan Earthquake and Tsunami. In Handbook of Coastal Disaster Mitigation for Engineers and Planners; Butterworth-Heinemann: Oxford, UK, 2015; pp. 349–362. [Google Scholar] [CrossRef]
- Kato, F.; Suwa, Y.; Watanabe, K.; Hatogai, S. Mechanisms of coastal dike failure induced by the Great East Japan Earthquake Tsunami. Coast. Eng. Proc. 2012, 1, 1–9. [Google Scholar] [CrossRef]
- Sugano, T.; Nozu, A.; Kohama, E.; Shimosako, K.-I.; Kikuchi, Y. Damage to coastal structures. Soils Found. 2014, 54, 883–901. [Google Scholar] [CrossRef] [Green Version]
- Morton, R.A. Effects of Hurricane Eloise on beach and coastal structures, Florida Panhandle. Geology 1976, 4, 277–280. [Google Scholar] [CrossRef]
- Robertson, I.N.; Riggs, H.R.; Yim, S.C.; Young, Y.L. Lessons from Hurricane Katrina storm surge on bridges and buildings. J. Waterw. Port Coast. Ocean Eng. 2007, 133, 463–483. [Google Scholar] [CrossRef]
- Jóia Santos, C.; Andriolo, U.; Ferreira, J.C. Shoreline Response to a Sandy Nourishment in a Wave-Dominated Coast Using Video Monitoring. Water 2020, 12, 1632. [Google Scholar] [CrossRef]
- Andriolo, U. Nearshore wave transformation domains from video imagery. J. Mar. Sci. Eng. 2019, 7, 186. [Google Scholar] [CrossRef] [Green Version]
- Chang, Y.S.; Jin, J.-Y.; Jeong, W.M.; Kim, C.H.; Do, J.-D. Video Monitoring of Shoreline Positions in Hujeong Beach, Korea. Appl. Sci. 2019, 9, 4984. [Google Scholar] [CrossRef] [Green Version]
- Do, J.D.; Jin, J.Y.; Jeong, W.M.; Chang, Y.S. Observation of Rapid Seabed Erosion Near Closure Depth During a Storm Period at Hujeong Beach, South Korea. Geophys. Res. Lett. 2019, 46, 9804–9812. [Google Scholar] [CrossRef]
- Van Rijn, L. Longshore Sand Transport. In Proceedings of the 28th ICCE, Cardiff, UK, 7–12 July 2002; pp. 2439–2451. [Google Scholar]
Figure 1.
(a) Google Earth image of Hujeong Beach taken on 13 February 2019; (b) magnified view of the yellow rectangle in (a), showing positions of the East Sea Research Institute (ESRI), Marine Industry Research Institute for East Sea Rim (MIRE), and Korea National Ocean Science Museum (KOSM). The yellow rectangle, triangle, star, and bar denote the locations of the revetment, jetty, video monitoring system (VMS), and the submerged breakwater, respectively. The jetty is not visible in the figure because the image was taken after the jetty was removed.
Figure 2.
Photograph of the VMS with eight cameras, installed on top of a 30 m high metal tower in Hujeong Beach, Korea.
Figure 2.
Photograph of the VMS with eight cameras, installed on top of a 30 m high metal tower in Hujeong Beach, Korea.
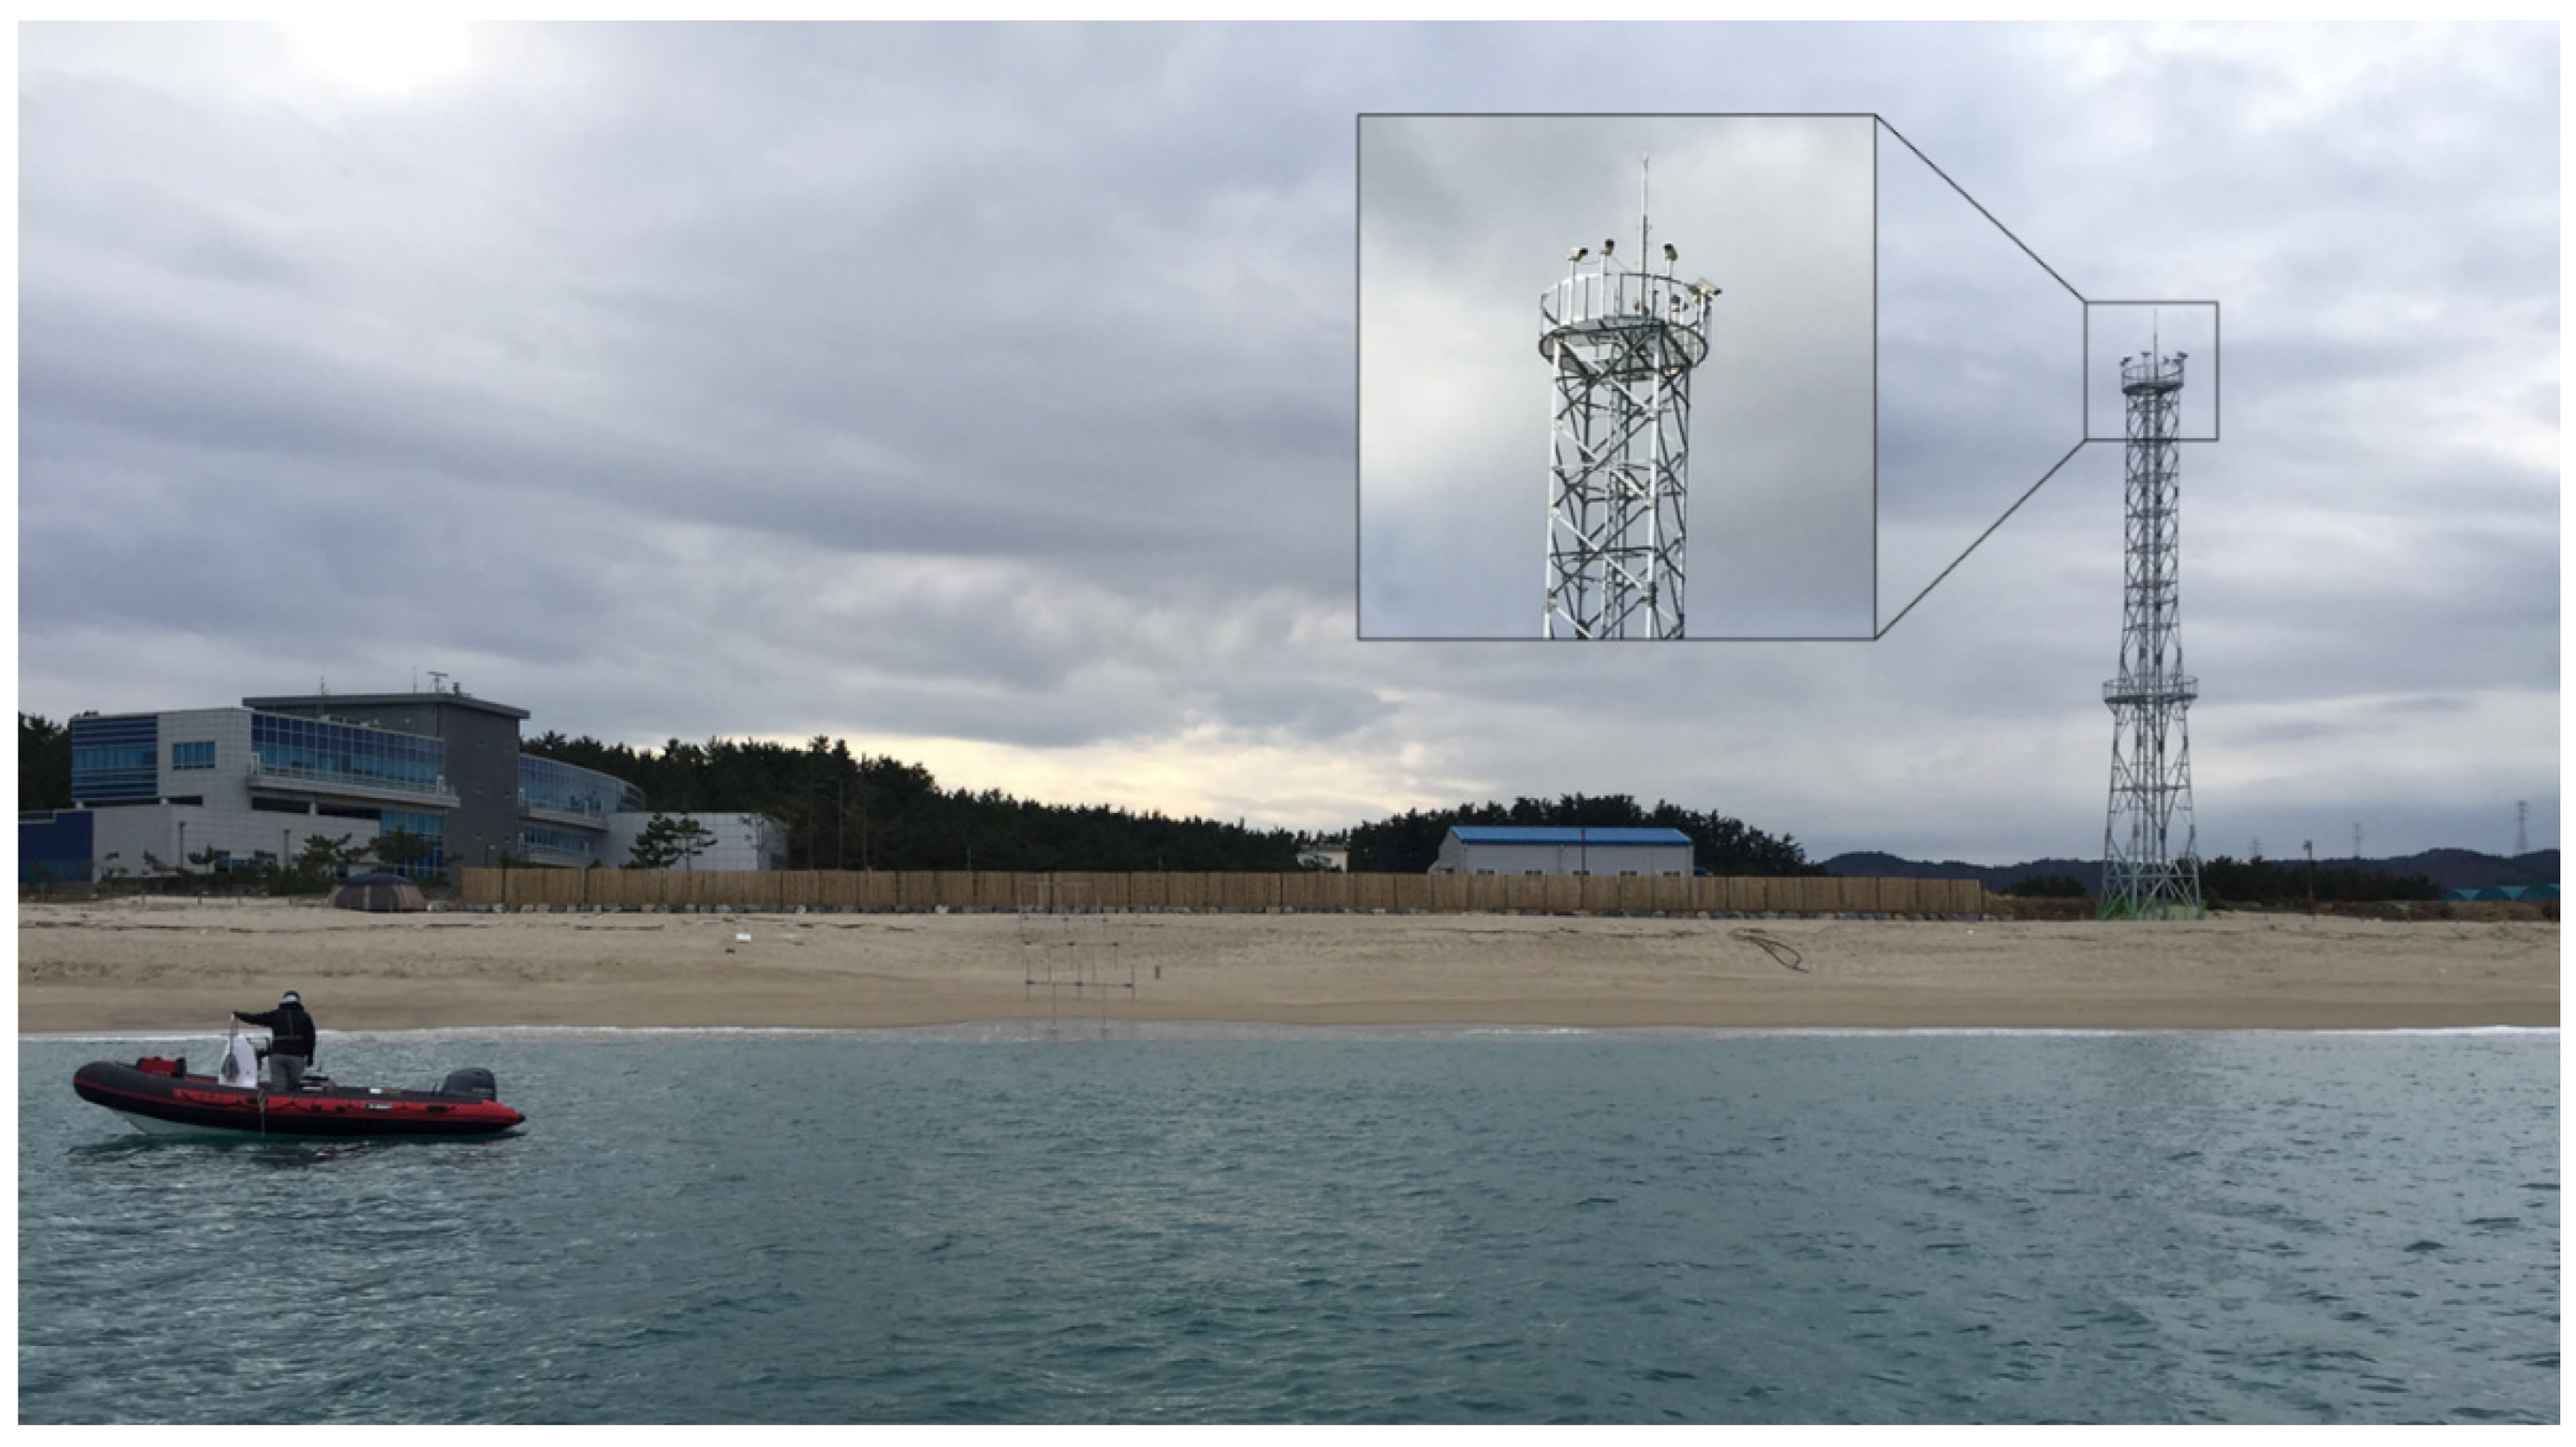
Figure 3.
(a) VMS image of the revetment location on 15 March 2018, before the jetty construction. The black circles denote the locations of the revetment and jetty construction. The blue circle, A, marks the area where erosion occurred in front of the revetment; (b) VMS image of the revetment location on 1 September 2018, after the jetty construction; (c) VMS image of the revetment location on 9 November 2019, after the jetty was removed.
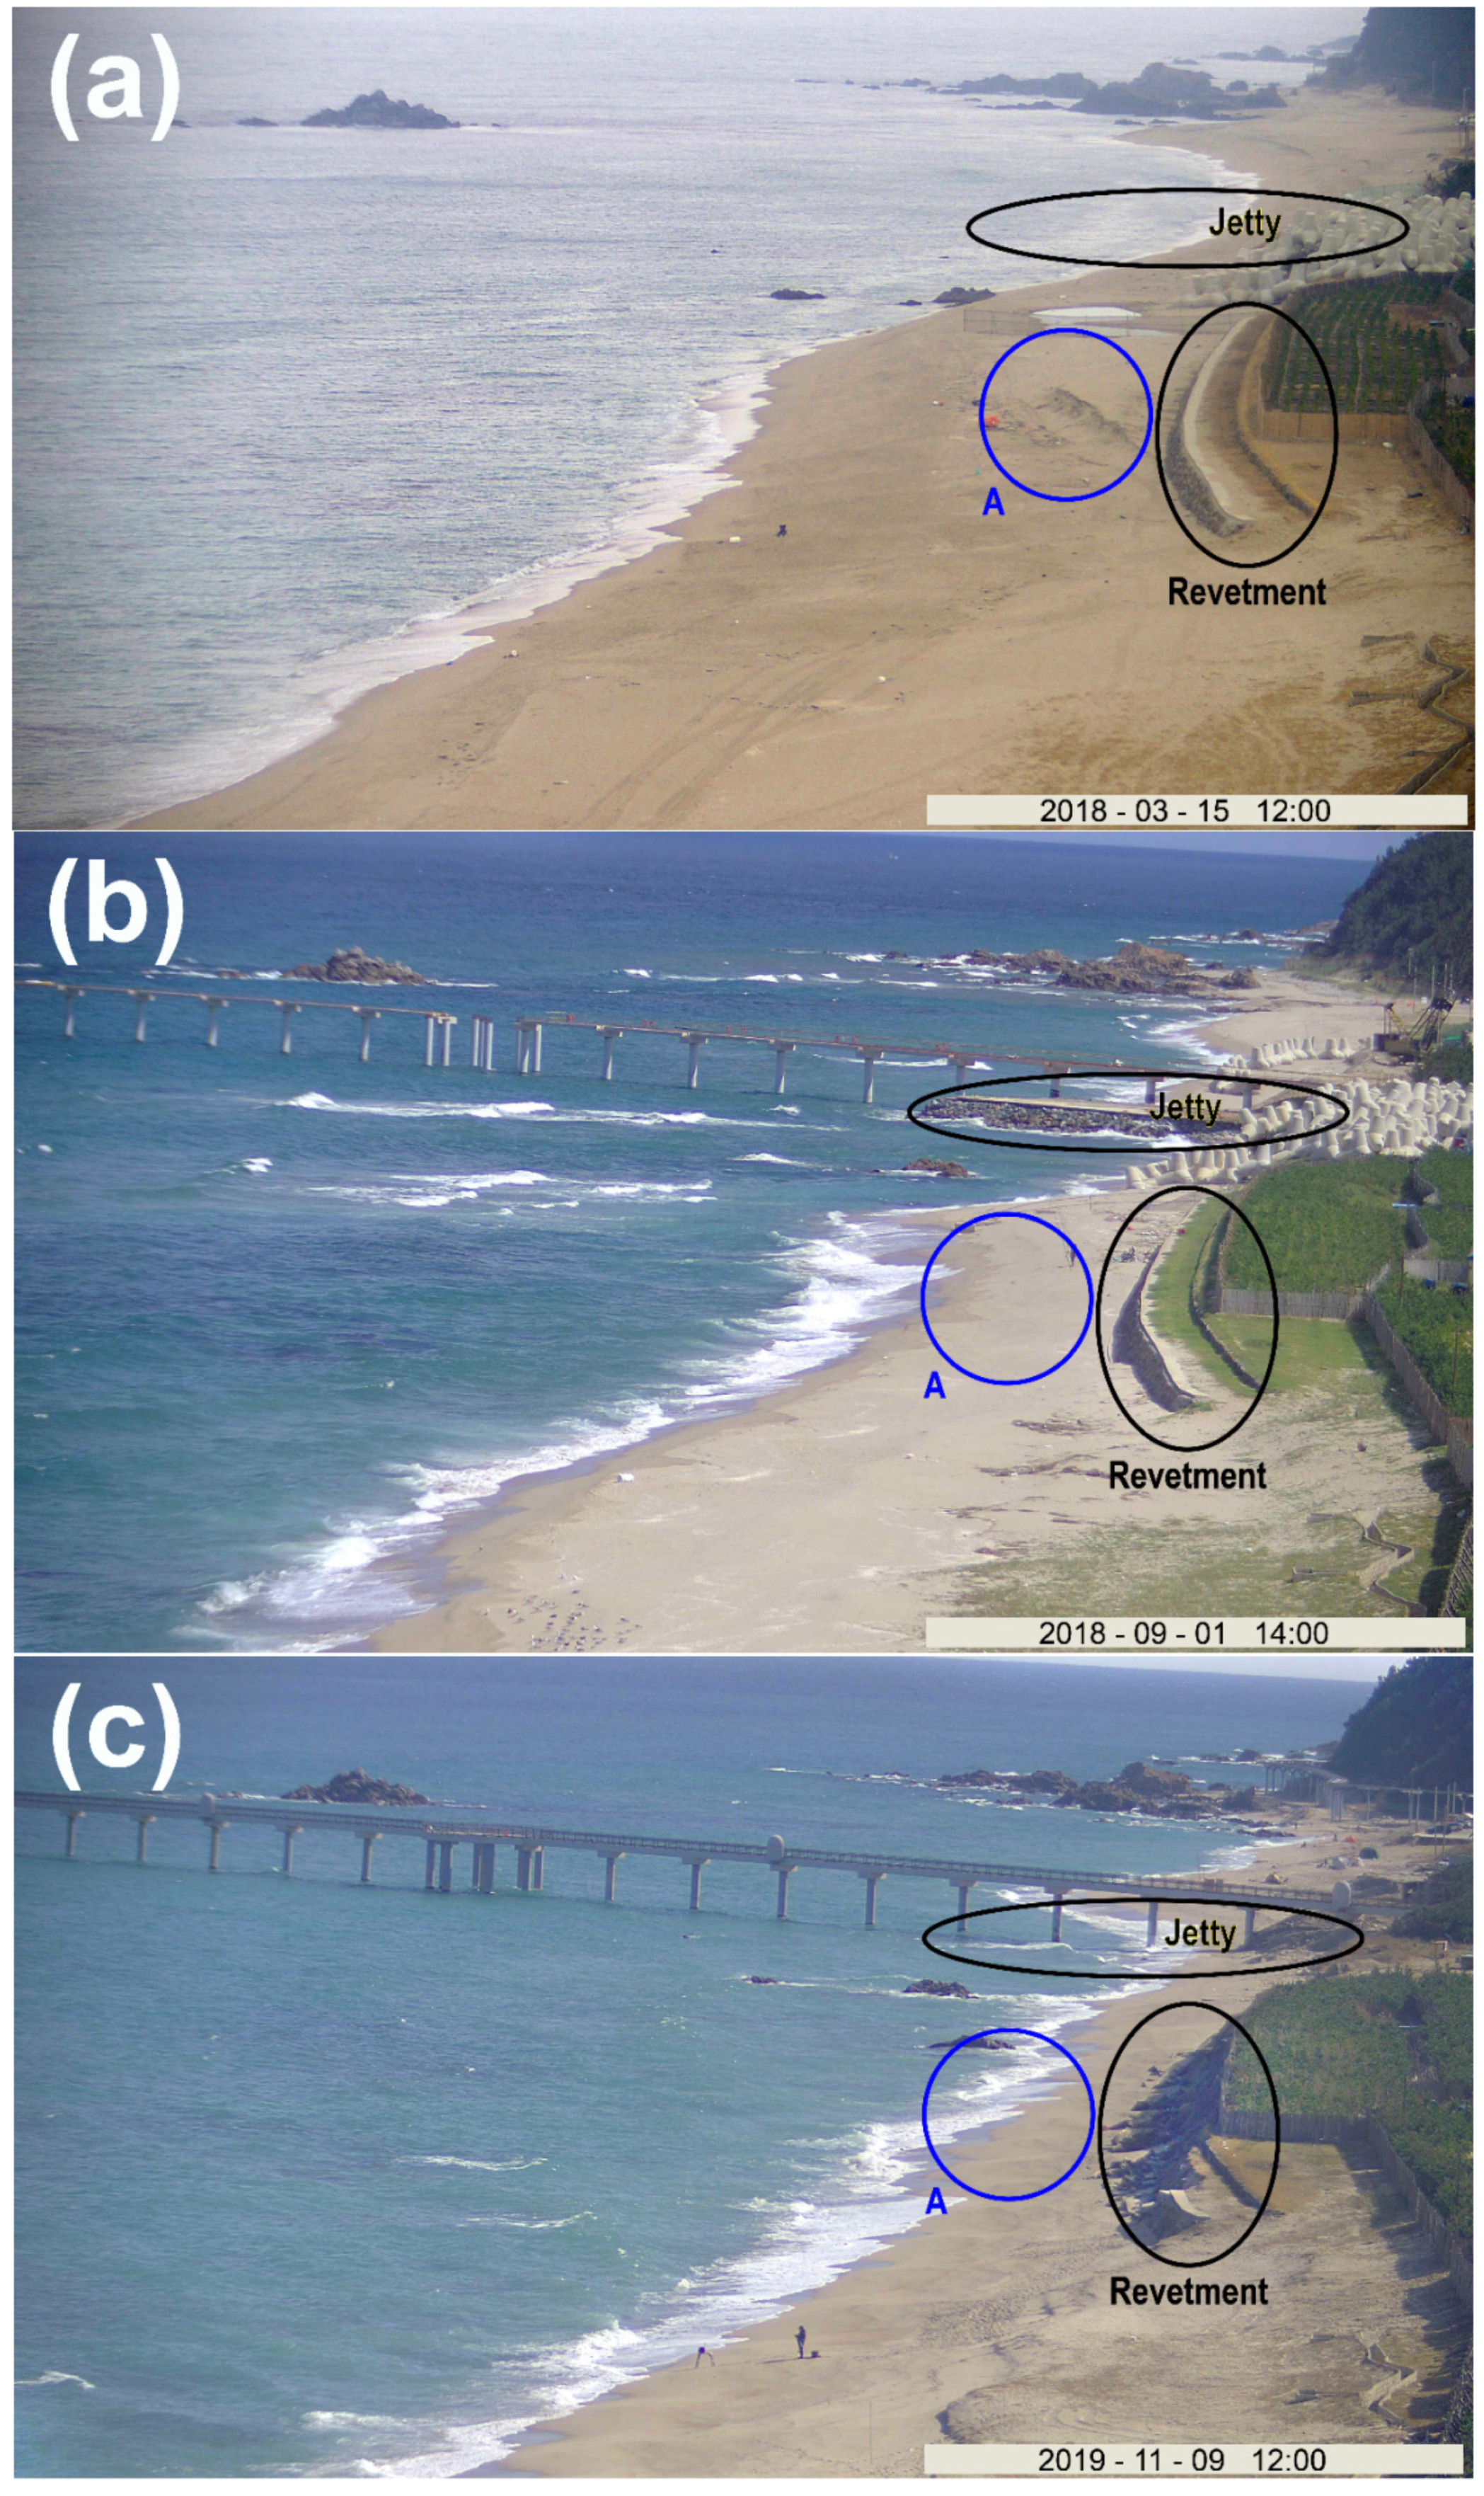
Figure 4.
(a) VMS image of the revetment on 9 September 2018 (T1). The blue circle, A, denotes the area in which erosion occurred in front of the revetment. The red circle, B, denotes the area south of the jetty in which accretion occurred. Note that the time of Figure 4a is earlier than that of Figure 3c; (b) VMS image of the revetment on 12 September 2018 (T2). Compared with T1, the erosion progressed significantly at location A, while accretion started at location B; (c) VMS image of the revetment on 17 September 2018 (T3). Note the severe erosion of the shoreline at location A and significant accretion at location B.

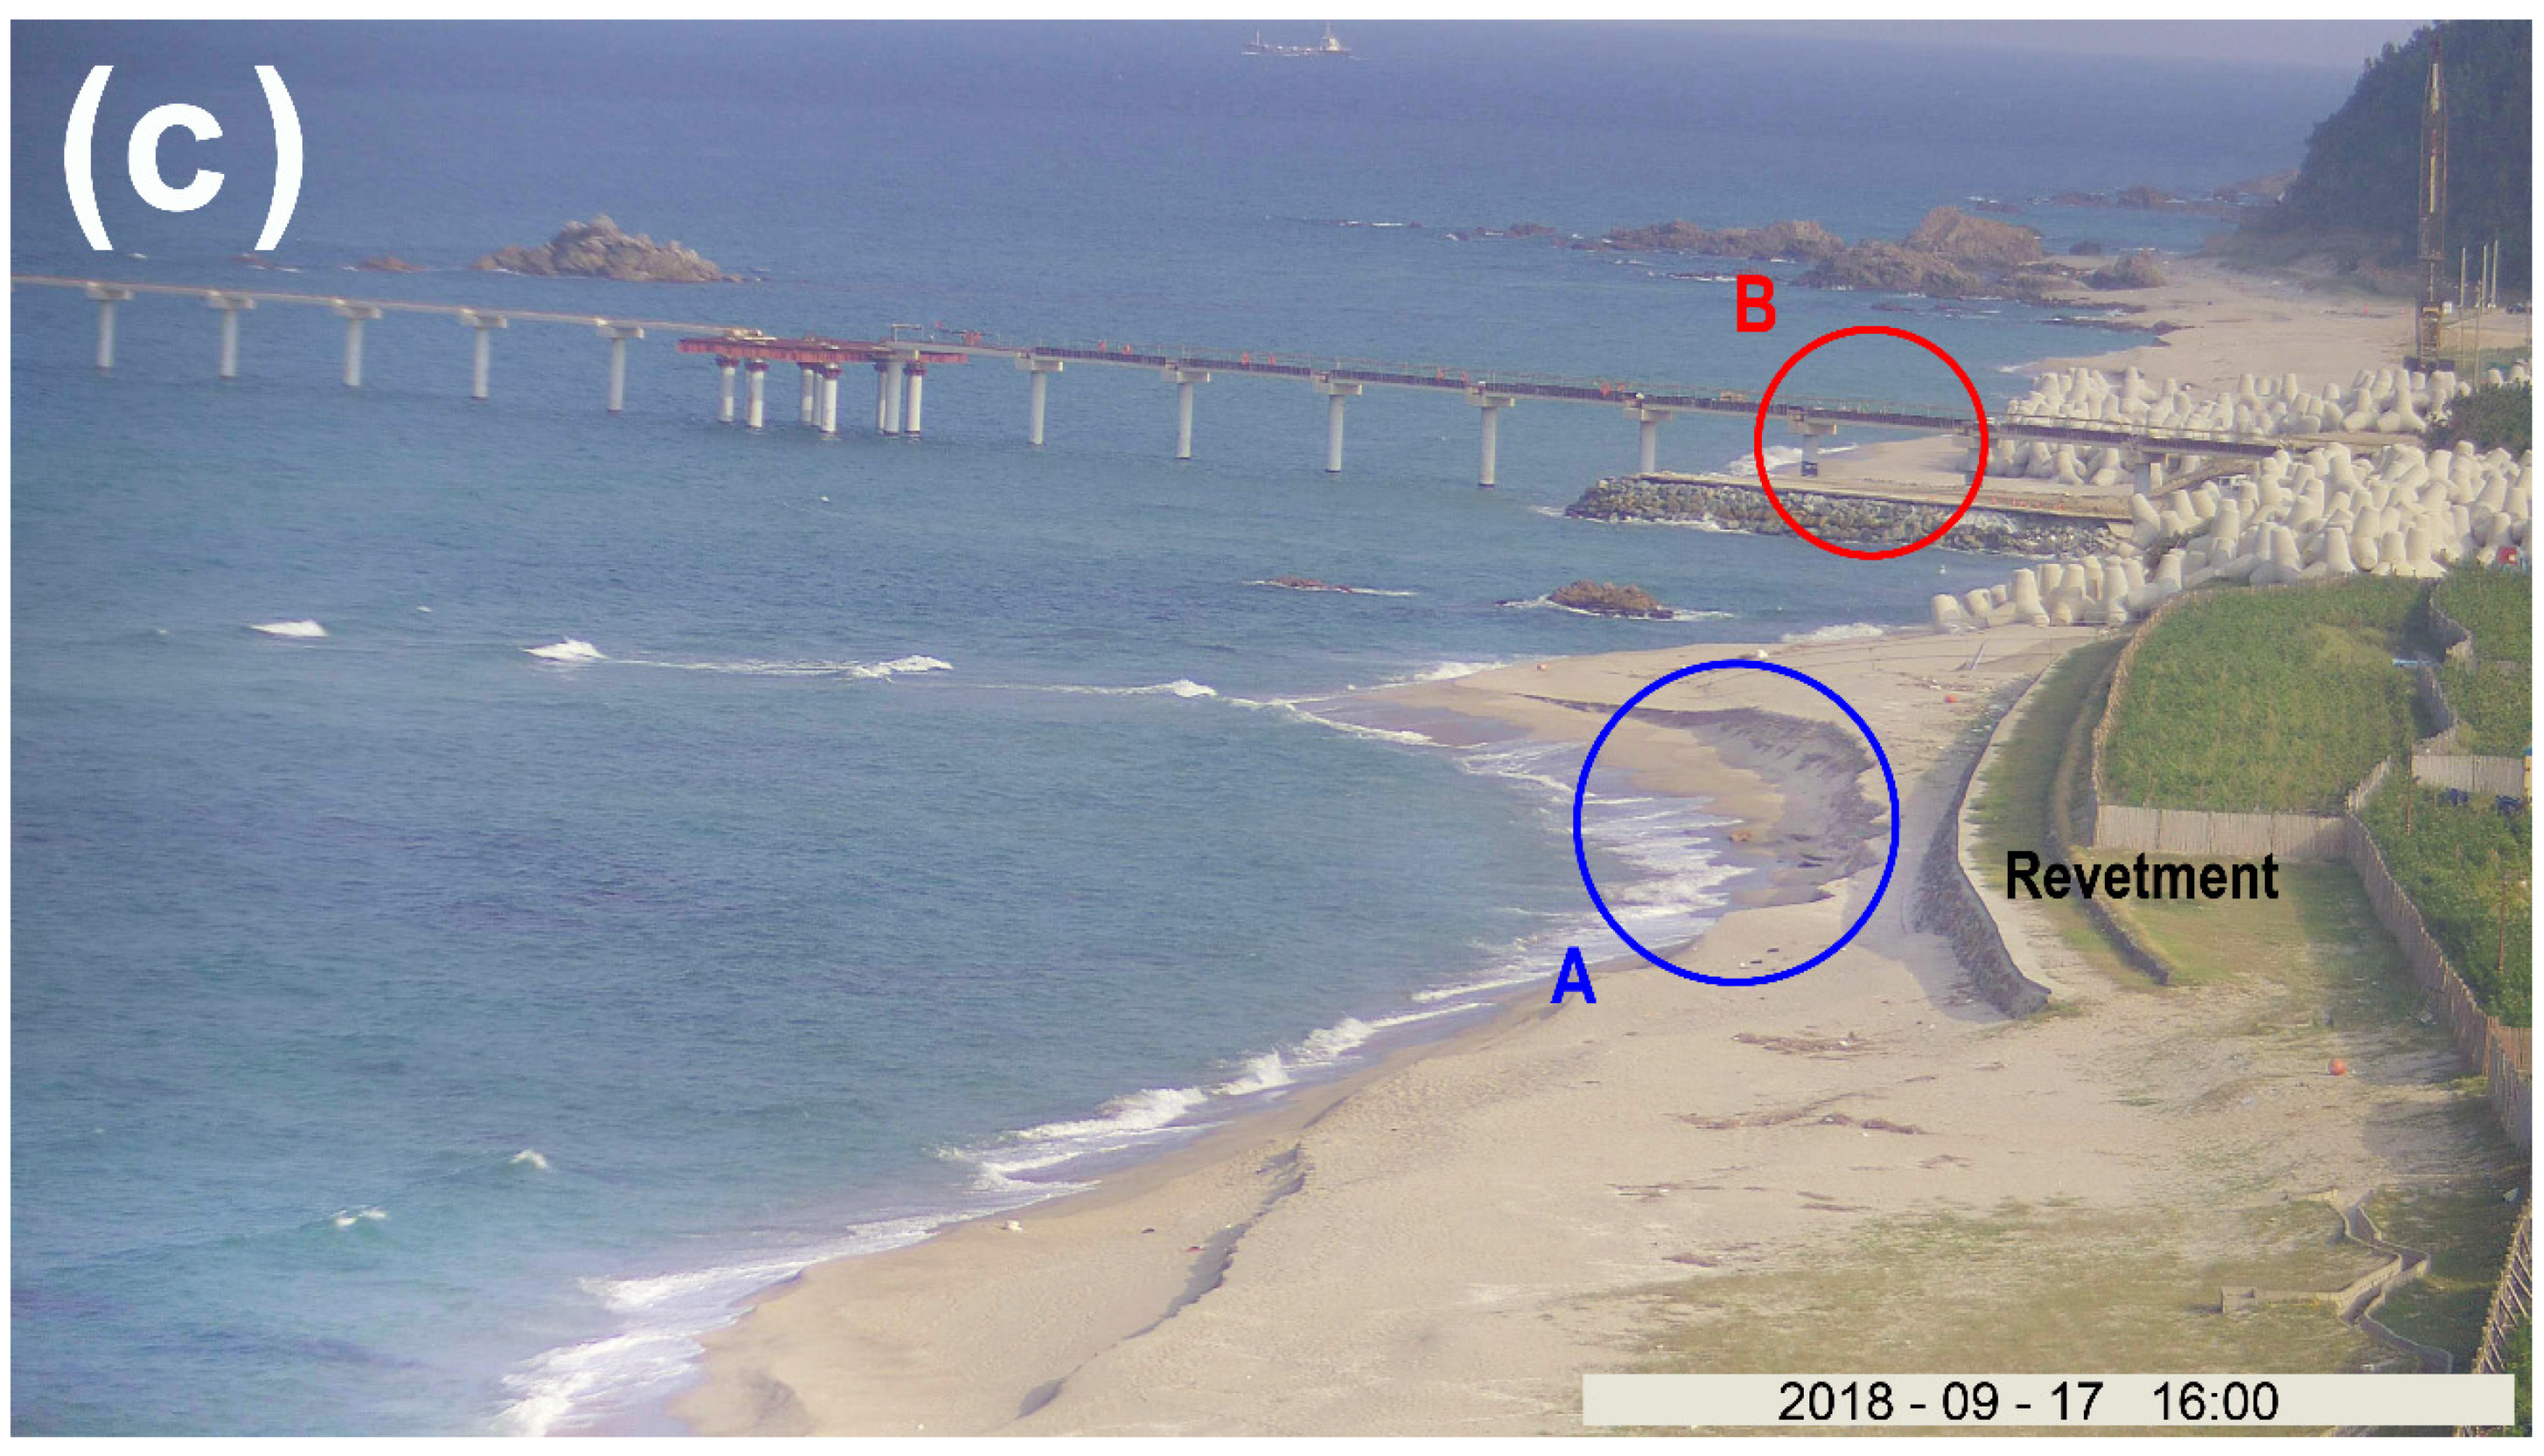
Figure 5.
(a) Time series of the significant wave height () and (b) peak wave direction () from 1 March 2018 to 7 November 2019. The blue vertical lines denote T1 (10 September) and T3 (17 September) when severe coastal erosion occurred at location A. Note that between T 1 and T3 was ~90°, indicating that the waves approached at an angle of ~45° with respect to the shore-normal direction.

Figure 6.
(a) Rose diagram of and from 1 March to 31 August 2018; (b) rose diagram showing the wave conditions between T1 (9 September) and T4 (21 September).
Figure 6.
(a) Rose diagram of and from 1 March to 31 August 2018; (b) rose diagram showing the wave conditions between T1 (9 September) and T4 (21 September).
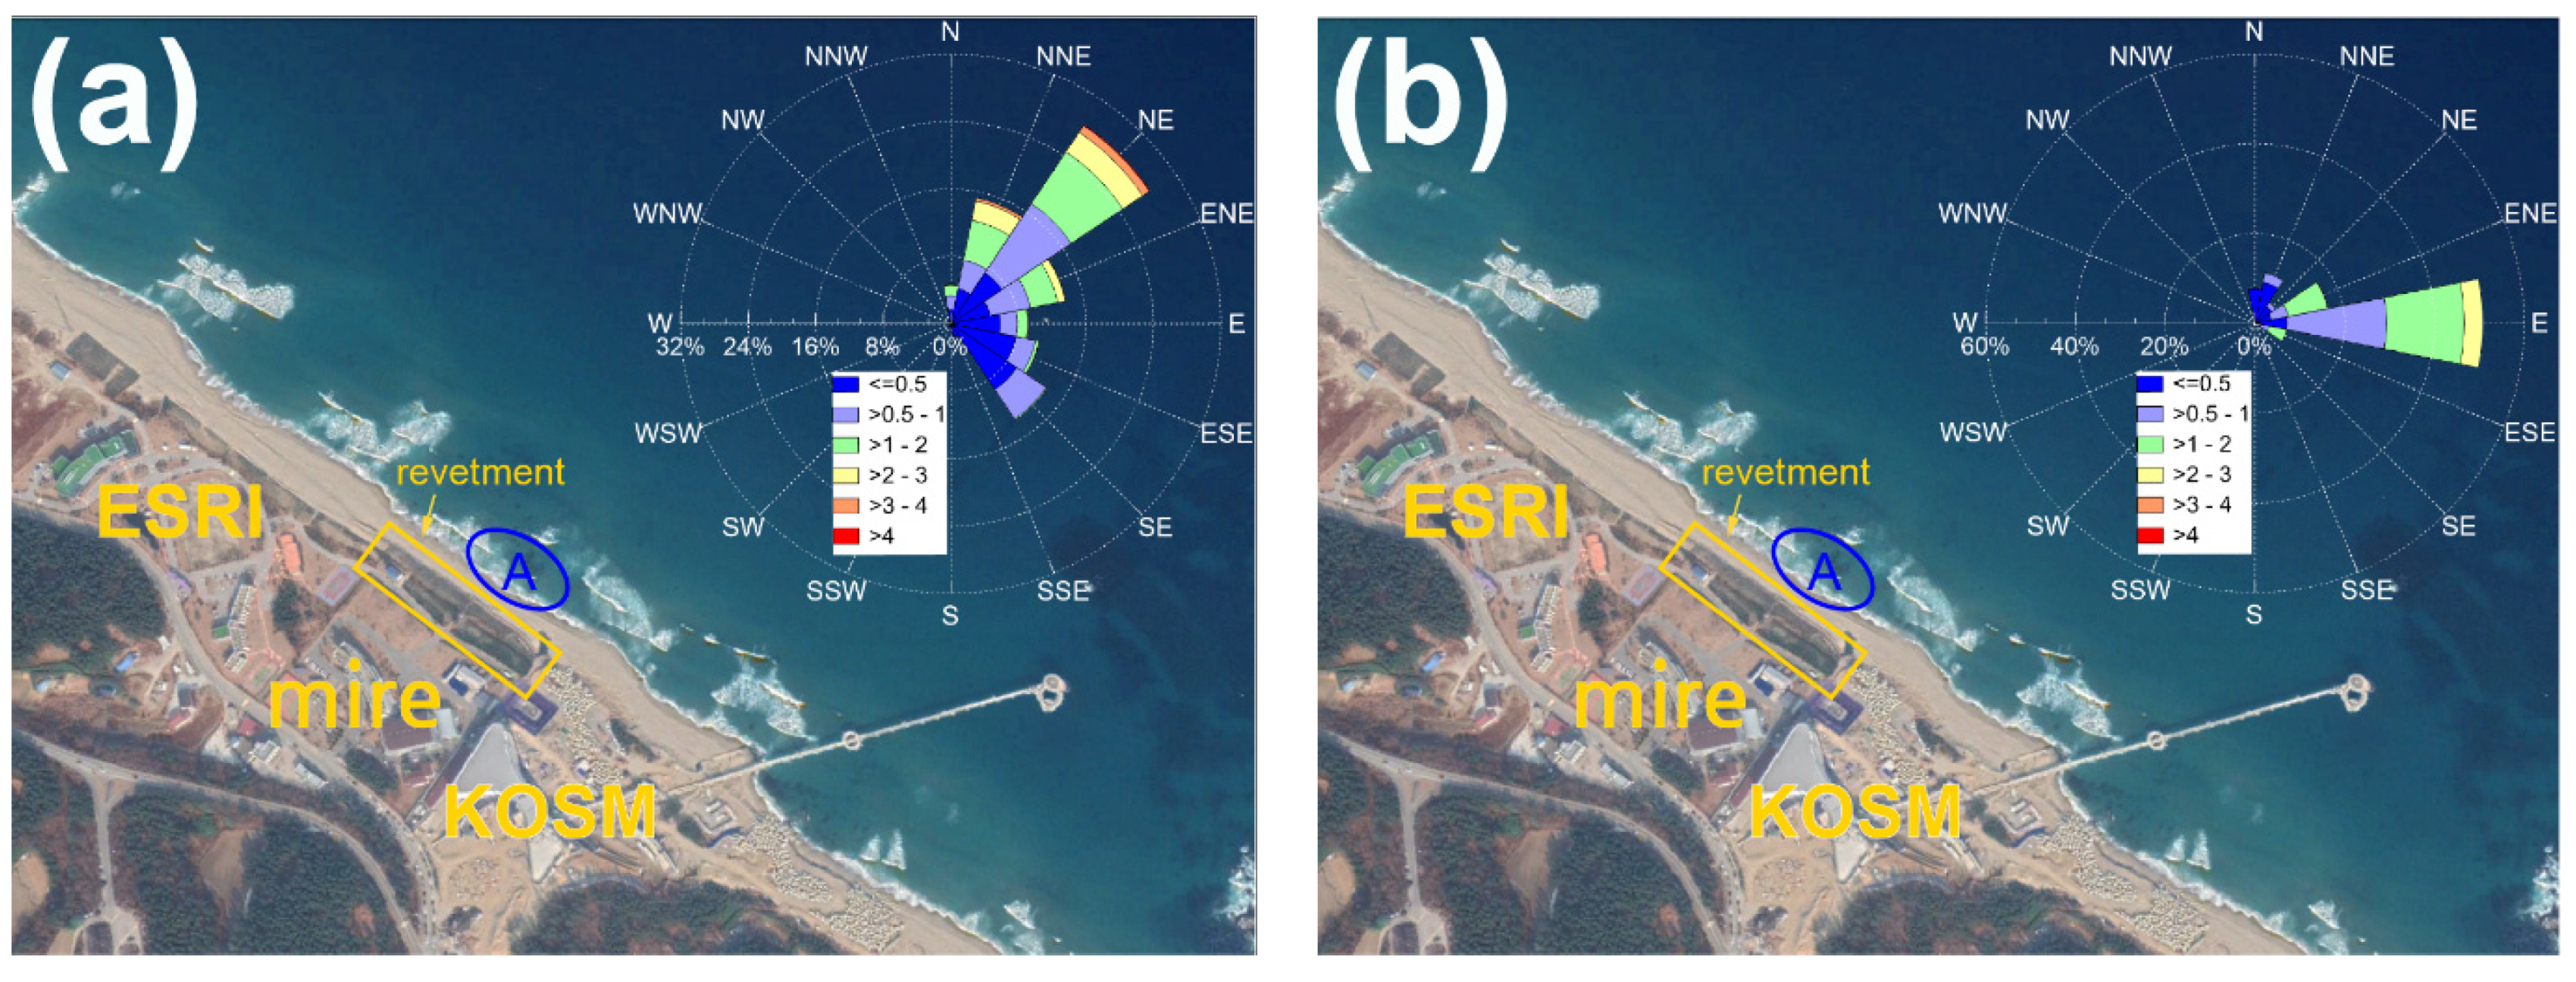
Figure 7.
Same as Figure 4 but for a shorter time frame. (a) Time series of the significant wave height () and (b) peak wave direction () from 1 September to 11 October 2020. The vertical lines denote the times T1 to T8 at which special events occurred at location A.
Figure 7.
Same as Figure 4 but for a shorter time frame. (a) Time series of the significant wave height () and (b) peak wave direction () from 1 September to 11 October 2020. The vertical lines denote the times T1 to T8 at which special events occurred at location A.

Figure 8.
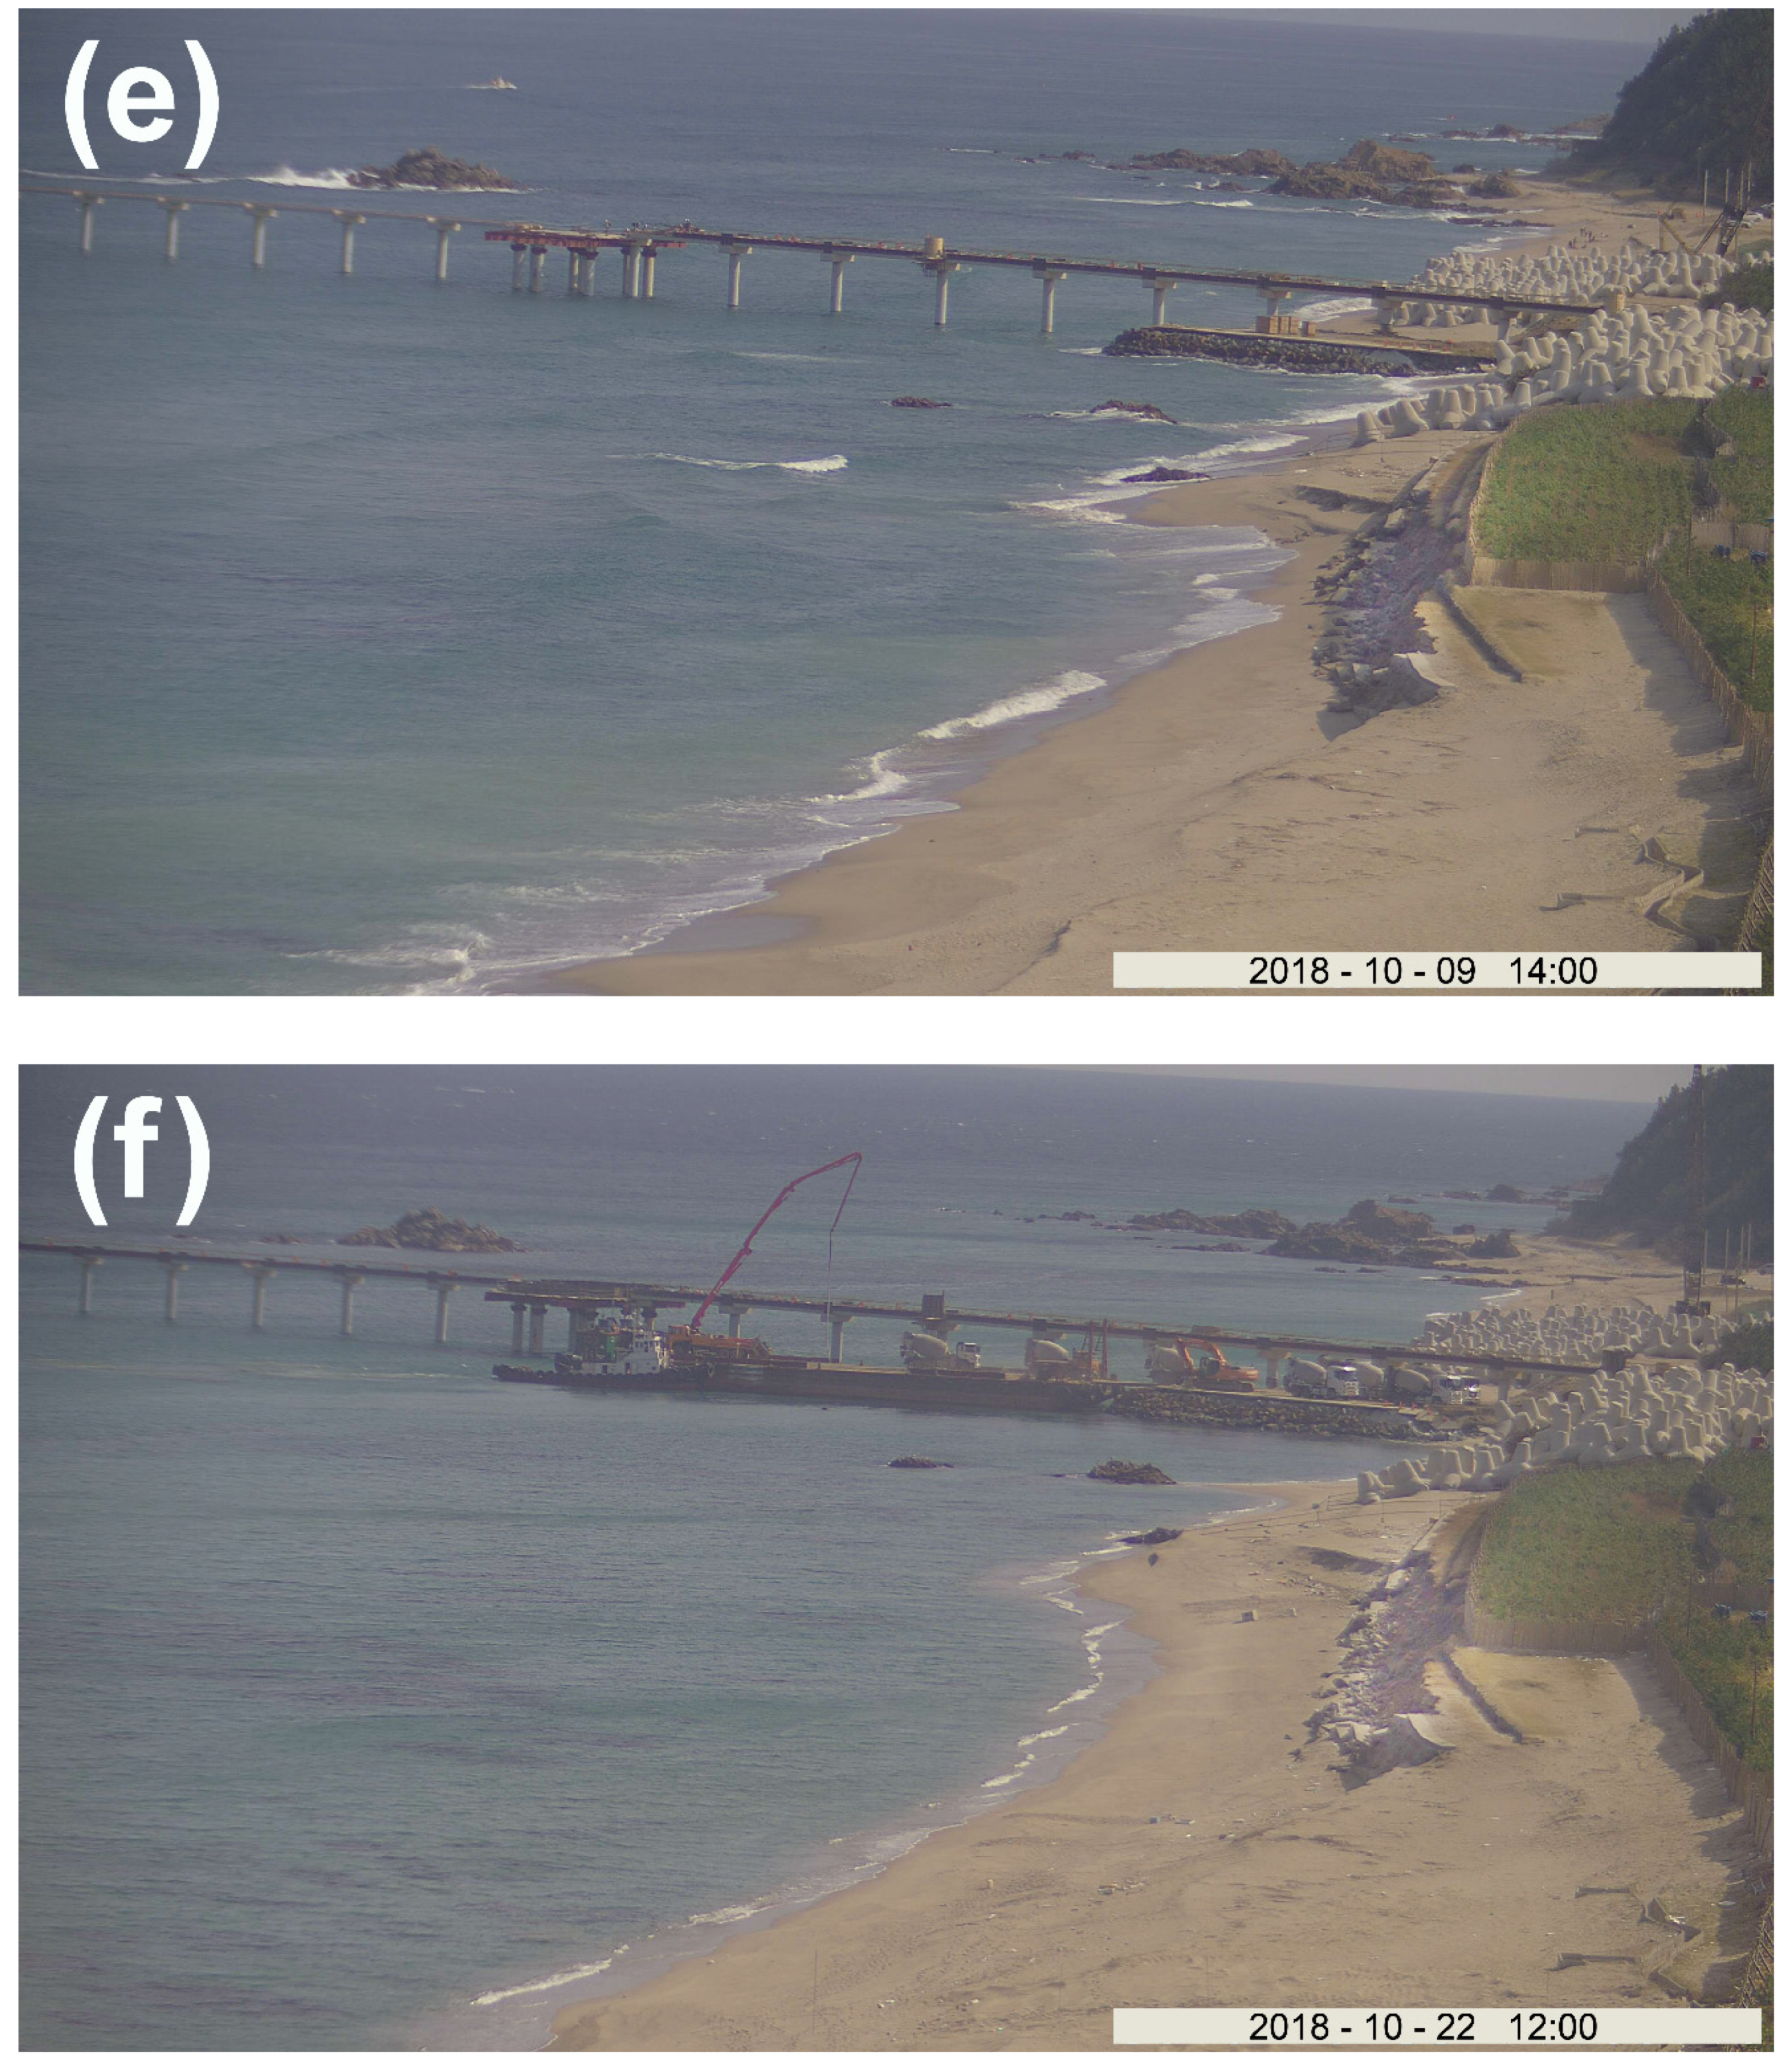
VMS image of the revetment location on the following dates: (a) 21 September 2018 (T4); (b) 22 September 2018 (T5) when the revetment was damaged for the first time; (c) 4 October 2018 (T6) where the amount of debris at the beach face is increased compared with that at T5; (d) 6 October 2018 (T7), when the area was hit by Typhoon Kong-rey. The image captures a moment during which a high breaking wave hit the revetment; (e) 9 October 2018 (T8) when the revetment was completely destroyed. Piles of debris are scattered at the beach face at the bottom of the revetment; (f) 22 October 2018. The beach recovered after the storm waves passed.
Figure 8.
VMS image of the revetment location on the following dates: (a) 21 September 2018 (T4); (b) 22 September 2018 (T5) when the revetment was damaged for the first time; (c) 4 October 2018 (T6) where the amount of debris at the beach face is increased compared with that at T5; (d) 6 October 2018 (T7), when the area was hit by Typhoon Kong-rey. The image captures a moment during which a high breaking wave hit the revetment; (e) 9 October 2018 (T8) when the revetment was completely destroyed. Piles of debris are scattered at the beach face at the bottom of the revetment; (f) 22 October 2018. The beach recovered after the storm waves passed.

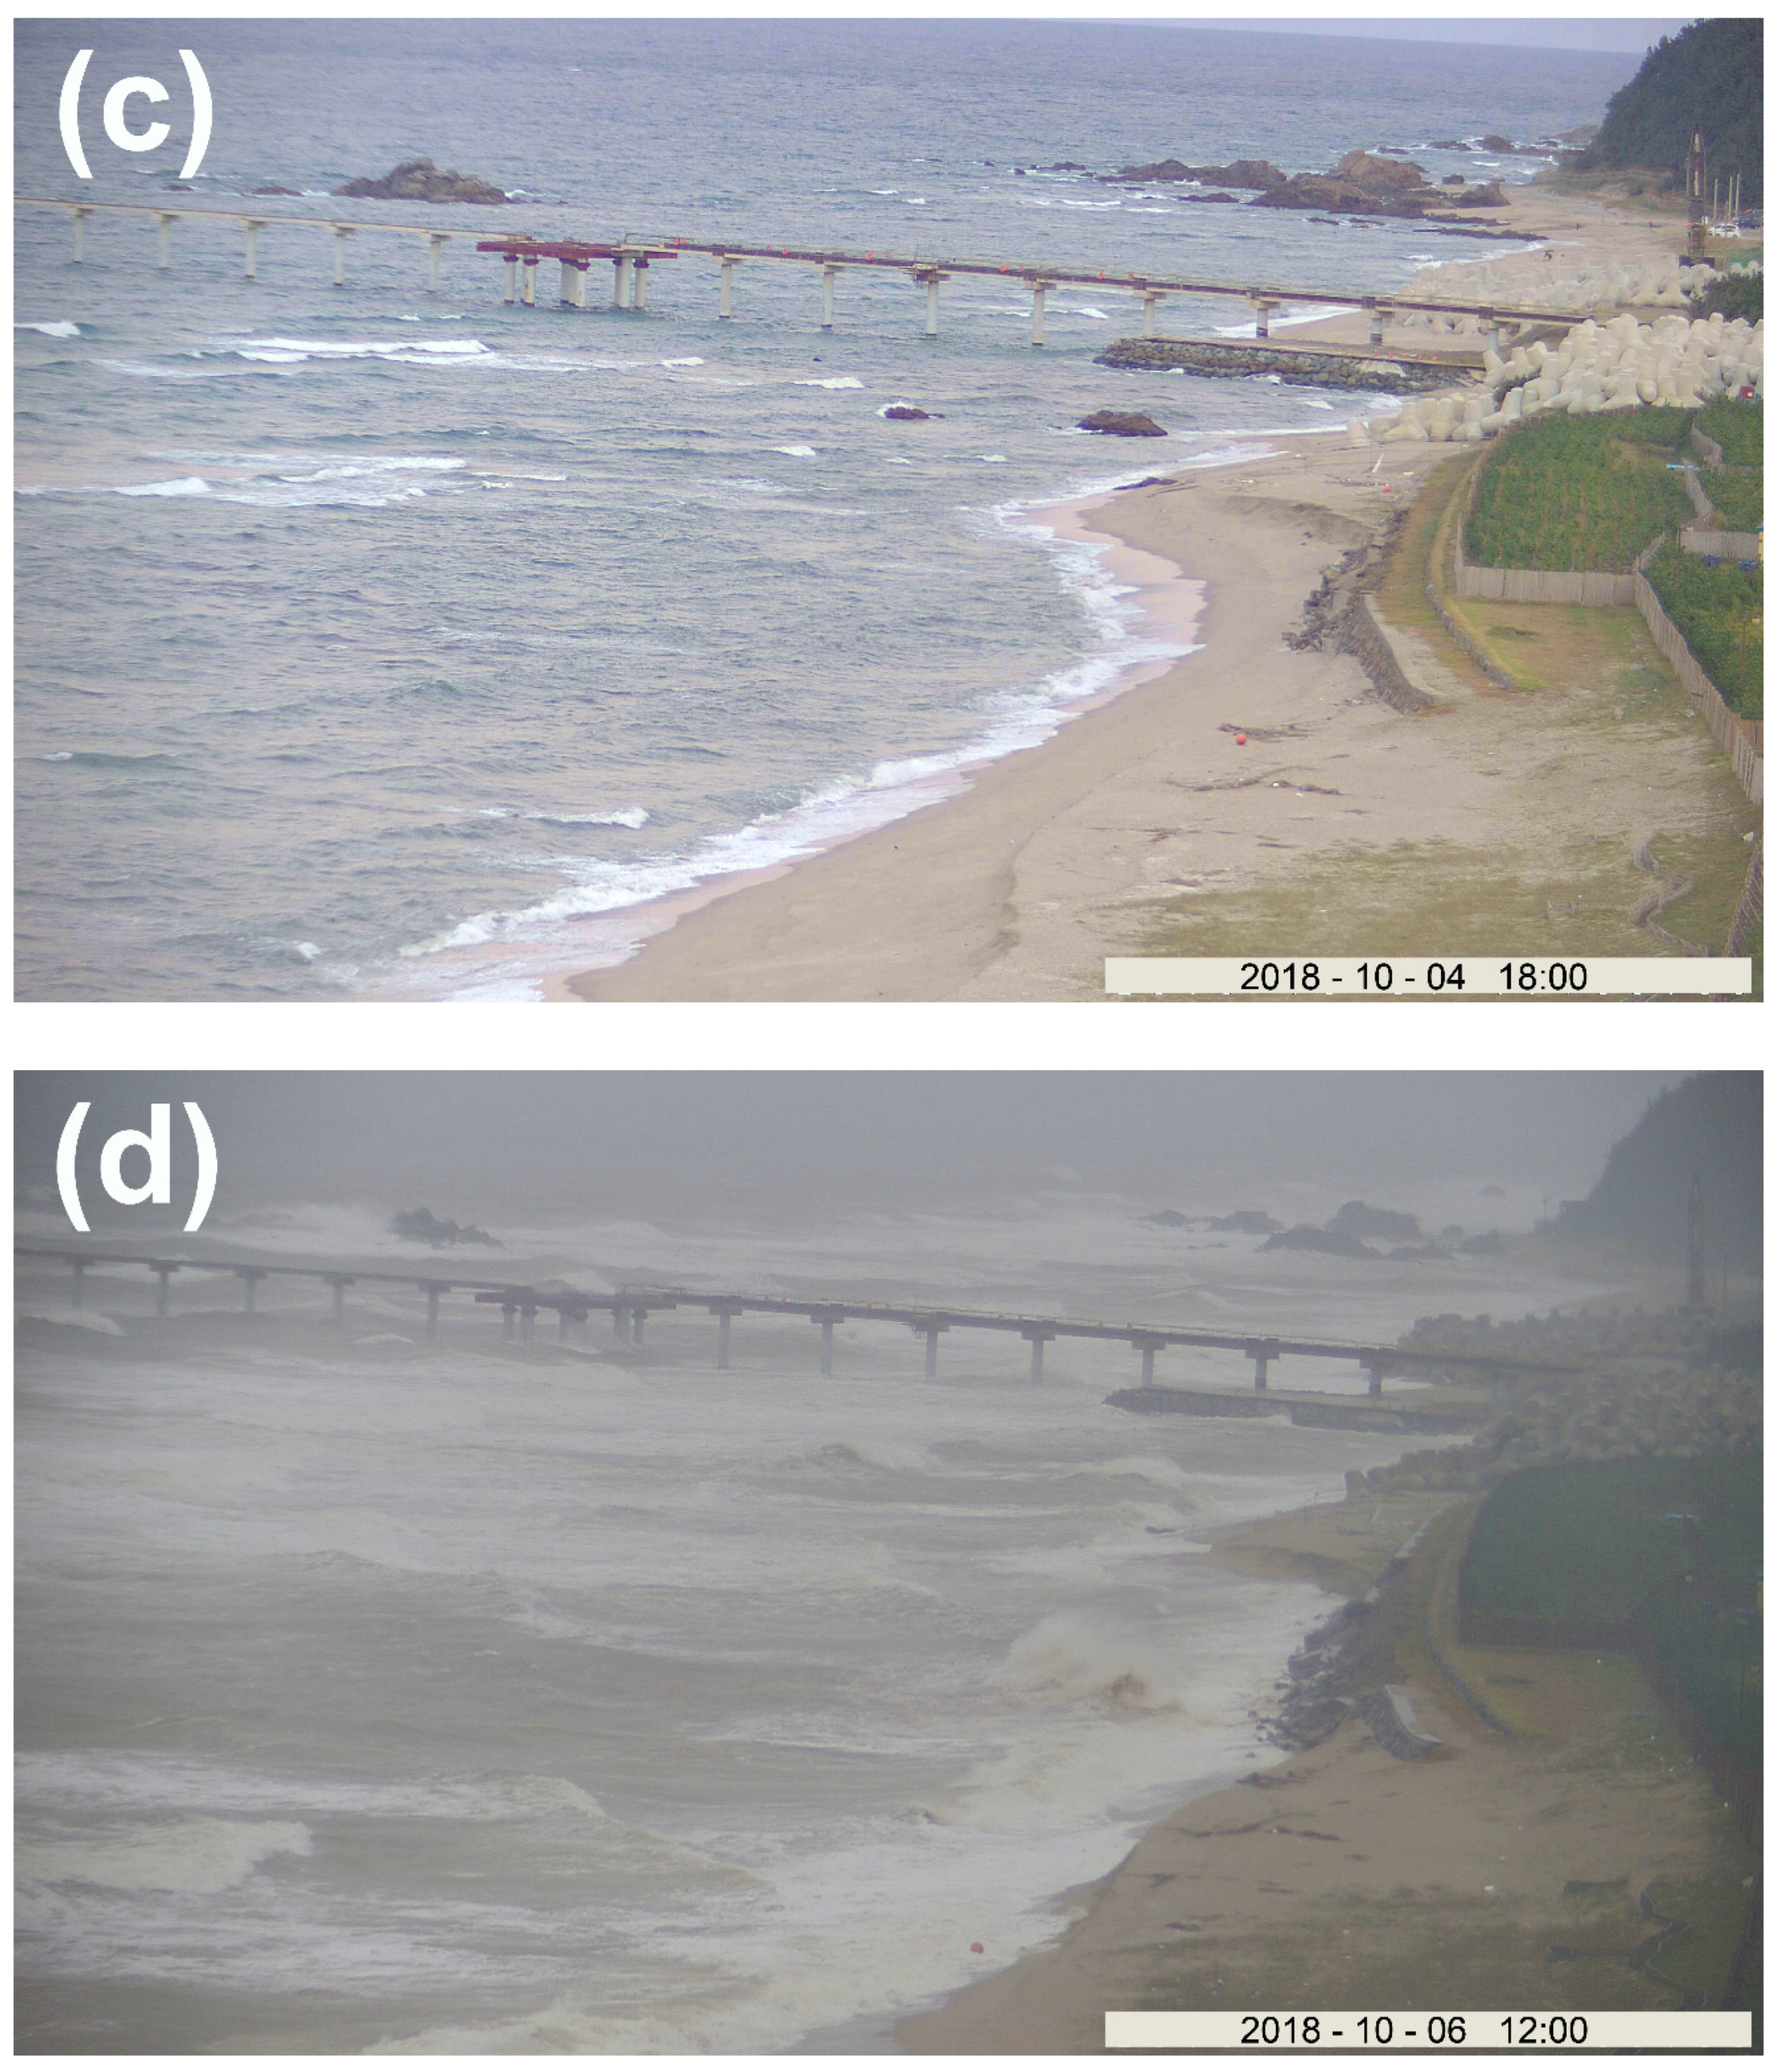

Figure 9.
Shoreline positions marked on a Google Earth map. The thick solid red line marked inland denotes the location of the revetment. The thinner colored lines denote the shorelines calculated by the VMS on 1 September (black), 3 October (blue), and 25 October (red).
Figure 9.
Shoreline positions marked on a Google Earth map. The thick solid red line marked inland denotes the location of the revetment. The thinner colored lines denote the shorelines calculated by the VMS on 1 September (black), 3 October (blue), and 25 October (red).

Figure 10.
Photographs of the revetment before the destruction on (a) 18 September 2018 and (b) 21 September (T4), after the partial destruction on (c) 22 September (T5) and (d) October 5, and after collapse on (e) 8 October and (f) 21 November 2018.
Figure 10.
Photographs of the revetment before the destruction on (a) 18 September 2018 and (b) 21 September (T4), after the partial destruction on (c) 22 September (T5) and (d) October 5, and after collapse on (e) 8 October and (f) 21 November 2018.
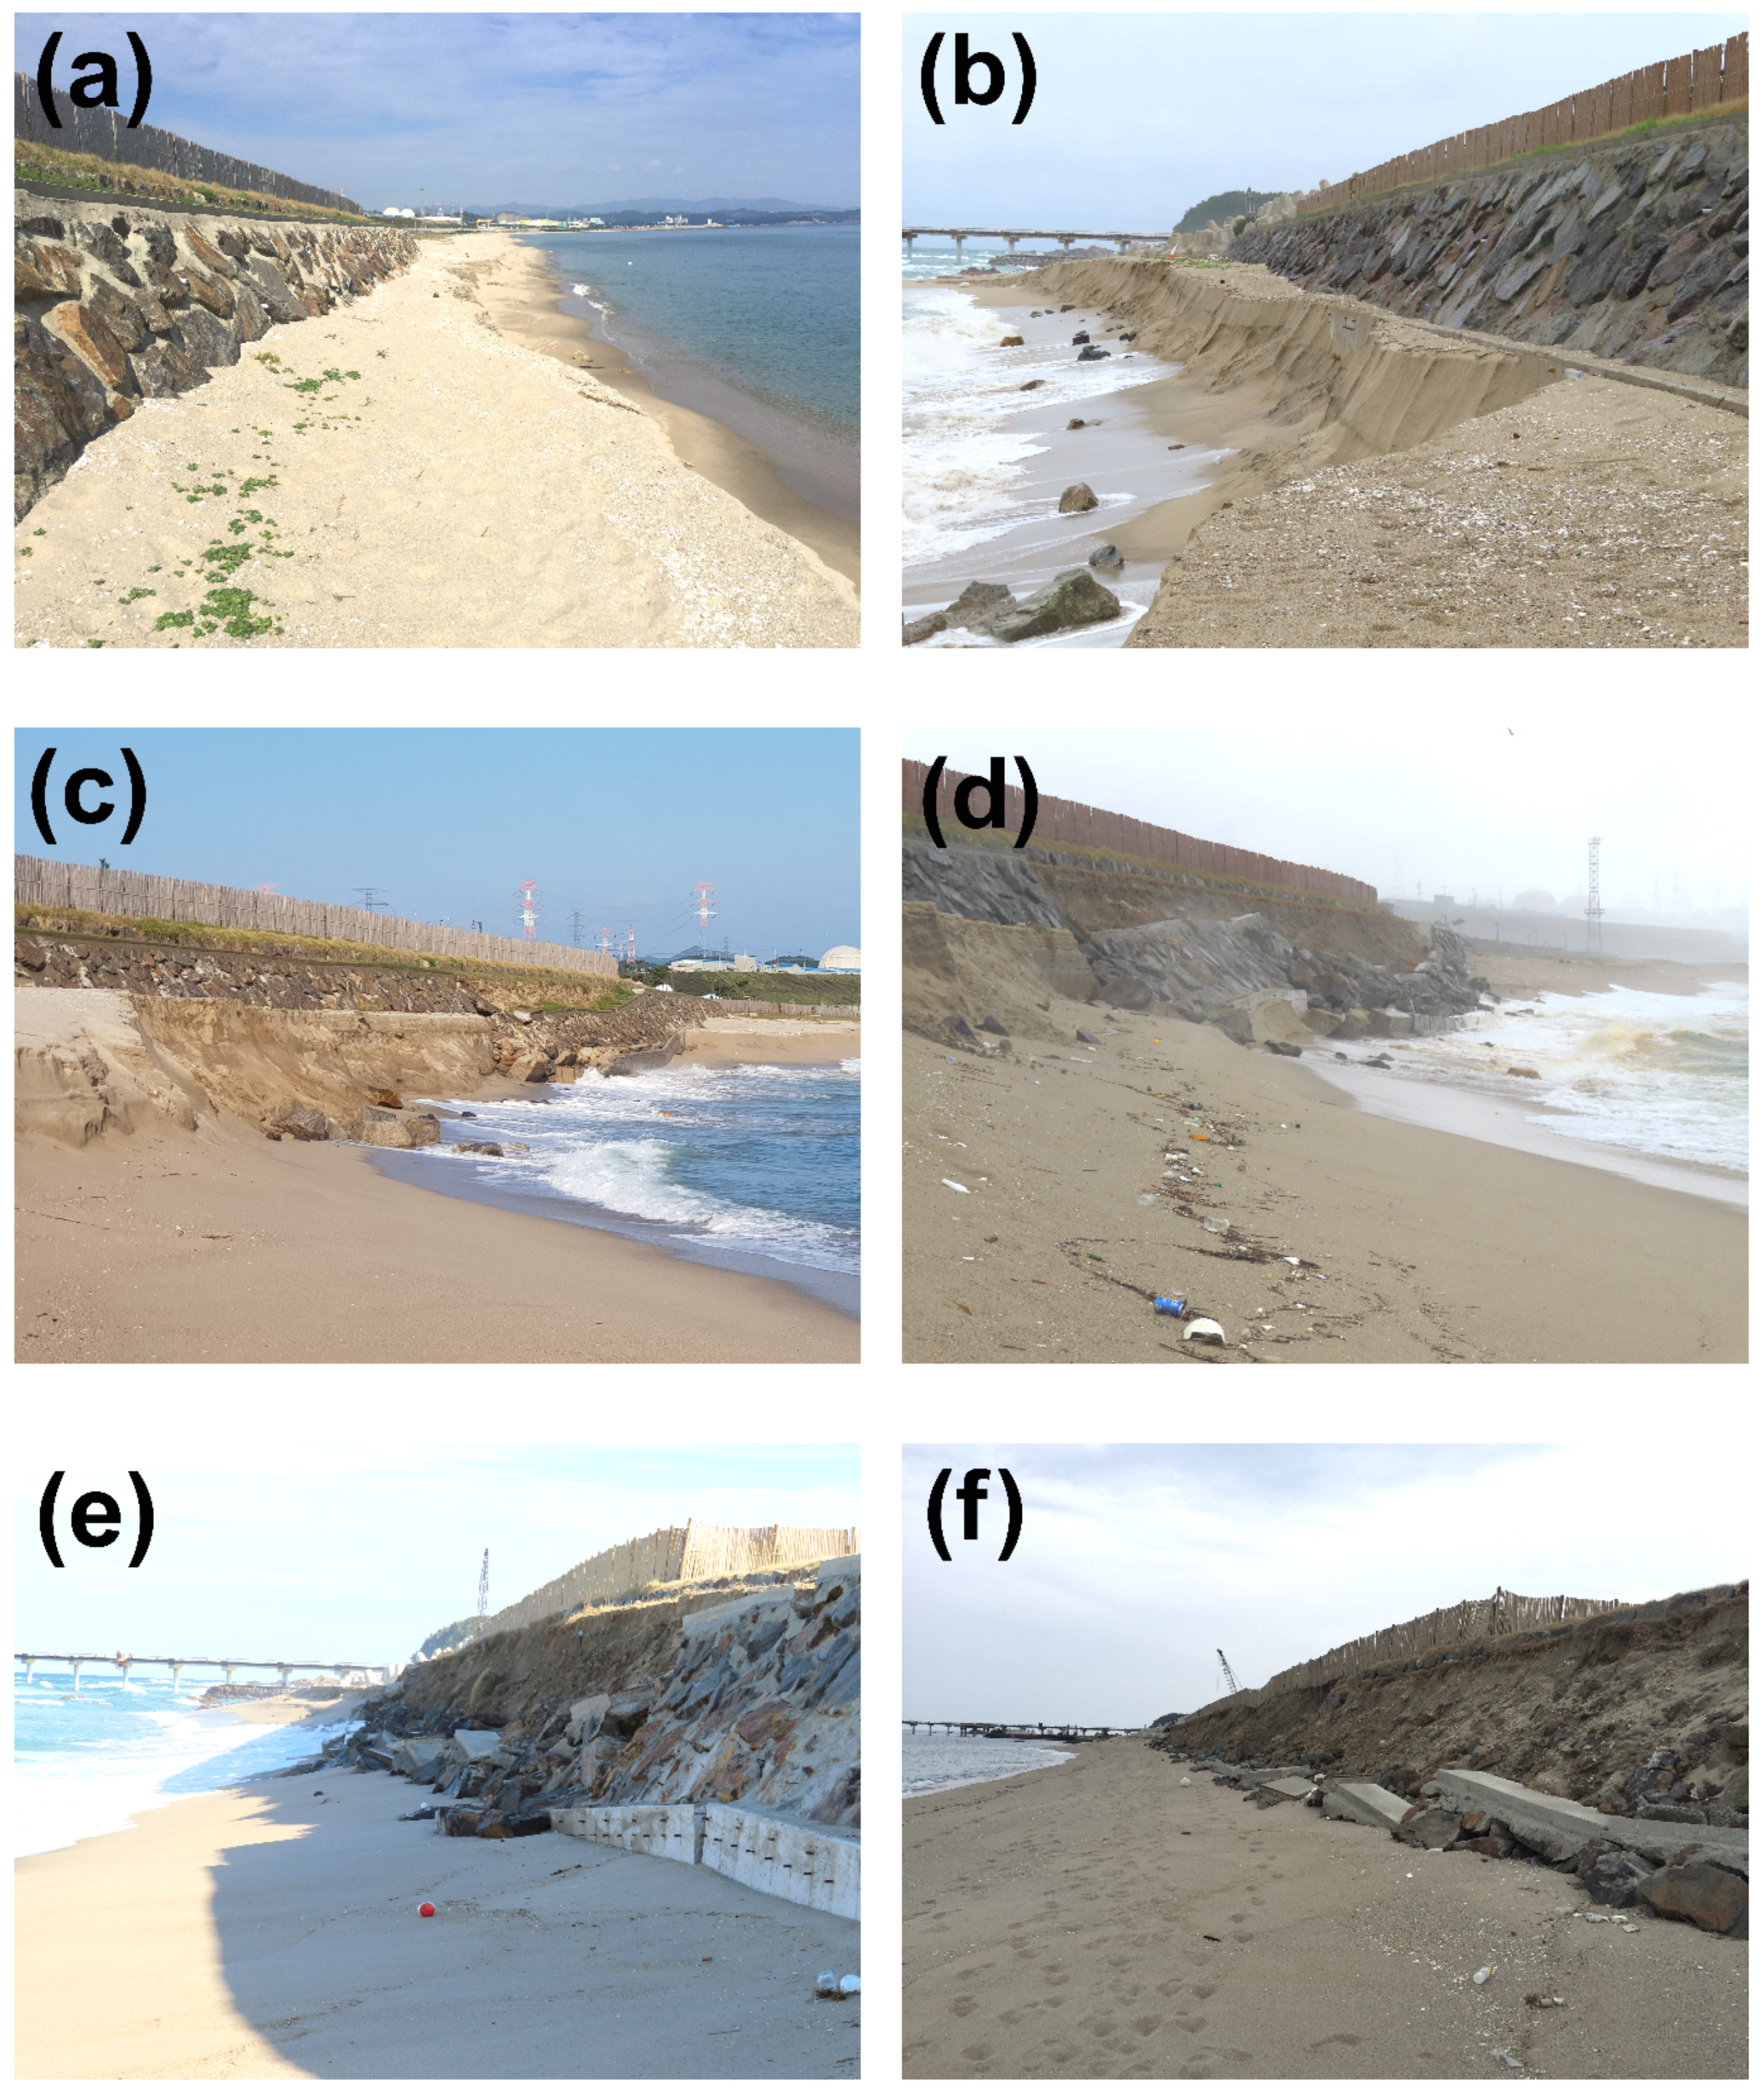
Figure 11.
VMS image of the revetment on 1 October 2018. The blue circle, A, denotes the area in which erosion occurred in front of the revetment. The red circle, B, denotes the location in which the shoreline was not eroded. The orange circles, C and D, denote the locations of the rocks. The yellow circles, E, F, and G, denote the locations where the waves broke in front of the locations A and B.

Figure 12.
Bathymetry contours measured by single-beam echosounder on 21 October 2018. It shows that crescentic sandbars developed in the nearshore areas where the water depth shallower than 5 m, which rendered the water depth to be shallower in front of A, whereas the water depth was deeper in front of B where a sandbar horn developed.
Publisher’s Note: MDPI stays neutral with regard to jurisdictional claims in published maps and institutional affiliations. |
© 2021 by the authors. Licensee MDPI, Basel, Switzerland. This article is an open access article distributed under the terms and conditions of the Creative Commons Attribution (CC BY) license (http://creativecommons.org/licenses/by/4.0/).
Share and Cite
MDPI and ACS Style
Do, J.D.; Jin, J.-Y.; Jeong, W.M.; Lee, B.; Choi, J.Y.; Chang, Y.S. Collapse of a Coastal Revetment Due to the Combined Effect of Anthropogenic and Natural Disturbances. Sustainability 2021, 13, 3712. https://doi.org/10.3390/su13073712
AMA Style
Do JD, Jin J-Y, Jeong WM, Lee B, Choi JY, Chang YS. Collapse of a Coastal Revetment Due to the Combined Effect of Anthropogenic and Natural Disturbances. Sustainability. 2021; 13(7):3712. https://doi.org/10.3390/su13073712
Chicago/Turabian StyleDo, Jong Dae, Jae-Youll Jin, Weon Mu Jeong, Byunggil Lee, Jin Yong Choi, and Yeon S. Chang. 2021. "Collapse of a Coastal Revetment Due to the Combined Effect of Anthropogenic and Natural Disturbances" Sustainability 13, no. 7: 3712. https://doi.org/10.3390/su13073712
Note that from the first issue of 2016, this journal uses article numbers instead of page numbers. See further details here.