
A GIS-MCDA-Based Suitability Analysis for Meeting Targets 6.3 and 6.5 of the Sustainable Development Goals


1
Hellenic Centre for Marine Research, Institute of Marine Biological Resources and Inland Waters, 166 04 Anavissos, Greece
2
Directorate for Water Management, Ministry of Agriculture, Forestry and Water Management, Rimski Trg 46, 810 00 Podgorica, Montenegro
*
Author to whom correspondence should be addressed.
Sustainability 2021, 13(8), 4153; https://doi.org/10.3390/su13084153
Submission received: 28 February 2021
/
Revised: 25 March 2021
/
Accepted: 5 April 2021
/
Published: 8 April 2021
(This article belongs to the Special Issue Sustainable Geography)
Abstract
:Among the Sustainable Development Goals (SDGs) established in the 2030 Agenda, goals 6.3, regarding clean water and improve of water quality, and 6.5, regarding integrated water resources management, highlight the need for the implementation of successful environmental water quality monitoring programs of transboundary river waterbodies. In the present study, the designation of high priority areas for water quality monitoring of Drin transboundary watershed is performed using a suitability model, a GIS-based multicriteria decision analysis (GIS-MCDA) approach that takes into consideration the most important conditioning factors that impose pressures on rivers. Based on the results, the methodological approach used manages to sufficiently delimit the areas with increased need for water quality monitoring in the Drin watershed, and the validation procedure produces a correlation coefficient of 0.454 (statistically significant at a 0.01 level). Limitations arise in the case of a lack of detailed information or inaccurate input data and due to the inconsistency among the input data and the different methodological approaches regarding the information collection of each country involved. These restrictions foreground the need for cooperation between the countries involved regarding the exchange of scientific knowledge and common legislation, so as to achieve integrated, effective, and sustainable management of water resources of the area.
1. Introduction
The 2030 Agenda for Sustainable Development was adopted in 2015 by the United Nations (UN) and established 17 Sustainable Development Goals (SDGs) and 169 targets, aiming to achieve a better and more sustainable future for all people [1]. In 2017, the SDGs’ targets were followed by 231 unique indicators developed by the global indicator framework for SDGs and adopted by the General Assembly of the UN [2]. SDGs succeed the Millennium Development Goals (MDGs) to complete what the latter did not achieve and focused on and reconciled all aspects and dimensions of sustainable development: economic, social, and environmental [1].
Among the SDGs related to environmental protection (goals 6: Clean Water and Sanitation, 12: Responsible Consumption and Production, 13: Climate Action, 14: Life Below Water, and 15: Life On Land) [3], Goal 6 reflects the increased attention on water and sanitation issues in the global political agenda [4]. Goal 6.6 aims to protect and restore water-related ecosystems, including rivers, and to monitor progress by tracking the impact of human development in the extent of water-related ecosystems over time (Indicator 6.6.1) [5]. The sub-indicators of 6.6.1 dictate the need for water quality monitoring of rivers, imported from Indicator 6.3.2 (Proportion of bodies of water with good ambient water quality) [5] and is highly interrelated to Article 8 of the Water Framework Directive 2000/60/EC [6].
In most developed countries, water quality monitoring programs are implemented under national and regional reporting requirements aimed at monitoring the health of water-related ecosystems and protecting or restoring water resources [4], as dictated by Indicator 6.6.1 [5]. In the case of a transboundary river basin, cooperation over natural water resources as noted under Goal 6.5 (Implement integrated water resources management), as also promoted under The Convention on the Protection and Use of Transboundary Watercourses and International Lakes (Water Convention) [7], can be even more challenging [4]. Differences in legislation, policies and priorities, financing, and stakeholder and private sector participation among the countries involved complicate the implementation of a holistic water management plan and monitoring program.
A strong tool commonly used in creating, managing, analyzing, modeling, and sharing SDGs data is geospatial information technologies [8]. In the Outcome document of the United Nations Conference on Sustainable Development which took place in Rio de Janeiro, Brazil, the importance of space-technology-based data, in situ monitoring and reliable geospatial information in sustainable development, policymaking, programming, and project operations was recognized [9]; geography can provide the integrative framework necessary for global collaboration and consensus decision-making [10,11].
In order to address the need for the implementation of successful environmental water quality monitoring programs of transboundary river waterbodies, so as to meet the SDG 6.3 regarding clean water and the improvement of water quality, and SDG 6.5 regarding implementation of integrated water resources management, geospatial techniques were applied. More specifically, the high priority areas for the monitoring of the Drin transboundary river basin were estimated using a suitability model, a GIS (Geographical Information System)-based multicriteria decision analysis (GIS-MCDA) approach, that has already been successfully applied at a national level [12]. Although the challenges concerning the inconsistency among the input data and the different methodological approaches regarding the information collection of each country are many, this technique is cost-effective and can be easily applied in river basins with various stakeholders involved [12]. The final scope was to demonstrate a framework for cooperation among the countries involved that incorporates a common river basin management plan as promoted by the Water Framework Directive 2000/60/EC [6], a GIS-based approach, and data sharing efforts that constitute a valuable tool for decision making.
2. Materials and Methods
2.1. Study Area
The Drin River is located at the southern-western Balkans and covers an area of about 20.700 km2. The Drin River Basin is an interconnected hydrological system that comprises the transboundary sub-basins of the Skadar/Shkoder Lake (27% of the total basin area), the White Drin River (21%), the Black Drin River (19%), the Drin River (17%), the Ohrid Lake (7%), the Prespa Lake (7%), and the Buna/Bojana River (2%) [13]. The Drin river basin is shared among five countries: Albania (39%), Kosovo (This designation is without prejudice to positions on status and is in line with UNSCR 1244/1999 and the ICJ Opinion on the Kosovo declaration of independence.) (23%), Montenegro (21%), North Macedonia (15%), and Greece (2%) (Figure 1).
The 149 km-long Black Drin River originates out of the Prespa and Ohrid karstic system and meets the 136 km long White Drin River at Kukes in Albania; their confluence, the Drin River, discharges to the Adriatic Sea. The old riverbed of Drin discharges into the Adriatic Sea south of the Buna/Bojana River, while the Drin River’s main branch, which was diverted northwards, nowadays joins the Buna/Bojana River close to the latter’s outlet from Shkoder Lake and together they discharge into the Adriatic Sea [14,15].
The significance of the Drin River and its main tributaries in terms of hydropower production is major, especially for Albania. This has led to the alteration of the hydrological regime of the river, the increase of flood risk at the downstream area of Buna/Bojana River [16], to the consequential disturbance of sediments discharge, the interruption of the biological corridors along the river, and the degradation of the supported ecological systems. Significant pressures also impose the abandoned mines in Albania, illegal dumpsites, uncontrolled waste disposal, sanitation and sewer leakage, and the intensive tourism around lakes Ohrid, Prespa, and Shkodra. Finally, agricultural activities have led to locally increased nutrient concentration in the Drin hydrographic network that eventually discharge into the Adriatic Sea [14,17].
The Drin River Basin is characterized by a large number of native (56) and nonnative (16) fish species [17], while many areas have been recognized for their environmental values and have been included in environmental protection networks. There is a number of existing and proposed protected areas, under different protection statuses among the countries involved. For more details, see Section 2.3.5.
In the Drin River Basin, except for Greece that as a European Union (EU) member is obliged to report annually the results of the inland water quality monitoring program, Albania, Montenegro, North Macedonia, and Kosovo follow different protocols concerning the river water quality monitoring. Nevertheless, Albania, Montenegro, and North Macedonia as EU candidate countries, and Kosovo as a potential candidate, are in the process or already have incorporated in their national legislation the 2000/60/EC WFD and other directives related to surface water quality monitoring and protection.
Details concerning the river water policies, environmental legislations, and the quality status classification system of rivers used by each country involved are presented in Appendix A.
2.2. Suitability Modeling
The designation of high priority areas for the monitoring of the Drin transboundary river basin was performed using a suitability model. In this specific effort, the GIS (Geographical Information System)-based multicriteria decision analysis (GIS-MCDA) approach, was employed by utilizing ESRI—ArcMap 10.7 software. GIS-MCDA is a very popular suitability analysis tool [18], used commonly for supporting environmental decision-making [19]. Here, the conventional GIS-MCDA, multi-attribute decision analysis (MADA) approach that involves a predetermined, limited number of alternatives and assumes spatial homogeneity of preferences with respect to different levels of criterion values was adopted [20,21].
GIS-MCDA suitability mapping involves the following procedure: (1) defining the goal, (2) defining the criteria and constraints, (3) standardization of criteria (value scaling), (4) criterion weighting, (5) criteria aggregation, and (6) validation of suitability model accuracy [22,23] (Figure 2). The first two steps (steps 1 and 2) are based on the decision maker’s judgement and depend on the scope of the analysis and the data availability, while the last step (step 6) depends highly on available reference data [24]. In this paper, the suitability model criteria used were based on experts’ judgment (two environmental scientists of HCMR and one of the Ministry of Agriculture, Forestry, and Water Management MAFWM, Directorate for Water Management, specialized in water resources management), and the criteria used in similar analysis [12] after modifications, and are presented in detail in Section 2.3.
Standardization of criteria (step 3) is the procedure for transforming raw data to comparable units [20] and the most common GIS-based method for standardizing evaluation criteria is the score range procedure [22]. The accuracy of standardization depends on the expert’s judgment, experience, and expertise [24]. In this specific effort, criteria standardization was achieved on the basis of the assumption that the value function has a linear shape:
where Ri is the raw score i, Rmin is the minimum score of each factor, Rmax the maximum score of each factor, and SR is the standardized range, here set to 100 [25,26]. In case of qualitative criteria, the score ranking can be attributed subjectively.
Criterion weighting (step 4) is the procedure of value assigning to an evaluation criterion, which indicates its importance relative to the other criteria under consideration [20]. Here, the weighted linear combination (WLC) model, the most straightforward and one of the most common GIS-MCDA models used [27,28], was employed. In WLC, the decision rule evaluates each alternative with the following value function, S:
where wj is a normalized weight (); vj(xi) is the value function for the j-th attribute; xi = xi1, xx2, …., xin; and rij is the attribute transformed into the comparable scale [26,28].
Criterion weighting was based on the pairwise comparisons method in the context of a decision-making process known as the Analytic Hierarchy Process (AHP) [29], which is an adoption of WLC, and relies on the judgements of experts to derive priority scales.
The priority scales were derived after synthesizing their judgements using geometric mean of the final outcomes, as proposed by Saaty [30]. AHP employs a fundamental scale of values to represent the intensities of judgments, ranging between 1 and 9 (Table 1) [31]. All identified criteria are compared against each other in a pairwise comparison matrix. Once the pairwise comparison matrix is obtained, a vector of criterion weights, w = (w1, w2, …, wn) can be computed. The weights are obtained as the unique solution to:
where λmax is the largest eigenvalue of C. The consistency ratio CR of a pairwise comparison matrix defines the probability that the matrix ratings (rating of each criteria against each other regarding their relative importance) were randomly generated. CR can be defined as:
where n is the number of criteria under consideration and RI is the random index, which is the consistency index of a randomly generated pairwise comparison matrix and depends on the number n of elements being compared (Table 2). CR ratings greater than 0.10 indicate that the pairwise judgments are almost random and untrustworthy [32], while CR smaller than 0.10 indicates a reasonable level of consistency in the pairwise comparisons and that the adjustment is small compared to the actual values of the eigenvector entries [31]. Although some uncertainties may arise during criterion weighting and sensitivity analysis is often performed on the preference weights of the suitability model (e.g., [33,34,35]), in this case the validity of the outcome was evaluated using the consistency ratio CR, while the criterion weightings were optimized using the following procedure proposed by Saaty [36]: definition of the most inconsistent judgment in the matrix, determination of the possible range of the judgment values, and improvement of the final values based on expert’s judgment. This procedure was repeated until the desired consistency was reached [37]. In this specific effort, three environmental scientists of HCMR and MAFWM specialized in water resources management were involved in the procedure.
Cw = λmaxw,
Criteria aggregation (step 5) and the suitability modeling procedure was performed in ArcGIS Pro 2.7.0 with the Suitability Modeler tool. Finally, the validation of suitability model accuracy (step 6) was performed (see Section 2.4 for details).
2.3. Suitability Model Criteria
The activities and factors imposing a significant pressure on rivers in the Drin watershed [14] leading to an increased need for water quality monitoring, as dictated by the specialized in environmental water resources management personnel of HCMR and MAFWM, included in the analysis were: agricultural and economic related activities, the hydrogeological structure, the domestic wastewater, the type and capacity of hydropower projects in rivers, and the existence of area protected under legislation.
2.3.1. Agricultural Activities
Agricultural activities can impact water quality of rivers directly, due to the use of agrochemicals (pesticides, fertilizers, chemical growth agents, and animal manure) [38], but also indirectly, due to water abstraction for irrigation that affects the hydrological regime of the river and the amount of dissolved and suspended solids in rivers [39]. The spatial distribution of agricultural activities in the Drin watershed were retrieved from CORINE Land Cover 2018 [40]. Based on CORINE 2018 inventory, the total agricultural area in the Drin watershed is 4588 km2 (22% of the total basin area), the majority of which is occupied by complex cultivation patterns (8.6%), land principally occupied by agriculture, with significant areas of natural vegetation (6.9%), non-irrigated arable land (3.5%), and pastures (1.8%) (Figure 3). For each agricultural activity, a standardized value was attributed, on the basis of the pressures it poses on surface water quality, depending on the general agricultural practices proposed by agricultural engineers regarding nutrient management in the study area [12,41].
2.3.2. Economic Activities
Economic, mainly industrial and other related, activities may impose significant pressure on surface water resources [42]. In order to identify the pressures on river’s water quality due to economic activities in the Drin watershed, the Statistical Business Registry and/or the Structural Business Statistics (SBS) concerning the number of active enterprises per municipality, provided from the corresponding statistical authority of each country [43,44,45,46,47], were used. The categorization of these activities is based on the statistical classification of economic activities in the European Community NACE (Nomenclature statistique des Activités économiques dans la Communauté Européenne) ver. 2 [48]. For each economic activity, the degree of the expected disturbance on the surrounding environment was attributed (low, moderate, and high disturbance) [12]. A normalized value was attributed to the disturbance classes, depending on the impact on the river’s water quality that leads to an increased need for monitoring. Finally, for each municipality of the Drin watershed, a normalized value was attributed on the basis of the number of economic-industrial and other related activities and the expected disturbances they impose on surface water.
Based on the statistical inventories, the total number of the active business entities in Drin River Basin for the year 2018 (expect for Montenegro—2011, and Greece—2017) were 128,743. Only 772 business entities (0.6%) may impose high disturbance to the environment and 41,670 (32%) moderate disturbance (Figure 4a). The higher density of the number of businesses was noted in the highly populated municipalities and at areas where mining and quarrying activities are located (Figure 4b).
2.3.3. Hydrogeological Structure
Surface water and groundwater interact in a complex and direct or indirect manner and can be viewed as linked components [49]. Therefore, surface water quality is affected by groundwater quality. The latter, except for human-induced changes, depends on the hydrogeological characteristics of the aquifers and the chemical propertied of the overlying soil. The water, while infiltrating through soil and the underlying geological formations, is naturally purified; during this process, clay, silts, and sand may adsorb chemical contaminants, and filter harmful bacteria and other small particles from water, while bacteria decompose dissolved organic matter or agricultural and industrial chemicals [50]. Notwithstanding, karst systems are fragile environments and vulnerable to pollution, due to the rapid transmission of surface pollutants through the usually vast and large karst network and the usually small thickness of the overlying soil [51].
Drin watershed is located in the Dinaric Karst Aquifer System that forms one of the world’s largest karst aquifer systems [52] and consists of an extremely heterogeneous medium [53]. The karst aquifer is developed within over 1000 m thick calcareous formations (limestones and dolomites), which are highly karstified. Karst landscape and underground drainage systems are well-developed, allowing the intensive groundwater circulation [52]. Based on the hydrogeological map of the Drin watershed [52], 39% of the total area is covered by karst formations and 23% by porous formations (Figure 5a).
In this specific study, the classification of the hydrogeological formations was based on their vulnerability to pollution, with karst formations being the most vulnerable and impervious being the least vulnerable. Finally, a normalized value was attributed to the hydrogeological formations, depending on the pollution risk they impose on the river’s water quality.
2.3.4. Domestic Wastewater
The disposal of domestic wastewater can impose an additional pressure on rivers. Urban wastewater treatment plants (UWWTPs) do not always manage to remove all contaminants from the water successfully [54], while the effluent quality depends on the composition of the initial, untreated wastewater and whether all the stages of the treatment have been completed successfully [55]. Based on a study conducted by Regional Capacity Development Network for Water and Sanitation Services (RCDN), a project about the water utilized in the Western Balkans managed by the German Agency for International Cooperation (GIZ), the operational UWWTPs by the end of 2019 in Albania were 10, in Kosovo 6, in Montenegro 12, and in North Macedonia 19 [56]. Of these UWWTPs, 12 are located in the Drin River Basin (4, 3, 3, and 2, constructed in Albania, Kosovo, Montenegro, and North Macedonia, respectively). In Greece, of the total 960 UWWTPs operating currently [57], none is located in the Drin river basin. Most UWWTPs provide secondary wastewater treatment and only two provide tertiary treatment (Velipoje in Albania and Nikšić in Montenegro; 165,000 PE), while Virpazar UWWTP is dysfunctional. The total physical capacity (population equivalent (PE)) of the operating UWWTPs in the Drin River Basin is about 530,000 PE [56]. The total population connected to these UWWTP ranges concerning the municipality and is estimated to be about 390,000. It can be assumed that the rest of the population uses septic tanks and pits.
In order to quantify the impact of domestic wastewater on Drin water resource quality, the population distribution GEOSTAT 2011 grid dataset [58] was used. Additionally, the local seasonal population increase, due to tourist arrivals, was taken into consideration in the analysis. In order to quantify the impact of tourism on domestic water use in the Drin basin, the nights spent by tourists per municipality was retrieved form the corresponding statistical authority of each country. A weighting factor expressing the average annual population increase per administrative division, due to tourists, was calculated for the period 2012–2016. Then, the population distribution of the population (GEOSTAT) was multiplied by the weighting factor so as to estimate the actual population distribution in the Drin basin. The population distribution was classified on the basis of the Degree of Urbanization as: (1) urban center (or a high-density cluster) consists of contiguous grid cells with a density of at least 1500 inhabitants per km2, (2) urban cluster (or moderate density clusters) consists of contiguous grid cells with a density of at least 300 inhabitants per km2, and (3) rural grid cells (mostly low density cells) are cells that do not belong to an urban cluster (density below 300 inhabitants per km2) [59].
Based on the results, the population in the Drin River Basin is 1,712,489, which increases to 1,766,308, due to tourism (Figure 5b).
2.3.5. Protected Areas
Monitoring areas designated by law for preservation and protection is essential, so as to assess their ecological condition in time and to directly proceed to crucial interventions and management actions when necessary [60]. The legislation concerning the protected areas includes Law 81/2017 on Protected Areas in Albania [61], Law No 03/L-233 on Nature Protection in Kosovo [62], the Law on Nature Protection 54/2016 in Montenegro [63], Law 67/04 on Nature Protection in North Macedonia [64], and the Legislative Decree 86/1969 on Forest Law [65], Law 1650/1986 on Environment Protection [66], and the Decision 50743/2017 concerning the revised list of the national list of the European Ecological Network NATURA 2000 in Greece [67].
In the present effort, the European inventory of Nationally Designated Areas CDDA that holds information about protected areas was used [68]. Additionally, environmental (NATURA 2000 [69], Biogenetic Reserves [70]) or international (UNESCO-World Heritage List [71], UNESCO-Biosphere reserves [72], Ramsar Convention [73]) protection networks were included in the analysis. It should be noted that in some cases, areas from different environmental protection networks overlap (Figure 6a). A uniform value regarding the increased need for monitoring was attributed to all protected areas at the Drin River Basin.
2.3.6. Hydropower Projects in Rivers
Hydraulic structures (dams, small and large hydropower plants-HPP, weirs, sluices, spillways, etc.) alter the hydrological regime of the rivers and may affect the downstream rivers’ characteristics [74] and eventually the water quality [75] and the recharging of groundwater bodies [52]. More specifically, flow alteration of regulated rivers may lead to changes in downstream river water temperature [76], affect the BOD (biochemical oxygen demand) [77], the nutrient concentrations [78,79], and the water self-purification capacity [80].
The hydraulic structures database of the current study includes the hydropower projects constructed in the study area and was compiled on the basis of information derived from the following sources: the inventory of hydropower in Europe conducted by EuroNatur, Riverwatch, WWF, and GEOTA [81], the inventory of hydropower pants conducted under the project “Regional Strategy for Sustainable Hydropower in the Western Balkans” [82], the JRC Hydro-power database [83], DIKTAS Project [52], and other sources [84,85,86,87]. The HPPs reported in the present effort were classified as follows: storage or reservoir HPPs (that include dams and a reservoirs), run-of-river (RoR) HPPs (where energy is generated from the available flow of the river), and pumped storage HPPs (where water is pumped from a lower reservoir into an upper reservoir when electricity generation exceeds demand and is released back when needed). All vary from the very small to the very large scale, depending on the hydrology and topography of the watershed [88,89]. Additionally, HPPs were classified on the basis of their installed capacity. Although the definition of small HPPs varies widely among the countries, in this effort, the limit between small and large HPPs was considered to be the conservative 10 MW [81,90]. It should be noted that only verified HPPs were included in the present analysis.
On the basis of the inventory, 102 HPPs have been constructed in the Drin River Basin, 20% of which can be characterized as large. Additionally, 18% of the HPPs were classified as storage, and 28% as RoR, while for 54% of the HPPs, information regarding their operation was missing. It should be noted that in some cases information was not possible to be retrieved regarding the type of HPP, while no pumped storage HPPs was possible to be identified in the Drin River Basin (Figure 6b).
The classification and the standardized value attributed to the hydropower projects in rivers was based on the pressures they pose to surface water quality, with large storage structures imposing the greatest pressure and small RoR posing the least.
2.4. Designation of High Priority Areas for Water Quality Monitoring-Validation
The suitability model resulted in the production of a map where the high priority areas for water quality monitoring of rivers were highlighted. In order to identify the sub-basins of the Drin watershed with increased need for water quality monitoring, a score Sc was attributed to each one on the basis of the total summation Σ(S) of the multicriteria analysis and divided by the area A of the sub-basin:
Sc = Σ(S)/A,
The spatial dataset used for the analysis was the HydroBASINS Version 1.c level 12, a global watershed boundary and sub-basin delineation derived from HydroSHEDS (Hydrological data and maps SHuttle Elevation Derivatives at multiple Scales) data at 15 s resolution [91]. Each sub-basin was classified into five classes (very high, high, moderate, low, and very low) using the Natural Breaks (Jenks) classification technique. The final output was the suitability map with the sub-basins of the Drin River Basin classified into five classes (very high, high, moderate, low, and very low), describing the areas where river monitoring is required.
In order to investigate the reliability of the methodological approach, the output map was contrasted with the current surface water quality status in the Drin River Basin. More specifically, annual, long-term, in situ measurements from the existing monitoring networks of rivers in the Drin watershed were employed, and the water status was estimated. In this specific study, the Waterbase v2019.1 dataset that contains surface water quality data of EU member countries (Greece) and cooperating countries (Albania, North Macedonia, and Kosovo; but not Montenegro), in the scope of the current WISE SoE—Water Quality (WISE-4/WISE-6) reporting obligations, was employed [92]. Additionally, in order to compile the most complete, long-term, and recent (last decade) timeseries of physicochemical parameters of the rivers, water quality measurements were also retrieved from the corresponding environmental agencies or statistical authority of the countries (Institute of Statistics of the Republic of Albania [93], National Hydrometeorological Service of North Macedonia [94], Institute of Hydrometeorology and Seismology of Montenegro [95], Hellenic Centre for Marine Research, Institute of Marine Biological Resources, and Inland Waters for Greece [96]).
Each country involved uses a different classification system for estimating the water quality status of rivers. In this effort, the classification scheme used by the National Environmental Agency of Albania [97] was employed for the entire dataset. This system uses the basic physicochemical parameters of surface water (dissolved oxygen, BOD5, pH, NH4, NO3, NO2, PO4, and Total P concentrations) and is based on the recommendations of the United Nations Economic Commission for Europe (UNECE) (Table 3; see also Appendix A.1.) [98]. Therefore, for each monitoring station, the water quality status was estimated on the basis of the in situ measurements conducted during the last decade and, after averaging the individual status estimated, were based on each physicochemical parameter. Overall, data from 42 monitoring stations were used in the present analysis, with measurements varying between 4 to 10 years.
Finally, the water quality score of each monitoring station was contrasted against the ranked score of the suitability map produced. The criteria used to investigate the reliability was the correlation coefficient R.
3. Results
3.1. Suitability Modeling
The six (6) criteria used to identify the increased need for water quality monitoring of river waterbodies in the Drin watershed have been ranked in Table 4 and led to the production of the maps in Figure 7. Based on the results, the most important factors increasing the need for water quality monitoring is the existence of large HPPs, the economic activities with high disturbance on the surrounding environment, and the agricultural activities with high environmental risk potential.
The pairwise criteria comparison based on the AHP approach resulted in the preference matrix with assigned preference values and calculated weights (Table 5) and to a consistency ratio CR of 0.019. This value is smaller than 0.10 and meets the criteria set by Saaty [31]. Based on Table 5, the most important factor affecting the rivers’ water quality in the Drin River Basin is agricultural activities, followed by domestic wastewater and economic activities. Factors, such as protected areas and hydrogeological structure, do not necessarily imply degraded water quality, but increase the vulnerability of surface water bodies, and therefore they were ranked lower. After performing a weighted summation of the criteria maps and normalization based on the sub-basins cover area, the final map of the high priority sub-basins of the Drin watershed for the water quality monitoring of rivers was produced (Figure 8a,b).
On the basis of the results, the high priority areas for river water quality monitoring are in the highly populated plains of Kosovo, where additionally increased agricultural and economic or other related activities were observed. A moderate to high need for water quality monitoring was noted in areas where the majority of hydropower projects of high installment capacity have been constructed, mainly at the northwestern part of Albania, where also settlements are located. Higher needs for river water quality monitoring are expected in areas structured by calcareous formations (e.g., north Albania, where also increased economic activities have been reported, and north and northwestern Montenegro, where significantly populated areas are located) or in areas included in environmental protection networks (e.g., in the Greek part of the Drin River Basin, or the northwestern area of the North Macedonian part of the Drin River Basin).
Areas of moderate or low priority for water quality monitoring are mostly areas with hydrogeological formations of low pollution vulnerability, moderate to low agricultural and economic activities, and lack of protection schemes (Figure 7 and Figure 8). Thus, the central and western part of Albania belong to this category as well as most of the southern part of North Macedonia. The main tributaries of the Drin River which are expected to contribute significantly with respect to the hydrological regime of the river but also to its pollution loads, are covered by the high priority areas for water quality monitoring (Figure 8a,b).
3.2. Validation of the Methodological Approach
Regarding the reliability of the methodological approach, the correlation coefficient between the water quality status score of the existing monitoring network in the Drin River Basin and the corresponding sub-basin suitability score, was acceptable (R = 0.454, p-value = 0.002547, statistically significant at 0.01 level; Figure 8c). It should be noted that a high suitability score does not necessarily imply water quality degradation, since an increased need for water monitoring is perceived as a precautionary measurement in areas of high vulnerability (e.g., areas possibly exposed to pollution, due to the geological structure-karst areas) or of high importance (e.g., legislatively protected areas of high environmental value). This is the case especially in the southeastern part or at the northern part of the Drin River Basin, where the Ohrid and Prespa lakes and the Albanian Alps are located, which are included in many environmental protection networks. Likewise, the Drin River Basin is structured to a great extent by calcareous formations, especially in the central part of Montenegro, the northern and southeast part of Albania, the southwest part of North Macedonia and the Greek part of the watershed. Significant parts of these areas do not have very important pollution sources, but still, the need for monitoring can be relatively high to the increased natural vulnerability.
Possible discrepancies between the river quality status score and the corresponding sub-basin suitability score can also be attributed to the lack of detailed and accurate primary information used in the present analysis. The water quality classification system used in this effort is also something that needs further examination and intercalibration at an EU level, due to the quite homogeneous quality status that is produced in most of the monitoring stations. Another limitation arises, due the lack of information regarding possible sources of pollution that lead to the degradation of surface water resources and which was not possible to be included in the present analysis. For example, details about the agricultural practices regarding fertilizer use, illegal waste disposal, and water abstractions are still unknown.
Finally, in the present study, an important issue arose, due to the inconsistency of the input data and the different methodological approaches of the information collection of each country. This was evident especially in the case of the economic activities, and the hydropower projects inventories compilation, where the structure and information of the databases of each country involved varied considerably. These obstacles affect negatively also the transboundary basin water management potential and thus need to be resolved to achieve the target of the EU Water Framework Directive (WFD) and UN SDG 6 for good water quality. The proposed monitoring prioritization is a step towards the necessary harmonization of methods and decision-making regarding the Drin River Basin management.
4. Discussion
The 2030 Agenda for Sustainable Development, aiming to achieve a better and more sustainable future for all people, focused on all aspects and dimensions of sustainable development: economic, social, and environmental [1]. Among the SDGs related to environmental protection, Goal 6.6 aims to protect and restore water-related ecosystems, including rivers, and to monitor progress, while the sub-indicators of 6.6.1 dictate the need for water quality monitoring of rivers [5]. Although in most developed countries water quality monitoring programs are implemented under national and regional reporting requirements, in case of transboundary river basins, cooperation over natural water resources, as noted under Goal 6.5 regarding the implementation of integrated water resources management, can be even more challenging [4].
A strong tool commonly used in creating, managing, analyzing, modeling, and sharing SDGs data is geospatial information technologies [8]. In the present study, in order to address the need for the implementation of successful water quality monitoring programs of transboundary river waterbodies, so as to meet the relevant International legislation goals (EU WFD, SDG 6.3 and SDG 6.5), geospatial techniques were applied. More specifically, the designation of high priority areas for monitoring of Drin transboundary river basin was performed using a suitability model, a GIS-based multicriteria decision analysis (GIS-MCDA) approach coupled with AHP, that has already been successfully applied on national level [12]. The framework proposed aspires to contribute to the risk assessment techniques commonly used to address multi-objective problems, and therefor comprise a valuable decision support tool [99].
Based on the results, the methodological approach used in the present study managed to sufficiently highlight the high priorities areas for water quality monitoring in the Drin River Basin. Areas with intensive agriculture and economic activities and high groundwater vulnerability were classified as high priority for monitoring, while areas with moderate anthropogenic activities and low natural vulnerability to pollution were characterized as moderate to low monitoring priority. Ecologically important areas that belong to protection networks and undergo significant pollution pressures were also classified as high monitoring priority. The comparison of the prioritization map with official water quality status classification outputs from monitoring activities in key points of the hydrographic network, indicated good agreement with only few exceptions. Nevertheless, some limitations arise in the present effort, mainly due to the lack of detailed information or insufficient input data available. Additionally, in the methodology applied, it was not possible to incorporate all factors forming the water quality status of surface water, such as the agricultural practices regarding the exact fertilizers use, illegal waste disposal, and water abstractions, that are unknown.
Finally, the most important limitation of the present methodology was the inconsistency among the input data and the different methodological approaches regarding the information collection of each country, since Albania, Montenegro, and North Macedonia as EU candidate countries and Kosovo as a potential candidate follow different protocols, since their national and EU legislations are not fully aligned. This is one of the major restrictions during integrated water resource management at a transboundary level that foregrounds the need for cooperation between the countries involved. In the Drin River Basin, efforts have been made regarding this aspect. A first attempt towards an enhanced cooperation among the Riparians for the management of the Drin River Basin was in 2006, during the International Roundtable on Integrated Management of Shared Lake Basins in South-Eastern Europe held in Ohrid and organized under the Petersberg Phase II/Athens Declaration Process and the Global Environment Facility (GEF) IW:LEARN Programme.
In 2011, a Memorandum of Understanding (MoU) based on Shared Vision for the sustainable management of the Drin Basin was signed by the Ministers of the Water and Environment of the Drin Riparians in Tirana, as an outcome of the Drin Dialogue coordinated by the Global Water Partnership Mediterranean (GWP-Med) and UNECE. For the implementation of the Drin MoU, a Drin Coordinated Action (Drin CORDA) process was initiated, which is still ongoing and supported amongst others by the Global Environment Facility (GEF) [13]. This effort can assist towards designing and implementing a common transboundary monitoring network in the Drin River Basin which will enhance the cooperation between the riparian countries and will facilitate the most important step towards the integrated river basin management, which is the homogenization and exchange of water-related data.
Author Contributions
Conceptualization, E.D. and M.B.; methodology, A.M.; validation, A.M., E.D., and M.B.; writing—original draft preparation, A.M.; writing—review and editing, E.D. and M.B.; All authors have read and agreed to the published version of the manuscript.
Funding
This research received no external funding.
Institutional Review Board Statement
Not Applicable.
Informed Consent Statement
Not Applicable.
Acknowledgments
Many of the reports and the data used in this study were supported by various Global Environment Facility (GEF) fundings.
Conflicts of Interest
The authors declare no conflict of interest.
Appendix A
Appendix A.1. Albania
Surface water management, protection, and monitoring in Albania is mainly controlled by the following legislation: Law 10431/2011 on the Protection of the Environment [100] that is fully aligned with Directive 2004/35/CE on environmental liability with regard to the prevention and remedying of environmental damage [101], Law No. 111/2012 on Integrated Water Resources Management [102] that is fully aligned with 2000/60/EC WFD [6], the Decision No. 246/2014 on the Determination of the Environmental Quality Standards for Surface Water [103] that incorporates Directive 2008/105/EC on environmental quality standards [104] and the Decision 742/2015 on the Operation and Management of the pollutant release and transfer register [105] that partially incorporates Regulation (EC) No 166/2006 [106]. The monitoring of surface water is performed by National Environmental Agency of Albania (Agjencia Kombetare e Mjedisit (AKM)) that operates under the Ministry of Tourism and Environment of Albania (Ministria e Turizmit dhe Mjedisit). The national river network of the country is constantly increasing and the EU Water Framework Directive (WFD) priority substances and biological quality elements (benthic invertebrate fauna, phytoplankton, phytobenthos, macrophytes, and fish) are gradually being monitored since 2016 [107,108].
The water quality of surface water of Albania is determined on the basis of physicochemical parameters (dissolved oxygen, BOD5, pH, NH4, NO3, NO2, PO4, and Total P concentrations) by comparing them with the permitted standards set out in the EU Water Framework Directive. The classification of the river’s water quality in Albania is distinguished into five classes, labelled from “high” to “bad”, but is not yet designed fully in accordance with the requirements of the WFD [98,107]. The classification of Albania’s rivers is achieved on the basis of Decision No.115/15.2.2012 that provides the comparative standards [97] according to recommendations of the United Nations Economic Commission for Europe (UNECE) [98]. Of the total 34 sites of the national river monitoring network in Albania, for which physicochemical data are available from the Institute of Statistics of Albania—INSTAT and the National Environmental Agency of Albania [93], five are located in the Drin River Basin.
Appendix A.2. Kosovo
Surface water monitoring in Kosovo is conducted by the Hydrometeorology Institute of Kosovo (Institutit Hidrometeorologjik të Kosovës- IHMK), which is part of the Kosovo Environmental Protection Agency-KEPA (Agjencia e Kosovës për Mbrojtjen e Mjedisit-AKMM) of the Ministry of Environment and Spatial Planning of Kosovo (Ministrisë së Mjedisit dhe Planifikim Hapësinor). The most important legislation of Kosovo related to river water quality regulation, monitoring, and classification is the following: Law No 04/L-147/2013 on Waters of Kosovo [109] that partially incorporates 2000/60/EC WFD [6], and the Administrative Instruction MESP-No. 16/2017 on Classification of Surface water bodies [110]. The latter partially incorporates the 2000/60/EC WFD and defines the classification system of surface waterbodies water quality on the basis of physicochemical and biological elements, but has not been implemented yet. Although some progress has been noted regarding aligning water legislation with the acquis and through the adoption of the Kosovo 2017–2036 national water strategy [111,112], efforts are required to ensure that the river basin authority is operational and prepares the management plans [113].
The quality of the rivers of Kosovo is determined on the basis of physical, chemical, and heavy metal analyses. The current monitoring network has a total of 19 sampling sites in the Drin watershed.
Appendix A.3. Montenegro
Water quality in Montenegro is governed by an extensive legal framework. The key legislation is the 2007 Law on Water [114], amended in 2018 for the transposition of Directive 2000/60/EC (WFD) and other water directives [115]. Surface water monitoring in Montenegro is performed by the Water Quality Department (Odsjek za kvalitet voda) of the Institute of Hydrometeorology and Seismology of Montenegro (Zavod za hidrometeorologiju i seizmologiju-ZHMS), while reporting is also conducted by the Environment Protection Agency of Montenegro—EPA Montenegro (Agencija za zaštitu životne sredine). The classification of surface water quality is regulated by the Water Law 84/2018 [115] and the Regulation on the national list of environmental indicators 19/2013 [116], while the alignment with EU regulation and water quality standards is to be developed [117]. EPA has developed the Water Quality Index (WQI) on the basis of the Water Quality Index method [118], according to which ten parameters of physicochemical and microbiological quality (water temperature, pH, electrical conductivity, oxygen saturation, suspended matters, BOD5, ammonia-nitrogen content N-NH4, oxide-nitrogen content NO2 + NO3, ortho-phosphorus, and total number of fecal bacteria) are aggregated into a single surface water quality indicator. For each of these parameters a quality value qi and a weight value wi are attributed, depending on the relative significance on the overall water quality assessment [119]. Finally, the overall WQI is calculated as the sum of qi x wi, while classification criteria of the descriptive quality indicator are assigned as: WQI = 0–38 very poor, WQI = 39–71 poor, WQI = 72–83 good, WQI = 84–89 very good, WQI = 90–100 excellent (Regulation on the national list of environmental indicators 19/2013) [116,120]. In the Drin River Basin, 14 sampling surface water sites are located.
Appendix A.4. North Macedonia
The most important legislation concerning surface water of North Macedonia is Law on Water 87/08 that regulates issues related to surface waters, including water use, protection against harmful activities, water facilities and services, protection of the waters from drainage and pollution, management issues, manner of financing of the water-economy activities, and other issues of importance [121]. Based on the national legislation concerning the procedures of observation and measurement of the qualitative characteristics of the waters in the network of the hydrological stations, the following indicators are being monitored: organoleptic, acidity-alkalinity, oxygen concentration, mineralization indicators, eutrophication/biological indicators, indicators of microbiological pollution, radioactivity, content of harmful and dangerous substances, the ecological condition of the rivers, and the ecological potential of the lakes [122]. The incorporation of 2000/60/EC WFD [6] is being accomplished with the Regulation for the Classification of Surface Waters 33/16 [123], that replaced the Regulation for Water Classification 18/99 [124], and defines the assessment of the ecological status of rivers in North Macedonia. The ecological status of rivers is classified according to the four main groups of quality elements: biological, hydromorphological (hydrological regime, morphological conditions), and chemical and physico-chemical elements that are used to support biological elements. Surface waters are classified into four classes (high/good, good/moderate, moderate/insufficient, and insufficient/bad) regarding their ecological status [123].
The water quality of surface water in North Macedonia is being monitored by the National Hydrometeorological Service (NHMS) of North Macedonia (Управата за хидрометеоролошки рабoти-УХМР) through the RIMSYS program (River Monitoring System), and the collected data is processed by the Ministry of Environment and Physical Planning. It should be noted that surface the water monitoring program implemented by NHMS does not fully meet the requirements of the national water-related legislation and 2000/60/EC WFD [125]. Of the total 20 sampling points of the surface water monitoring network of North Macedonia (River Monitoring System Project in Macedonia-RIMSYS), two are located in the Drin watershed.
Appendix A.5. Greece
In Greece, river water quality monitoring is performed by the Hellenic Centre for Marine Research, Institute of Marine Biological Resources, and Inland Waters (HCMR-IMBRIW) under the supervision of the Special Secretariat for Water of Ministry of Environment and Energy of Greece [126], in compliance to 2000/60/EC WFD [6] that has been incorporated in the national legislation by Law No.3199/2003 regarding the protection and management of waters [127]. The quality status of Greek rivers is estimated on the basis of the Nutrient Classification System (NCS) [128], modified to also include dissolved oxygen concentrations [129] averaging each status. Currently, the river water quality national monitoring network comprises 490 sites, one of which is located in the Greek part of the Drin River Basin.
References
- United Nations. United Nations General Assembly Resolution A/RES/70/1. Transforming Our World: The 2030 Agenda for Sustainable Development; United Nations: New York, NY, USA, 2015; pp. 1–35. [Google Scholar]
- United Nations. United Nations General Assembly Resolution A/RES/71/313. Work of the Statistical Commission pertaining to the 2030 Agenda for Sustainable Development; United Nations: New York, NY, USA, 2017; 25p. [Google Scholar]
- Hickel, J. The contradiction of the sustainable development goals: Growth versus ecology on a finite planet. Sustain. Dev. 2019, 27, 873–884. [Google Scholar] [CrossRef]
- United Nations. Sustainable Development Goal 6. Synthesis Report 2018 on Water and Sanitation; United Nations: New York, NY, USA, 2018; ISBN 978-92-1-101370-2. [Google Scholar]
- United Nations. Progress on Water-Related Ecosystems. Piloting the Monitoring Methodology and Initial Findings for SDG Indicator 6.6.1; UN Environment: Nairobi, Kenya, 2018; ISBN 9789280737127. [Google Scholar]
- European Commission. European Commission Council Directive 2000/60/EC of the European Parliament and of the Council of 23 October 2000 Establishing a Framework for Community Action in the Field of Water Policy. Off. J. Eur. Commun. 2000, L327, 1–72. [Google Scholar]
- United Nations. Convention on the Protection and Use of Transboundary Watercourses and International Lakes as Amended, Along with Decision VI/3 Clarifying the Accession Procedure; United Nations: Geneva, Switzerland, 2013. [Google Scholar]
- Scott, G.; Rajabifard, A. Sustainable development and geospatial information: A strategic framework for integrating a global policy agenda into national geospatial capabilities. Geo-Spat. Inf. Sci. 2017, 20, 59–76. [Google Scholar] [CrossRef] [Green Version]
- United Nations. The Future We Want Outcome Document of the United Nations Conference on Sustainable Development RIO +20; United Nations: New York, NY, USA, 2012; 72p. [Google Scholar]
- United Nations. Global Geospatial Information Management Monitoring Sustainable Development: Contribution of Geospatial Information to the Rio + 20 Processes. Background Document Prepared by the Secretariat. In Proceedings of the Rio+20 –United Nations Conference on Sustainable Development, New York, NY, USA, 13–15 August 2012. 5p. [Google Scholar]
- Jothimani, M.; Dawit, Z.; Mulualem, W. Flood Susceptibility Modeling of Megech River Catchment, Lake Tana Basin, North Western Ethiopia, Using Morphometric Analysis. Earth Syst. Environ. 2020. [Google Scholar] [CrossRef]
- Mentzafou, A.; Panagopoulos, Y.; Dimitriou, E. Designing the national network for automatic monitoring of water quality parameters in Greece. Water 2019, 11, 1310. [Google Scholar] [CrossRef] [Green Version]
- Scoullos, M. Transboundary IWRM Attempts in the Mediterranean Emphasis on the Drin River Case and the Involvement of Stakeholders. In Integrated Water Resources Management in the Mediterranean Region: Dialogue Towards New Strategy; Choukr-Allah, R., Ragab, R., Rodriguez-Clemente, R., Eds.; Springer: Dordrecht, The Netherlands, 2012; pp. 3–23. [Google Scholar]
- United Nations Economic Commission for Europe (UNECE). Second Assessment of Transboundary Rivers, Lakes and Groundwaters; United Nations: New York, NY, USA; Geneva, Switzerland, 2011; ISBN 9789211170528. [Google Scholar]
- De Strasser, L.; Stec, S. Transboundary Diagnostic Analysis. Thematic Report on the Resource Nexus (Phase I of the Water-Food-Energy-Ecosystems Nexus Assessment of the Drin Basin). GEF Project “Enabling Transboundary Cooperation and Integrated Water Resources Management in the Ext; GWP-Mediterranean (GWP-Med): Athens, Greece; United Nations Economic Commission for Europe (UNECE): Geneva, Switzerland, 2020. [Google Scholar]
- Abazaj, F. A Geospatial Analysis of the Existing Flood Situation in the Buna River Basin. In Proceedings of the 8th Annual International Conference on Civil Engineering, Infrastructure and Environment, 26–28 October 2019; Hajrizi, E., Ed.; University for Business and Technology in Kosovo (UBT): Pristina, Serbia, 2019; pp. 44–57. [Google Scholar]
- Skoulikidis, N.; Economou, A.; Gritzalis, K.; Zogaris, S. Rivers of the Balkans. In Rivers of Europe; Tockner, K., Uehlinger, U., Robinson, C.T., Eds.; Academic Press: London, UK, 2009; ISBN 9780123694492. [Google Scholar]
- Malczewski, J. GIS-based multicriteria decision analysis: A survey of the literature. Int. J. Geogr. Inf. Sci. 2006, 20, 703–726. [Google Scholar] [CrossRef]
- Eastman, J. Multi-criteria evaluation and GIS. In Geographical Information Systems: Principles, Techniques, Management and Applications; Longley, P.A., Goodchild, M.F., Maguire, D.J., Rhind, D.W., Eds.; Wiley: New York, NY, USA, 2005; pp. 493–502. ISBN 978-0-471-73545-8. [Google Scholar]
- Malczewski, J.; Rinner, C. Introduction to GIS-MCDA. In Multicriteria Decision Analysis in Geographic Information Science. Advances in Geographic Information Science; Malczewski, J., Rinner, C., Eds.; Springer: Berlin/Heidelberg, Germany, 2015; pp. 23–54. ISBN 978-3-540-74756-7. [Google Scholar]
- Zarghami, M.; Szidarovszky, F. Multicriteria Analysis: Applications to Water and Environment Management; Springer: Berlin/Heidelberg, Germany, 2011. [Google Scholar]
- Malczewski, J. GIS and Multicriteria Decision Analysis; John Wiley & Sons, Inc.: New York, NY, USA, 1999; ISBN 978-0-471-32944-2. [Google Scholar]
- Greene, R.; Devillers, R.; Luther, J.E.; Eddy, B.G. GIS-Based Multiple-Criteria Decision Analysis. Geogr. Compass 2011, 5, 412–432. [Google Scholar] [CrossRef]
- Domazetovic, F.; Siljeg, A.; Loncar, N.; Maric, I. GIS automated multicriteria analysis (GAMA) method for susceptibility modelling. MethodsX 2019, 6, 2553–2561. [Google Scholar] [CrossRef]
- Voogd, J.H. Multicriteria Evaluation for Urban and Regional Planning; Delftsche Uitgevers Maatschappij: Delft, The Netherlands, 1982; ISBN 978-0850861068. [Google Scholar]
- Drobne, S.; Lisec, A. Multi-attribute Decision Analysis in GIS: Weighted Linear Combination and Ordered Weighted Averaging. Informatica 2009, 33, 459–474. [Google Scholar] [CrossRef]
- Malczewski, J. Local Weighted Linear Combination. Trans. GIS 2011, 15, 439–455. [Google Scholar] [CrossRef]
- Malczewski, J. On the use of weighted linear combination method in GIS: Common and best practice approaches. Trans. GIS 2000, 4, 5–22. [Google Scholar] [CrossRef]
- Saaty, T.L. A scaling method for priorities in hierarchical structures. J. Math. Psychol. 1977, 15, 234–281. [Google Scholar] [CrossRef]
- Saaty, T.L. Decision making with the analytic hierarchy process. Int. J. Serv. Sci. 2008, 1, 83–98. [Google Scholar] [CrossRef] [Green Version]
- Saaty, T.L.; Vargas, L.G. Models, Methods, Concepts and Applications of the Analytic Hierarchy Process; Kluwer Academic Publishers: Boston, MA, USA, 2001. [Google Scholar]
- Xu, L.; Zhang, Y. A Credit Rating Model for Online P2P Lending Based on Analytic Hierarchy Process. In Proceedings of the Tenth International Conference on Management Science and Engineering Management. Advances in Intelligent Systems and Computing; Xu, J., Hajiyev, A., Nickel, S., Gen, M., Eds.; Springer: Singapore, 2017; Volume 502, ISBN 978-981-10-1836-7. [Google Scholar]
- Gao, L.; Hailu, A. Identifying preferred management options: An integrated agent-based recreational fishing simulation model with an AHP-TOPSIS evaluation method. Ecol. Modell. 2013, 249, 75–83. [Google Scholar] [CrossRef]
- Liu, R.; Chen, Y.; Wu, J.; Gao, L.; Barrett, D.; Xu, T.; Li, L.; Huang, C.; Yu, J. Assessing spatial likelihood of flooding hazard using naïve Bayes and GIS: A case study in Bowen Basin, Australia. Stoch. Environ. Res. Risk Assess. 2016, 30, 1575–1590. [Google Scholar] [CrossRef]
- Liu, R.; Chen, Y.; Wu, J.; Gao, L.; Barrett, D.; Xu, T.; Li, X.; Li, L.; Huang, C.; Yu, J. Integrating Entropy-Based Naïve Bayes and GIS for Spatial Evaluation of Flood Hazard. Risk Anal. 2017, 37, 756–773. [Google Scholar] [CrossRef]
- Saaty, T.L. On the Measurement of Intangibles. A Principal Eigenvector Approach to Relative Measurement Derived from Paired Comparisons. Not. Am. Math. Soc. 2013, 60, 192–208. [Google Scholar] [CrossRef]
- Kułakowski, K. Notes on order preservation and consistency in AHP. Eur. J. Oper. Res. 2015, 245, 333–337. [Google Scholar] [CrossRef] [Green Version]
- Meybeck, M.; Friedrich, G.; Thomas, R.; Chapman, D. Rivers. In Water Quality Assessments—A Guide to Use of Biota, Sediments and Water in Environmental Monitoring; Chapman, D., Ed.; UNESCO: New York, NY, USA; WHO: Geneva, Switzerland; UNEP: Nairobi, Kenya, 1996; ISBN 0 419 21590 5 (HB) 0 419 21600 6 (PB). [Google Scholar]
- Junk, W.J.; Bayley, P.B.; Sparks, R.E. The flood pulse concept in river-floodplain systems. In Proceedings of the International Large River Symposium (LARS), Honey Harbour, ON, Canada, 14–21 September 1986; Volume 106, pp. 110–127, ISBN 0-660-13259-1. [Google Scholar]
- European Union. Copernicus Land Monitoring Service CLC2018 v20b2; European Environment Agency (EEA): Copenhagen, Denmark, 2019. [Google Scholar]
- Dimitriou, E.; Mentzafou, A. Assessing the impacts of climate and land use changes on the water quality of a transboundary Balkan river. Water Air Soil Pollut. 2016, 227, 209. [Google Scholar] [CrossRef]
- Milliman, J.D.; Farnsworth, K.L. Human activities and their impacts. In River Discharge to the Coastal Ocean: A Global Synthesis; Milliman, J.D., Farnsworth, K.L., Eds.; Cambridge University Press: Cambridge, UK, 2011; pp. 115–164. ISBN 9780521879873. [Google Scholar]
- Institute of Statistics (INSTAT) of the Republic of Albania Statistical Business Registry. Active Enterprises by Municipality, Economic Activity, Type and Year. 2018. Available online: http://databaza.instat.gov.al/pxweb/en/DST/START__BR__BR4/NewBR0011/?rxid=52df4c69-05ef-46c7-a1bd-db9c1b869098 (accessed on 12 October 2020).
- Hellenic Statistical Authority Statistical Business Registry. Number of legal Units, Turnover and Total Employment Per One-Digit Branch of Economic Activity, Region and Regional Unit. 2017. Available online: https://www.statistics.gr/en/statistics/-/publication/SBR01/- (accessed on 12 October 2020).
- Business Registration Agency of Kosovo (KBRA)-Ministry of Trade and Industry Statistical Business Registry. 2018. Available online: https://arbk.rks-gov.net/page.aspx?id=2,1 (accessed on 2 October 2020).
- State Statistical Office of the Republic of North Macedonia. Business Entities 2018. In Statistical Yearbook of the Republic of North Macedonia; State Statistical Office of the Republic of North Macedonia: Skopje, North Macedonia, 2019; pp. 545–557. [Google Scholar]
- Statistical Office of Montenegro (MONSTAT). Analysis of Number and Structure of Business Entities in Montenegro by Municipalities; Statistical Office of Montenegro (MONSTAT): Podgorica, Montenegro, 2012. [Google Scholar]
- European Commission. NACE Rev. 2—Statistical Classification of Economic Activites in the European Community; European Commission: Luxembourg, 2008; ISBN 978-92-79-04741-1. [Google Scholar]
- Sophocleous, M. Interactions between groundwater and surface water: The state of the science. Hydrogeol. J. 2002, 10, 52–67. [Google Scholar] [CrossRef]
- Boyd, C.E. Water Quality: An. Introduction, 2nd ed.; Springer International Publishing: Cham, Switzerland, 2015; ISBN 9783319174457. [Google Scholar]
- Ford, D.; Williams, P. Karst Hydrogeology and Geomprphology; John Wiley & Sons Ltd: Chichester, UK, 2007; ISBN 9780470849965. [Google Scholar]
- UNESCO-IHP. Protection and Sustainable Use of the Dinaric Karst Transboundary Aquifer System-DIKTAS. Transboundary Diagnostic Analysis; UNESCO-IHP: Zagreb, Croatia, 2013. [Google Scholar]
- Bonacci, O. Karst hydrogeology/hydrology of dinaric chain and isles. Environ. Earth Sci. 2015, 74, 37–55. [Google Scholar] [CrossRef]
- Aristi, I.; von Schiller, D.; Arroita, M.; Barceló, D.; Ponsatí, L.; García-Galán, M.J.; Sabater, S.; Elosegi, A.; Acuña, V. Mixed effects of effluents from a wastewater treatment plant on river ecosystem metabolism: Subsidy or stress? Freshw. Biol. 2015, 60, 1398–1410. [Google Scholar] [CrossRef]
- Qasim, S.R. Wastewater Treatment Plants. Planning, Design, and Operation, Second Edition; CRC Press: New York, NY, USA, 1999. [Google Scholar]
- Regional Capacity Development Network for Water and Sanitation Services (RCDN). Wasterwater Treatment Plants and Projects Database. Available online: https://rcdnsee.net/news/regional-map-of-wastewater-treatment-plants-and-projects/ (accessed on 13 February 2019).
- Ministry of Environment and Energy. Special Secretariat for Water Wastewater Treatment Plants Monitoring Database. Available online: http://astikalimata.ypeka.gr/Default.aspx (accessed on 15 November 2019).
- Eurostat GEOSTAT. 2011. Available online: https://ec.europa.eu/eurostat/web/gisco/geodata/reference-data/population-distribution-demography (accessed on 28 August 2020).
- Statistical Commission. A Recommendation on the Method to Delineate Cities, Urban and Rural Areas for International Statistical Comparisons; Statistical Commission: New York, NY, USA, 2020. [Google Scholar]
- Woodley, S.; Mackinnon, K.; Mccanny, S.; Pither, R.; Prior, K.; Salafsky, N.; Lindenmayer, D. Managing protected areas for biological diversity and ecosystem functions. In Protected Area Governance and Management; Worboys, G.L., Lockwood, M., Kothari, A., Feary, S., Pulsford, I., Eds.; ANU Press: Canberra, Australia, 2015; pp. 651–684. [Google Scholar]
- Parliament of Albania. Law No. 81/2017 on protected areas. Off. J. Repub. Albania 2017, 116, 6067–6093. (In Albanian) [Google Scholar]
- Yaw, D.P. Law No 03/L-233 on Nature Protection. Off. Gaz. Repub. Maced. 2010, 85, 1–62. [Google Scholar]
- Government of Montenegro. Law on Nature Protection. Off. Gaz. Montenegro 2016, 54, 1–47. (In Montenegrin) [Google Scholar]
- Republic of Macedonia. Law on Nature Protection 67/04 (1260). Off. Gaz. Repub. Maced. 2004, 67, 14–96. [Google Scholar]
- Hellenic Republic. Legislative Decree No 86/1969 on Forest Regulation. Off. J. Hell. Repub. 1969, A, 37–84. [Google Scholar]
- Hellenic Republic. Law 1650/1986 on Environment Protection. Off. J. Hell. Repub. 1986, A, 3257–3272. [Google Scholar]
- Hellenic Republic. Revision of the national list of the European Ecological Network NATURA 2000 (Decision 50743). Off. J. Hell. Repub. 2017, B, 58721–58856. [Google Scholar]
- European Environmental Agency-EEA. Nationally Designated Areas (CDDA), Version 18. Available online: https://www.eea.europa.eu/data-and-maps/data/nationally-designated-areas-national-cdda-15 (accessed on 23 November 2020).
- European Environment Agency. The Natura 2000 Protected Areas Network; European Environment Agency: Copenhagen, Denmark, 2018. [Google Scholar]
- Council of Europe. Resolution (76) 17 on the European Network of Biogenic Reserves; Council of Europe: Strasbourg, France, 1976; pp. 1–3. [Google Scholar]
- UNSECO. Convention Concerning the Protection of the World Cultural and Natural Heritage; UNESCO: Paris, France, 1972; ISBN 9781119082491. [Google Scholar]
- UNESCO. Biosphere Reserves: The Seville Strategy and the Statutory Framework of the World Network; UNESCO: Paris, France, 1996. [Google Scholar]
- UNESCO. Convention on Wetlands of International Importance especially as Waterfowl Habitat. Concluded at Ramsar, Iran, on 2 February 1971; Treaty Series; UNESCO: Paris, France, 1976; pp. 245–268. [Google Scholar]
- Ward, J.V.; Stanford, J.A. The serial discontinuity concept of lotic ecosystems. In Dynamics of Lotic Systems; Fontaine, T.D., Bartell, S.M., Eds.; Ann Arbor Science: Ann Arbor, MI, USA, 1983; pp. 29–42. ISBN 9780250406128. [Google Scholar]
- Aristi, I.; Arroita, M.; Larrañaga, A.; Ponsatí, L.; Sabater, S.; von Schiller, D.; Elosegi, A.; Acuña, V. Flow regulation by dams affects ecosystem metabolism in Mediterranean rivers. Freshw. Biol. 2014, 59, 1816–1829. [Google Scholar] [CrossRef]
- Sinokrot, B.A.; Gulliver, J.S. In-stream flow impact on river water temperatures. J. Hydraul. Res. 2000, 38, 339–349. [Google Scholar] [CrossRef]
- Chung, S.W.; Ko, I.H.; Kim, Y.K. Effect of reservoir flushing on downstream river water quality. J. Environ. Manag. 2008, 86, 139–147. [Google Scholar] [CrossRef] [PubMed]
- Ahearn, D.S.; Sheibley, R.W.; Dahlgren, R.A. Effects of river regulation on water quality in the lower Mokelumne River, California. River Res. Appl. 2005, 21, 651–670. [Google Scholar] [CrossRef]
- Avilés, A.; Niell, F.X. The control of a small dam in nutrient inputs to a hypertrophic estuary in a Mediterranean climate. Water. Air. Soil Pollut. 2007, 180, 97–108. [Google Scholar] [CrossRef]
- Wei, G.L.; Yang, Z.F.; Cui, B.S.; Li, B.; Chen, H.; Bai, J.H.; Dong, S.K. Impact of dam construction on water quality and water self-purification capacity of the Lancang River, China. Water Resour. Manag. 2009, 23, 1763–1780. [Google Scholar] [CrossRef]
- Baumüller, A.; Baffert, C.; Freund, C.; Chevalier, A.; Bauer, S.; Egger, G.; Tschavoll, G.; Bösiger, R.; Brändle, J.; Cosmoiu, D.; et al. Hydropower Pressure on European River: The Story in Numbers; FLUVIUS: Vienna, Austria; WWF: Gland, Switzerland; RiverWatch: Vienna, Austria; EuroNatur: Radolfzell, Germany; GEOTA: Lisbon, Portugal, 2019. [Google Scholar]
- Western Balkans Investment Framework-WBIF. Regional Strategy for Sustainable Hydropower in the Western Balkans. Background Report No. 7. Inventory of Planned Hydropower Plant Projects. Final Draft 3. Western Balkans Investment Framework-WBIF, 2017. [Google Scholar]
- European Commision-Joint Research Centre JRC. Hydro-Power Database. Available online: http://data.europa.eu/89h/52b00441-d3e0-44e0-8281-fda86a63546d (accessed on 9 October 2020).
- Water Resources Management Agency of Albania (Agjencia e Menaxhimit të Burimeve Ujore-AMBU). Water Cadastre Albania. Available online: http://kadastraujore.gov.al/ (accessed on 25 November 2020).
- Ministry of Economy of Montenegro-Department of Renewable Energy Source. Hydropower. Available online: http://www.oie-res.me/index.php?page=hidroenergija (accessed on 14 November 2020).
- Thermos, I. Albania and North Macedonia: The Evolution of the Electricity System Under the Scope of Climate Change [MSc]; KTH School of Industrial Engineering and Management: Stockholm, Sweden, 2019. [Google Scholar]
- Lazaj, L.; Xhelilaj, R. Mapping of Hydropower Plant in Albania, Using Geographic Information System; EcoAlbania: Tirana, Albania; Milieukontakt Albania: Tirana, Albania; LexFerenda: Tirana, Albania, 2017. [Google Scholar]
- Kumar, A.; Schei, T.; Ahenkorah, A.; Caceres Rodriguez, R.; Devernay, J.-M.; Freitas, M.; Hall, D.; Killingtveit, A.; Liu, Z. Hydropower. In IPCC Special Report on Renewable Energy Sources and Climate Change Mitigation; Edenhofer, O., Pichs-Madruga, R., Sokona, Y., Seyboth, K., Matschoss, P., Kadner, S., Zwickel, T., Eickemeier, P., Hansen, G., Schlömer, S., et al., Eds.; Cambridge University Press: Cambridge, UK; New York, NY, USA, 2011; pp. 437–496. [Google Scholar]
- Killingtveit, A. Hydropower. In Managing Global Warming: An Interface of Technology and Human Issues; Letcher, T.M., Ed.; Academic Press: Cambridge, MA, USA, 2019; pp. 265–315. ISBN 9780128141052. [Google Scholar]
- Lange, K.; Meier, P.; Trautwein, C.; Schmid, M.; Robinson, C.T.; Weber, C.; Brodersen, J. Basin-scale effects of small hydropower on biodiversity dynamics. Front. Ecol. Environ. 2018, 16, 397–404. [Google Scholar] [CrossRef]
- Lehner, B.; Grill, G. Global river hydrography and network routing: Baseline data and new approaches to study the world’s large river systems. Hydrol. Process. 2013, 27, 2171–2186. [Google Scholar] [CrossRef]
- European Environment Agency (EEA). Waterbase v2019.1—Water Quality ICM. Available online: https://www.eea.europa.eu/data-and-maps/data/waterbase-water-quality-icm (accessed on 20 July 2020).
- Institute of Statistics (INSTAT) of the Republic of Albania. River Water Quality by Basins: Stations, Parameters, Variables and Year. Available online: http://databaza.instat.gov.al/pxweb/sq/DST/START__EN__EN_ADM/NewEN0008/?rxid=4bcfc502-a5c8-4b1b-87b4-8a5e7b224598 (accessed on 12 October 2020).
- National Hydrometeorological Service (NHMS) of North Macedonia. Water Quality Documents. Available online: https://uhmr.gov.mk/water-quality-documents/?lang=en (accessed on 2 October 2020).
- Institute of Hydrometeorology and Seismology of Montenegro. Water Quality Status in Montenegro. Years 2010-18; Institute of Hydrometeorology and Seismology of Montenegro: Podgorica, Montenegro, 2019. (In Montenegrin) [Google Scholar]
- HCMR. Monitoring of the Ecological Water Quality of Rivers, Coastal and Transitional Waters of Greece to Implement the Article 8 of Water Framework Directive 2000/60/EC; Ministry of Environment and Energy, Special Secretariat of Water: Anavyssos, Greece, 2016. [Google Scholar]
- Parliament of Albania. Decision No.115 dated 15.2.2012 approving the report of the environmental assessment in Albania for 2010. Off. J. Repub. Albania 2012, 23, 993–1230. (In Albanian) [Google Scholar]
- Institute of Statistics of Albania-INSTAT. Statistical Yearbook, 2010–2014; Institute of Statistics of Albania-INSTAT: Tirana, Albania, 2015. (In Albanian) [Google Scholar]
- Chen, Y.; Liu, R.; Barrett, D.; Gao, L.; Zhou, M.; Renzullo, L.; Emelyanova, I. A spatial assessment framework for evaluating flood risk under extreme climates. Sci. Total Environ. 2015, 538, 512–523. [Google Scholar] [CrossRef]
- Parliament of Albania. Law No. 10431/2011 on the Protection of the Environment. Off. J. Repub. Albania 2011, 89, 3680–3702. (In Albanian) [Google Scholar]
- European Commission. Directive 2004/35/CE of the European Parliament and of the Council of 21 April 2004 on environmental liability with regard to the prevention and remedying of environmental damage. Off. J. Eur. Union 2004, L143, 56–75. [Google Scholar]
- Parliament of Albania. Law No. 111/2012 on Integrated Water Resources Management. Off. J. Repub. Albania 2012, 157, 8498–8534. (In Albanian) [Google Scholar]
- Parliament of Albania. Decision No. 246/2014 on the Determination of the Environmental Quality Standards for Surface Water [in Albanian]. Off. J. Repub. Albania 2014, 65, 2240–2443. [Google Scholar]
- European Commission. Directive 2008/105/EC of the European Parliament and of the Council of 16 December 2008 on environmental quality standards in the field of water policy, amending and subsequently repealing Council Directives 82/176/EEC, 83/513/EEC, 84/156/EEC, 84/491/EEC. Off. J. Eur. Union 2008, L348, 84–97. [Google Scholar]
- Parliament of Albania. Decision 742/2015 on the Operation and Management of the pollutant release and transfer register. Off. J. Repub. Albania 2015, 165, 11548–11564. (In Albanian) [Google Scholar]
- European Commission. Directive No. 166/2006 of the European Parliament and of the Council of 18 January 2006 on the establishment of a European Pollutant Release and Transfer Register and amending Council Directives 91/689/EEC and 96/61/EC. Off. J. Eur. Union 2006, L33, 1–17. [Google Scholar]
- United Nations Economic Commision for Europe-UNECE. Environmental Performance Reviews: Albania. Third Review; Environmental Performance Reviews Series No. 47; United Nations: Geneva, Switzerland, 2018; ISBN 9789211171679. [Google Scholar]
- National Environmental Agencyof Albania. National Environmental Monitoring Programs for the Years 2016–2020; National Environmental Agency of Albania: Tirana, Albania, 2019. (In Albanian) [Google Scholar]
- Assembly of the Republic of Kosovo. Law No. 04/L-147 on Waters of Kosovo. Off. Gaz. Repub. Kosova 2013, 10, 1–40. [Google Scholar]
- Ministry of Environment and Spatial Planning of Kosovo. Administrative Instruction MESP-No. 16/2017 on Classification of Surface Water Bodies; Ministry of Environment and Spatial Planning of Kosovo: Pristina, Kosovo, 2017; p. 119. [Google Scholar]
- Government of the Republic of Kosovo. Kosovo National Water Strategy Document 2017–2036; Government of the Republic of Kosovo: Pristina, Kosovo, 2015. [Google Scholar]
- Bekteshi, H. Environmental laws in Kosovo: Implementation of the SAA. In Proceedings of the JMU—MWP 13th Graduate Symposium, Fiesole, Italy, 7 April 2020; pp. 1–11. [Google Scholar]
- European Commission. Commission Staff Working Document. Kosovo* 2019 Report Accompanying the document Communication from the Commission to the European Parliament, the Council, the European Economic and Social Committee and the Committee of the Regions; European Commission: Brussels, Belgium, 2019. [Google Scholar]
- Government of Montenegro. Law on Water. Off. Gaz. Montenegro 2007, 27, 1–61. (In Montenegrin) [Google Scholar]
- Government of Montenegro. Amendments on the Law on Waters. Off. Gaz. Montenegro 2018, 84, 210–217. (In Montenegrin) [Google Scholar]
- Government of Montenegro. Regulation on the national list of environmental indicators. Off. Gaz. Montenegro 2013, 19, 6–27. (In Montenegrin) [Google Scholar]
- United Nations Economic Commision for Europe-UNECE. Environmental Performance Reviews: Montenegro. Third Review; Environmental Performance Reviews Series No. 41; United Nations: New York, NY, USA; Geneva, Switzerland, 2015; ISBN 9789211170863. [Google Scholar]
- The Scottish Development Department Engineering Division. Development of Water Quality Index. Applied Research & Development Report No ARD3; Scottish Development Department: Edinburgh, UK, 1976. [Google Scholar]
- Djuraskovic, P. Water Quality Index—WQI, as tool of water quality assessment. In Proceedings of the BALWOIS 2010, Ohrid, North Macedonia, 25–29 May 2010; pp. 1–5. [Google Scholar]
- Vukašinović-Pešić, V.; Blagojević, N.; Savić, A.; Tomić, N.; Pešić, V. The Change in the Water Chemistry of the Rivers of Montenegro over a 10-Year Period. In The Rivers of Montenegro. The Handbook of Environmental Chemistry.; Springer: Berlin/Heidelberg, Germany, 2019; pp. 1–27. [Google Scholar]
- Republic of Macedonia. Water Law 87/08 (1623). Off. Gaz. Repub. Maced. 2008, 87, 11–147. [Google Scholar]
- Republic of Macedonia. Guidance for the procedures and the manner of observation and measurement of the qualitative characteristics of the waters in the network of the hydrological stations (581). Off. Gaz. Repub. Maced. 2010, 33, 15–22. [Google Scholar]
- Republic of Macedonia. Regulation for the classification of surface waters (2440). Off. Gaz. Repub. Maced. 2016, 99, 5–33. [Google Scholar]
- Republic of Macedonia. Regulation for water classification (549). Off. Gaz. Repub. Maced. 1999, 18, 1165–1173. [Google Scholar]
- United Nations Economic Commision for Europe-UNECE. Environmental Performance Reviwes: North Macedonia. Third Review; Environmental Performance Reviews Series No. 51; United Nations: Geneva, Switzerland, 2019; ISBN 9789211171976. [Google Scholar]
- Hellenic Republic. Definition of a water quality and quantity National Monitoring Network by determining the sites (stations) of measurements and the operating agencies, in alignment to article 4, paragraph 4 of Law 3199/2003. Off. J. Hell. Repub. 2011, B, 27483–27530. (In Greek) [Google Scholar]
- Hellenic Republic. Law No 3199. Protection and management of waters-Alignment with Directive 2000/60/EC of the European Parliament and of the council of 23 October 2000. Off. J. Hell. Repub. 2003, A, 4821–4828. (In Greek) [Google Scholar]
- Skoulikidis, N.T.; Amaxidis, Y.; Bertahas, I.; Laschou, S.; Gritzalis, K. Analysis of factors driving stream water composition and synthesis of management tools-A case study on small/medium Greek catchments. Sci. Total Environ. 2006, 362, 205–241. [Google Scholar] [CrossRef]
- Cardoso, A.C.; Duchemin, J.; Magoarou, P.; Premazzi, G. Criteria for the Identification of Freshwaters Subject to Eutrophication, EUR 19810 EN; EC Joint Research Centre: Ispra, Italy, 2001; ISBN 9289409479. [Google Scholar]
Figure 1.
Drin River Basin.

Figure 2.
Conceptual framework of the suitability model used in the present study.
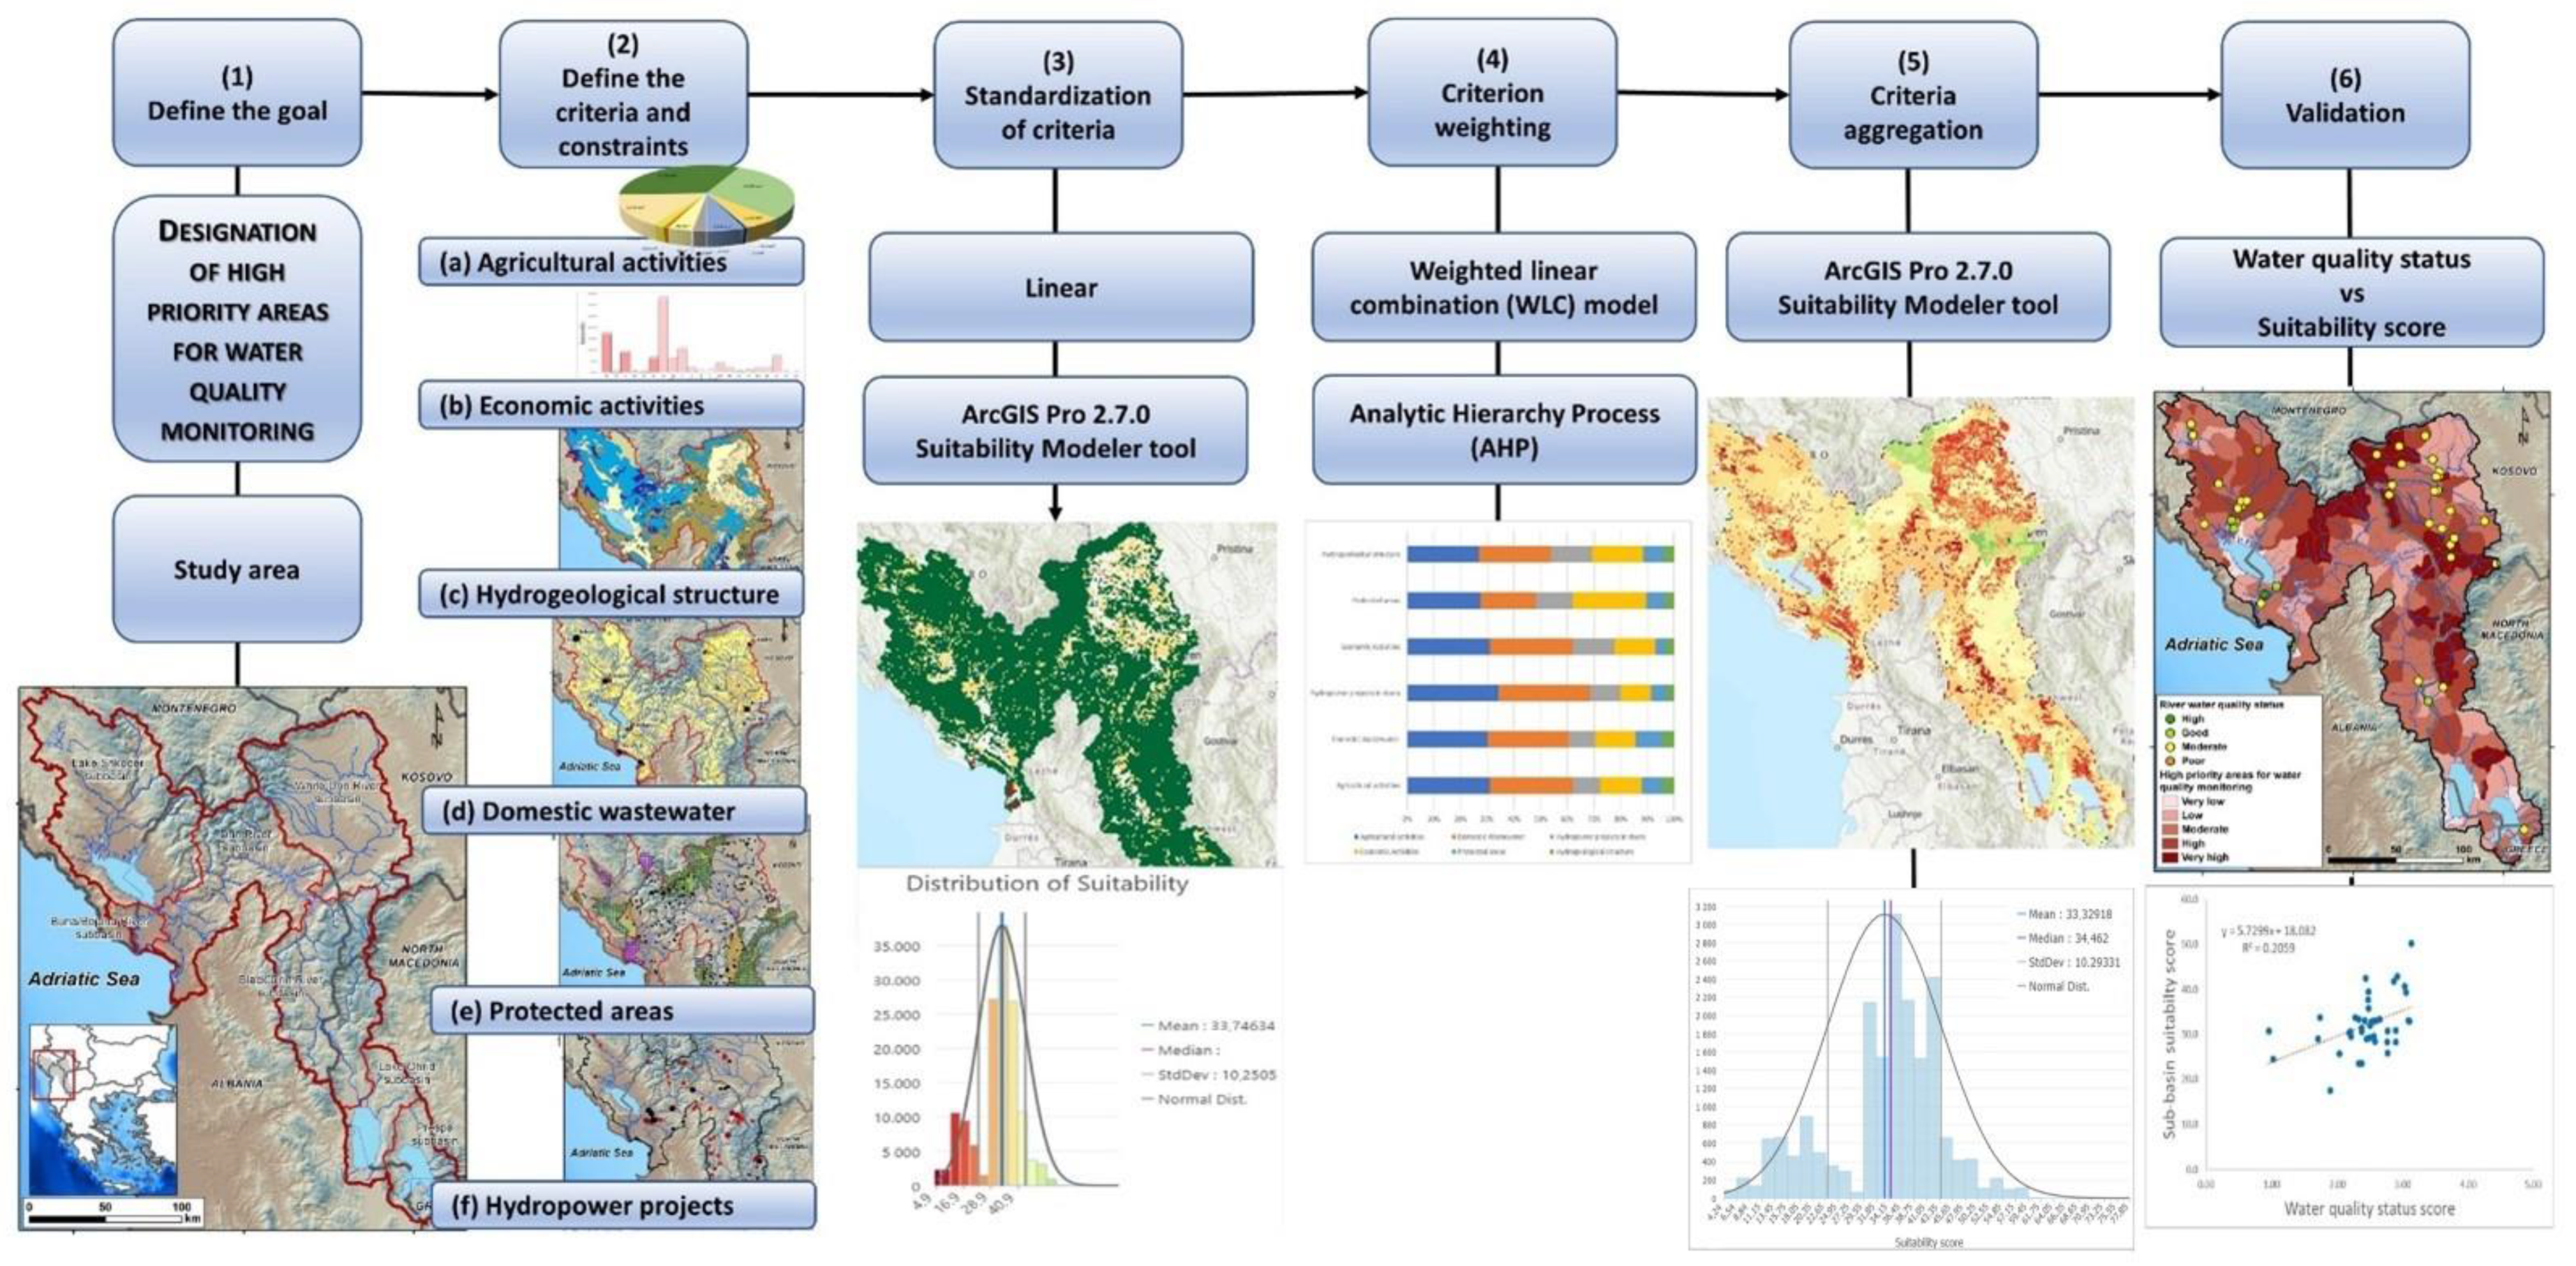
Figure 3.
Agricultural activities in the Drin River Basin based on CORINE Land Cover 2018, level 2.

Figure 4.
Economic activities in the Drin River Basin (a) based on NACE Rev. 2, Level 1 Codes, and (b) number of businesses per area per municipality.
Figure 4.
Economic activities in the Drin River Basin (a) based on NACE Rev. 2, Level 1 Codes, and (b) number of businesses per area per municipality.
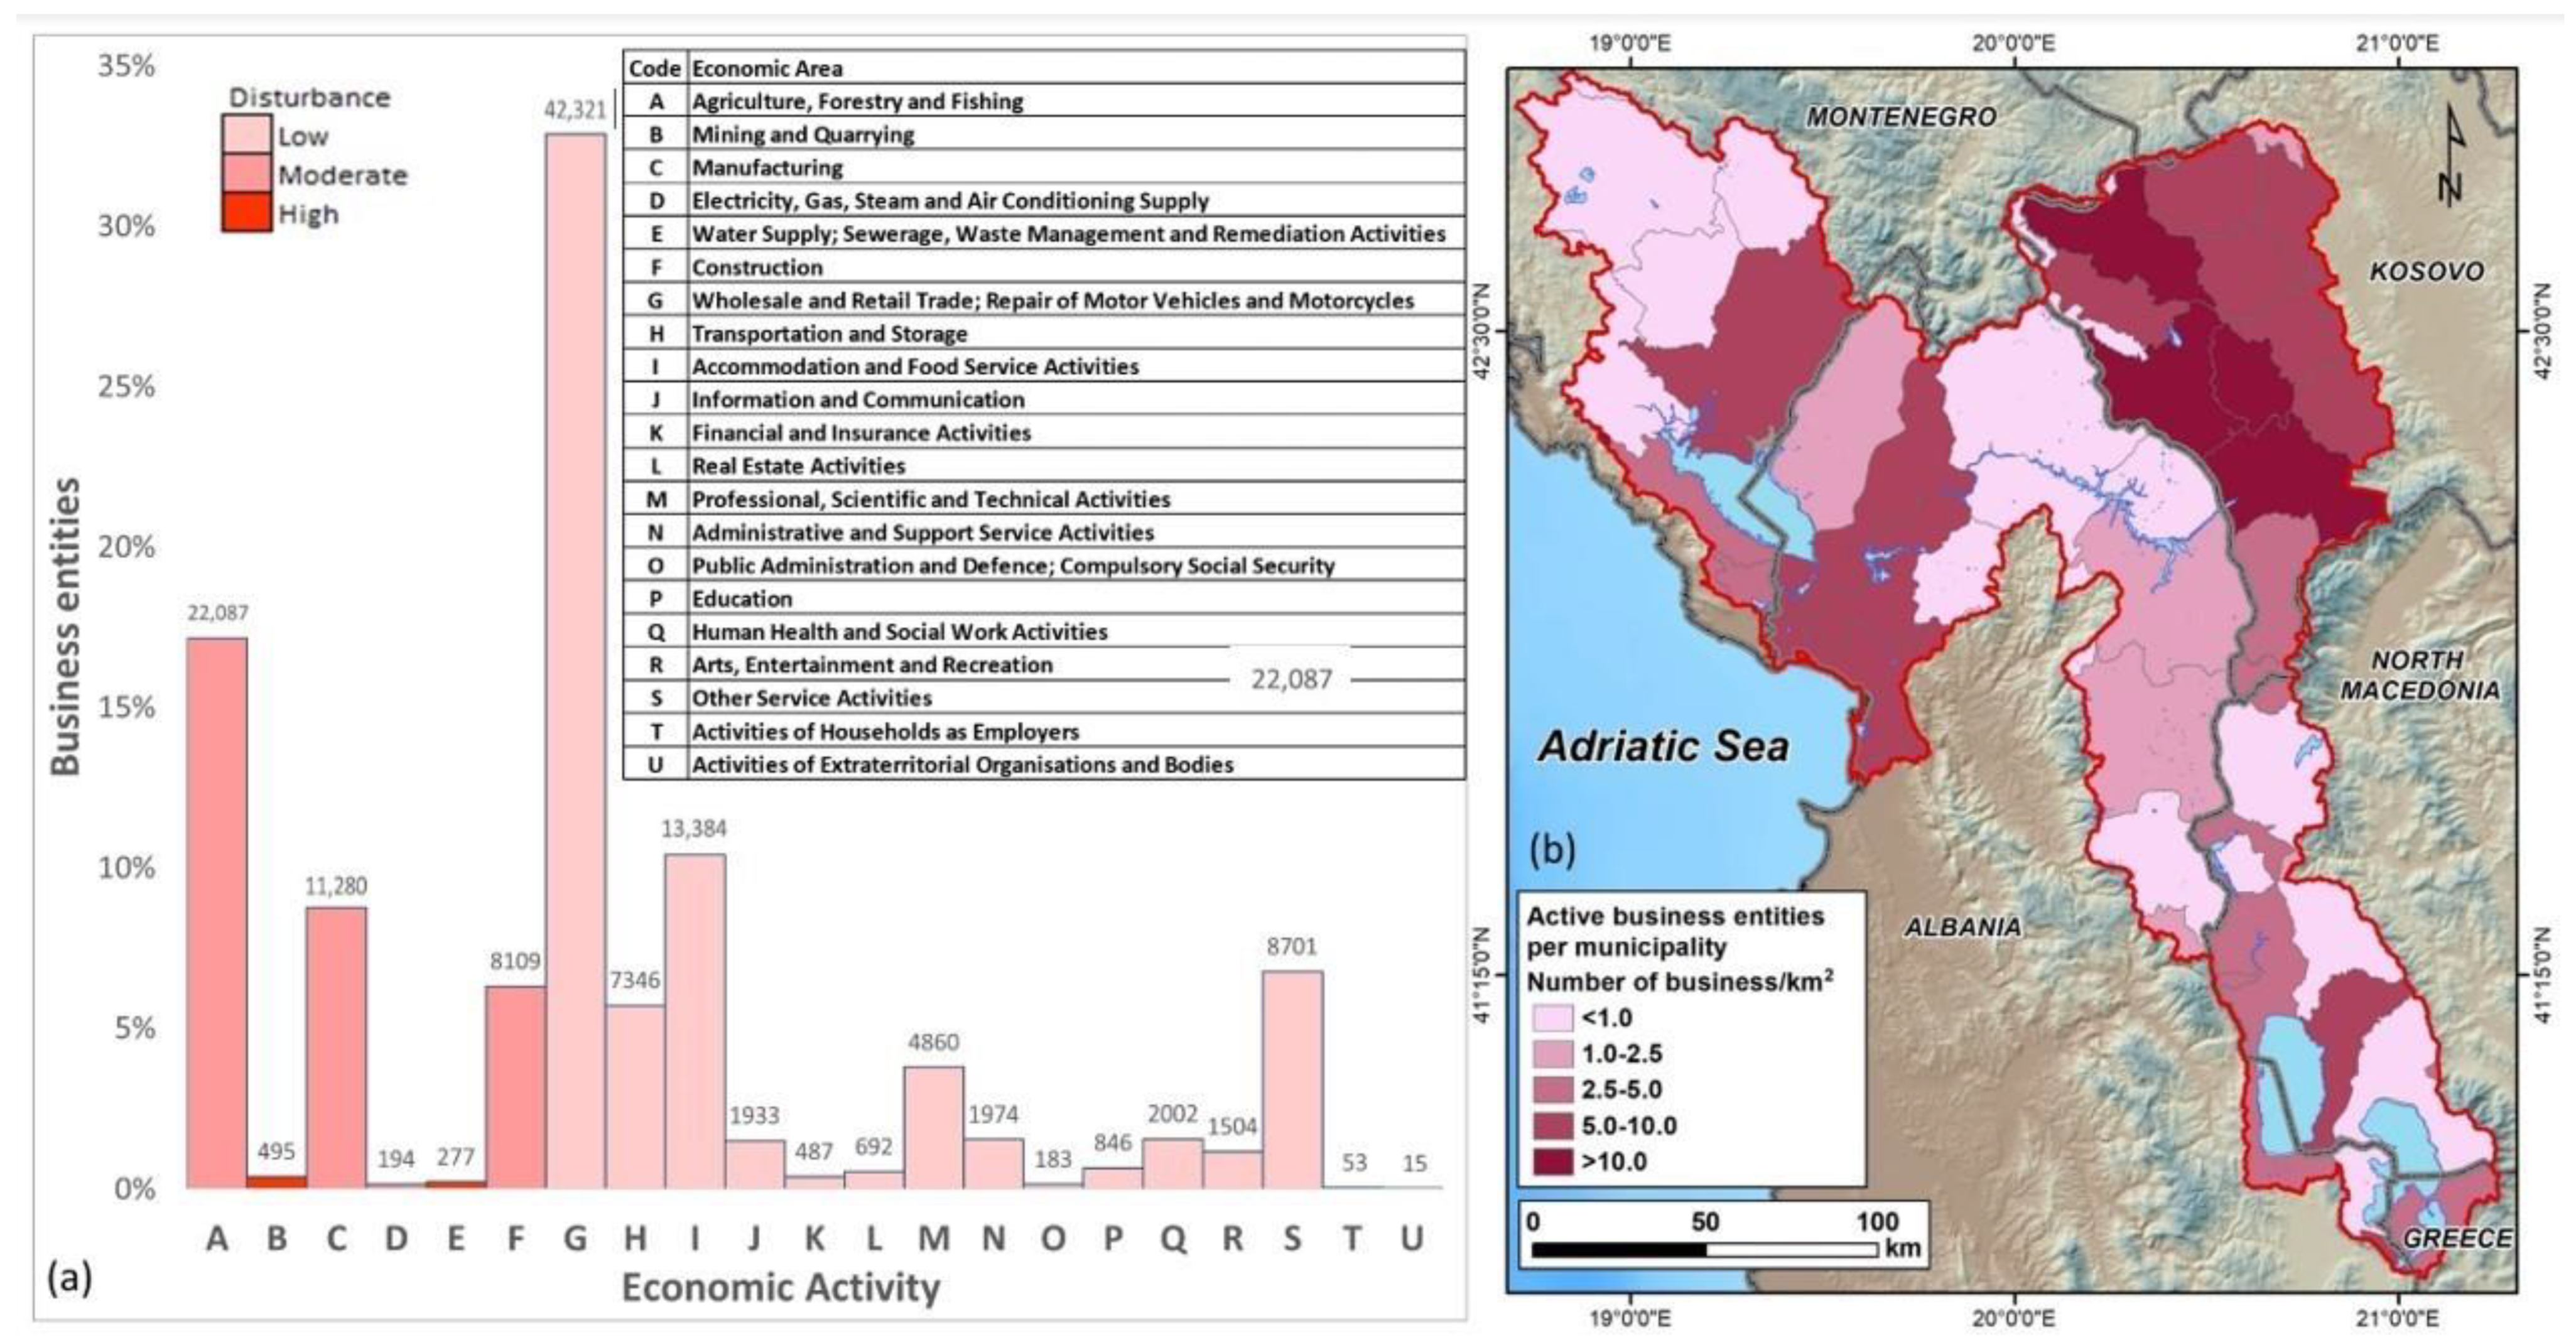
Figure 5.
(a) Hydrogeological map, (b) population density distribution, and UWWTP.

Figure 6.
(a) Protected areas and (b) hydropower projects at the Drin River Basin.

Figure 7.
Conditioning factors increasing the need for water quality monitoring. (a) Agricultural activities, (b) economic activities, (c) hydrogeological structure, (d) domestic wastewater, (e) protected areas, and (f) hydropower projects.
Figure 7.
Conditioning factors increasing the need for water quality monitoring. (a) Agricultural activities, (b) economic activities, (c) hydrogeological structure, (d) domestic wastewater, (e) protected areas, and (f) hydropower projects.

Figure 8.
(a) Resulted map of the suitability modeling, with high priority areas for water quality monitoring and monitored river water quality status, (b) distribution chart of the resulted map, and (c) comparison between water quality status score of the monitoring stations and the corresponding sub-basin suitability score.
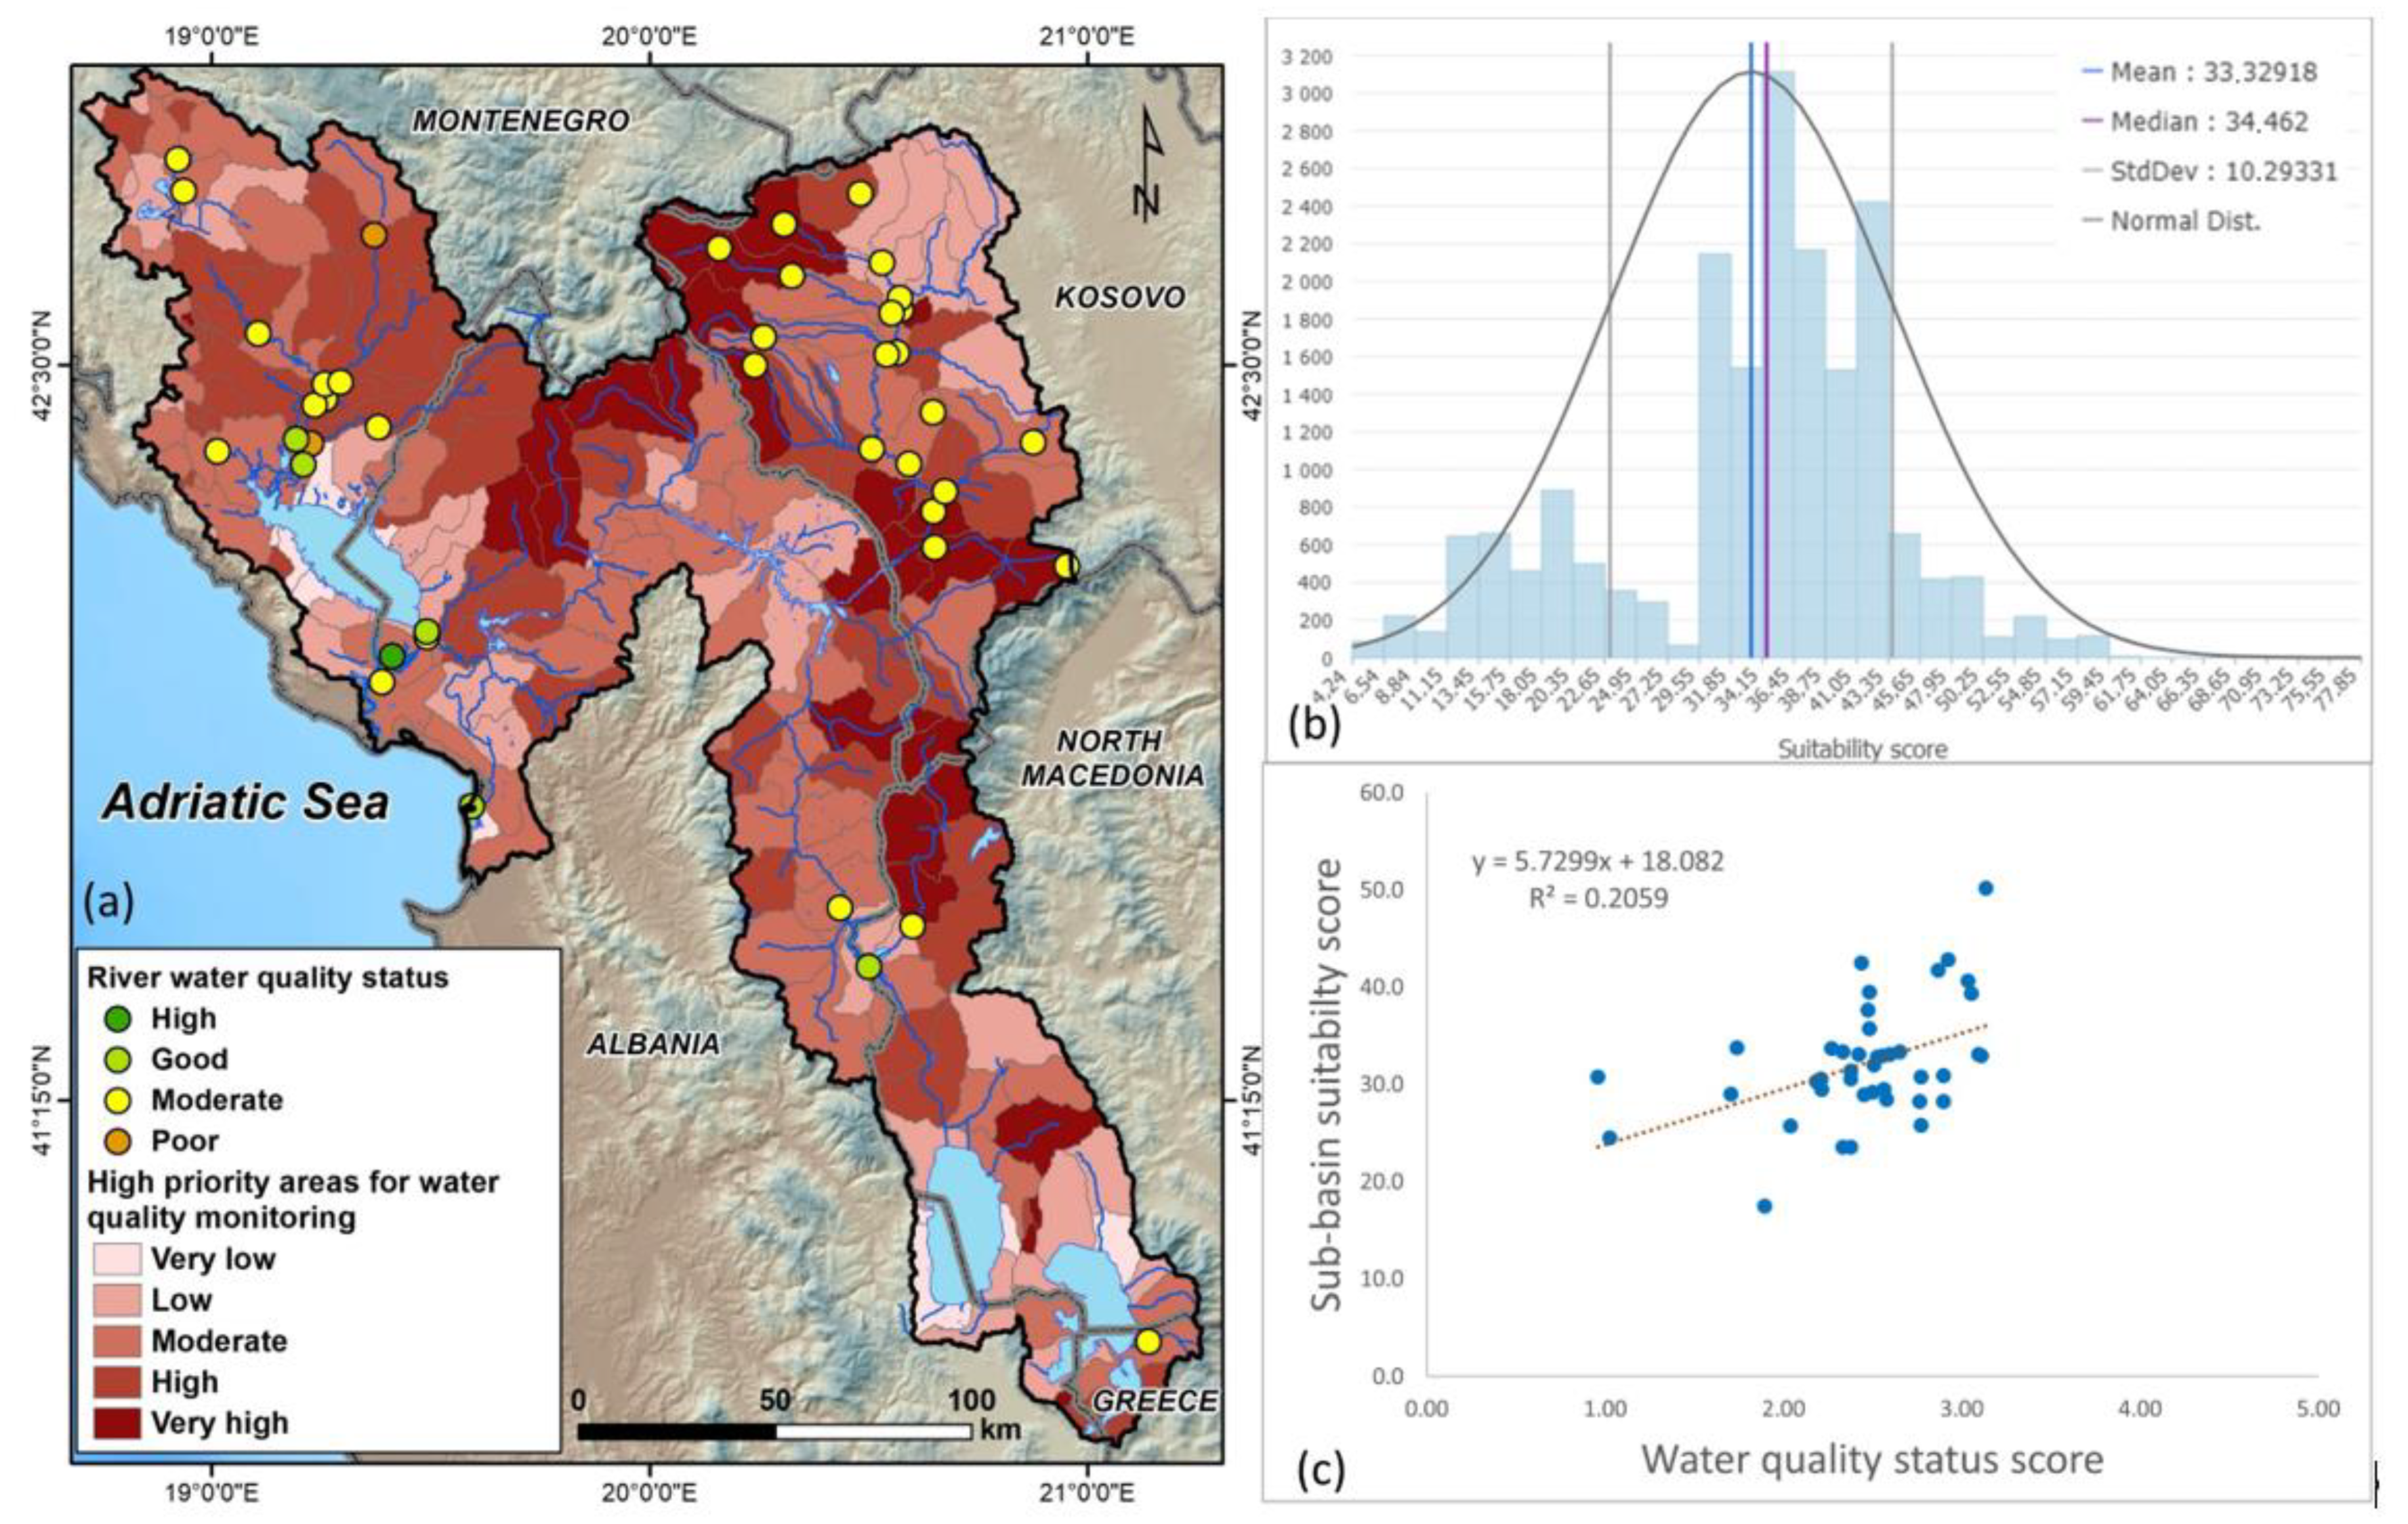

Table 1.
The fundamental scale for pairwise comparison [31].
Table 1.
The fundamental scale for pairwise comparison [31].
| Intensity of Importance | Definition |
|---|---|
| 1 | Equal importance |
| 2 | Weak |
| 3 | Moderate importance |
| 4 | Moderate plus |
| 5 | Strong importance |
| 6 | Strong plus |
| 7 | Very strong or demonstrated importance |
| 8 | Very, very strong |
| 9 | Extreme importance |
Table 2.
Average random consistency index (RI) [31].
Table 2.
Average random consistency index (RI) [31].
| n | 1 | 2 | 3 | 4 | 5 | 6 | 7 | 8 | 9 |
|---|---|---|---|---|---|---|---|---|---|
| RI | 0.00 | 0.00 | 0.52 | 0.89 | 1.11 | 1.25 | 1.35 | 1.40 | 1.45 |
Table 3.
Quality status in rivers based on physicochemical parameters used by the National Environmental Agency of Albania [97].
Table 3.
Quality status in rivers based on physicochemical parameters used by the National Environmental Agency of Albania [97].
| Parameter | Unit | High | Good | Moderate | Poor | Bad |
|---|---|---|---|---|---|---|
| DO | mg/l | >7 | >6 | >5 | >4 | <3 |
| BOD5 | mg/l | <2 | <3.5 | <7 | <18 | >18 |
| pH (acid) | - | - | >6.5 | >6 | - | - |
| ph (alkaline) (alkaline) | - | - | <8.5 | <9 | - | - |
| NH4 | mg/l | <0.05 | <0.3 | <0.6 | <1.5 | >1.5 |
| NO2 | mg/l | <0.01 | <0.06 | <0.12 | <0.3 | >0.3 |
| NO3 | mg/l | <0.8 | <2 | <4 | <10 | >10 |
| PO4 | mg/l | <0.05 | <0.1 | <0.2 | 0.5 | >0.5 |
| Ptotal | mg/l | <0.1 | <0.2 | <0.4 | <1 | >1 |
Table 4.
Weights of the factors increasing the need for the monitoring of water quality parameters of rivers in the Drin River Basin.
Table 4.
Weights of the factors increasing the need for the monitoring of water quality parameters of rivers in the Drin River Basin.
| a/a | Conditioning Factors | Class | Rank |
|---|---|---|---|
| 1 | Agricultural | Non-irrigated arable land (211) | 1 |
| Permanently irrigated land (212) | 3 | ||
| Rice fields (213) | 4 | ||
| Fruit trees and berry plantations (222) | 1 | ||
| Olive groves (223) | 1 | ||
| Pastures (231) | 1 | ||
| Annual crops associated with permanent crops (241) | 4 | ||
| Complex cultivation patterns (242) | 2 | ||
| Land principally occupied by agriculture (243) | 1 | ||
| 2 | Economic/Industrial | Low disturbance | 2 |
| Moderate disturbance | 3 | ||
| High disturbance | 5 | ||
| 3 | Geological structure | Aquitard (AT) | 0 |
| Karst-fissure, permeability good (KA1) | 3 | ||
| Karst-fissure, permeability moderate (KA2) | 2 | ||
| Intergranular, good (IA1) | 2 | ||
| Intergranular, moderate (IA2) | 1 | ||
| Fissure (FA) | 1 | ||
| 4 | Domestic wastewater Population density (inh/km2) | <300 | 1 |
| 300–1500 | 2 | ||
| >1500 | 3 | ||
| 5 | Protected areas | - | 1 |
| 6 | HPPs | Large, storage | 6 |
| Large, RoR | 5 | ||
| Large, n/a | 4 | ||
| Small, storage | 3 | ||
| Small, RoR | 2 | ||
| Small, n/a | 1 |
Table 5.
Pairwise comparison matrix of six criterion using the Analytic Hierarchy Process (AHP) method.
Table 5.
Pairwise comparison matrix of six criterion using the Analytic Hierarchy Process (AHP) method.
| Item Description | Agricultural Activities | Domestic Wastewater | Hydropower Projects | Economic Activities | Protected Areas | Hydro-Geology | Weight |
|---|---|---|---|---|---|---|---|
| Agricultural activities | 1.00 | 1.00 | 3.00 | 2.00 | 4.00 | 7.00 | 30.2% |
| Domestic Wastewater | 1.00 | 1.00 | 3.00 | 2.00 | 3.00 | 7.00 | 29.0% |
| Hydropower projects | 0.33 | 0.33 | 1.00 | 1.00 | 2.00 | 4.00 | 12.8% |
| Economic Activities | 0.500 | 0.50 | 1.00 | 1.00 | 4.00 | 5.00 | 17.3% |
| Protected areas | 0.250 | 0.33 | 0.50 | 0.25 | 1.00 | 2.00 | 7.0% |
| Hydrogeology | 0.143 | 0.14 | 0.25 | 0.20 | 0.50 | 1.00 | 3.7% |
| Consistency ratio CR | 0.019 | ||||||
Publisher’s Note: MDPI stays neutral with regard to jurisdictional claims in published maps and institutional affiliations. |
© 2021 by the authors. Licensee MDPI, Basel, Switzerland. This article is an open access article distributed under the terms and conditions of the Creative Commons Attribution (CC BY) license (https://creativecommons.org/licenses/by/4.0/).
Share and Cite
MDPI and ACS Style
Mentzafou, A.; Blagojević, M.; Dimitriou, E. A GIS-MCDA-Based Suitability Analysis for Meeting Targets 6.3 and 6.5 of the Sustainable Development Goals. Sustainability 2021, 13, 4153. https://doi.org/10.3390/su13084153
AMA Style
Mentzafou A, Blagojević M, Dimitriou E. A GIS-MCDA-Based Suitability Analysis for Meeting Targets 6.3 and 6.5 of the Sustainable Development Goals. Sustainability. 2021; 13(8):4153. https://doi.org/10.3390/su13084153
Chicago/Turabian StyleMentzafou, Angeliki, Momčilo Blagojević, and Elias Dimitriou. 2021. "A GIS-MCDA-Based Suitability Analysis for Meeting Targets 6.3 and 6.5 of the Sustainable Development Goals" Sustainability 13, no. 8: 4153. https://doi.org/10.3390/su13084153
Note that from the first issue of 2016, this journal uses article numbers instead of page numbers. See further details here.