
Thermoeconomic Analysis of Biomethane Production Plants: A Dynamic Approach


Department of Industrial Engineering, University of Naples Federico II, 80138 Napoli, NA, Italy
*
Author to whom correspondence should be addressed.
Sustainability 2022, 14(10), 5744; https://doi.org/10.3390/su14105744
Submission received: 30 March 2022
/
Revised: 2 May 2022
/
Accepted: 6 May 2022
/
Published: 10 May 2022
(This article belongs to the Special Issue Sustainability of Smart Energy Grids: Pathway for Achieving a Green Smart Energy Grid)
Abstract
:This work analyses the two most diffused technologies for biogas upgrading, namely water scrubbing and membrane separation. In order to carry out such analysis, these two technologies are coupled with photovoltaic panels and an electric energy storage system. The optimal water scrubbing renewable plant achieves a primary energy saving of 5.22 GWh/year and an operating cost saving of 488 k€/year, resulting in the best plant. It was compared to a reference system based on a cogenerator unit, directly supplied by biogas, producing thermal and electric energy, and delivered to the district heating network and to the electric grid. The profitability of both plants depends on the electric energy and biomethane exporting price. The proposed bigas upgrading plant achieves a payback period lower than 10 years with a biomethane selling price greater than 0.55 €/Sm3 and a primary energy saving index around 25–30% with a null share of thermal energy exported by the cogeneration plant.
1. Introduction
Organic waste is becoming more and more attractive for the production of different types of biofuels, ref. [1] such as biomethane, biogas, etc. [2]. In fact, such biofuels can be used to produce heat and power [3]. For example, in Combined heat and power (CHP) systems [4], the biofuel is used to match both internal loads of the treatment plant and the energy demands of the user. In many other cases, the produced biofuels can be used for a twofold goal: (i) to supply energy to the public grid and to the district heating networks [5]; and (ii) supply fuel to the vehicles equipped with internal combustion engines (ICE). In developing countries, a large part of the biogas production is aimed at thermal energy generation, and it is rarely upgraded into biomethane [6]. For instance, in Brazil, a large part of the biogas production is used for household use, but in recent years the government pushed the local stakeholders to increase the production of biomethane for the purpose of electric generation [7]. In Ref. [8], a life cycle assessment (LCA) is proposed for the waste management of pig manure. This analysis proved the feasibility of biomethane production for a breeding facility. The LCA approach is widely used in the literature to show the potential of biogas production and its upgrading in several developing countries [9]. In fact, similar analyses are proposed by researchers in developing countries such as Ethiopia [10], Colombia [11], India [12], Mexico [13], and many others [14]. Biogas potential in avoiding greenhouse gas (GHG) emissions is widely known [15]. Biogas mainly consists of a mixture of methane (CH4) (in concentration ranging from 45% to 65% [16]), carbon dioxide (CO2) and other minor components, such as ammonia, hydrogen sulphide (H2S), nitrogen and water [17]. The non-methane components are considered as inert compounds, because they reduce the mixture lower heating value (typically Lower heating value (LHV) equal to up to 28 MJ/m3 [18]), flame speed, and flammability limit. Moreover, such inert compounds also cause an increase in energy usage during transportation [19]. A plurality of devices is designed to directly convert biogas into heat and work but its direct use may significantly reduce their life span [20]. Therefore, the biogas has to undergo an upgrading process aimed at improving the gas quality, mainly by CO2 removal, in order to achieve a CH4 concentration higher than 95 vol% [21].
The International Energy Agency (IEA) reports that China has the highest number of active biogas plants among the IEA Bioenergy Task 37-member countries [22], with more than 100,000 biogas plants and the highest annual biogas production, roughly 72,000 TWh. Regarding the biomethane production, Europe reached a total of 1023 facilities by October 2021. According to the latest data from the European Biogas Association statistical report [23], the number of installed biogas upgrading plants is sharply increasing in Europe (483 plants in 2018 compared to 729 plants in 2020). In this framework, biomethane production rose remarkably in the last decade, reaching a total of 32 TWh of biomethane in 2020. Several technologies were developed for the biogas upgrading, mainly based on four different processes, these being membrane separation [24], absorption [25] with physical solvents [26] and chemical solvents [27], adsorption [28], and cryogenic separation [29,30]. Khan et al. [31] provide a comprehensive literature review of the main principles of various biogas upgrading methodologies. This research assessed that the biogas upgrading process requires high energy use. In this framework, the integration of renewables and biogas upgrading plants should be profitable for reducing the environmental impact of biomethane production and for producing renewable fuels. Ref. [32] highlighted that water scrubbing and membrane separation are the most diffused and mature technologies for biogas upgrading. Concerning the membrane separation process, CO2 is removed from the biogas mixture by means of a physical filtration through hollow fiber selective membranes [33]. The biogas is first cleaned by removing contaminants (H2S, water, etc.) [34]. Subsequently, before injecting the biogas into the membrane separation unit, it is compressed at 5–20 bar [35]. In fact, the retentate flow must reach a pressure level suitable for injection into the natural gas grid [36] and must have a high level of purity [37]. In fact, this process features a recovery rate of 95%, but this parameter can overcome a value of 98% if a multistage membrane system is used [38]. The current manufacturing configurations are: (i) single stage, (ii) two-stage with a recirculation loop, (iii) two-stage with a sweep biogas stream and (iv) three-stage with sweep biogas stream [39]. Despite the unavoidable issue of the membrane fouling, membrane separation is the most commercially diffused [40].
Water scrubbing technology is based on the separation of CO2 from the biogas due to the increased solubility of CO2 in water compared to CH4 (26 times higher than CH4 at 25 °C) [41]. Although some plants carry out a simultaneous removal of H2S and CO2 [42], it is nevertheless advisable to install a pre-treatment to remove H2S, as it is very corrosive [43] and it can cause operating issues [44]. The main features of the water scrubbing technology are summarized below. Firstly, the water, provided from the top side of an absorption column, flows towards the counter-current flow of the biogas, which is pressurized at 6–10 bar [45], near 40 °C and provided via the bottom side of the tank [35]. The biomethane is released from the top of the scrubber, while the water phase containing CO2 and H2S is circulated into a flush column, where the pressure decreases (2.5–3.5 bar). Here, some traces of CH4 dissolved in the water can be recovered. In the framework of scrubbing technology, the “single pass scrubbing” and the “regenerative absorption” are mature and commercially available. The “single pass scrubbing” is used when the water is derived from sewage treatment plants. In the case of “regenerative absorption”, due to the large amount of water that is required, the water can be regenerated in a desorption column by means of a decompression at atmospheric pressure, removing both CO2 and H2S. Finally, after a drying step, the CH4 can reach up to 99% purity [46].
All of the aforementioned technologies suffer for the following main issues: high energy consumption, use of expensive chemicals, and high operating costs [31]. The energy consumption of each technology can vary as a function of the targeted purity and efficiency, but representative values from the literature are summarized below for comparison [47]: water scrubbing and chemical scrubbing, 0.67 kWh/Nm3 and 0.3 kWh/Nm3 [48], respectively, membranes and adsorption, 0.21–0.3 kWh/Nm3 and 0.46 kWh/Nm3 [39], respectively, organic physical scrubbing 0.49 kWh/Nm3 [48].
The biogas upgrading process also involves additional costs compared to the direct utilization of biogas, which can be performed in a CHP unit [49]. However, the biogas upgrading strategy is attractive from a circular economy perspective as its utilization may (i) reduce the imports of natural gas; (ii) reduce CO2 emissions; and (iii) enhance the exploitation of local renewable energy resources [50]. In this framework, in order to reduce the high energy consumption of the process and to achieve promising energy savings, the integration of renewable energy technologies with the biogas upgrading is becoming more attractive. Several studies have shown that the high energy demand of the present biomethanation technologies can be significantly reduced by considering novel, sustainable, and feasible technologies by also improving their economic feasibility [51].
Solar source technologies are widely studied in coupling with the biomethanation units. Su et al. [52] developed a mathematical model to simulate a hybrid system including concentrated photovoltaic thermal (CPVT) collectors and biogas upgrading technology. The thermal energy of the solar collectors is used for heating the digester unit, whereas the electric energy is used to supply the biogas upgrading unit to produce biomethane. The proposed configuration allows to reduce the amount of electricity withdrawn from the grid by 48.38%, increasing biomethane production by 86.08%. A more sustainable and efficient biomethane production, with the reduction of the high thermal energy consumption of upgrading systems based on the chemical absorption, is proposed in reference [53]. Here, CPVT collectors produce the heat required by the solvent regeneration and digester unit, whereas the electricity can be used to match the power demand of the biogas plant. The dynamic simulation of the proposed system shows that CPVT collectors can match 17% of the thermal energy demand and 51.1% of the electricity demand. The electric energy excess, roughly 140.3 MWh/year, is exported to the grid. In the study of Curto et al. [54], biogas was upgraded to natural gas by means of a methanation process, exploiting the hydrogen, produced via electrolyzers driven by the electricity provided by solar and wind fields. Two regions featured by high wind or solar availability are considered for carrying out the study: the United Kingdom and Spain. This research suggests that the biogas upgrading plant driven by renewables installed in the United Kingdom exhibits better economic results with respect the one installed in Spain because of the lower PV capital cost in the United Kingdom.
Novelty and Aim of the Study
The adoption of renewable energy technologies to enhance the biomethane sustainable production was investigated in the previously presented literature review. The applications are mainly focused on the production of biogas integrated by solar energy, achieving promising energy savings. Several applications are considered, namely the solar-assisted biodigester [55], PV panels coupled with a biodigester [56,57], solar heating systems into fixed dome digesters [58], and studies based on life cycle energy and cost analysis of small scale biogas plants coupled with solar PV panels [59]. However, to the best of the authors’ knowledge, there is still no work in the literature which performs a detailed thermo-economic comparison of biogas upgrading technologies coupled with a photovoltaic and electric energy storage system. In particular, the novelties of this work can be listed as follows.
- The development of a comprehensive dynamic simulation model for the renewable biomethane production based on photovoltaic and lithium-ion battery.
- The coupling of PV panels and a lithium-ion storage system to increase the self-consumed energy and sustainability of the biomethane production.
- A thermoeconomic comparison of the water scrubbing and membrane separation technologies in order to assess which achieves a more sustainable biomethane production.
- A detailed analysis in order to assess the optimal capacity mix of the considered technologies, i.e., PV capacity, battery capacity, water scrubber operating pressure, membrane separation operating pressure and the number of membrane separation stages for detecting the optimal layout.
2. Layout
The proposed plant aims to integratine renewable sources of energy, i.e., a photovoltaic field, into a biogas upgrading plant, as shown in Figure 1. Note that three layouts are studied and compared in this work. These layouts only differ for the selcted biogas upgrading technology, namely water scrubbing, two-stage membrane separation, and three-stage membrane separation.
The electricity produced by the PV field is used to match the electric energy demand of the biogas upgraing plant consitsting of the biogas upgrading unit and its auxiliary components. This plant is also equipped with an electric energy storage system that consists of a lithium-ion battery (LIB).
In the case of scarce or null solar production, the electric energy is first withdrawn from the LIB. Note that the battery discharge is allowed only if the battery state of charge (SoC) ranges from 5% to 90%. Conversely, in the case of solar production higher than plant energy demand, the surplus electric production is delivered to the LIB until its SoC reaches the maximum allowed value of 90%. When the battery SoC is higher than the upper treshold, i.e., SoC = 90%, the electric energy is delivered to the grid. The electric energy storage is used both to increase the energy self-sufficiency of the system proposed and to shave the peaks of electricity export into the grid during the most irradiated periods. In the presented plant, the biogas flow rate provided to the upgrading unit is supposed to be constant, thanks to a tank buffer at the downstream of the anaerobic digester. This solution is commonly applied in the design of biogas upgrading plants. In fact, such an approach is able to avoid sharp variations of the biogas flow rate that may worsen the performance and the security of the plant.
3. System Model
3.1. Membrane Model
Concerning membrane separation (MS) biogas upgrading technology, compressors and membranes play a crucial role. The components of the systems include:
- Compressors, which compress the inlet gas to the rated operating pressure, providing the driving force for the whole process
- Spiral wound membrane modules, where the separation between CO2 and CH4 occurs
Several configurations may be developed considering a variable number of membranes and compressors. As mentioned before, this work addresses two-stage MS and three-stage MS. For example, a layout of a three-stage MS biogas upgrading unit is shown in Figure 2.
The model used for the simulation of the membrane system is based on the principle that a gaseous mixture can be fractionated as a function of the different permeability of its components in polymeric films (membranes) [60]. In particular, when the compressed gas is supplied to a module, the pressure difference across the membrane generates a permeate, rich in permeable compound (i.e., CO2), and a residual flow, defined as retentate, rich in non-permeable components, i.e., CH4. Further details of this model are discussed in reference [61]. The presented model also includes the assessment of the CH4 recovery ηCH4 and the average composition of the permeate yave, respectively, Equations (1) and (2).
where is the permeated supply fraction.
3.2. Water Scrubber Model
The simplified layout of the plant related to the pressure water scrubbing technology is represented in Figure 3. The system consists of the following components:
- Absorption column (scrubber): a tower where the biogas and the water are fed in counter flow arrangement.
- Compressors: a first compressor is used to increase the pressure of the biogas entering the column; a second compressor is used to increase the pressure of the outlet biomethane flow up to the low pressure network, about 7 bar.
- Pump: a circulation pump is needed for the water supplying the top of the scrubber at the operating pressure.
- Cooler: it cools down the outlet gas exiting the compressor. In fact, due to the pressure increase, the gas temperature increases, lowering its solubility. Therefore, a cooling process is needed to control the gas outlet temperature.
- Filter: this device filters the impurities in the water entering the scrubber.
- Dryer: it removes water from the biomethane gas mixture in order to avoid any reduction of its heating value.
The model is derived by the algorithm provided by Ref. [62], which was validated against experimental results (i.e., data available in Ref. [63]). The simulation model of the water scrubber technology allows one to evaluate the performance of the system according to the one-dimensional mass balances of the species involved for an element of the column of infinitesimal height, in both the liquid and gaseous phases.
Concerning the calculation of the partial pressure of gaseous phase, it is assumed that this is directly derived from its mole fraction, which is related to the mass fraction according to the Raoult Law [64]. Boundary conditions and assumptions of the model are further discussed in Ref. [62], where all the packing characteristics are explained. Furthermore, the most widely used semi-empirical correlations for the calculation of the Henry coefficients, Diffusive coefficients, Equilibrium constants, and Mass Transfer parameters are shown. The system of Equations (3)–(6) was implemented in MatLab using the ode15s solver specifying the initial conditions, i.e., the mass fractions of CO2 and CH4 in the inlet gas and in the outlet liquid from the scrubber, and the integration interval, i.e., from the basis to the top of the scrubber. The calculation procedure involves iterating the integration interval, i.e., the height of the scrubber, until the desired outlet conditions are reached. For further details regarding the anaerobic digestion modelling and dynamic simulation, we recommend reviewing the other works of the authors [65].
3.3. Auxiliary Units Model
The biogas upgrading units are coupled with auxiliary units. The water scrubbing unit also includes a multistage reciprocating compressor for the inlet biogas, a pump for the supply water, a blower, and a cooler for cooling down the incoming gas flow rate. The models adopted for these components are selected according to Ref. [19] and are reported below. The power consumption of the multistage reciprocating compressor with two stages was calculated fixing the efficiency of the unit, as follows:
For the pump, the shaft power was calculated according to the following equation:
where the total head is calculated, according to Ref. [19], as the sum of three terms related to the pressure difference, the heigth of the column, and the friction factor.
The equation for the assessment of the blower power demand is the same as for the pump, considering the air flow rate instead of the water flow rate:
The cooler was designed to cool the gas down to the column operating temperature. The equation used to assess the power needed for cooling the gas down is based on a simple energy balance on the unit:
3.4. TRNSYS Model
Finally, the simulation model of whole plant is developed in Transient System Simulation Tool (TRNSYS) enviroment. Here, for sake of brevity, only the main TRNSYS library is listed. Type 94 of the TRNSYS library was used to simulate the performance of PV panels. This model is based on the so-called “four parameters” model, and can be used to simulate single or polycrystalline silicon PV systems involving electrical storage batteries, and direct load coupling and utility grid connections. For further details see ref. [66].
Type 47 of the TRNSYS library was used to simulate the electric energy storage system by using the Shepard mathematic model. Note that the storage system model related to Type 47 is suitable to model lead acid batteries. In order to simulate a lithium-ion battery, the parameters of Type 47 are modified to fit the performance of a commercial lithium battery according to the work available in Ref. [67].
The dynamic simulations are carried out by taking into account the hourly Meteonorm weather data files for the weather zone of Stuttgart (Germany) in order to simulate the performance of the components of the plant featured by weather dependent parameters.
3.5. Thermoeconomic Model
The model includes the assessment of the capital cost of the upgrading unit and auxiliaries as well as the operating costs due to the maintenance and replacement of components and electric energy consumption. The capital cost of the scrubber system is a function of the treated biogas volumetric flow rate. Considering a specific cost of 5400 €/Nm3/h [68], the total capital cost, Iscrubber, is 427.50 k€. The capital cost of the PV panels and electric energy storage system are equal to 1000 €/kW and 200 €/kWh, respectively, according to Ref. [69]. For the membrane system, the total capital cost, Imembrane, considers the cost of pumps, compressors and the membranes in area A. The membranes area A depends on the compression ratio of the various stages and the specific cost per m2 of the selected membrane. A polymide membrane is selected, featured by a specific cost Cmembrane of 50 €/m2 [70]. The designed area considers that the outlet biomethane only includes CO2 at 2% and considers the inlet biogas flow rate Ffeed (Nm3/s), the pressure difference ΔP (Pa) between the inlet and outles sections of the mebrane, and the average permeability of the biogas Qav (GPU, gas permeance unit) (weighted according to the fractions of biogas components xi,feed and the related permeability Qi) [70]. The equation for the calculation of the membrane area cost is reported as follows [60]:
The pumps and the compressors are selected according to the pressure drop and the flow rate of the biogas. Then, these devices are selected from the “Fini” and “Salmson” data sheet and price lists [71]. The maintenance cost of the scrubber system is assumed to be equal to 9% of the total capital cost Iscrubber [70], whereas for the membrane systems, the membrane replacement cost (MRC) is considered according to a yearly replacement rate (ν), equal to 0.25, and a membrane replacement price (Kmr) equal to 25 €/m2 [70]:
The yearly maintenance costs of pumps and compressors are assumed to be 1% of the capital cost. The specific cost of the electric energy withdrawn from the grid is assumed equal to 0.20 €/kWh [72].
The economic analysis is based on the evaluation of the basic economic indexes used to evaluate the economic feasibility of energy plants, i.e., the simple payback (SPB), net present value (NPV), and the profit index (PI). The NPV index is evaluated considering a lifetime of 10 years and a discount factor of 5%. CHP electric and thermal rated efficiency are 43% and 44.9%, respectively [23]. The specific capital cost of the cogenerator is 1700 €/kWe [61]. The yearly maintenance cost is equal to 2% of the capital cost (357.5 k€/y).
To evaluate the primary energy and operating costs of the cogenerator, the approach considered in the ref. [61] is implemented. In particular, the avoided CO2 emissions, primary energy, and costs are estimated considering that the energy outputs of the cogenerator will be matched by the national electric grid with a rated electric efficiency equal to 46% and a gas-fired boiler with a rated thermal efficiency equal to 95% [73].
A selling price for the produced thermal energy equal to 0.05 €/kWh is assumed; however, three reference scenarios are evaluated considering different fractions of recovered thermal energy with respect to the total produced thermal energy, i.e., 0%, 50% and 100%. To consider this variation of the thermal recovery from the cogenerator, a sensitivity analysis is carried out, varying the thermal fraction as follows:
The selling price of the produced electric energy by cogenerator is considered variable from 0.06 to 0.17 €/kWh, as well as the selling price of the biomethane in proposed systems from 0.20 to 0.40 €/Sm3, in order to estimate the economic feasibility of the proposed systems according to several feed-in tariff policies. Table 1 shows all the parameters adopted in the thermoeconomic analysis discussed above.
4. Case Study
As discussed before in the section System Layout, three different biogas upgrading plants are studied and compared. Such plants are coupled with a sewage sludge treatment plant located in Stuttgart (Baden-Wuttemberg, Germany). This plant is equipped with an anaerobic digester producing biogas from sewage sludge. In particular, such plant pruduces rougly 83.46 Sm3/h of biogas, which consist of 62% of CH4 and 38% of CO2, Table 2. Despite the variability of the biogas flow rate, it is assumed that the investigated biogas upgrading systems are supplied by a fixed flow rate of biogas. This assumption is consistent with the use of a gasometer and a buffer tank included between the digester and the biogas upgrading unit as buffer, making the inlet flow rate constant and equal to the average value of 83.46 Sm3/h (Table 2). Regarding the biogas temperature trend, it was less variable with respect to the flow rate trend due to the high volume of the digester and the high specific heat of the contained mass. The renewable plant includes a PV field with a rated efficiency of 18% and a lithium-ion battery, and their parameters are reported in Table 2. The proposed layout performances are compared against the current state of the art in a biogas power plant, which consists of a cogeneration plant. When the biogas is used by a cogeneration reciprocating engine, heat and electricity are simultaneously produced. In particular, the cogenerator is supplied by a constant flow rate of biogas, which is the same of the proposed layouts, i.e., 83.46 Sm3/h. The cogenerator is featured by a rated power of 210.3 kW (Table 2 [23]) and produces 1842.25 MWh/year of electric energy and 1923.65 MWh/year of thermal energy, which are delivered to the electric grid and to local facilities, respectively.
5. Results
This section is divided into two subsections. In the first one, the optimal response surfaces for all the considered biogas upgrading plants are evaluated and discussed. In the second one, the optimal layouts are compared against the current state of the art in biogas power plants, i.e., a cogenerator burning biogas for producing thermal energy and electricity. The electricity and the thermal energy produced are exported.
5.1. Optimal Response Surface
This study aims at detecting the optimal response surfaces of the proposed layouts by means of the response surface methodology [74]. Such an approach is able to display the response, i.e., object functions, of complex layouts and systems using empirical and numerical methods [75]. Therefore, this approach is able to figure out the optimal configurations [75,76]. Thus, this approach can be exploited for detecting the Pareto frontier of the studied system [76,77]. In order to detect the optimal response surface of the proposed renewable layout based on water scrubbing upgrading technology (water scrubbing plant WSP), the operative pressure of the scrubber (see System Model and System Layout) is varied from 1.20 bar to 20 bar, the photovoltaic field capacity is varied from 10 kW to 400 kW and the battery capacity is varied from 91 kWh to 569 kWh.
Figure 4 summarizes the results of these analyses, displaying the selected object functions, namely costs (C) and primary energy (PE). Note that the operating costs are negative because the savings due to the biomethane exporting and energy saving certificates overcame the plant operating costs due to maintenance and the purchasing of electric energy. PE is negative for similar reasons; in fact, the primary energy linked with the volume of biomethane exported is significantly higher than the primary energy consumption due to the electricity withdrawn from the grid.
Figure 4 displays the Pareto Frontier [75,76]: the optimal layout, achieving a C of −488 k€/year and a PE of 5.22 GWh/year, consists of a rated operative pressure of 1.20 bar, a PV field of capacity of approximately 200 kW and a lithium-ion battery of a capacity of roughly 182 kWh. In particular, this layout is featured by the lower bound of the operative pressure. In fact, the plant performance worsens as the scrubber operative pressure increases. This trend is related to the fact that the increase of the scrubber operative pressure leads to a negligible enhancement in biomethane quality (i.e., percentage of CO2) and a negligible increase of biomethane production. The increase of the operative pressure reduces the height of the scrubber column: the desired purity of biomethane (i.e., CO2 concentration less equal to 2%) is achieved by a shorter scrubber column. However, the investment cost of the plant does not depend on the height of the scrubber column, but it depends only on the volume of biogas processed by the plant [68]. At the same time, the increase of operative pressure leads to a significant increase of the plant power demand.
The fact that the optimal layout is featured by a PV field capacity of 200 kW and a battery capacity of 182 kWh is clearly explained by Figure 5. In particular, Figure 5 displays the energy performances of the WSP when the PV field capacity and battery capacity are simultaneously varied, and the operative pressure is equal to 1.20 bar. The best layout is able to maximize the share of the plant electricity demand (Eel,LOAD) matched by the self-consumed energy (Eel,self), almost limiting the surplus electricity exported to the grid (Eel,toGRID). In fact, for such a configuration, the self-consumed energy meets roughly 92% of the plant load, while 64% of the produced renewable electricity (Eel,PV) is exported to the grid. In particular, such a layout is almost grid-independent, as the battery (Pel,fromLIB) is able to match the plant power demand (Pel,LOAD) throughout the day, as shown in Figure 6. According to these results, the battery is crucial in achieving the grid-independence: the share of plant electricity demand matched by the battery ranges from 50% to 60% on a monthly basis, as shown in Figure 6.
A larger PV field further increases the surplus electricity without significantly reducing the electricity withdrawn from the grid. This trend worsens the economic performance of the renewable plant. In fact, the increase of the PV field capacity increases the maintenance costs, which overcomes the gains due to electricity exporting for larger PV field capacity. In fact, as shown in Figure 6, the battery would not be able to store a further share of photovoltaic electricity. Concerning the electric energy storage system, the plant is not able to exploit the discharge depth of high-capacity LIB because of the low-rated power demand of the WSP using 1.20 bara as the operative pressure.
Figure 7 displays the optimal response surface for the renewable plant adopting two-stage and three-stage membrane separation upgrading technology (2SMP and 3SMP). The layouts featured by the higher operating pressure and the higher battery and PV capacity achieve the best results for 2SMP, i.e., a PE of roughly −5.02 GWh/year and a C of about −483 k€/year. This result is related with the fact that the increase of the operating pressure improves the amount of biomethane produced by this kind of plant. In fact, the higher the pressure the higher the driving force of the membrane separation process (see System Model). This allows the membrane to separate a higher share of CH4 from the biogas mixture.
Higher operating pressures lead to higher power demand for plant compressors. Therefore, the plant adopting a higher operative pressure is able to exploit a higher share of the produced renewable electricity. In fact, as clearly displayed in Figure 8, the plant adopting an operative pressure of 20 bar, a PV field capacity of 400 kW and a battery capacity of 365 kWh is able to self-consume almost 50% of the produced electricity (see Eel,toGRID/Eel,PV Figure 8). At the same time, roughly 90% of plant electricity demand is met by the self-consumed electricity (Eel,self). This point is clearly displayed by Figure 9. In fact, the photovoltaic field (Pel,PV) with the lithium-ion battery (Pel,fromLIB) meets the power load (Pel,LOAD) throughout the day without withdrawing electricity from the grid (Pel,fromGRID), Figure 9. According to the aforementioned trends, the plant is almost grid self-independent from February to October. The battery plays a crucial role in such a plant, matching around 40 ÷ 60% of Eel,LOAD, Figure 9.
Figure 10 displays the energy performance of the proposed renewable plant adopting a two-stage membrane biogas upgrading process for a storage system capacity of 364 kWh and a simultaneously varying system-rated pressure and photovoltaic capacity. This figure is consistent with the above described trends. In fact, as explained before, the increase of the rated operating pressure significantly increases the plant power demand, allowing the plant to exploit a higher share of renewable produced electricity (see also Figure 9). Then, for higher operating pressure and higher PV field, the electricity exported to the grid (Eel,toGRID) is limited, but the self-produced electricity (Eel,self) matches roughly 90% of the plant electricity demand.
The optimal response surface and the Pareto frontier for 3SMP is displayed in Figure 7. The optimal 3SMP consists of a rated pressure of 10 bar, a PV field of 400 kW and a battery capacity of 365 kWh. The operative costs (C) of this plant are around −486 k€/year, while the primary energy (PE) is around −5.06 GWh/year. The increase of the operative pressure leads to a decrease of the plant’s overall performance because of the significant increasing of the power demand of the plant, due to the compressors. At the same time, this increase causes a very limited enhancement in biomethane production and quality. In other words, the marginal electric cost of biomethane production rapidly increases beyond 10 bar. The fact that the 3SMP with an operative pressure of 10 bar achieves best results with respect to 2SMP adopting an operative pressure of 20 bar (the optimal 2 stage membrane separation layout) is related with the fact that such 3SMP uses less electricity for producing more biomethane. In fact, 2SMP is featured by a rated specific production ratio of 0.38 kWh/Sm3, whereas 3SMP is featured by a specific production ratio of 0.36 kWh/Sm3. Moreover, since the increase in the upgrading plants’ number of stages leads to an enhancement in the purity of the biomethane produced, the 3SMP achieves better results with respect to 2SMP, adopting a lower operative pressure, i.e., 10 bar vs 20 bar. These results are consistent with the results and studies available in the open literature [78,79]. However, more stages lead to greater technological complexity of the plant due to the higher number of compressors and sensors. Therefore, in this framework, 3SMP may be considered the optimal tradeoff among biomethane purity and plant complexity.
The fact that the 2SMP optimal layouts is featured by the upper bound of the PV field and the battery capacity is equal to 364 kWh is for the same reasons as discussed above for 2SMP. These trends are shown in Figure 11 and Figure 12. In fact, these figures highlight that the system is almost grid independent, in particular 90% of the plant energy demand is matched by the produced electricity (Figure 11). In fact, the battery is able to store a significant amount of the surplus renewable power produced by the PV field and to use this stored energy for matching the plant electricity demand for the whole day (Figure 12).
Figure 13 displays the energy results for the three-stage membrane separation biogas upgrading plant integrated with a battery capacity of 364 kWh, varying the rated operating pressure and the capacity of the photovoltaic field. This figure is consistent with the trend discussed above and confirms that the layout adopting a rated pressure of 10 bar is the optimal one. In this case, roughly 90% of Eel,LOAD is matched by the self-produced electricity. The increase of the operative pressure leads to a significant increase of plant power demand, reducing the share of Eel,LOAD met by the renewable electricity. Finally, comparing WSP, 2SMP and 2SMP, the first one achieves better results. These trends are related with the lower demand of energy of water scrubbing (WS) technology with respect to membrane separation (MS) technology. In particular, MS achieves the same volume of biomethane production using a lower amount of electricity. In particular, WS has a specific production cost of 0.16 kWh/Sm3, whereas two-stage MS and three-stage MS have a specific production ratio of 0.38 kWh/Sm3 and 0.36 kWh/Sm3, respectively.
Considering the integration of MS and WS with the renewable plant including a photovoltaic field and a lithium-ion battery, the specific production ratio dramatically decreases. In particular, the optimal WS layout achieves a ratio of 0.009 kWh/Sm3, whereas the optimal two-stage and three-stage MS achieves a ratio of 0.020 kWh/Sm3 and 0.018 kWh/Sm3. These values are significantly lower with respect to the ones available in the literature due to the adoption of renewable energy sources.
5.2. Energy and Economic Analysis
The optimal layouts assessed in the previous section are compared with the conventional state of the art in a biogas power plant, which consists of a reciprocating engine burning the produced biogas (CHP). The electricity produced by such an engine is exported to the electric national grid, getting fees that may range from 0.06 €/kWh to 0.22 €/kWh. The thermal energy recovered from the engine is purchased by local facilities, with a selling price of 0.05 €/kWh. The ratio of thermal energy exported is varied according to the parameter α, see Equation (13).
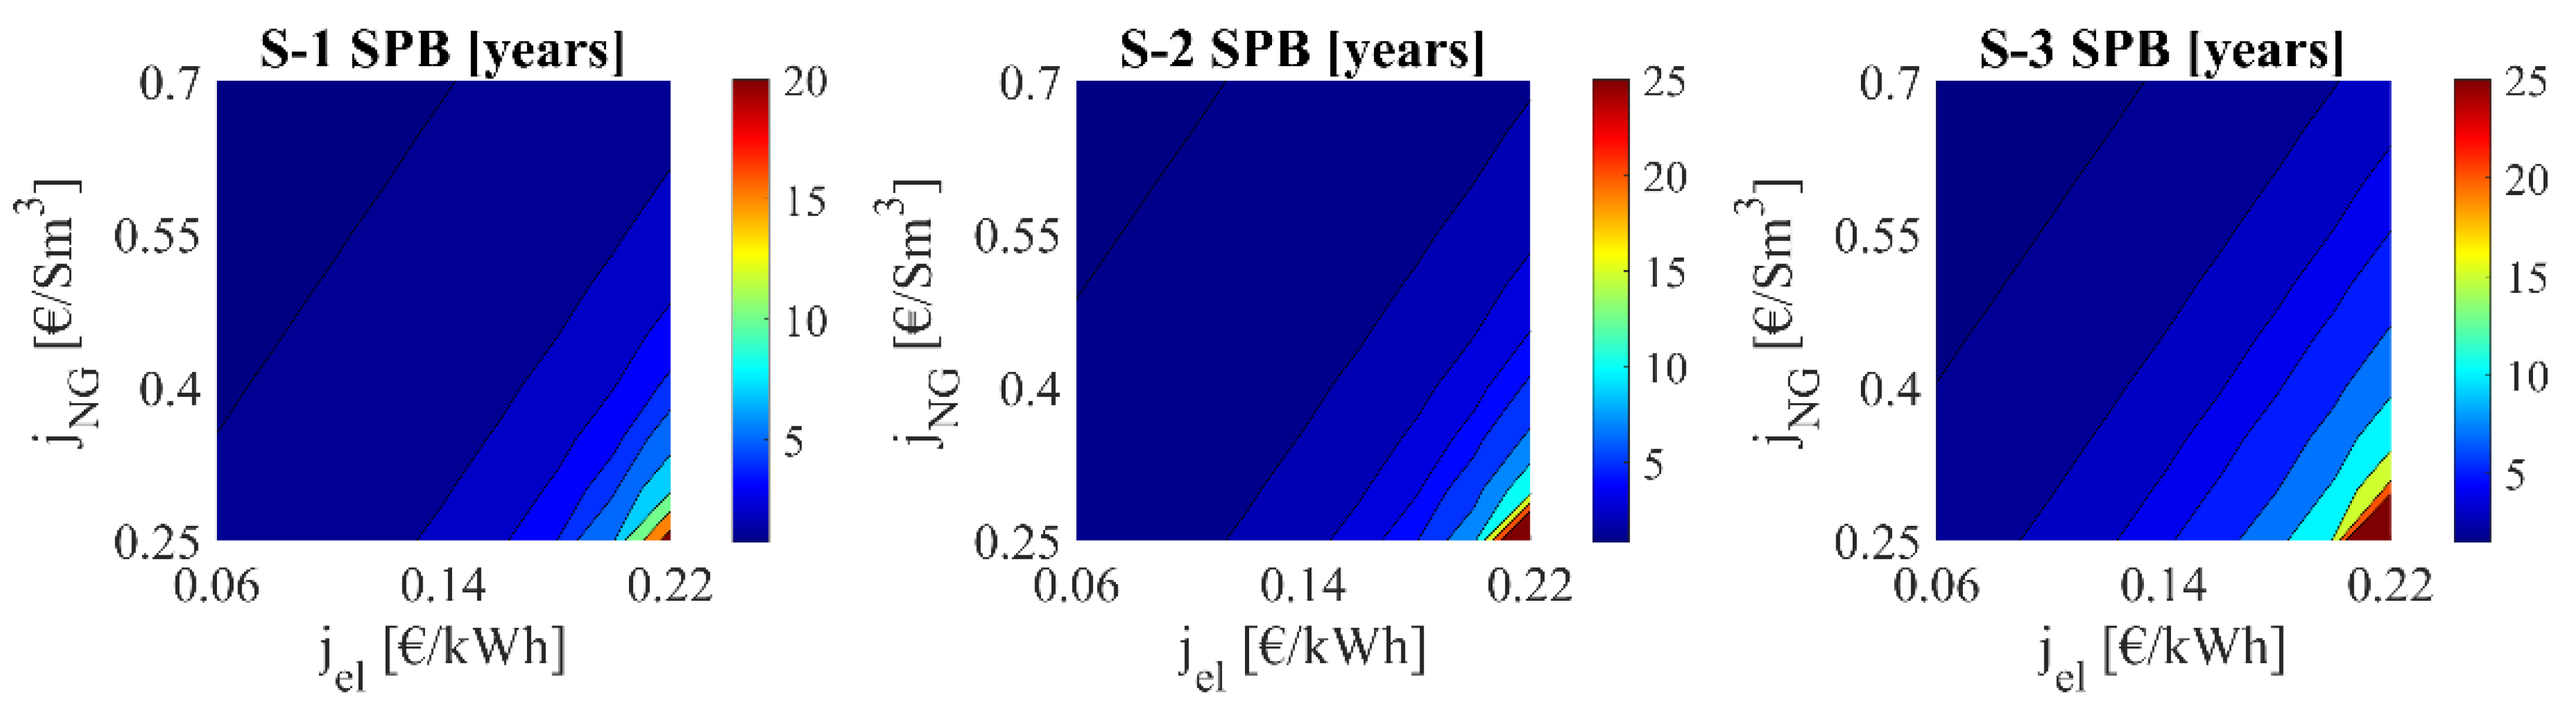
As expected, the increase of the parameter α leads to a significant enhancement of the reference system, i.e., the cogeneration plant, letting CHP achieve better results with respect to the proposed optimal scenarios. In fact, for value of α greater than 0.50, PES becomes negative, which means that the avoided primary energy of CHP is greater than the proposed scenarios, as shown in Figure 14. Therefore, the ratio of thermal energy exported to local users is crucial, in fact such point is able to make the conventional approach of burning biogas into a CHP plant more energy convenient with respect to every biogas upgrading strategy. This result is deeply related with the fact that the biogas upgrading process is remarkably energy demanding. Note that the surplus electricity exported to the grid is limited, accounting for less than 13% of the avoided primary energy for all proposed scenarios. Finally, Figure 14 confirms that the water scrubbing process reaches better results from the energy point of view. Figure 15 summarizes the economic performance of the proposed optimal scenarios compared with CHP. In particular, the electricity and natural gas selling costs are mutually varied. The economic performance of the analyzed scenarios is dramatically affected by the natural gas selling price (jNG). In fact, for a value of jNG greater than 0.55 €/Sm3, all the scenarios achieve a SPB lower than 10 years, regardless the electric energy selling cost and the share of thermal energy exported.
However, when the thermal energy exported increases and jel increases, the RS is much more convenient than the proposed scenarios, achieving a higher amount of savings. Finally, Figure 15 confirms that water scrubbing biomethane upgrading technology achieves better results with respect to membrane separation, since it is less energy demanding. Therefore, the water scrubbing plant purchases less electricity by the grid. Moreover, water scrubbing is featured by lower costs for maintenance. The membrane separation process involves very high costs for maintenance [70].
6. Conclusions
This work presents a comparison between two biogas upgrading technologies coupled with photovoltaic panels and an electric energy storage system: the water scrubbing and the membrane separation systems. The water scrubbing solution showed the best results: an operating pressure of 1.20 bar, a photovoltaic field of 200 kW and a lithium-ion battery of 182 kWh. This layout achieves a primary energy of −5.22 GWh/year and a yearly cost of −488 k€/year. This plant arrangement was grid-independent, producing enough electricity to be able to meet about 92% of the plant demand.
The comparison with the conventional plant highlighted that:
- when the share of thermal energy exported by the reference system is equal to zero, the assessed optimal scenarios achieve a primary energy saving index ranging at about 27%;
- when the biomethane exporting price is greater than 0.55 €/Sm3, the simple payback is lower than 10 years, regardless of the electric energy exporting prices and the share of thermal energy exported.
Author Contributions
Conceptualization, F.L.C. and M.V.; Data curation, F.L.C., L.C., M.N. and M.V.; Investigation, L.C.; Supervision, F.L.C. and M.V.; Validation, F.L.C. and L.C.; Writing—original draft, F.L.C., L.C., M.N. and M.V.; Writing—review & editing, F.L.C., L.C., M.N. and M.V. All authors have read and agreed to the published version of the manuscript.
Funding
This research received no external funding.
Conflicts of Interest
The authors declare no conflict of interest.
References
- Garcia, D.J.; You, F. Addressing global environmental impacts including land use change in life cycle optimization: Studies on biofuels. J. Clean. Prod. 2018, 182, 313–330. [Google Scholar] [CrossRef]
- Shen, Y.; Linville, J.L.; Urgun-Demirtas, M.; Mintz, M.M.; Snyder, S.W. An overview of biogas production and utilization at full-scale wastewater treatment plants (WWTPs) in the United States: Challenges and opportunities towards energy-neutral WWTPs. Renew. Sustain. Energy Rev. 2015, 50, 346–362. [Google Scholar] [CrossRef] [Green Version]
- Salman, C.A.; Naqvi, M.; Thorin, E.; Yan, J. Impact of retrofitting existing combined heat and power plant with polygeneration of biomethane: A comparative techno-economic analysis of integrating different gasifiers. Energy Convers. Manag. 2017, 152, 250–265. [Google Scholar] [CrossRef]
- Wang, J.; You, S.; Zong, Y.; Træholt, C.; Dong, Z.Y.; Zhou, Y. Flexibility of combined heat and power plants: A review of technologies and operation strategies. Appl. Energy 2019, 252, 113445. [Google Scholar] [CrossRef]
- Picardo, A.; Soltero, V.M.; Peralta, M.E.; Chacartegui, R. District heating based on biogas from wastewater treatment plant. Energy 2019, 180, 649–664. [Google Scholar] [CrossRef]
- Calise, F.; Cappiello, F.L.; Cimmino, L.; d’Accadia, M.D.; Vicidomini, M. A Review of the State of the Art of Biomethane Production: Recent Advancements and Integration of Renewable Energies. Energies 2021, 14, 4895. [Google Scholar] [CrossRef]
- Sinigaglia, T.; Pedrozo, V.B.; Rovai, F.F.; Guilherme, R.T.G.; Lanzanova, T.D.M.; Martins, M.E.S. Current scenario and outlook for biogas and natural gas businesses in the mobility sector in Brazil. Int. J. Hydrogen Energy 2022, 47, 12074–12095. [Google Scholar] [CrossRef]
- Hollas, C.E.; do Amaral, K.G.C.; Lange, M.V.; Higarashi, M.M.; Steinmetz, R.L.R.; Barros, E.C.; Mariani, L.F.; Nakano, V.; de Martino Jannuzzi, G.; Pereira, A.S.; et al. Life cycle assessment of waste management from the Brazilian pig chain residues in two perspectives: Electricity and biomethane production. J. Clean. Prod. 2022, 354, 131654. [Google Scholar] [CrossRef]
- Ioannou-Ttofa, L.; Foteinis, S.; Moustafa, A.S.; Abdelsalam, E.; Samer, M.; Fatta-Kassinos, D. Life cycle assessment of household biogas production in Egypt: Influence of digester volume, biogas leakages, and digestate valorization as biofertilizer. J. Clean. Prod. 2021, 286, 125468. [Google Scholar] [CrossRef]
- Gabisa, E.W.; Gheewala, S.H. Potential, environmental, and socio-economic assessment of biogas production in Ethiopia: The case of Amhara regional state. Biomass Bioenergy 2019, 122, 446–456. [Google Scholar] [CrossRef]
- Garfí, M.; Castro, L.; Montero, N.; Escalante, H.; Ferrer, I. Evaluating environmental benefits of low-cost biogas digesters in small-scale farms in Colombia: A life cycle assessment. Bioresour. Technol. 2019, 274, 541–548. [Google Scholar] [CrossRef] [PubMed]
- Sfez, S.; De Meester, S.; Dewulf, J. Co-digestion of rice straw and cow dung to supply cooking fuel and fertilizers in rural India: Impact on human health, resource flows and climate change. Sci. Total Environ. 2017, 609, 1600–1615. [Google Scholar] [CrossRef] [PubMed]
- Ramírez-Arpide, F.R.; Demirer, G.N.; Gallegos-Vázquez, C.; Hernández-Eugenio, G.; Santoyo-Cortés, V.H.; Espinosa-Solares, T. Life cycle assessment of biogas production through anaerobic co-digestion of nopal cladodes and dairy cow manure. J. Clean. Prod. 2018, 172, 2313–2322. [Google Scholar] [CrossRef]
- Yasar, A.; Rasheed, R.; Tabinda, A.B.; Tahir, A.; Sarwar, F. Life cycle assessment of a medium commercial scale biogas plant and nutritional assessment of effluent slurry. Renew. Sustain. Energy Rev. 2017, 67, 364–371. [Google Scholar] [CrossRef]
- Govender, I.; Thopil, G.A.; Inglesi-Lotz, R. Financial and economic appraisal of a biogas to electricity project. J. Clean. Prod. 2019, 214, 154–165. [Google Scholar] [CrossRef]
- Aguilera, P.G.; Gutiérrez Ortiz, F.J. Techno-economic assessment of biogas plant upgrading by adsorption of hydrogen sulfide on treated sewage–sludge. Energy Convers. Manag. 2016, 126, 411–420. [Google Scholar] [CrossRef]
- Angelidaki, I.; Treu, L.; Tsapekos, P.; Luo, G.; Campanaro, S.; Wenzel, H.; Kougias, P.G. Biogas upgrading and utilization: Current status and perspectives. Biotechnol. Adv. 2018, 36, 452–466. [Google Scholar] [CrossRef] [Green Version]
- Nguela, M.; Junior, L.; Bakari, H.; Fadimatou, H.; Christophe, G.; Michaud, P. Storage and Upgrading of Biogas by Physicochemical Purification in a Sudano-Sahelian Context. Energies 2021, 14, 5855. [Google Scholar]
- Budzianowski, W.M.; Wylock, C.E.; Marciniak, P.A. Power requirements of biogas upgrading by water scrubbing and biomethane compression: Comparative analysis of various plant configurations. Energy Convers. Manag. 2017, 141, 2–19. [Google Scholar] [CrossRef] [Green Version]
- Patterson, T.; Esteves, S.; Dinsdale, R.; Guwy, A.; Maddy, J. Life cycle assessment of biohydrogen and biomethane production and utilisation as a vehicle fuel. Bioresour. Technol. 2013, 131, 235–245. [Google Scholar] [CrossRef]
- Abd, A.A.; Othman, M.R.; Shabbani, H.J.K.; Helwani, Z. Biomethane upgrading to transportation fuel quality using spent coffee for carbon dioxide capture in pressure swing adsorption. J. Environ. Chem. Eng. 2022, 10, 107169. [Google Scholar] [CrossRef]
- Calise, F.; Cappiello, F.; D’Agostino, D.; Vicidomini, M. A novel approach for the calculation of the energy savings of heat metering for different kinds of buildings. Energy Build. 2021, 252, 111408. [Google Scholar] [CrossRef]
- Cappiello, F.L.; Erhart, T.G. Modular cogeneration for hospitals: A novel control strategy and optimal design. Energy Convers. Manag. 2021, 237, 114131. [Google Scholar] [CrossRef]
- Norddahl, B.; Roda-Serrat, M.C.; Errico, M.; Christensen, K.V. Chapter 6—Membrane-based technology for methane separation from biogas. In Emerging Technologies and Biological Systems for Biogas Upgrading; Aryal, N., Ottosen, L.M., Kofoed, M.W., Pant, D., Eds.; Academic Press: Cambridge, MA, USA, 2021; pp. 117–157. [Google Scholar]
- Wang, H.; Ma, C.; Yang, Z.; Lu, X.; Ji, X. Improving high-pressure water scrubbing through process integration and solvent selection for biogas upgrading. Appl. Energy 2020, 276, 115462. [Google Scholar] [CrossRef]
- Marín, D.; Vega, M.; Lebrero, R.; Muñoz, R. Optimization of a chemical scrubbing process based on a Fe-EDTA-carbonate based solvent for the simultaneous removal of CO2 and H2S from biogas. J. Water Process Eng. 2020, 37, 101476. [Google Scholar] [CrossRef]
- Cavaignac, R.S.; Ferreira, N.L.; Guardani, R. Techno-economic and environmental process evaluation of biogas upgrading via amine scrubbing. Renew. Energy 2021, 171, 868–880. [Google Scholar] [CrossRef]
- Rebello, C.M.; Martins, M.A.; Rodrigues, A.E.; Loureiro, J.M.; Ribeiro, A.M.; Nogueira, I.B. A novel standpoint of Pressure Swing Adsorption processes multi-objective optimization: An approach based on feasible operation region mapping. Chem. Eng. Res. Des. 2022, 178, 590–601. [Google Scholar] [CrossRef]
- Spitoni, M.; Pierantozzi, M.; Comodi, G.; Polonara, F.; Arteconi, A. Theoretical evaluation and optimization of a cryogenic technology for carbon dioxide separation and methane liquefaction from biogas. J. Nat. Gas Sci. Eng. 2019, 62, 132–143. [Google Scholar] [CrossRef]
- Naquash, A.; Qyyum, M.A.; Haider, J.; Bokhari, A.; Lim, H.; Lee, M. State-of-the-art assessment of cryogenic technologies for biogas upgrading: Energy, economic, and environmental perspectives. Renew. Sustain. Energy Rev. 2022, 154, 111826. [Google Scholar] [CrossRef]
- Khan, M.U.; Lee, J.T.E.; Bashir, M.A.; Dissanayake, P.D.; Ok, Y.S.; Tong, Y.W.; Shariati, M.A.; Wu, S.; Ahring, B.K. Current status of biogas upgrading for direct biomethane use: A review. Renew. Sustain. Energy Rev. 2021, 149, 111343. [Google Scholar] [CrossRef]
- Qyyum, M.A.; Haider, J.; Qadeer, K.; Valentina, V.; Khan, A.; Yasin, M.; Aslam, M.; De Guido, G.; Pellegrini, L.A.; Lee, M. Biogas to liquefied biomethane: Assessment of 3P’s—Production, processing, and prospects. Renew. Sustain. Energy Rev. 2020, 119, 109561. [Google Scholar] [CrossRef]
- Lim, Y.-G.; Bak, C.-u.; Kim, Y.-D. Comprehensive experimental and theoretical insights into the performance of polysulfone hollow-fiber membrane modules in biogas purification process. Chem. Eng. J. 2022, 433, 134616. [Google Scholar] [CrossRef]
- Kapoor, R.; Ghosh, P.; Kumar, M.; Vijay, V.K. Evaluation of biogas upgrading technologies and future perspectives: A review. Environ. Sci. Pollut. Res. 2019, 26, 11631–11661. [Google Scholar] [CrossRef] [PubMed]
- Bauer, F.; Persson, T.; Hulteberg, C.; Tamm, D. Biogas upgrading—Technology overview, comparison and perspectives for the future. Biofuels Bioprod. Biorefin. 2013, 7, 499–511. [Google Scholar] [CrossRef]
- Žák, M.; Bendová, H.; Friess, K.; Bara, J.E.; Izák, P. Single-step purification of raw biogas to biomethane quality by hollow fiber membranes without any pretreatment—An innovation in biogas upgrading. Sep. Purif. Technol. 2018, 203, 36–40. [Google Scholar] [CrossRef]
- Peppers, J.; Li, Y.; Xue, J.; Chen, X.; Alaimo, C.; Wong, L.; Young, T.; Green, P.G.; Jenkins, B.; Zhang, R.; et al. Performance analysis of membrane separation for upgrading biogas to biomethane at small scale production sites. Biomass Bioenergy 2019, 128, 105314. [Google Scholar] [CrossRef]
- Scholz, M.; Melin, T.; Wessling, M. Transforming biogas into biomethane using membrane technology. Renew. Sustain. Energy Rev. 2013, 17, 199–212. [Google Scholar] [CrossRef]
- Makaruk, A.; Miltner, M.; Harasek, M. Membrane biogas upgrading processes for the production of natural gas substitute. Sep. Purif. Technol. 2010, 74, 83–92. [Google Scholar] [CrossRef]
- Kancherla, R.; Nazia, S.; Kalyani, S.; Sridhar, S. Modeling and simulation for design and analysis of membrane-based separation processes. Comput. Chem. Eng. 2021, 148, 107258. [Google Scholar] [CrossRef]
- Daniel-David, D.; Guerton, F.; Dicharry, C.; Torré, J.P.; Broseta, D. Hydrate growth at the interface between water and pure or mixed CO2/CH4 gases: Influence of pressure, temperature, gas composition and water-soluble surfactants. Chem. Eng. Sci. 2015, 132, 118–127. [Google Scholar] [CrossRef] [Green Version]
- Pan, Z.; Zhang, N.; Zhang, W.; Zhang, Z. Simultaneous removal of CO2 and H2S from coalbed methane in a membrane contactor. J. Clean. Prod. 2020, 273, 123107. [Google Scholar] [CrossRef]
- Üresin, E.; Saraç, H.İ.; Sarıoğlan, A.; Ay, Ş.; Akgün, F. An experimental study for H2S and CO2 removal via caustic scrubbing system. Process Saf. Environ. Prot. 2015, 94, 196–202. [Google Scholar] [CrossRef]
- Ryckebosch, E.; Drouillon, M.; Vervaeren, H. Techniques for transformation of biogas to biomethane. Biomass Bioenergy 2011, 35, 1633–1645. [Google Scholar] [CrossRef]
- Kapoor, R.; Subbarao, P.M.V.; Vijay, V.K. Integration of flash vessel in water scrubbing biogas upgrading system for maximum methane recovery. Bioresour. Technol. Rep. 2019, 7, 100251. [Google Scholar] [CrossRef]
- Sun, Q.; Li, H.; Yan, J.; Liu, L.; Yu, Z.; Yu, X. Selection of appropriate biogas upgrading technology-a review of biogas cleaning, upgrading and utilisation. Renew. Sustain. Energy Rev. 2015, 51, 521–532. [Google Scholar] [CrossRef]
- Golmakani, A.; Nabavi, S.A.; Wadi, B.; Manovic, V. Advances, challenges, and perspectives of biogas cleaning, upgrading, and utilisation. Fuel 2022, 317, 123085. [Google Scholar] [CrossRef]
- Esposito, E.; Dellamuzia, L.; Moretti, U.; Fuoco, A.; Giorno, L.; Jansen, J.C. Simultaneous production of biomethane and food grade CO2 from biogas: An industrial case study. Energy Environ. Sci. 2019, 12, 281–289. [Google Scholar] [CrossRef]
- González-Arias, J.; Baena-Moreno, F.M.; Pastor-Pérez, L.; Sebastia-Saez, D.; Fernández, L.M.G.; Reina, T. Biogas upgrading to biomethane as a local source of renewable energy to power light marine transport: Profitability analysis for the county of Cornwall. Waste Manag. 2022, 137, 81–88. [Google Scholar] [CrossRef]
- Starr, K.; Villalba, G.; Gabarrell, X. Upgraded biogas from municipal solid waste for natural gas substitution and CO2 reduction—A case study of Austria, Italy, and Spain. Waste Manag. 2015, 38, 105–116. [Google Scholar] [CrossRef]
- Budzianowski, W.M. A review of potential innovations for production, conditioning and utilization of biogas with multiple-criteria assessment. Renew. Sustain. Energy Rev. 2016, 54, 1148–1171. [Google Scholar] [CrossRef]
- Su, B.; Wang, H.; Zhang, X.; He, H.; Zheng, J. Using photovoltaic thermal technology to enhance biomethane generation via biogas upgrading in anaerobic digestion. Energy Convers. Manag. 2021, 235, 113965. [Google Scholar] [CrossRef]
- Tian, Z.; Hao, Y.; Li, W.; Campana, P.E.; Li, H.; Yan, J.; Jin, H. Integrating concentrating PVs in biogas upgrading. Energy Procedia 2018, 145, 598–603. [Google Scholar] [CrossRef]
- Curto, D.; Martín, M. Renewable based biogas upgrading. J. Clean. Prod. 2019, 224, 50–59. [Google Scholar] [CrossRef]
- Mahmudul, H.; Rasul, M.; Akbar, D.; Narayanan, R.; Mofijur, M. A comprehensive review of the recent development and challenges of a solar-assisted biodigester system. Sci. Total Environ. 2021, 753, 141920. [Google Scholar] [CrossRef] [PubMed]
- Khalid, Z.B.; Siddique, M.N.I.; Nasrullah, M.; Singh, L.; Wahid, Z.B.A.; Ahmad, M.F. Application of solar assisted bioreactor for biogas production from palm oil mill effluent co-digested with cattle manure. Environ. Technol. Innov. 2019, 16, 100446. [Google Scholar] [CrossRef]
- Zaied, B.; Nasrullah, M.; Siddique, N.I.; Zularisam, A.; Singh, L.; Krishnan, S. Co-digestion of palm oil mill effluent for enhanced biogas production in a solar assisted bioreactor: Supplementation with ammonium bicarbonate. Sci. Total Environ. 2020, 706, 136095. [Google Scholar] [CrossRef]
- Buysman, E. Anaerobic Digestion for Developing Countries with Cold Climates—Utilizing Solar Heat to Address Technical Challenges and Facilitating Dissemination through the Use of Carbon Finance. Master’s Thesis, University of Wageningen, Wageningen, The Netherlands, 2015. [Google Scholar]
- Ali, M.Y.; Hassan, M.; Rahman, M.A.; Kafy, A.A.; Ara, I.; Javed, A.; Rahman, M.R. Life cycle energy and cost analysis of small scale biogas plant and solar PV system in rural areas of Bangladesh. Energy Procedia 2019, 160, 277–284. [Google Scholar] [CrossRef]
- Gostoli, C. Processi a Membrana; University of Bologna: Bologna, Italy, 2022. [Google Scholar]
- Calise, F.; Cappiello, F.L.; D’Accadia, M.D.; Vicidomini, M. Concentrating photovoltaic/thermal collectors coupled with an anaerobic digestion process: Dynamic simulation and energy and economic analysis. J. Clean. Prod. 2021, 311, 127363. [Google Scholar] [CrossRef]
- Wylock, C.E.; Budzianowski, W.M. Performance evaluation of biogas upgrading by pressurized water scrubbing via modelling and simulation. Chem. Eng. Sci. 2017, 170, 639–652. [Google Scholar] [CrossRef]
- Nock, W.J.; Walker, M.; Kapoor, R.; Heaven, S. Modeling the Water Scrubbing Process and Energy Requirements for CO2 Capture to Upgrade Biogas to Biomethane. Ind. Eng. Chem. Res. 2014, 53, 12783–12792. [Google Scholar] [CrossRef] [Green Version]
- Tosun, İ. (Ed.) Chapter 11—Vapor–liquid equilibrium. In The Thermodynamics of Phase and Reaction Equilibria, 2nd ed.; Elsevier: Amsterdam, The Netherlands, 2021; pp. 365–478. [Google Scholar]
- Calise, F.; Cappiello, F.L.; D’Accadia, M.D.; Infante, A.; Vicidomini, M. Modeling of the Anaerobic Digestion of Organic Wastes: Integration of Heat Transfer and Biochemical Aspects. Energies 2020, 13, 2702. [Google Scholar] [CrossRef]
- Calise, F.; Fabozzi, S.; Vanoli, L.; Vicidomini, M. A sustainable mobility strategy based on electric vehicles and photovoltaic panels for shopping centers. Sustain. Cities Soc. 2021, 70, 102891. [Google Scholar] [CrossRef]
- Buonomano, A.; Calise, F.; Cappiello, F.; Palombo, A.; Vicidomini, M. Dynamic analysis of the integration of electric vehicles in efficient buildings fed by renewables. Appl. Energy 2019, 245, 31–50. [Google Scholar] [CrossRef]
- Bauer, F.; Hulteberg, C.; Persson, T.; Tamm, D. Biogas Upgrading—Review of Commercial Technologies; SGC Rapport; Svenskt Gastekniskt Center AB: Malmö, Sweden, 2013; Volume 270, 82p. [Google Scholar]
- Calise, F.; Cappiello, F.L.; Cartenì, A.; D’Accadia, M.D.; Vicidomini, M. A novel paradigm for a sustainable mobility based on electric vehicles, photovoltaic panels and electric energy storage systems: Case studies for Naples and Salerno (Italy). Renew. Sustain. Energy Rev. 2019, 111, 97–114. [Google Scholar] [CrossRef]
- Bozorg, M.; Ramírez-Santos, A.; Addis, B.; Piccialli, V.; Castel, C.; Favre, E. Optimal process design of biogas upgrading membrane systems: Polymeric vs high performance inorganic membrane materials. Chem. Eng. Sci. 2020, 225, 115769. [Google Scholar] [CrossRef]
- Fini, S. K-MAX Series Technical Data, in V60PU97FNM760, M. Service, Editor. 2020. Available online: https://www.finicompressors.com/it/ (accessed on 29 March 2022).
- Calise, F.; Cappiello, F.L.; D’Accadia, M.D.; Vicidomini, M. Thermo-economic optimization of a novel hybrid renewable trigeneration plant. Renew. Energy 2021, 175, 532–549. [Google Scholar] [CrossRef]
- Calise, F.; Cappiello, F.L.; D’Accadia, M.D.; Vicidomini, M. Smart grid energy district based on the integration of electric vehicles and combined heat and power generation. Energy Convers. Manag. 2021, 234, 113932. [Google Scholar] [CrossRef]
- Box, G.E.P.; Wilson, K.B. On the Experimental Attainment of Optimum Conditions. J. R. Stat. Soc. Ser. B Methodol. 1951, 13, 1–38. [Google Scholar] [CrossRef]
- Myers, R.H.; Montgomery, D.C.; Anderson-Cook, C.M. Response Surface Methodology: Process and Product Optimization Using Designed Experiments; John Wiley & Sons: Hoboken, NJ, USA, 2016. [Google Scholar]
- Goel, T.; Vaidyanathan, R.; Haftka, R.T.; Shyy, W.; Queipo, N.V.; Tucker, K. Response surface approximation of Pareto optimal front in multi-objective optimization. Comput. Methods Appl. Mech. Eng. 2007, 196, 879–893. [Google Scholar] [CrossRef]
- Hu, X.-B.; Gu, S.-H.; Zhang, C.; Zhang, G.-P.; Zhang, M.-K.; Leeson, M.S. Finding all Pareto optimal paths by simulating ripple relay race in multi-objective networks. Swarm Evol. Comput. 2021, 64, 100908. [Google Scholar] [CrossRef]
- Shin, M.S.; Jung, K.-H.; Kwag, J.-H.; Jeon, Y.-W. Biogas separation using a membrane gas separator: Focus on CO2 upgrading without CH4 loss. Process Saf. Environ. Prot. 2019, 129, 348–358. [Google Scholar] [CrossRef]
- Zito, P.F.; Brunetti, A.; Barbieri, G. Multi-step membrane process for biogas upgrading. J. Membr. Sci. 2022, 652, 120454. [Google Scholar] [CrossRef]
Figure 1.
Layout of the studied renewable driven biogas upgrading plant.

Figure 2.
Three stage membrane separation upgrading system configuration.

Figure 3.
Water scrubbing plant configuration.

Figure 4.
Optimal response surface and Pareto frontier: water scrubbing plant.
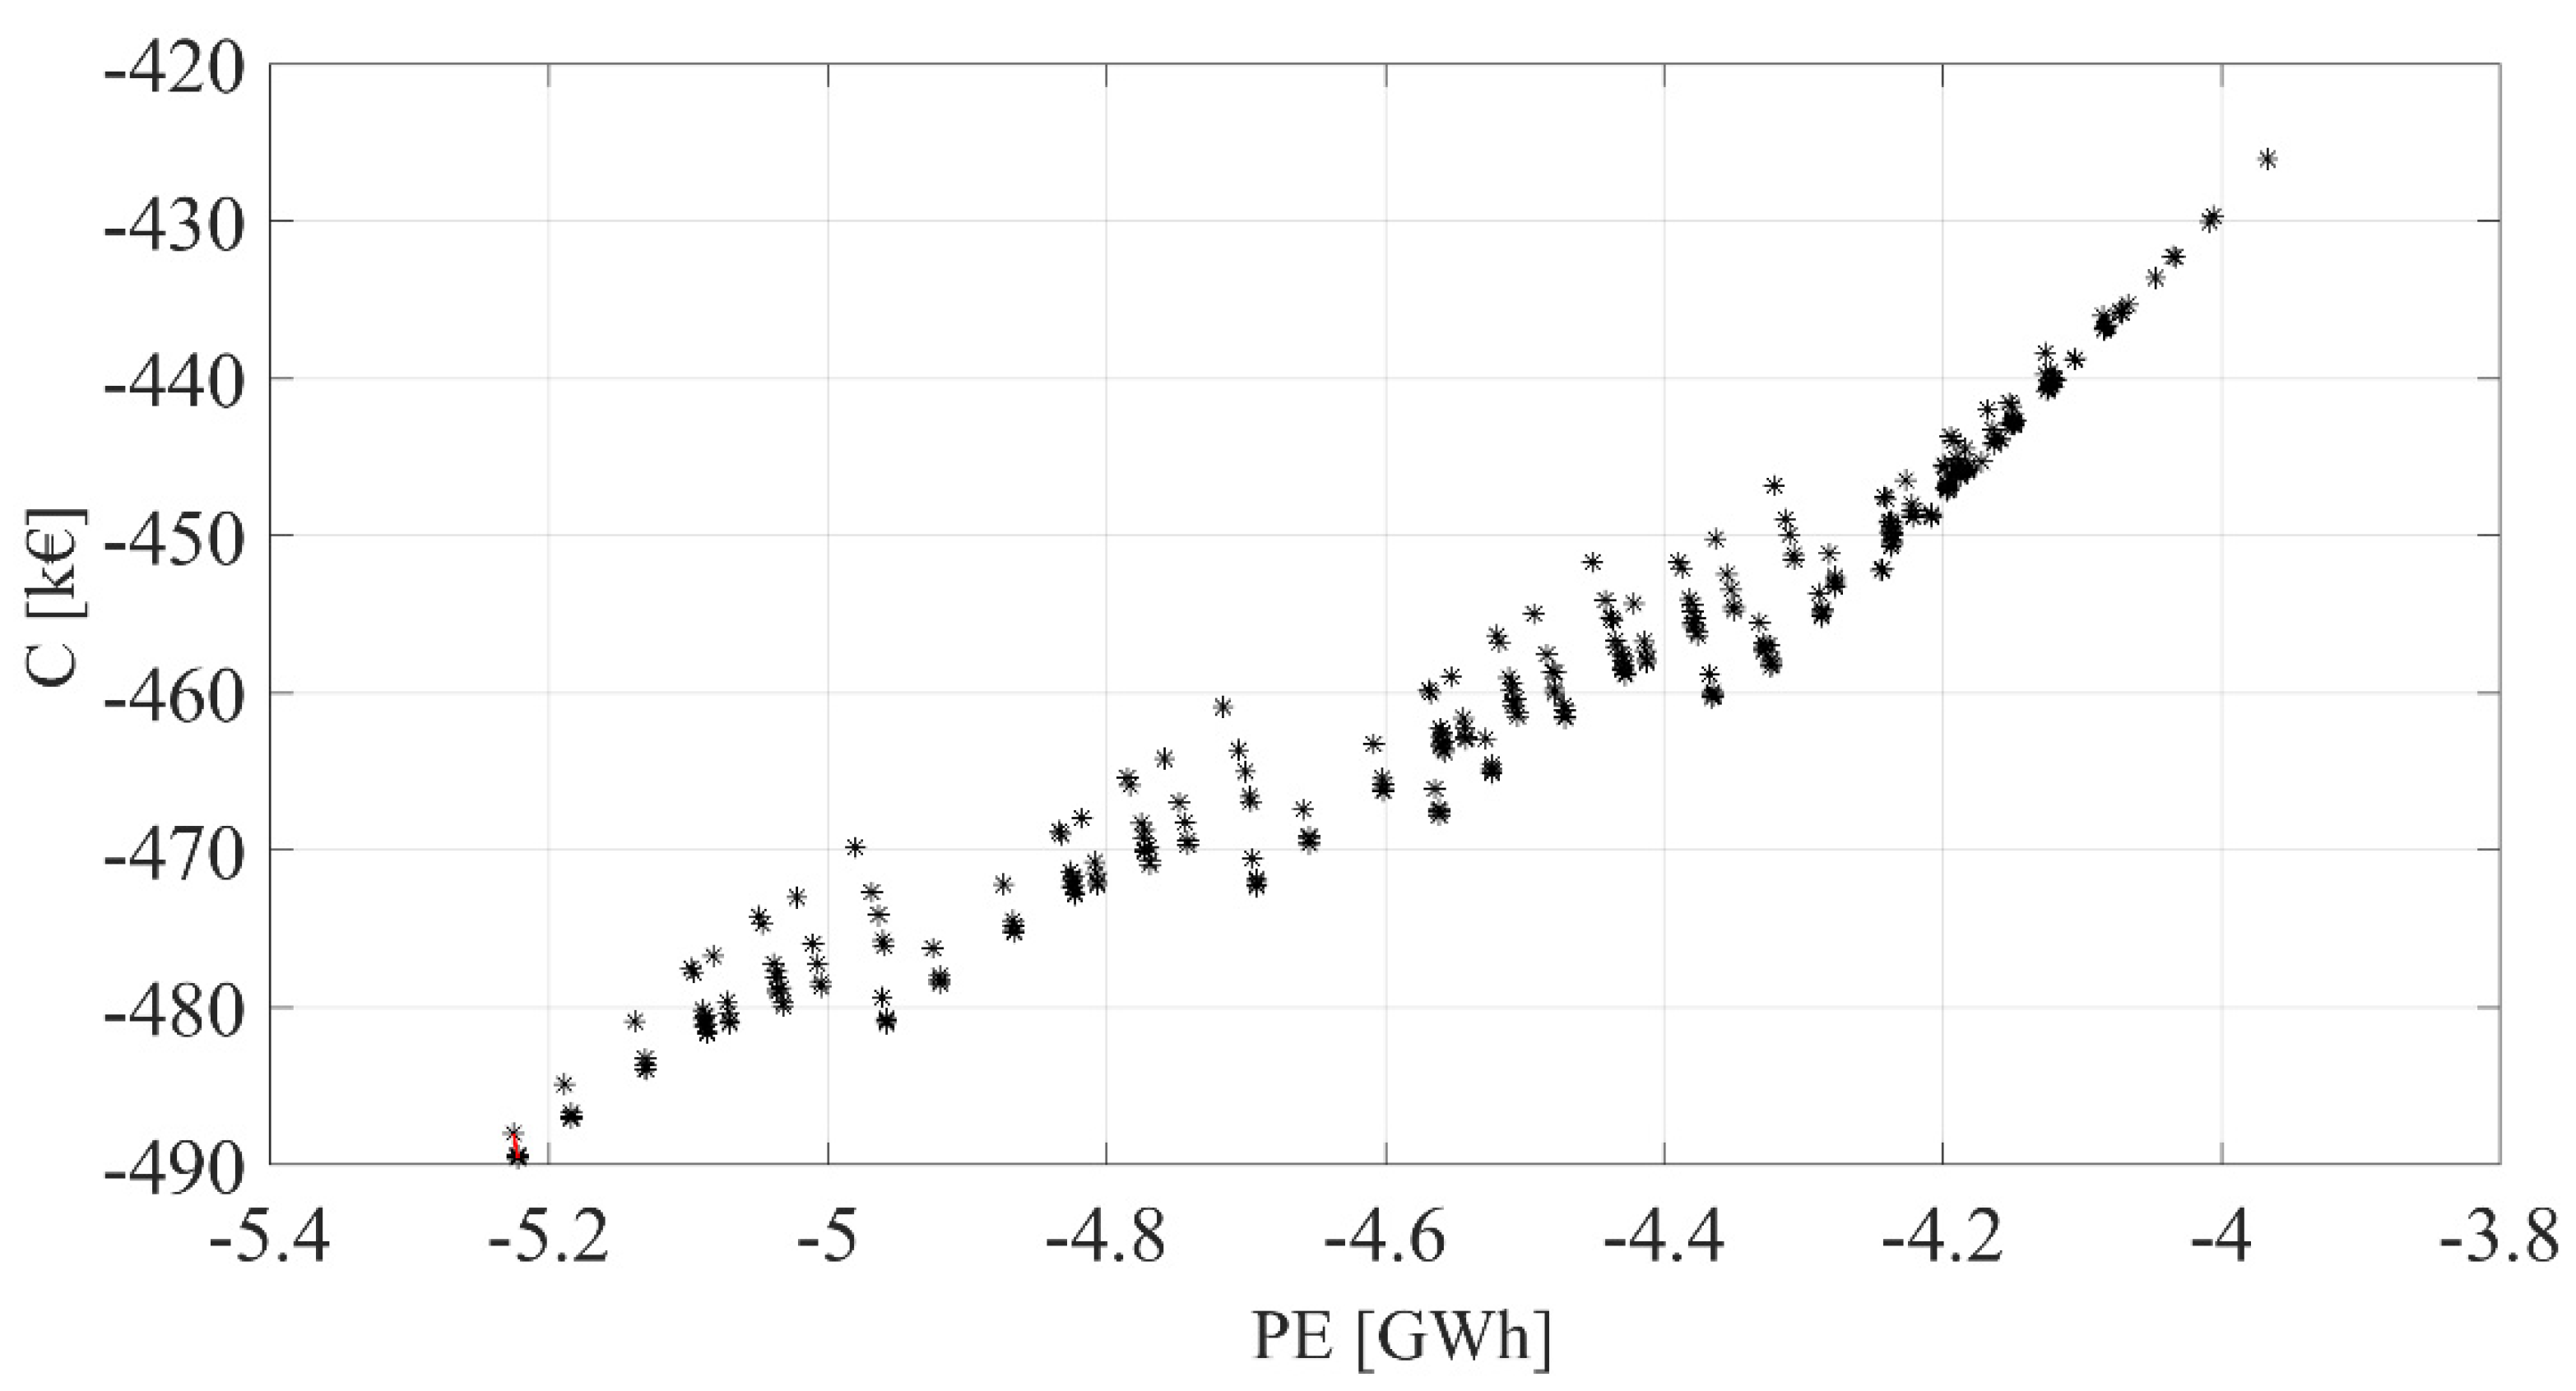
Figure 5.
Optimal layout research for water scrubbing plant adopting an operative pressure of 1.20 bar: energy performance.
Figure 5.
Optimal layout research for water scrubbing plant adopting an operative pressure of 1.20 bar: energy performance.
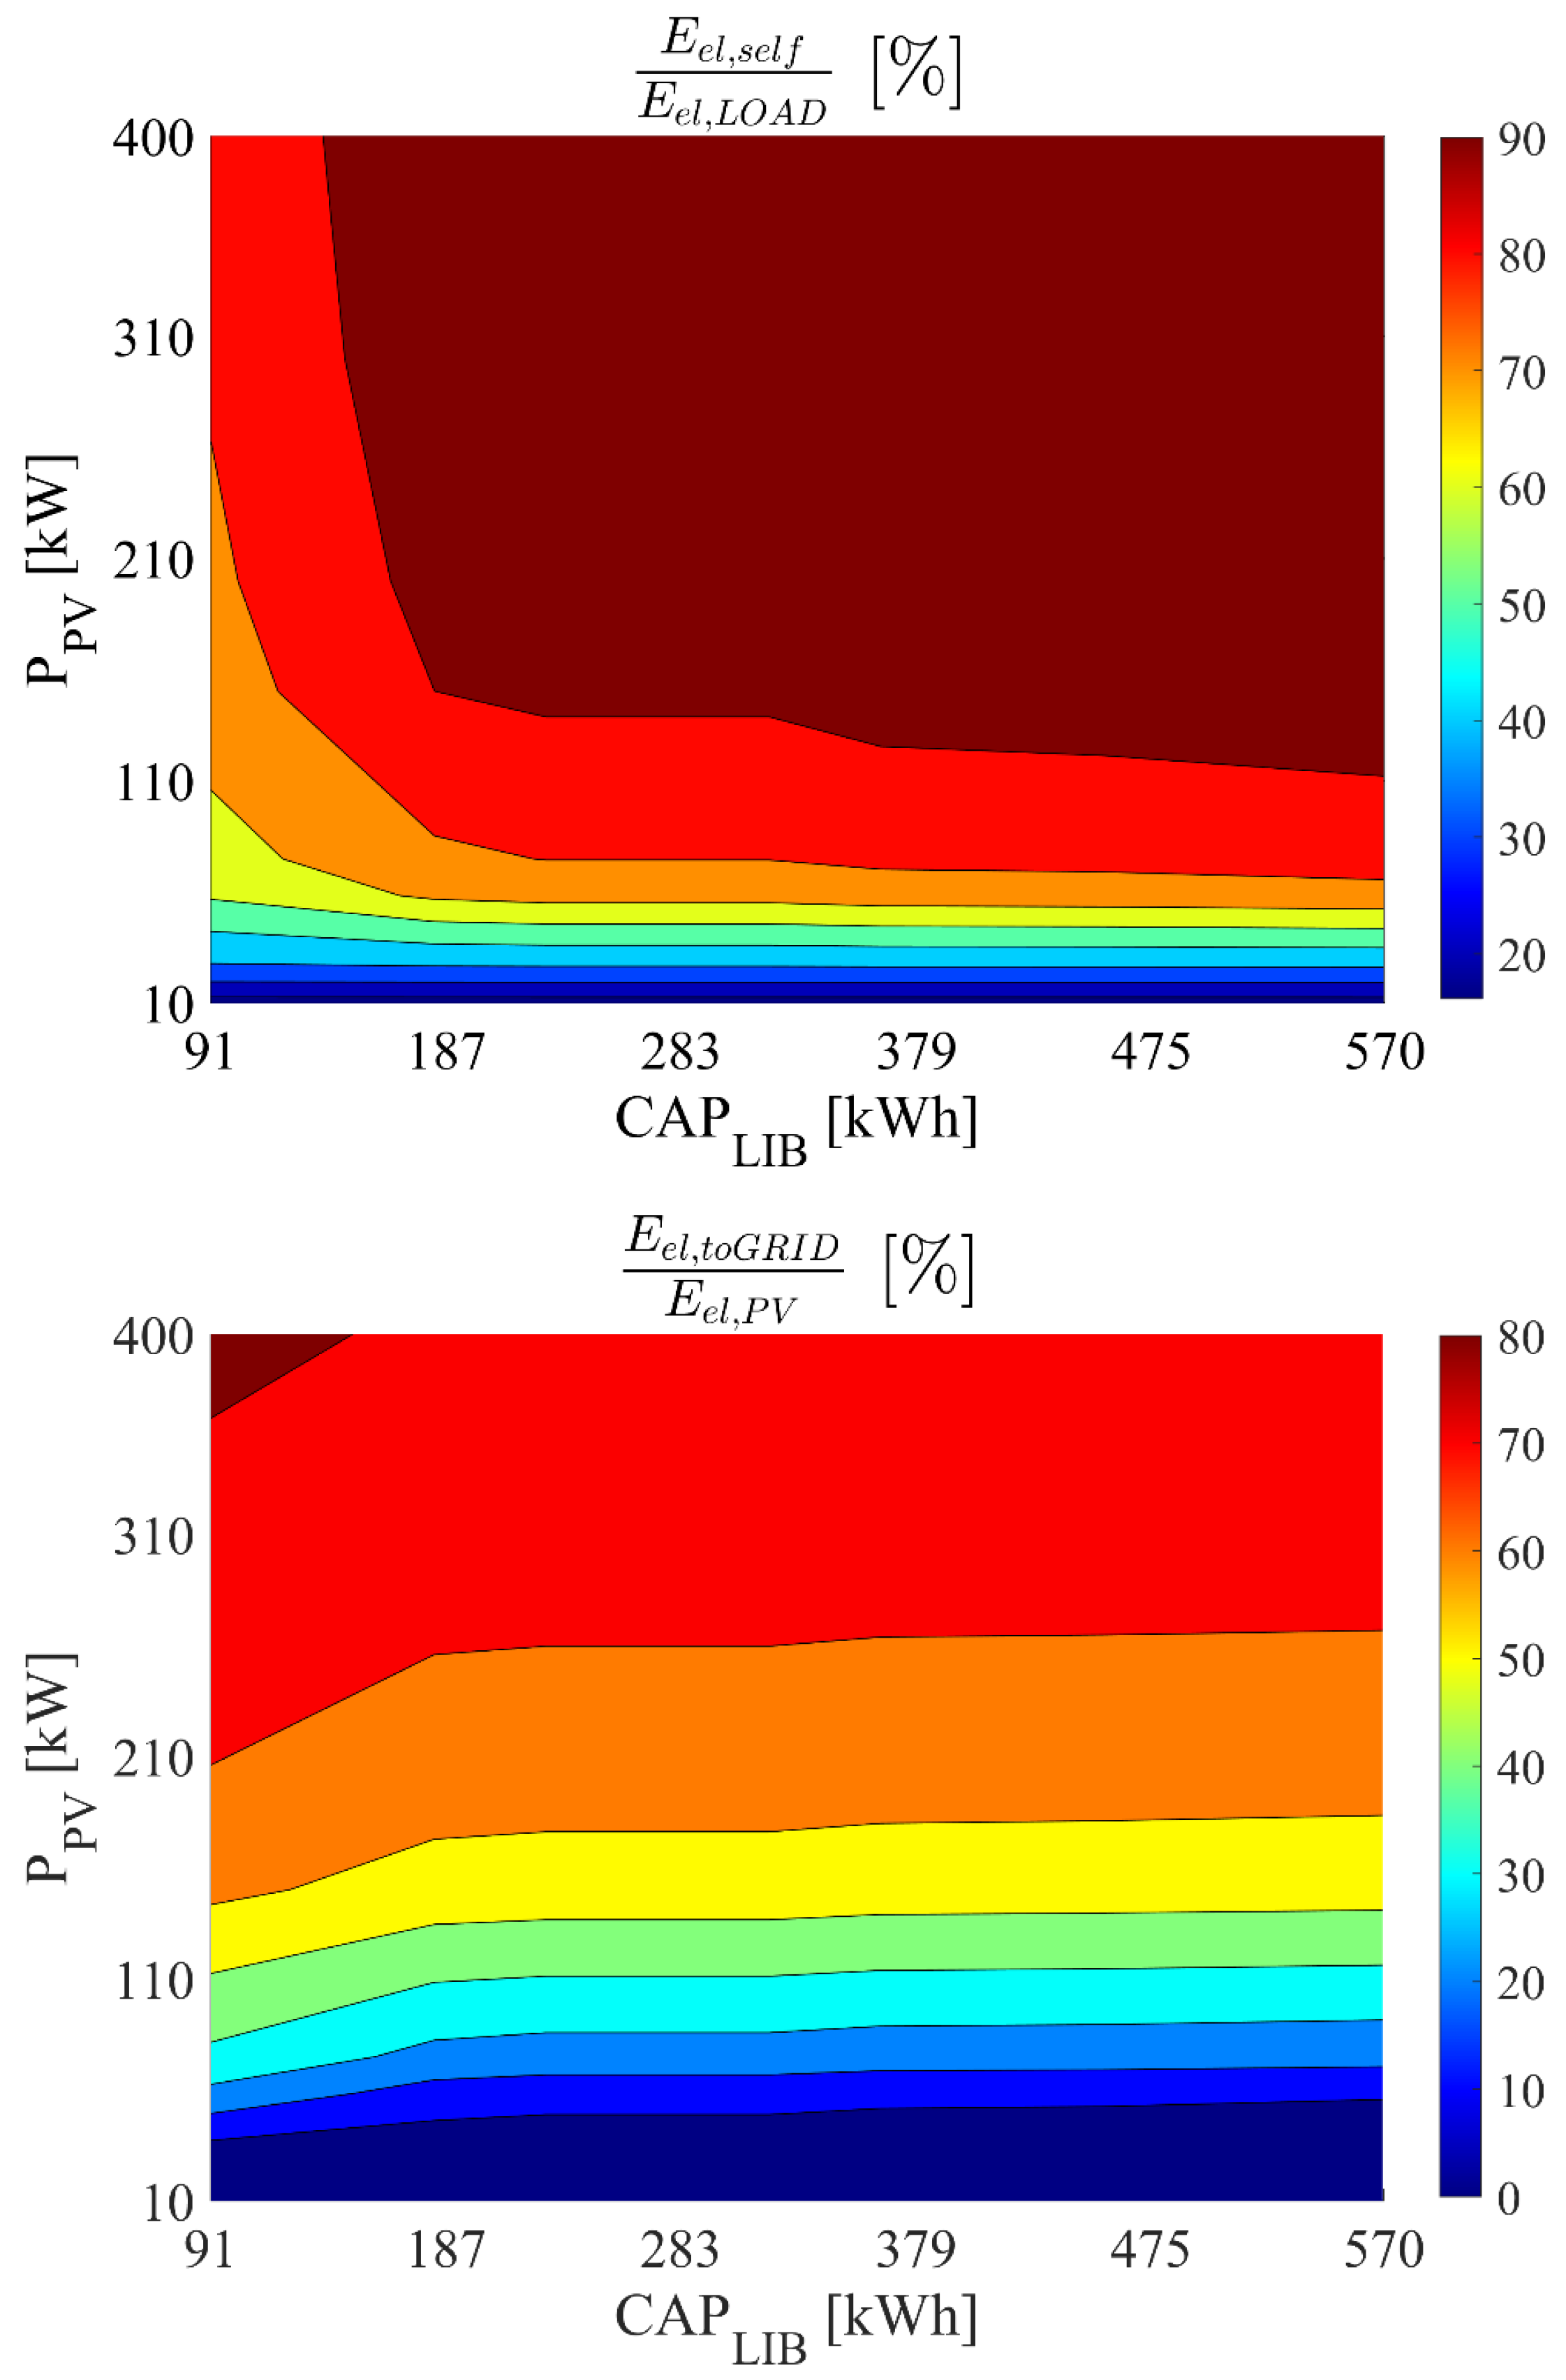
Figure 6.
Dynamic and monthly energy results for water scrubbing plant adopting an operating pressure of 1.20 bar, a PV field capacity of 200 kW, and a battery capacity of 182 kWh.
Figure 6.
Dynamic and monthly energy results for water scrubbing plant adopting an operating pressure of 1.20 bar, a PV field capacity of 200 kW, and a battery capacity of 182 kWh.
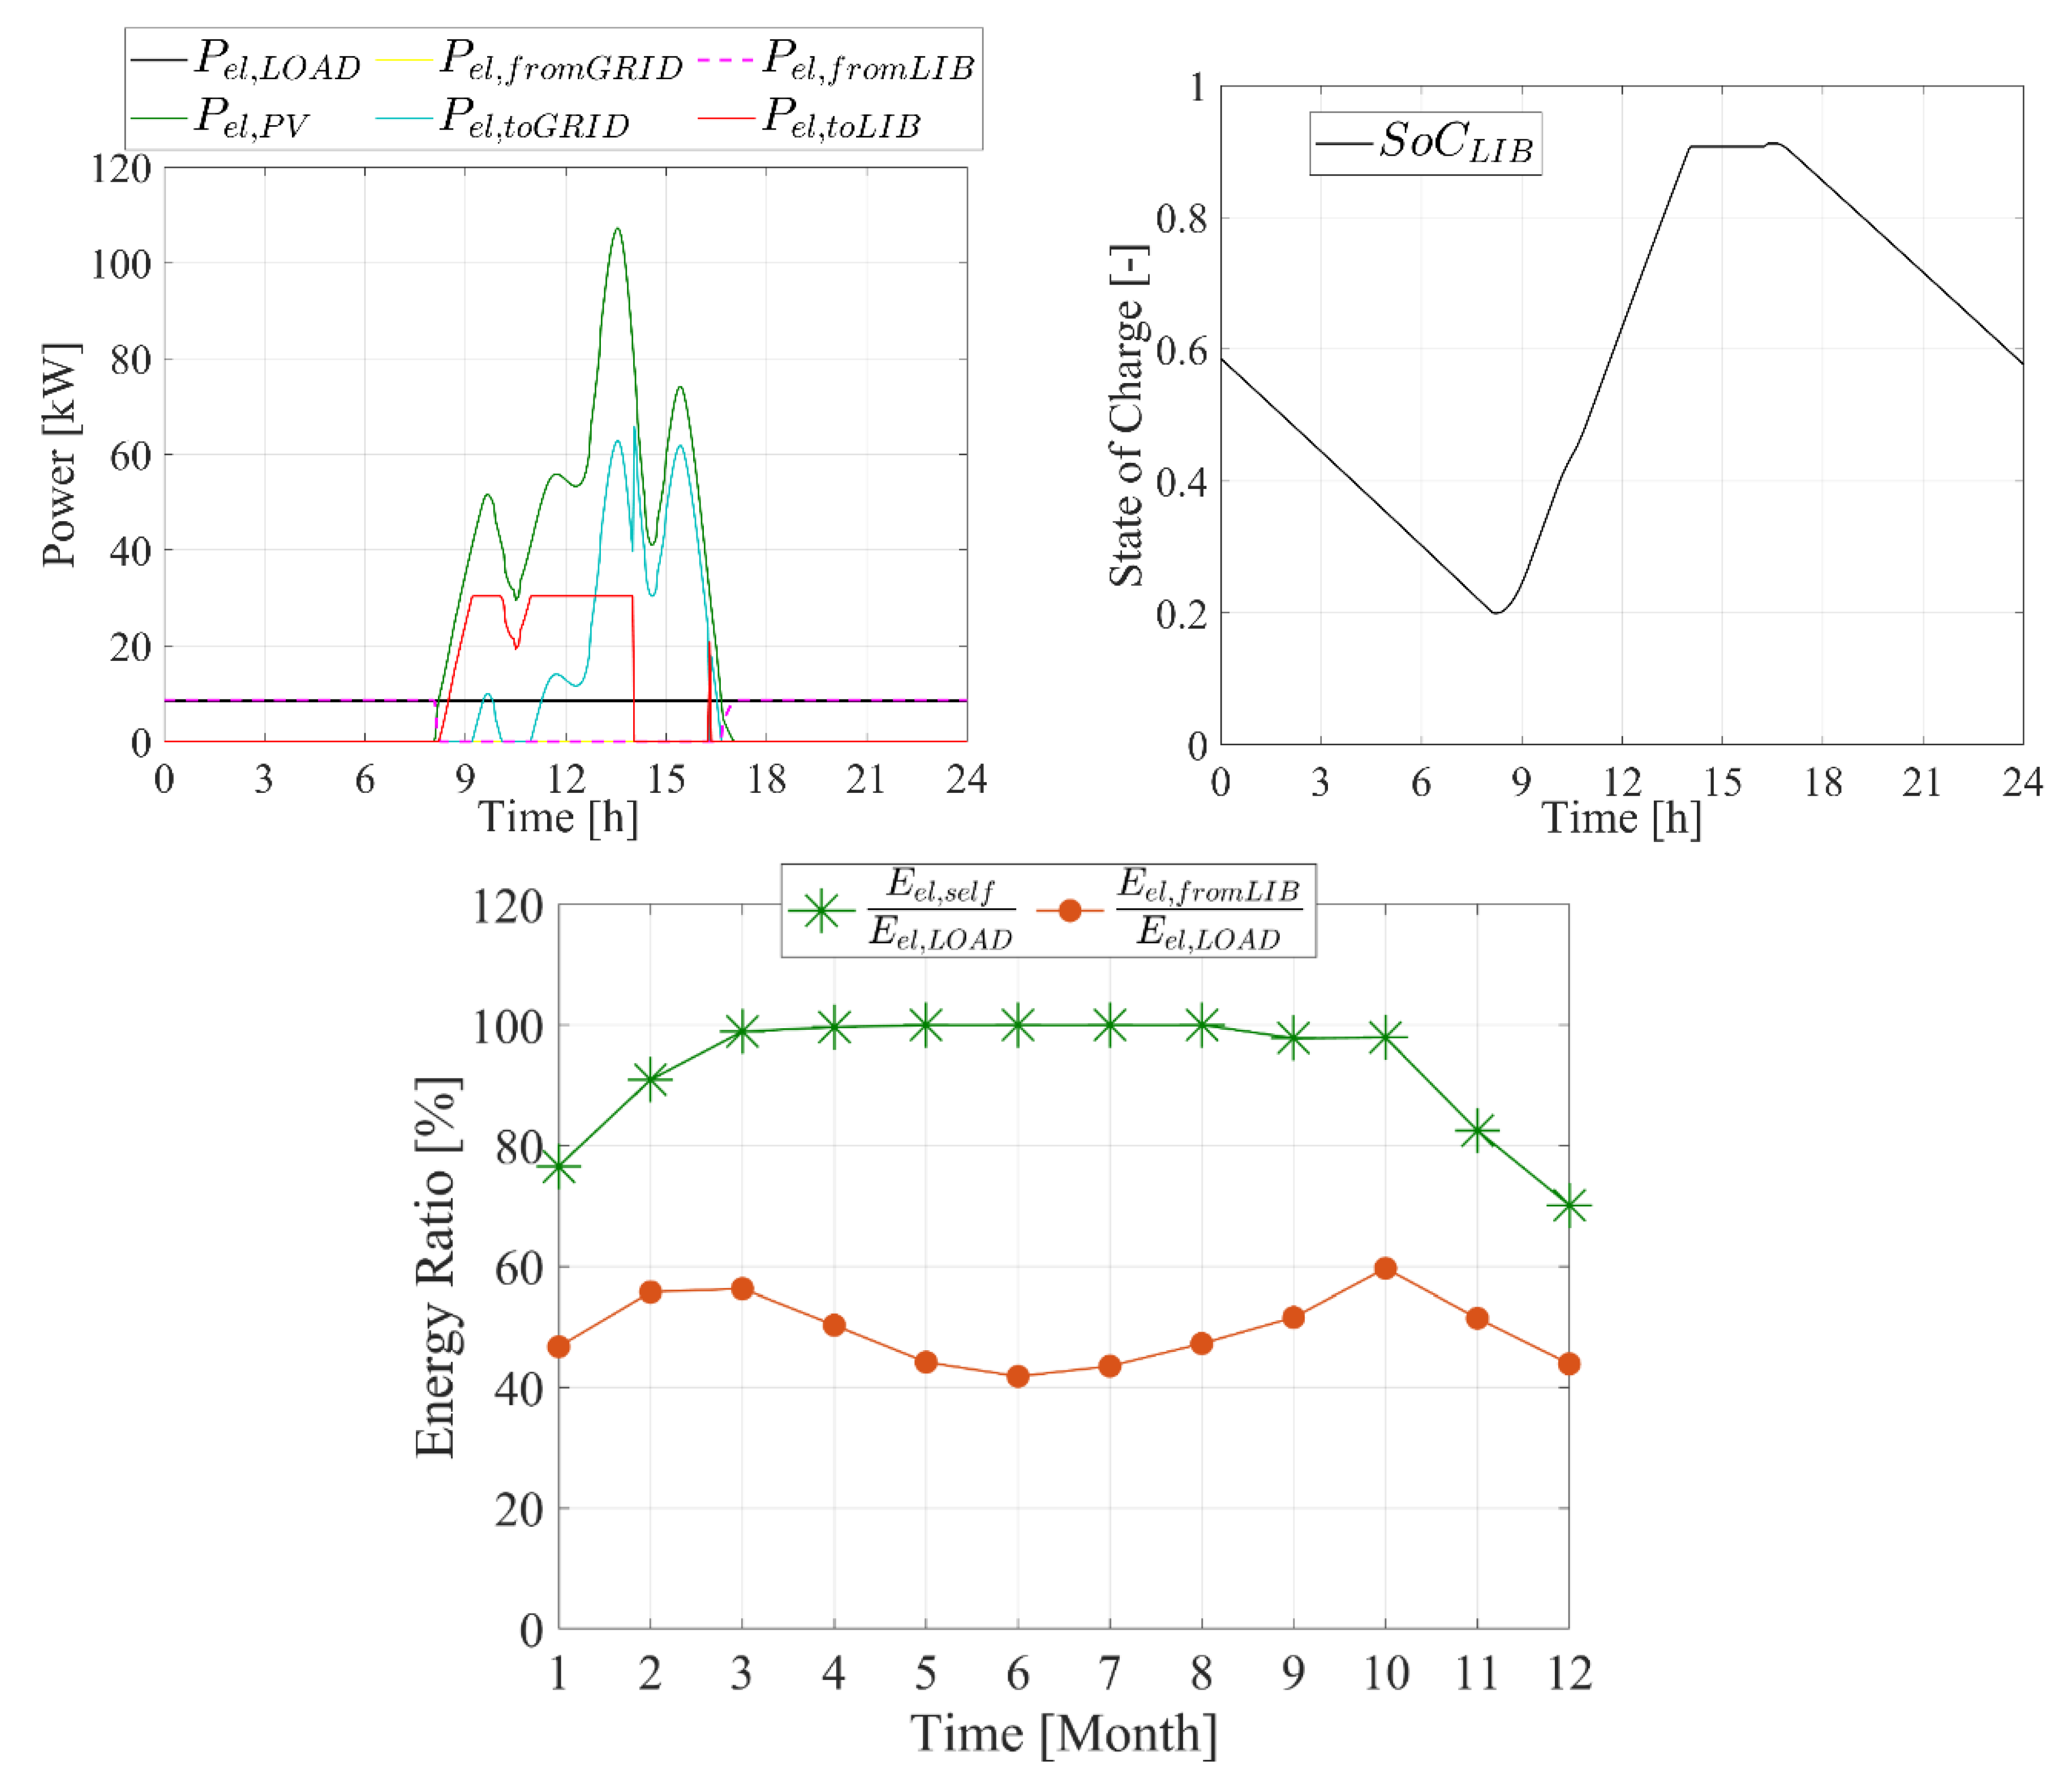
Figure 7.
Optimal response surface and Pareto frontier: membrane separation upgrading plants.
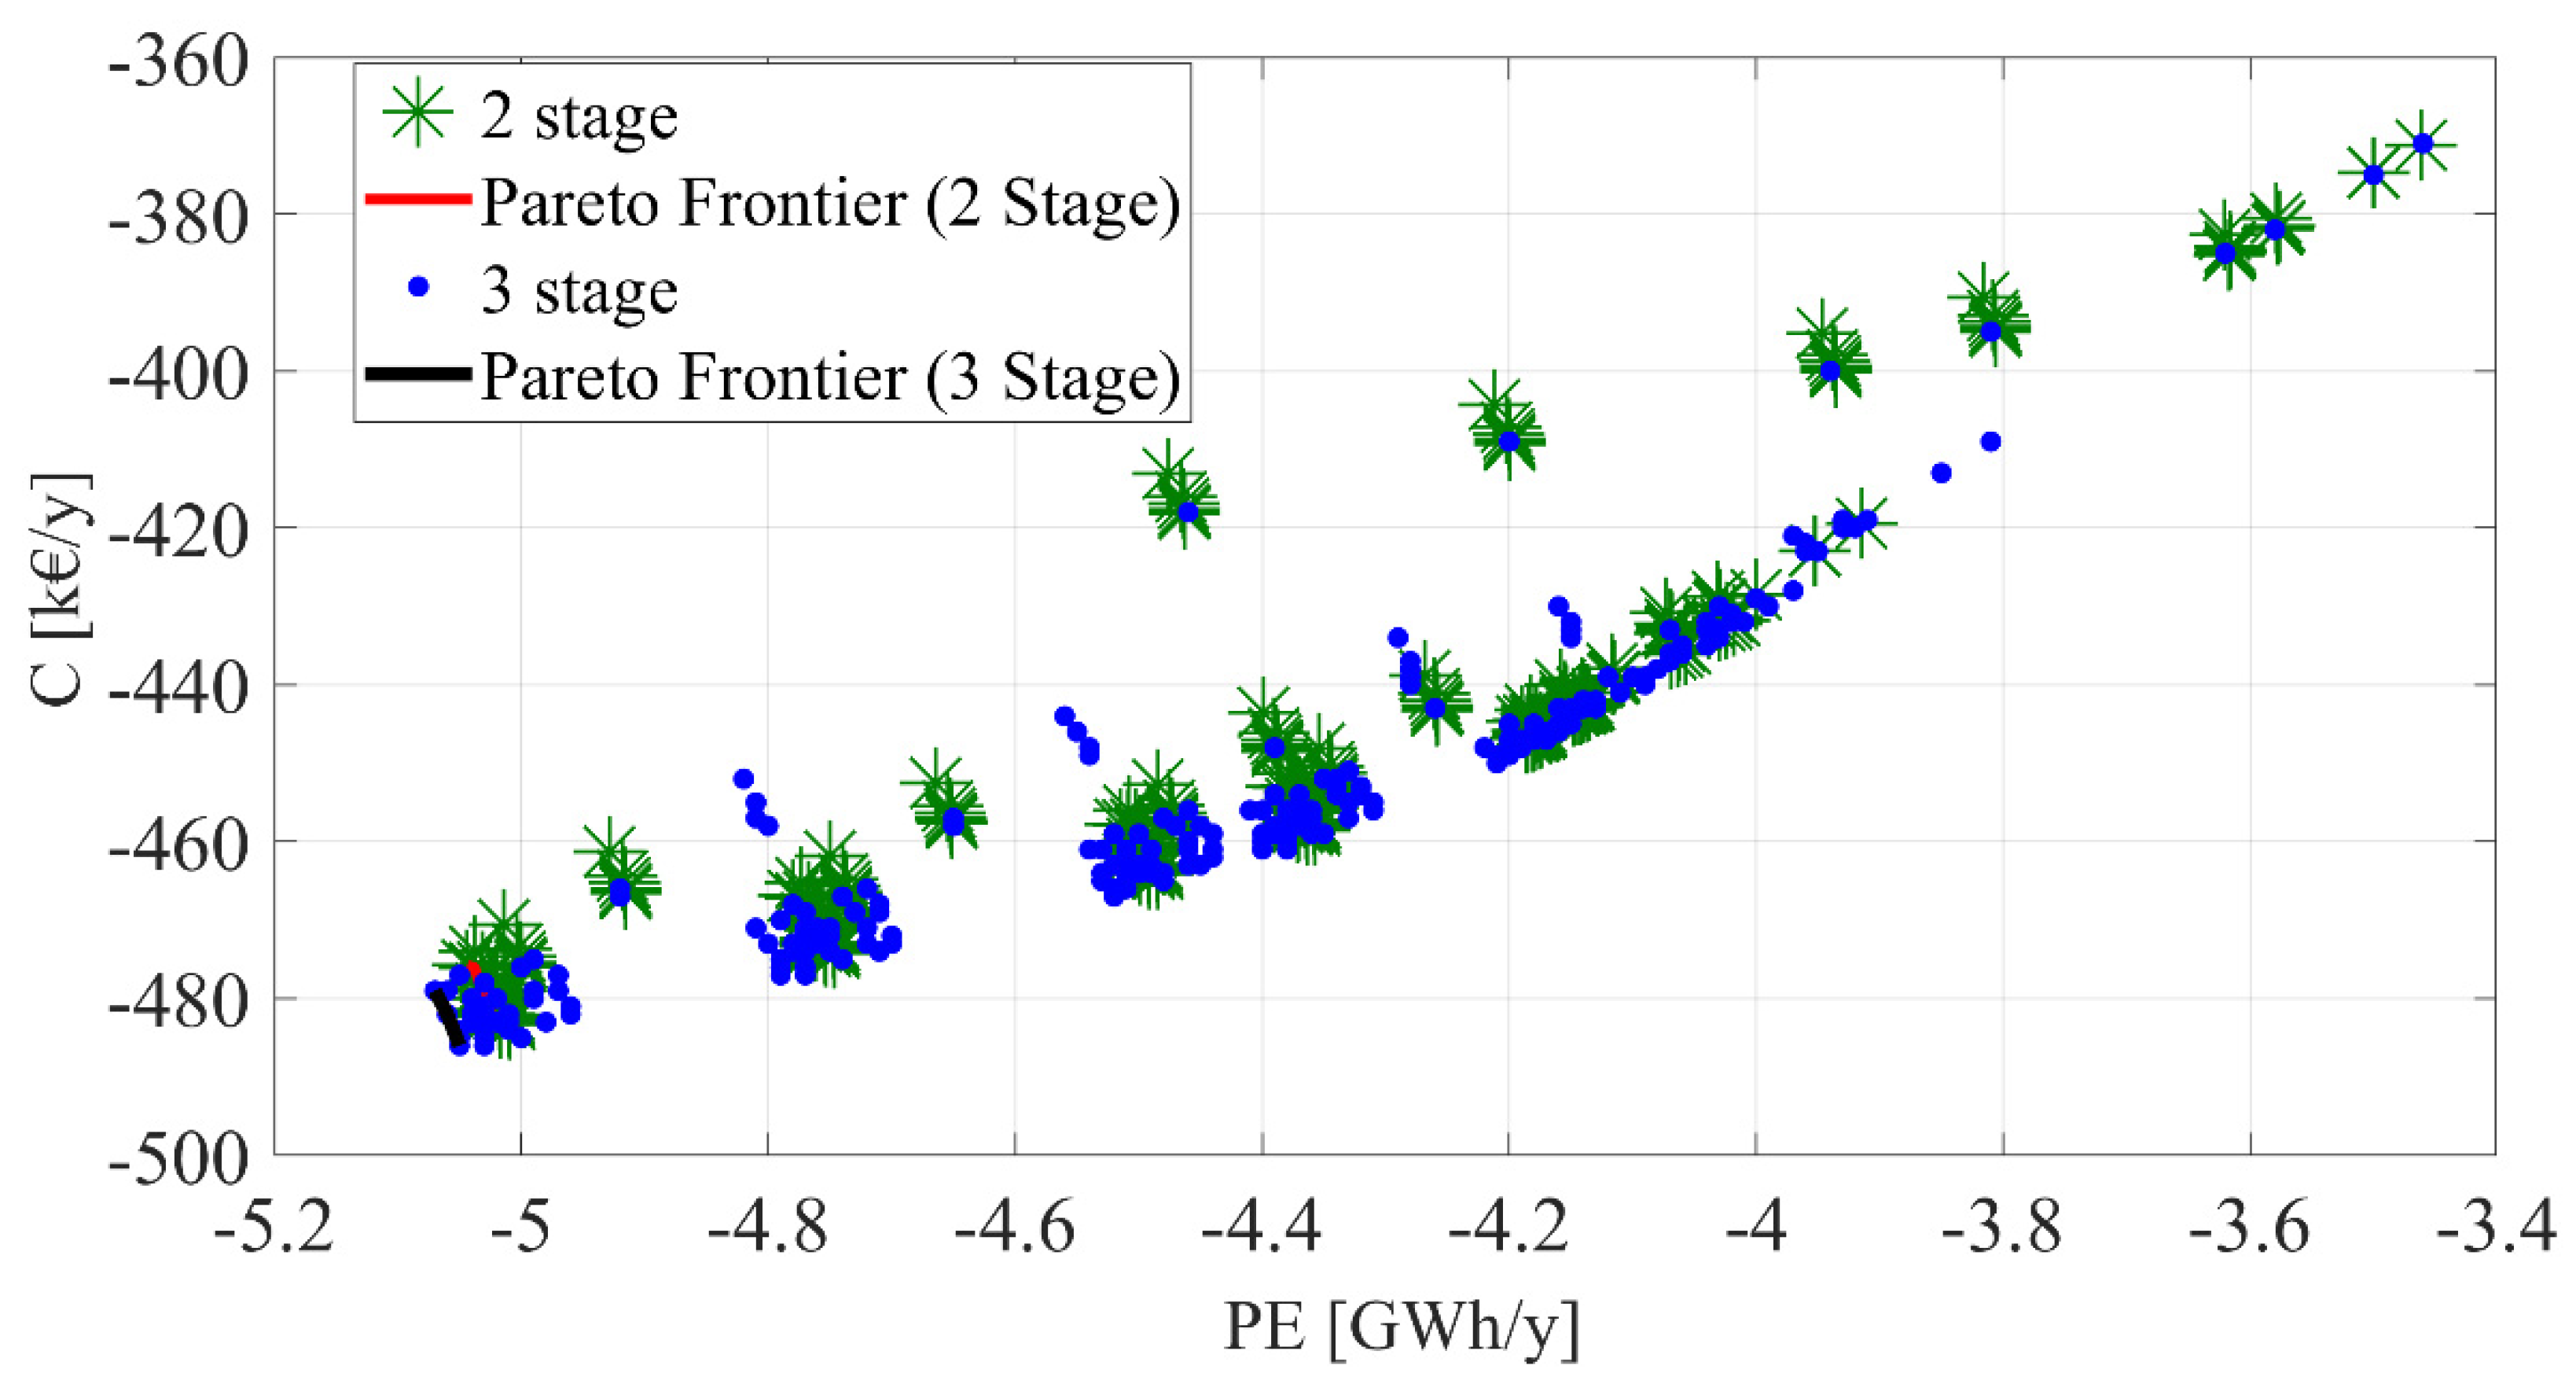
Figure 8.
Optimal layout research for 2 stage membrane separation upgrading plant adopting an operative pressure of 20 bar: energy performance.
Figure 8.
Optimal layout research for 2 stage membrane separation upgrading plant adopting an operative pressure of 20 bar: energy performance.

Figure 9.
Dynamic and monthly energy results for two-stage membrane separation upgrading plant adopting an operating pressure of 20 bar, a PV field capacity of 400 kW, and a battery capacity of 364 kWh.
Figure 9.
Dynamic and monthly energy results for two-stage membrane separation upgrading plant adopting an operating pressure of 20 bar, a PV field capacity of 400 kW, and a battery capacity of 364 kWh.


Figure 10.
Optimal layout research for two-stage membrane separation upgrading plant adopting a battery of 364 kWh: energy performance.
Figure 10.
Optimal layout research for two-stage membrane separation upgrading plant adopting a battery of 364 kWh: energy performance.

Figure 11.
Optimal layout research for three-stage membrane separation upgrading plant adopting an operative pressure of 10 bar: energy performance.
Figure 11.
Optimal layout research for three-stage membrane separation upgrading plant adopting an operative pressure of 10 bar: energy performance.
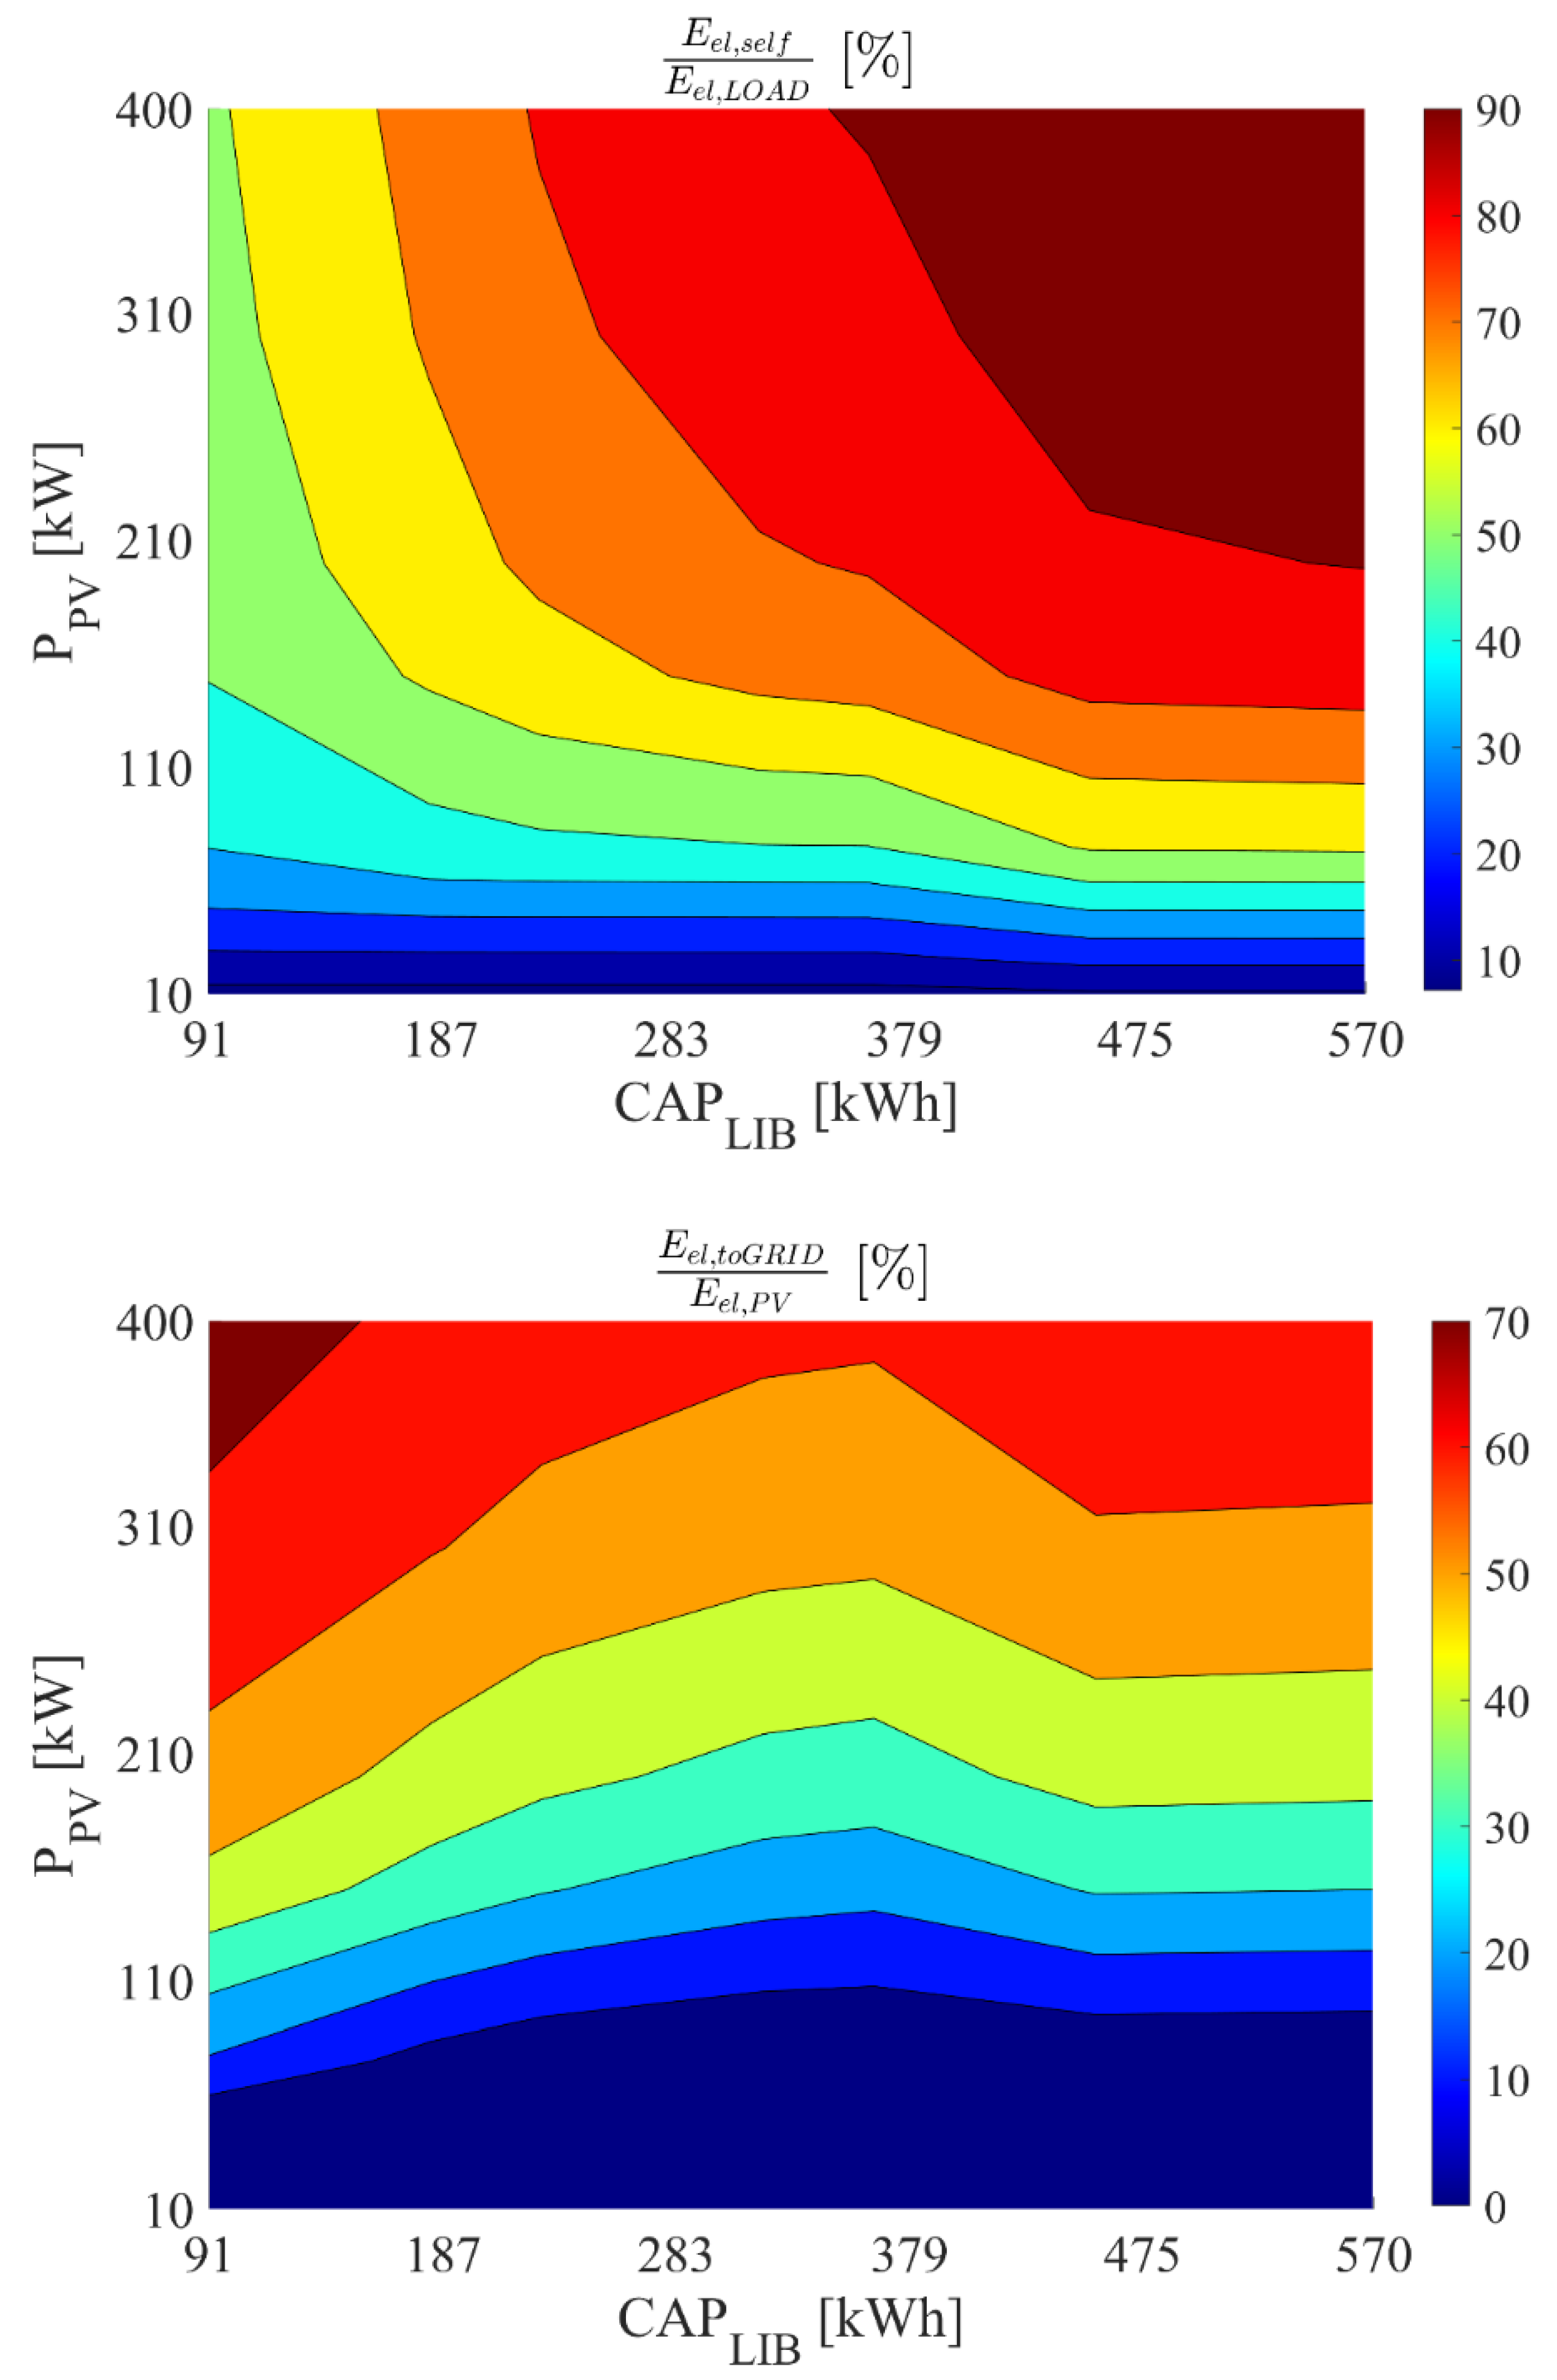
Figure 12.
Dynamic and monthly energy results for a three-stage membrane separation upgrading plant adopting an operative pressure of 20 bar, a PV field capacity of 400 kW, and a battery capacity of 364 kWh.
Figure 12.
Dynamic and monthly energy results for a three-stage membrane separation upgrading plant adopting an operative pressure of 20 bar, a PV field capacity of 400 kW, and a battery capacity of 364 kWh.

Figure 13.
Optimal layout research for three-stage membrane separation upgrading plant adopting a battery of 364 kWh: energy performance.
Figure 13.
Optimal layout research for three-stage membrane separation upgrading plant adopting a battery of 364 kWh: energy performance.

Figure 14.
Primary energy of each considered scenario varying the share of thermal energy exported by the reference system.
Figure 14.
Primary energy of each considered scenario varying the share of thermal energy exported by the reference system.

Figure 15.
Simple Payback of each scenario varying the electric energy incentives (RS) and the natural gas purchasing cost: A Eth,CHP,useful/Eth,CHP = 0% exported.
Figure 15.
Simple Payback of each scenario varying the electric energy incentives (RS) and the natural gas purchasing cost: A Eth,CHP,useful/Eth,CHP = 0% exported.

Table 1.
Parameters selected for the thermoeconomic analysis.
| Parameter | Description | Value | Unit |
|---|---|---|---|
| ηel,GRID | Electric efficiency of the public power grid | 0.46 | - |
| ηth,BOILER | Thermal efficiency of the auxiliary heater | 0.95 | - |
| ηel,CHP | Rated electric efficiency of the cogenerator | 0.43 | - |
| ηth,CHP | Rated thermal efficiency of the cogenerator | 0.449 | - |
| LHVCH4 | Natural gas lower heating value | 9.59 | kWh/Sm3 |
| LHVbiogas | Biogas lower heating value | 5.86 | kWh/Sm3 |
| jth | Thermal energy selling unit cost | 0.05 | €/kWh |
| jel,fromGRID | Electric energy purchasing unit cost | 0.20 | €/kWh |
| jel,toGRID | Electric energy selling unit cost | 0.07 | €/kWh |
| CPV | Unit cost of PV modules per peak power | 1000 | €/kWp |
| CLIB | Unit cost of lithium-ion battery | 200 | €/kWh |
| CSCR | Unit cost of scrubber | 5400 | €/Nm3/h |
| CMEM | Unit cost of membrane | 50 | €/m2 |
| MRC | Membrane replacement cost | 25 | €/m2 |
| CCHP | Unit cost of cogenerator | 1700 | €/kW |
| ESC | Biomethane energy saving certificates | 0.609 | €/Sm3 |
Table 2.
Design parameters.
| LIB | Parameter | Definition | Value | Unit |
| Ccell | Cell energy capacity | 63.27 | Ah | |
| Vbattery | Battery voltage | 360 | V | |
| ηLIB | Battery efficiency | 0.90 | - | |
| SoCmin | Minimum allowed State of Charge | 5 | % | |
| SoCmax | Maximum allowed State of Charge | 90 | % | |
| mLIB | Weight of battery | 305 | kgPV | |
| VolLIB | Volume of battery | 0.13 | m3 | |
| PV | Pmax | Maximum power | 260 | Wp |
| Voc | Open-circuit voltage | 37.7 | V | |
| Isc | Short-circuit current | 9.01 | A | |
| Vmpp | Voltage at point of MPP | 30.5 | V | |
| Impp | Current at point of MPP | 8.51 | A | |
| Ns | Number modules in series | 2 | - | |
| Np | Number modules in parallel | 50 | ||
| A | PV module area | 1.6 | m2 | |
| ηPV | Module efficiency | 18 | % | |
| Digester | Vbiogas | Biogas produced by the digester | 83.46 | Sm3/h |
| Tdigester | Digester Temperature | 36.2 | °C | |
| XCO2 | Percentage of CO2 in the biogas mixture | 38 | % | |
| XCH4 | Percentage of CH4 in the biogas mixture | 62 | % | |
| CHP | Pel,rated | Rated Power | ||
| ηel,CHP | Rated electric efficiency of the cogenerator | 0.43 | - | |
| ηth,CHP | Rated thermal efficiency of the cogenerator | 0.45 | - |
Publisher’s Note: MDPI stays neutral with regard to jurisdictional claims in published maps and institutional affiliations. |
© 2022 by the authors. Licensee MDPI, Basel, Switzerland. This article is an open access article distributed under the terms and conditions of the Creative Commons Attribution (CC BY) license (https://creativecommons.org/licenses/by/4.0/).
Share and Cite
MDPI and ACS Style
Cappiello, F.L.; Cimmino, L.; Napolitano, M.; Vicidomini, M. Thermoeconomic Analysis of Biomethane Production Plants: A Dynamic Approach. Sustainability 2022, 14, 5744. https://doi.org/10.3390/su14105744
AMA Style
Cappiello FL, Cimmino L, Napolitano M, Vicidomini M. Thermoeconomic Analysis of Biomethane Production Plants: A Dynamic Approach. Sustainability. 2022; 14(10):5744. https://doi.org/10.3390/su14105744
Chicago/Turabian StyleCappiello, Francesco Liberato, Luca Cimmino, Marialuisa Napolitano, and Maria Vicidomini. 2022. "Thermoeconomic Analysis of Biomethane Production Plants: A Dynamic Approach" Sustainability 14, no. 10: 5744. https://doi.org/10.3390/su14105744
Note that from the first issue of 2016, this journal uses article numbers instead of page numbers. See further details here.