1. Introduction
It is no secret that by 2050, almost 70% of the world’s population will be situated in urban areas [
1,
2]. The urbanization rate is astounding and shows no signs of slowing down. Thus, the best option concerned individuals and policymakers have is to adapt to the current situation instead of mitigating its side effects [
3,
4]. To decrease the massive threats that urbanization will have on the environment, technology has been utilized to help diagnose, interfere with, solve, and maintain these adverse effects; these can be either standalone initiatives or more integrated ones in the form of a smart city. The smart city initiative aimed to put welfare and well-being of citizens and inhabitants at the center of technology [
5], and with its progress, many schemes were developed to ensure health and well-being [
6]. Although only recently defined, the initiative targeted city management and technology as separate entities, not as parts of a whole [
7]. However, several other components have been integrated into smart city principles that aim to achieve holistic urban parameters such as infrastructure [
1], livability and improvement of environmental factors [
8], as well as energy and buildings [
9]. These may be achieved through embedded sensors and data collectors that may be deemed as essential to the main components of smart cities and smart buildings, aiming at improving building design through data collection and diagnosis [
10,
11]; these systems can be implemented at both the city and national levels to improve resource usage efficiently. In 2016, [
12] stated that smart cities aim to use digital technologies to enhance performance, reduce costs and resource consumption, and engage more effectively and actively with their citizens, ultimately leading to their citizens’ well-being.
1.1. The Sustainable Development Goals (SDGs) and Smart Cities
The rich discussion on the existence of healthy cities and the SDG 11 goal is prominent and cannot be ignored; scientists, technologists, and academics have all thoroughly contributed to this massive growth of literature that is evident and abundant today [
13,
14,
15,
16,
17,
18]. Implementing these strategies into smart cities means preparing existing buildings to better adapt to the evolving environmental or sociological crises [
19,
20]. To help remedy some of these occurrences, the building sector is expected to overcome its adverse effect on the environment (more than 70% of all greenhouse gases emitted lie in that sole sector). That is why delving into what aids a building in giving back to the environment is an essential route that should be foremost for academics and scientists today.
In 2017, implementation tactics were proposed to tackle existing strategies defined by the SDG 11 goal. One of these strategies for achieving resilience in smart cities, focusing on climate change, is to help improve eco-efficiency and aim for climate-resilient infrastructure and buildings [
7,
21].
1.2. Thermal Comfort Indices as an Adjunct to User Experience
Through the focus on buildings and to better aid designers in designing better indoor environments for end-users, the utmost goal of building designers, an emphasis on comfort and aesthetics as well as overall pleasure and leisure is becoming more and more explicit and inevitable to ensure a better user experience in a growing competitive environment. Designers today focus on integrated and holistic design aimed to bring together more than one discipline to better aid the user in achieving the best results, whether through embedding innovative services (infrastructure, sensors, etc.) or through computations that support and facilitate the design by utilizing machine-based learning and artificial intelligence. This hype is now in full force. However, understanding the factors that affect occupants’ perception and thermal comfort is mandatory to ensure the safety and comfort of any interior space and promote occupants’ health and well-being.
Thermal comfort has a set of physiological and environmental factors which pertain to each individual. While the usual average of thermal comfort is an 80% percentile in contrast to the normalized 50% [
22], it ensures that the design at hand suits more people and is better fitted to the vast majority than the obsolete average. Perceiving thermal comfort should always bear in mind the physical characteristics of the inhabitants of the space at hand; factors such as weight, age, fitness level, and gender all have an impact on the sense of comfort of an individual; although the environmental factors may all stay the same, these factors all contribute to the metabolic rate and effect of heat on each individual.
Of the main environmental thermal comfort indices, relative humidity and temperature are the most common parameters addressed when designing an indoor environment. The design’s less common parameters are the overall air change rate followed by CO
2 levels and volatile organic compounds levels. These independent, or combined, parameters affect the overall user experience and perception of the space as well as comfort level, and may ultimately affect physical and mental well-being [
23], as well as productivity [
24,
25].
1.3. Importance of Linking Thermal Comfort with Energy-Saving and Efficiency
With evident climate change and with the stress placed on the importance of decreasing the impact the building sector has on the world to ensure sustainable development, energy efficiency is now a top priority to most establishments and businesses worldwide; the complete awareness of the global energy crisis is leading more and more people to investigate cleaner options and healthier substitutes for non-renewable fuels, ultimately leading to both better and more efficient consumption, and use of renewable energy sources. However, even with the enforcement of adaptation, mitigation in areas where renewable energy plans may have a higher initial cost, especially in places where the funds are not readily located, should inevitably investigate embedding new technologies and techniques to ensure energy-efficient usage and costs.
The thermal comfort index is one of the most relevant in human biometeorology [
26]; it is an interaction between physiological, psychological, physical (environmental), social, and cultural factors as the architecture of the space and its urban context. Spatial thermal comfort is a massive key player in the design process of buildings today; it affects usability and comfort and has a standing effect on the resale and equity of the space itself. Designing for comfort comes in all shapes and forms, from orientation and sun/wind relationship into the area to scenic landscapes and integration of natural elements; designers are equipped to make users feel as comfortable and satisfied as possible. Understanding that thermal comfort and interior ambience affect user perception of space and usability is a top priority among designers today. However, sometimes ideal ambient temperatures and parameters cannot be met due to environmental factors like noise, pollution, and drastic temperature fluctuation due to climate change, which may inhibit the existing site analysis and lead to user irritability, an opportune environment for embedding the role of artificial intelligence and machine learning, where AI has a much broader scope than ML, though they are both multifaceted. AI creates intelligence that stimulates human thinking, interaction, and behavior, often leading to new “human made thinking power”. It does not need to be pre-programmed but rather depends on algorithms that, once utilized, devise their own form of “thinking” and intelligence. ML, a subset of AI, teaches machines the concept of learning from existing data and building upon it to reach new solutions through predictions. Hence, utilizing ML may help create a moderated interior climate that caters to the indices of each living space, whether at work or home, and tailoring the space to accommodate each person and not treating the building as a whole creates a unique and detailed user experience that brings in more people whilst marketing the space to sell at a higher rate [
27].
Previous research has tackled the idea of different standalone thermal comfort parameters to determine occupancy. Indices such as CO
2, [
28], relative humidity [
29], and ambient temperature, if measured independent of HVAC and mechanical systems [
30], have been targeted to determine whether or not the space is occupied; however, the correlation between the different parameters remains rich material for investigation, especially in light of tailored user experience and individual differences.
1.4. Tailored Comfort and Occupancy
Spaces designed with user comfort at their core are more likely to sell faster and at a higher rate than spaces designed to be generic for all [
31]. Evidence shows that more and more clients are using expert interior designers and tailored spaces designed specifically for their needs, to personalize their individual spaces and make them more comfortable [
32]. This also encompasses issues such as controlled interior atmosphere and ambience. Factors such as mood and stress levels and psychological states of mind [
33] affect interior spatial design and comfort since these measures affect the physiological state (one of the basic parameters of thermal comfort). Thus, regulating mood and stress factors, in turn, needs to be integrated into the design process of interior ambient design and quality; this can be achieved through the utilization of sensors and machine learning to aid in accurate data collection over a longer period, yielding better results.
1.5. AI Relationships in Room Occupancy
The effect of AI today is seen in the integration with the technology used by the many industry domains, to help owners assess their data, deliver positive results, and impact their guest relationships (e.g., hospitality industry). AI algorithms are becoming very efficient in assisting owners to save money, enhance service, and improve operations. ML analyzes data from prominent sources and assimilates them into patterns to help administrators uncover meaningful and actionable decision-making insights. ML is enhancing the in-room experience by integrating smart technology into the room amenities, and AI can reduce workloads while speeding up responses and much more.
The prediction of occupancy in a room environment requires evolving sensor design and the implementation of ML in the indoor environment to enhance user experience and aid in a user-centered atmosphere, affecting room occupancy. The presence of sensors to monitor indoor environmental conditions may assist designers and decision-makers on room occupancy rates and ways to increase or decrease these rates. It may also bring forward decisions relating to heating and cooling, which directly affect energy consumption, thus leading to an overall energy-efficient building and a user enhanced experience. This paper highlights the importance of utilizing indoor environmental data to efficiently diagnose whether the room is occupied or vacant and regulate energy usage following user-centered design to achieve a combined dual effect of indoor comfort and energy efficiency.
The prediction of occupancy in a room environment using data from light, temperature, humidity, and CO
2 sensors was tested using several machine learning classification models. It has lately been predicted that the accurate estimation of occupancy detection in the building could save energy from 30% to 42% [
34,
35,
36]. If the occupancy room dataset was applied as an input for HVAC control algorithms, practical measurements indicated energy savings of 37% in [
36] and between 29% to 80% in [
37,
38] shown through an experiment using data from a CO
2 sensor in an office building and additional synthetic data acquired via a simulation method for CO
2 dynamics with randomized occupant behavior. It combines a convolutional network with a deep bidirectional long short-term memory to detect occupancy (DBLSTM). Deep neural networks, Rpart logistic regression, and Random Forest with variable reduction techniques were used to generate prediction models of specific energy usage in Croatian public sector buildings [
39], ML algorithms to detect occupant presence in space by measuring interior air-conditioning were also used [
40], while [
41] compared 36 ML algorithms for predicting interior temperature in a smart building.
The introduction above highlights the significance of predicted room occupancy in accurately measuring room occupancy and acts as a major motivation for this research. This paper includes the following contributions:
Integrating ML classification with AI explainability demonstrates how room occupancy data may aid energy conservation and efficient usage while accentuating the importance of user comfort and extended user-centered design.
Building different ML models for classifying room occupancy in high accuracy rate compared to recent related state-of-the-arts.
Increasing the confidence of proposed ML model through the application of SHAP XIA method to analyze the impact of classification features involved over the significance of each feature in the classification outcome.
The rest of the paper is structured as follows:
Section 2 discusses the literature review in classifying room occupancy, the importance of environmental components in determining comfort for users and the environment, the problems under research, and the approach used. While
Section 3 demonstrates the performance of the ML-based models used to classify room occupancy and interpret applying SHAP (Shapley Additive Explanations),
Section 4 details the results of the algorithms, and
Section 5 comments on the overall findings and offers future study opportunities. Finally,
Section 6 concludes the paper.
2. Literature Review
As early as 1932, evidence shows environmental factors’ importance in assessing users’ comfort [
42]. Thermal comfort is generally captured by measurements of four parameters: dry-bulb temperature, relative humidity, airspeed, and radiant temperature [
43]. The plotting of these variables on graph results in a psychometric chart that enables designers to calculate the optimum area for designing comfortable and healthy indoor spaces [
44]. The ASHRAE standard 55 determines the acceptable thermal conditions. It draws the comfort zone that defines the threshold of the climatic conditions used in spatial design [
45].
Research has emphasized that in residences, the interior temperature should not be less than 18 °C to decrease the risk of respiratory diseases and hypothermia [
46,
47], and not more than 26 °C to prevent overheating that may result in shock and mortality [
48,
49,
50]. Studies have also shown that for the best healthy and uninterrupted sleep, bedrooms’ interior temperatures should be between 15.6 °C and 19.4 °C [
51,
52], while in living rooms, they should be between 19 and 22 degrees [
53,
54].
In building science studies, thermal comfort has been related to productivity and health [
55]. Office workers who are satisfied with their thermal environment are more productive. The combination of high temperature and high relative humidity reduces thermal comfort and indoor air quality, often leading to decreased production rates and absenteeism, leading to stress and negative consequences and impacting overall well-being [
56,
57].
The importance of understanding room occupancy and user behavior stems from the innate desire to design spaces that are tailored to be of most benefit to the user themselves. Artificial intelligence in the interior setting of the built environment utilizes data that stem from sensors located strategically at specified points to measure and monitor specific tasks. These are sent to be analyzed, and the information is then used to mitigate the existing effects.
This can be utilized by positioning sensors to detect better motion, breathing, changes and fluctuation in heat, the difference in temperature, lighting patterns, and CO2 emissions. These sensors may be used separately or combined for data collection and measurement. The most common motion sensors translated into synapsis are motion-based ones that turn on a light when movement is detected.
These sensors have both a positive and negative impact; simultaneously, they may aid in data collection and ultimately help to understand user activity and trends, power outages, unstable internet, and the presence of wired cables that may interfere with their accuracy. It is best to apply several of them to plot their results better to ensure that the data collected from these sensors are valid, viable, and tangible.
In one study, the data collected included interior environmental data (pressure, altitude, humidity, and temperature) as well as the related occupancy level for two distinct rooms: (1) a fitness gym and (2) a living room, as detailed in [
58]. Features associated with the operating environment, such as occupancy rooms, are subject to unpredictability, necessitating the system-level ability to learn quickly and autonomously from knowledge from outside historical datasets accumulated over a substantial amount of time [
59].
One of the primary development trends is a shift toward applying AI developed by ML algorithms [
60]. Considering the operational environment’s complexities, the ML techniques Reinforcement Learning (RL) and its derivative “deep reinforcement learning” (DRL)” has proved effective for autonomous control networks of buildings [
61]. Unpredictable changes in operational environments caused by climate change threaten the efficiency, flexibility, and resilience of building-integrated energy systems. Buildings now can learn from evaluations for the rapid evolution of AI and ML [
62].
In the first step, Ryu et al. [
63] use a decision tree algorithm, and in the second step, they choose a model for predicting presence using a hidden Markov model (HMM). Zuraimi et al. [
40] named three generally used and simple to apply machine learning methods: (1) ANN, (2) Prediction Error Minimization (PEM), and (3) SVM.
The key question posed in this research is: can occupancy prediction through environmental factors utilizing machine learning and artificial intelligence aid designers, whether architects or mechanical engineers, to take collective and design measures to ensure energy-saving and efficiency while achieving user comfort?
Problem Description and Methodology
The indoor environment should be designed to ensure the health and well-being of its occupants. (1) Maintaining excellent air quality is one of the aspects that should be considered while designing a room. Others include (2), the managing capability of the rooms, and (3), energy efficiency. When these aspects are not effectively controlled, the inhabitants’ well-being and the rooms’ maintenance costs in energy supply may suffer [
64].
Cities all over the world seem to want to become more intelligent, outfitted with numerous innovative technologies (e.g., detectors, sensors, remote sensing, satellite imaging, machine learning, etc.) to become more dynamic and flexible in terms of addressing the challenges that regularly arise due to overcrowding, crowding, disasters, pandemics, and lack of comfort all contributing and leading to a decrease in overall well-being [
65]. When AI is integrated with AI explainability, challenges such as power savings, traffic control, and industrial automation are themes where intelligence affects smart solutions, leading to faster and more intelligent decisions. Real-time data analysis processes are critical in the context of smart and digital cities.
The ability of sustainable and smart cities to provide thermal comfort to their occupants while enhancing energy efficiency is an unsolved research problem with several integrated research problems. Using AI to improve energy efficiency while maintaining occupant comfort raises several research issues and opens up new avenues for future research. These are the challenges and potential research directions:
Thermal comfort in sustainable, smart buildings and cities to improve user experience and promote health and well being
User centered tailored experience and its relationship to energy efficiency
Dynamical temperature set-point modification and comfort model construction.
Future computing challenges and research opportunities in energy and thermal comfort control.
3. Proposed Framework
This paper embodies some features of the concept mentioned above, focusing on the challenge of energy efficiency in the smart city based on room occupancy ML classification.
Section 3.1 explains the description, statistical analysis, and pre-processing of the dataset sources used; even though
Section 3.2 presents the ML-based models chosen for this smart city’s room occupancy classification,
Section 3.3 illustrates ML’s ability to make accurate classifications. Nevertheless, it cannot provide a mechanical knowledge of how inputs and outputs interact with each other in most applications. Explainable Artificial Intelligence (XAI) is a new set of strategies that aim to provide such an explanation; we will explore some of these methodologies in this article.
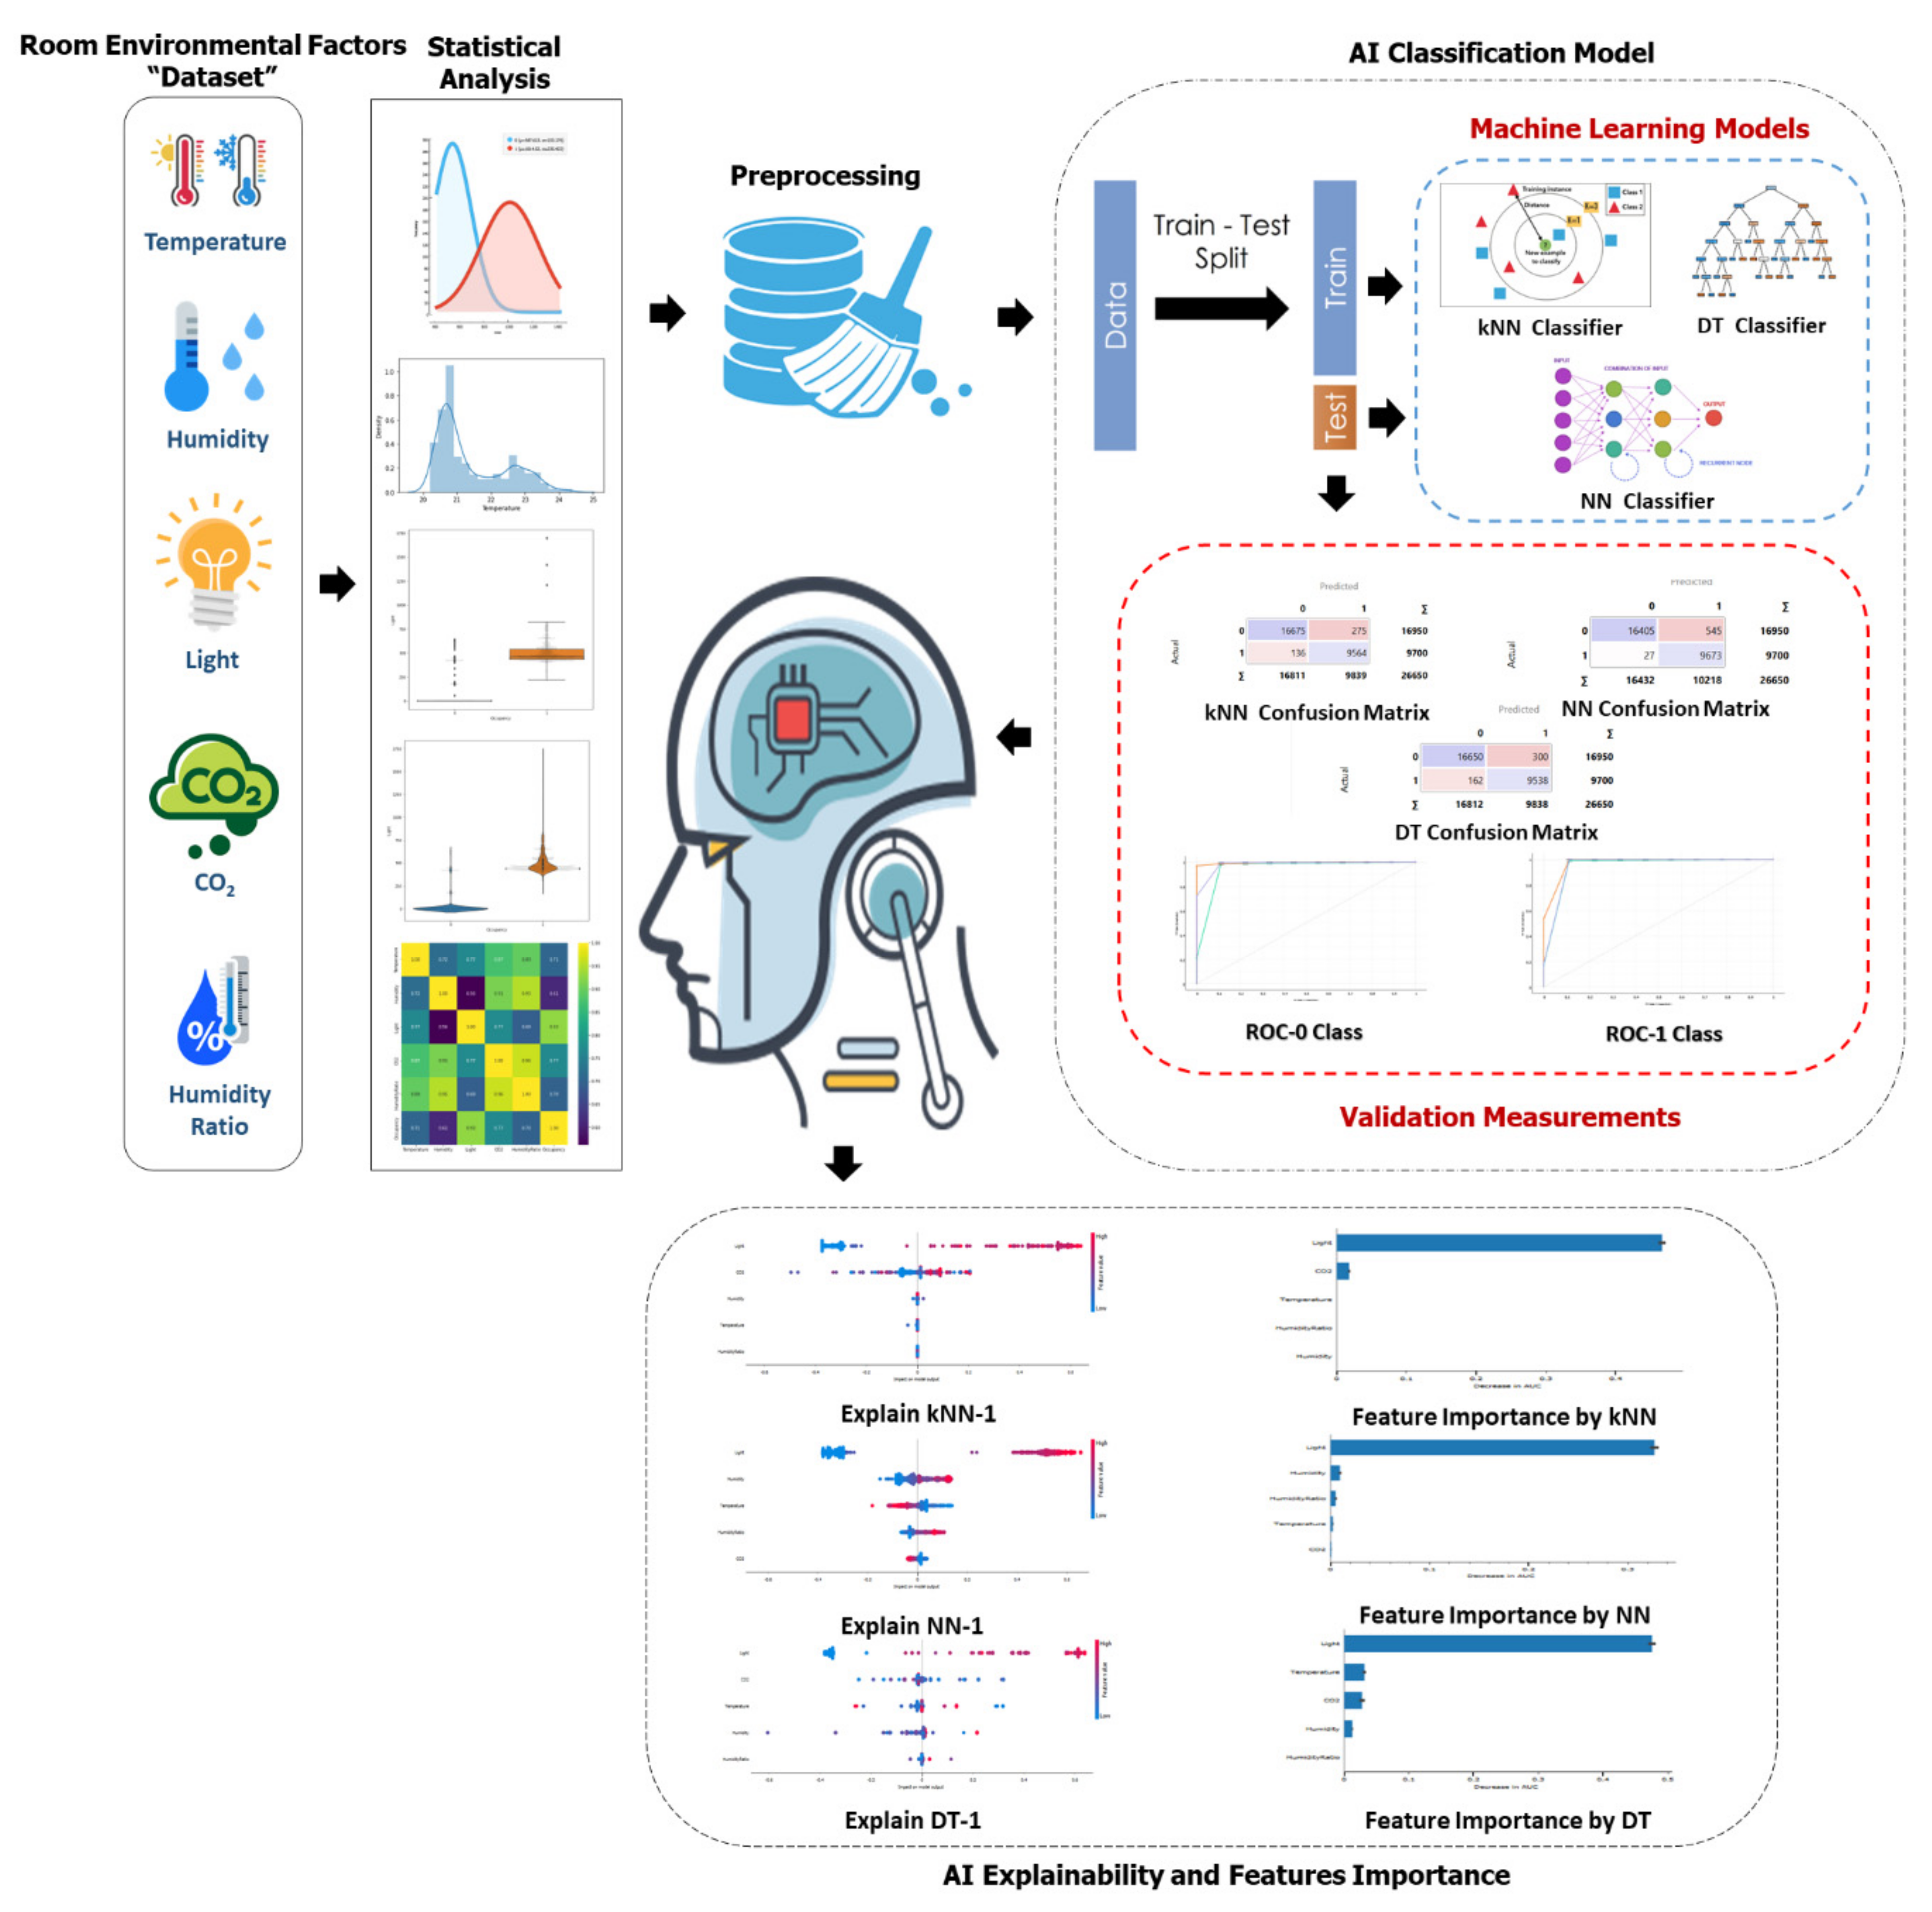
Figure 1 depicts the proposed framework of the architecture design for the decision problem.
The suggested framework is divided into numerous stages. The dataset is first statistically analyzed to determine the features (room environment characteristics) relationships and their values, and then it is processed until it is suitable for classification. The dataset is then divided and explainability is utilized to determine which features had the most impact on the performance of the classifiers and which were most important in terms of shape (as shown in
Figure 1) into training and testing subsets. The planned classification model uses three classification methods: KNN, DT, and AO-ANN(BP), and performance evaluation. Finally, the explainability of models has become an essential element of the ML workflow. Maintaining an ML model as a “black box” is no longer an option.
Moreover, analytical tools such as SHAP are growing and becoming more popular. The proposed approach by SHAP has proven to be a significant achievement in ML model interpretation. SHAP combines multiple current methodologies to produce a browser-based, theoretically sound approach to explaining predictions and classifications for any algorithm. The magnitude and direction (positive or negative) of a feature’s effect are quantified by SHAP values. Based on our recent knowledge, XAI analysis using SHAP should be an essential element of the machine learning workflow.
3.1. Room Occupancy Dataset
3.1.1. Dataset Description
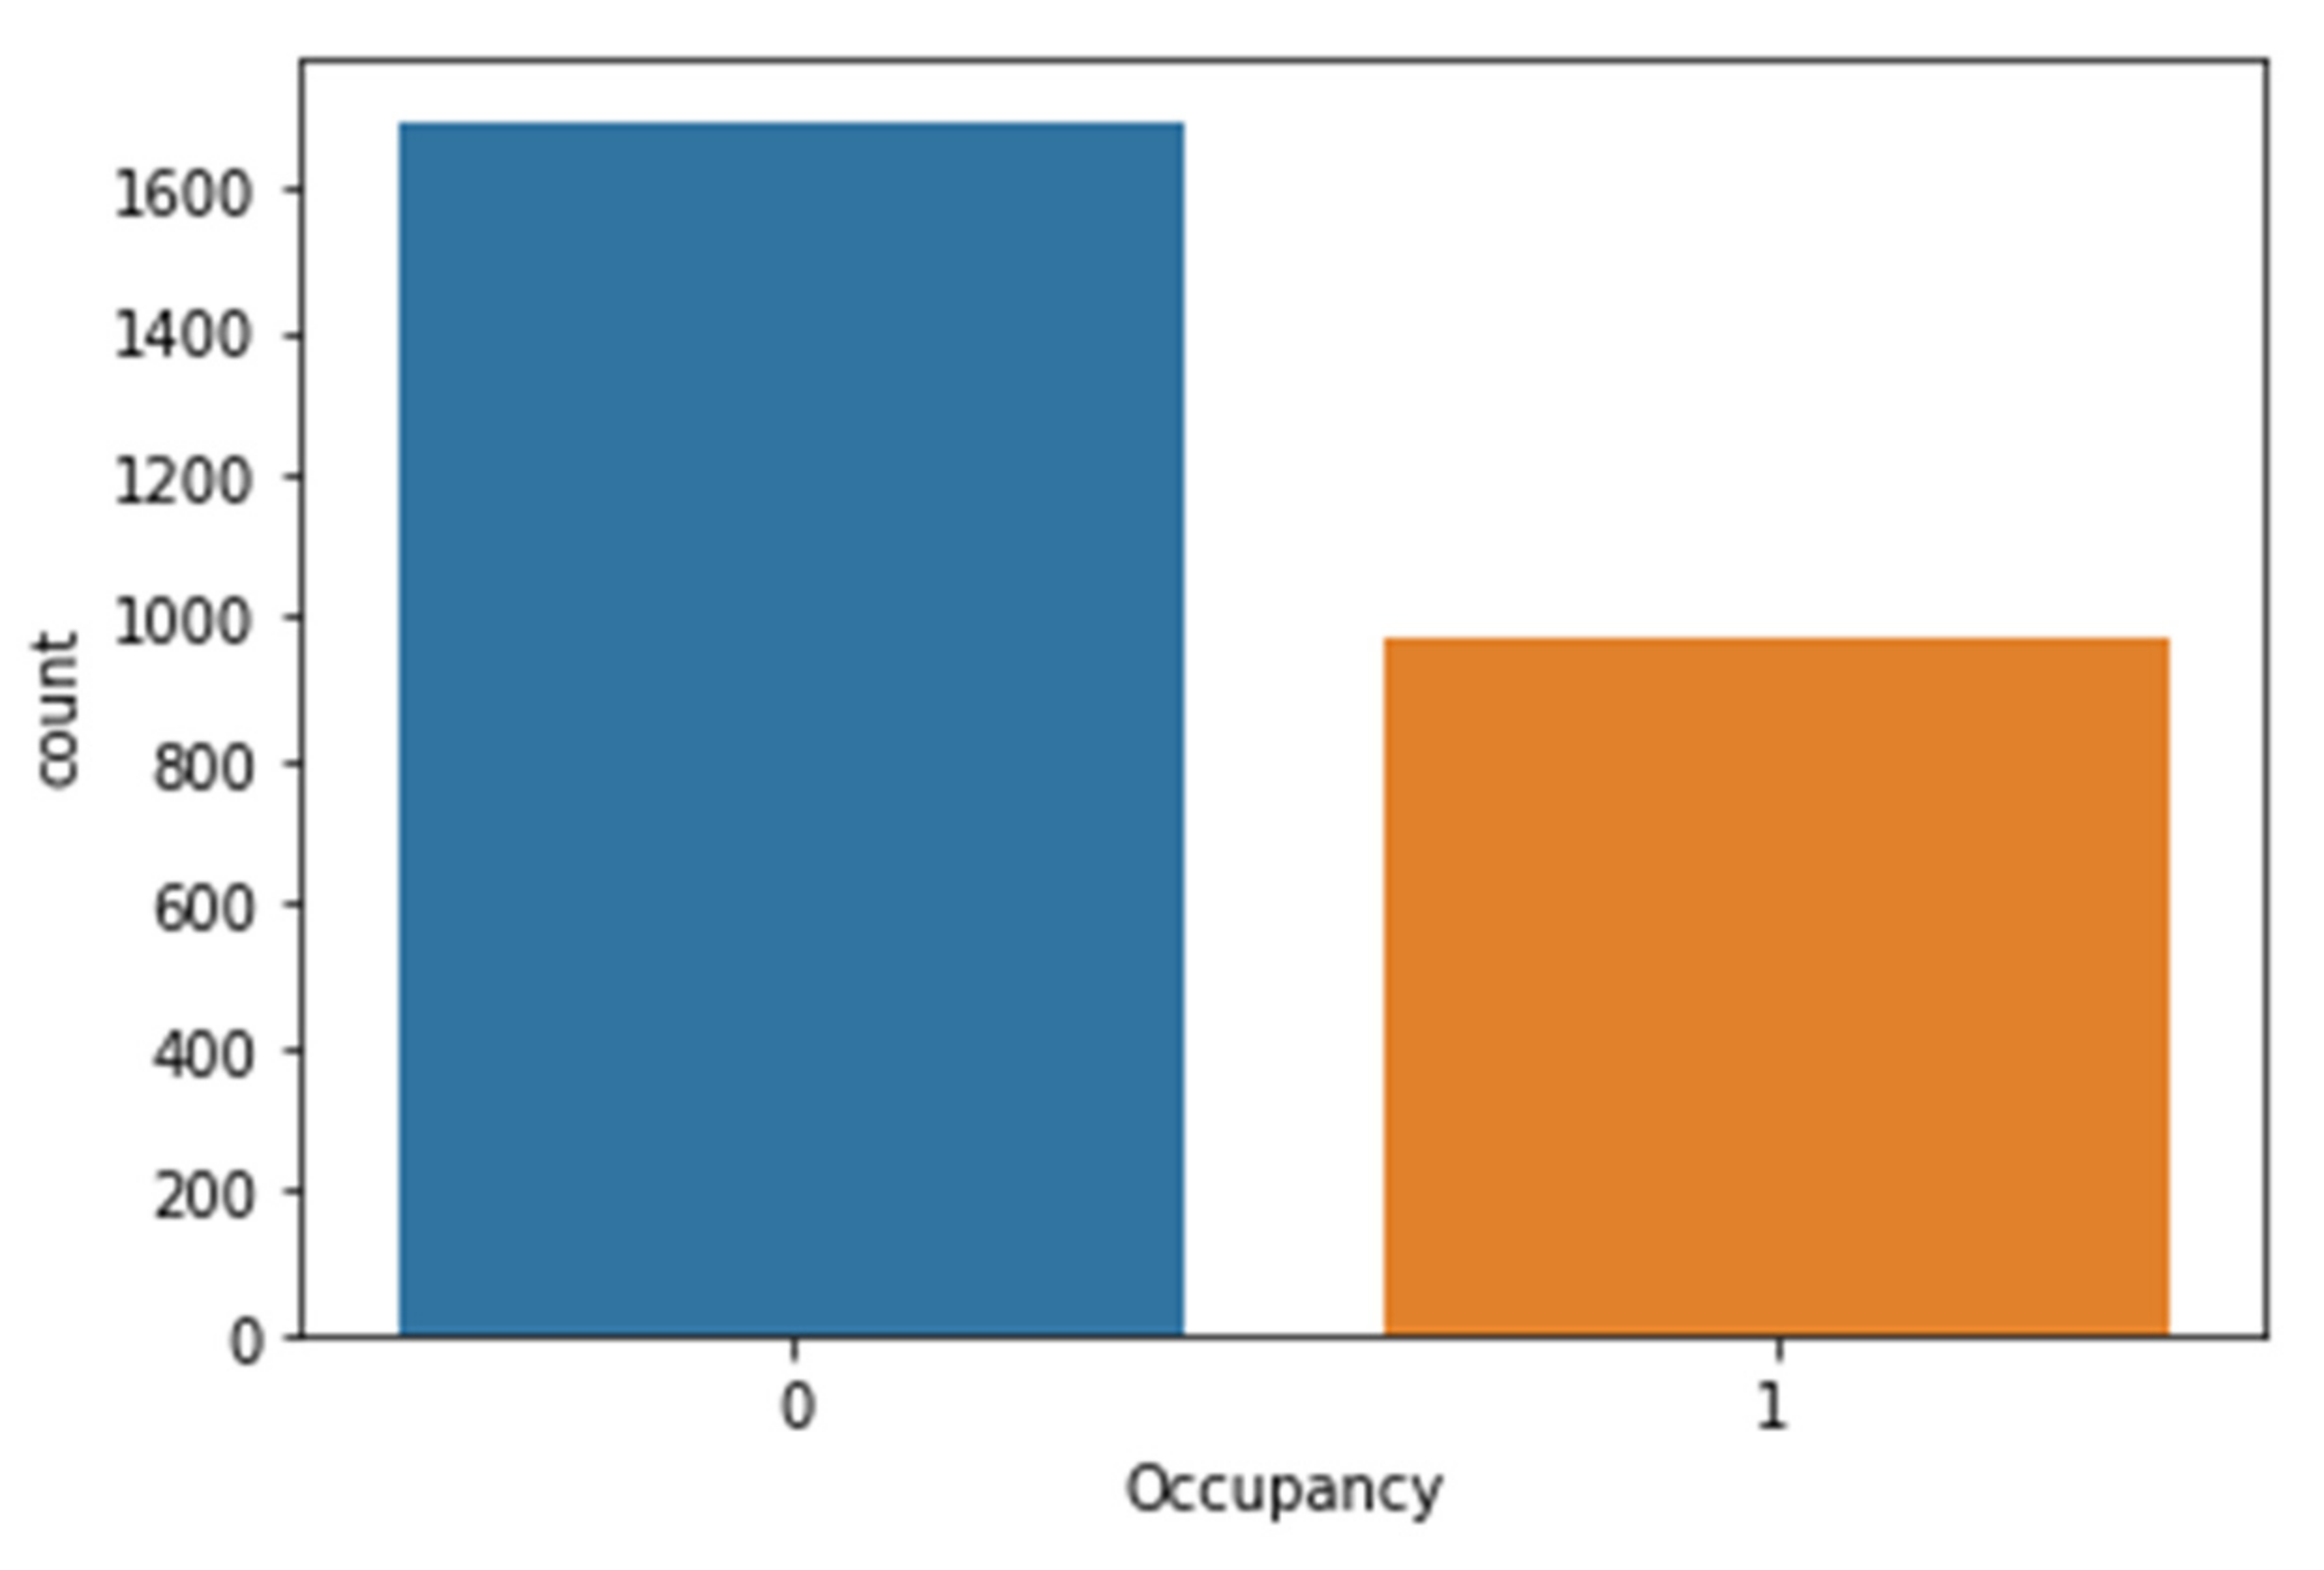
The classification models were tried and tested using the dataset. Temperature, humidity, humidity ratio, light, carbon dioxide (CO
2), and occupancy status (0 for non-occupied, 1 for occupied) are all specified as features of the dataset. The distributions of the classes are also displayed in
Figure 2. This data set holds 2665 rows and six columns with six parts and is available at
https://www.kaggle.com/sachinsharma1123/room-occupancy (accessed on 2 May 2022). Each column in the dataset is described below:
Temperature: in degrees Celsius
Humidity: percentage relative humidity
Light: lux (light)
CO2: in parts per million (ppm)
Humidity Ratio: a quantity derived from temperature and relative humidity, expressed in kilograms of water vapor per kilogram of air
Occupancy: 0 or 1, 0 for unoccupied status, 1 for occupied status
An emphasized analysis is considered over the intra-correlation of features and inter-correlation of the input features and class labels, as well as statistical analysis in the subsequent sections to clarify the research problem and formulate the research questions.
3.1.2. Descriptive Statistical Analysis
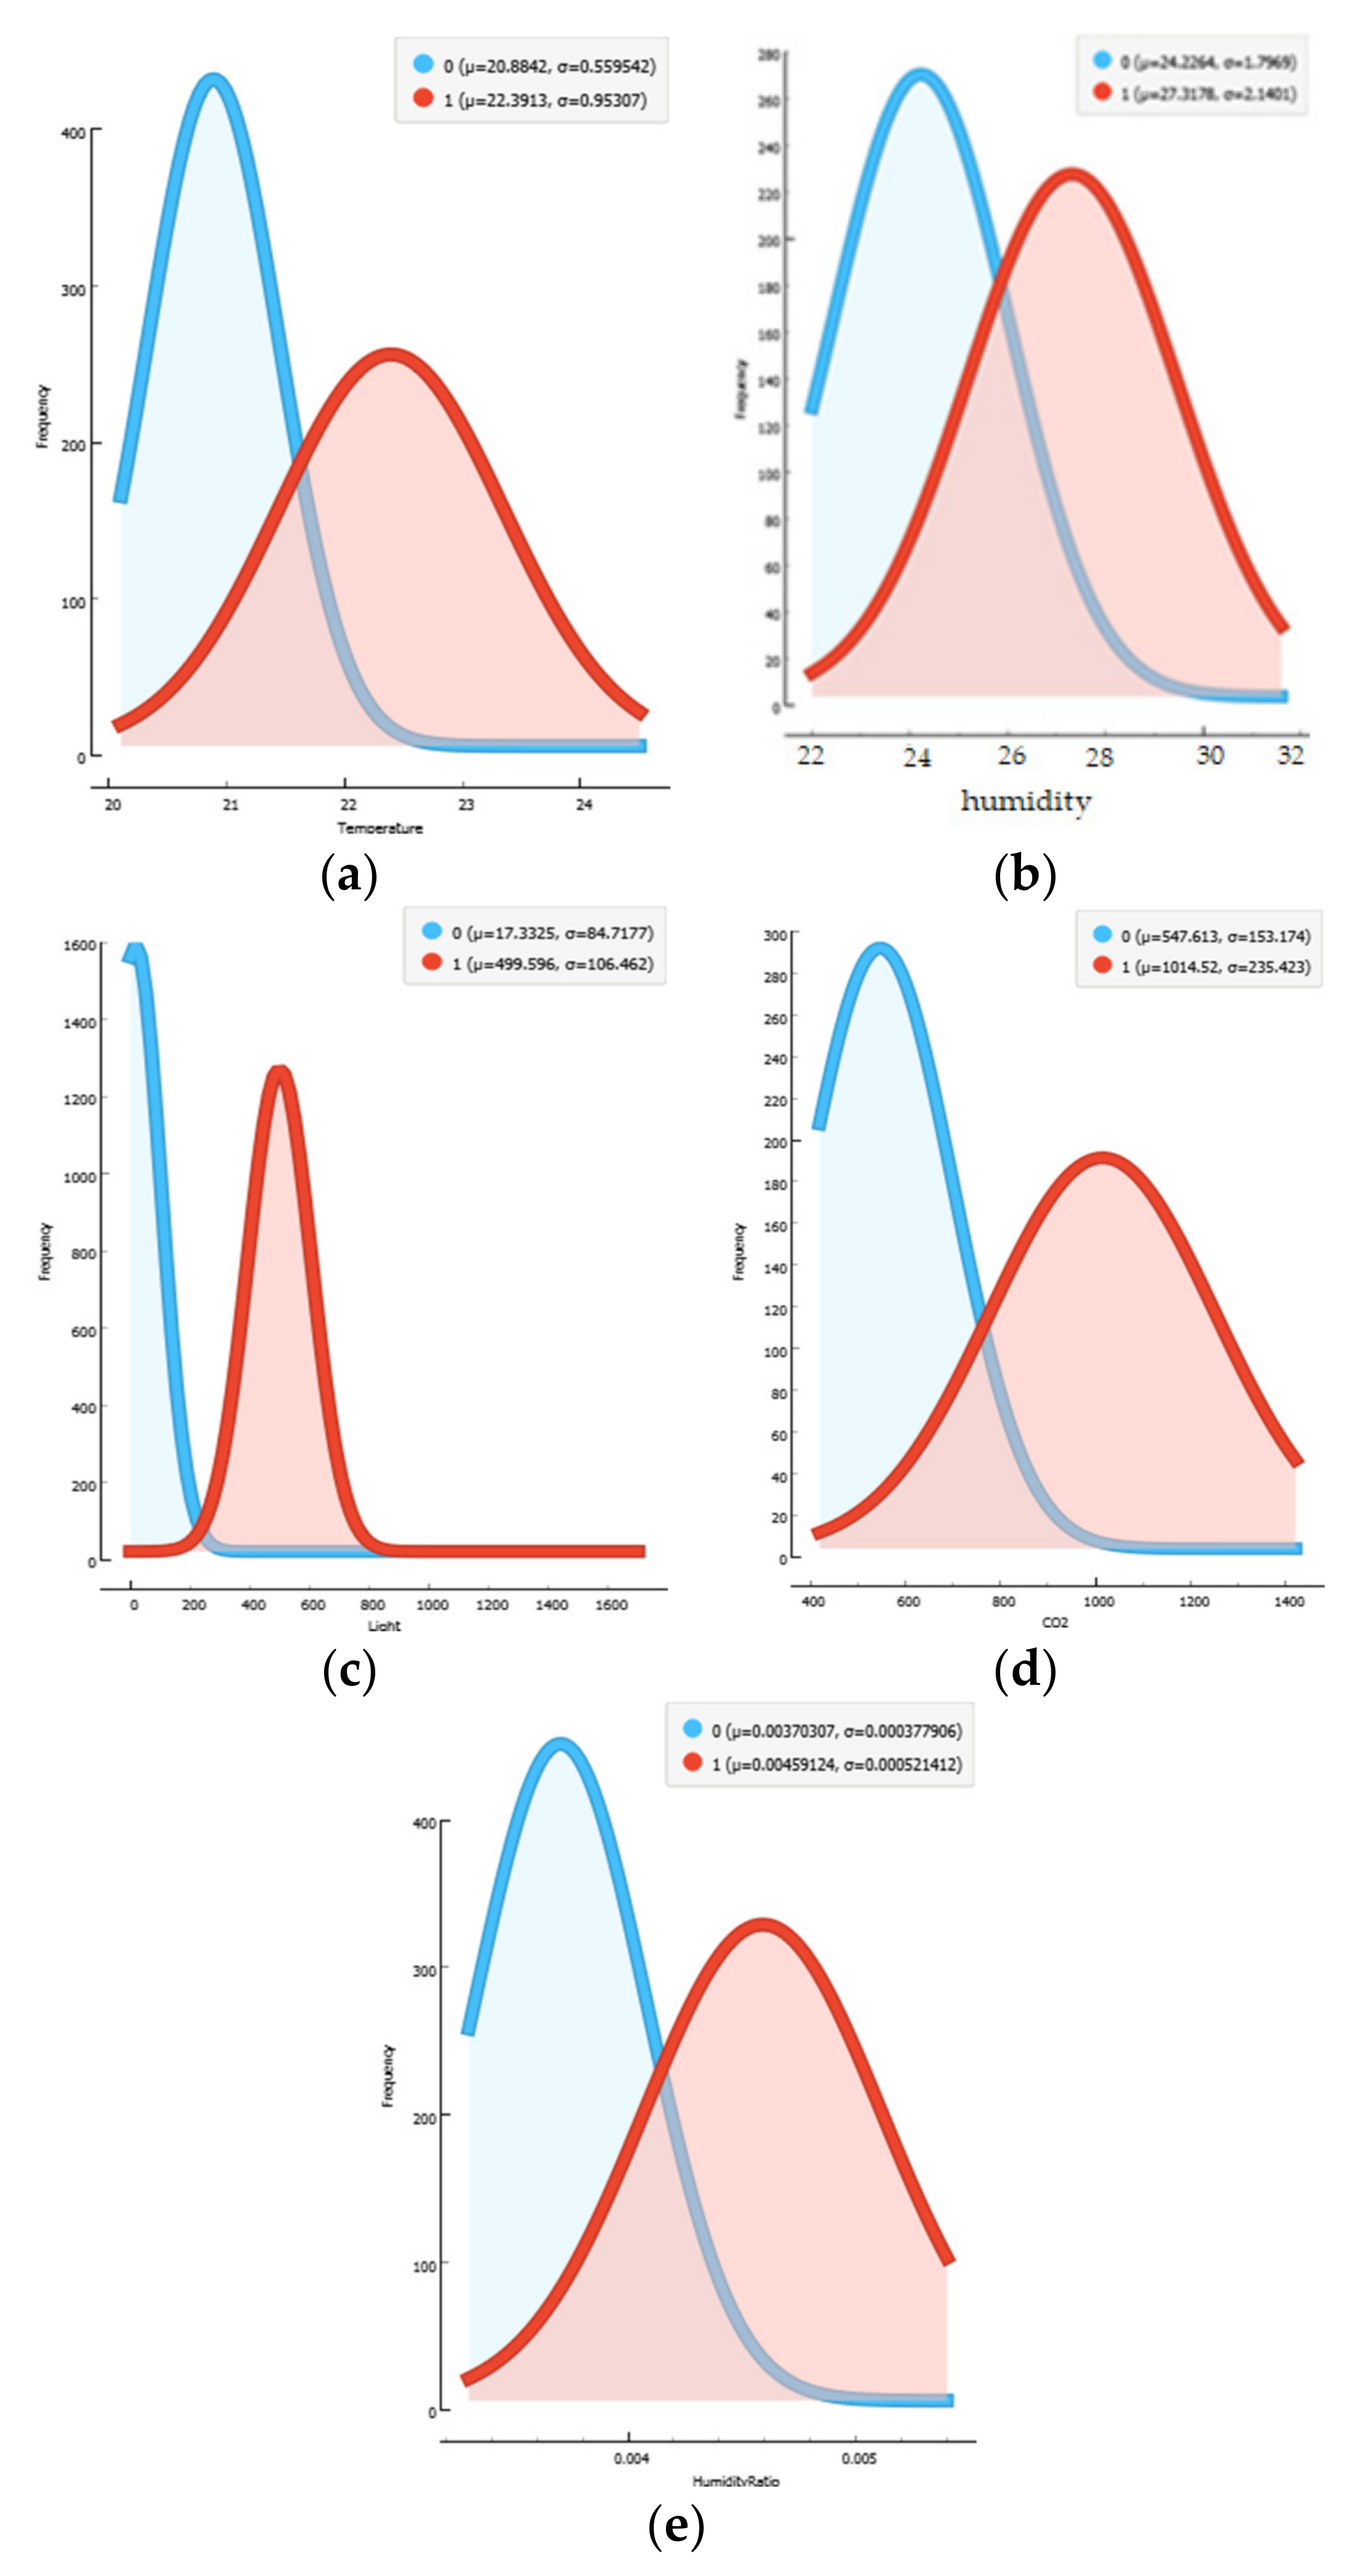
As illustrated in
Figure 3, there is feature frequency overlap between distinct feature categories in the room occupancy classification framework (class 0, class 1). Except for the light feature, this frequency overlap phenomenon has significantly elevated values in the moderate range. As a result, simply preserving the dataset structures and distributions through the room occupancy dataset is insufficient to increase the discriminative capacity of the features for frequency distribution approaches.
Table 1 shows the mean µ and standard deviation σ calculated for all features in the dataset.
A histogram of room environmental factors showing the number of factors (features). The solid curve is a skew-normal density for temperature, humidity, light, and humidity ratio and skew-left for CO
2, as shown in
Figure 2.
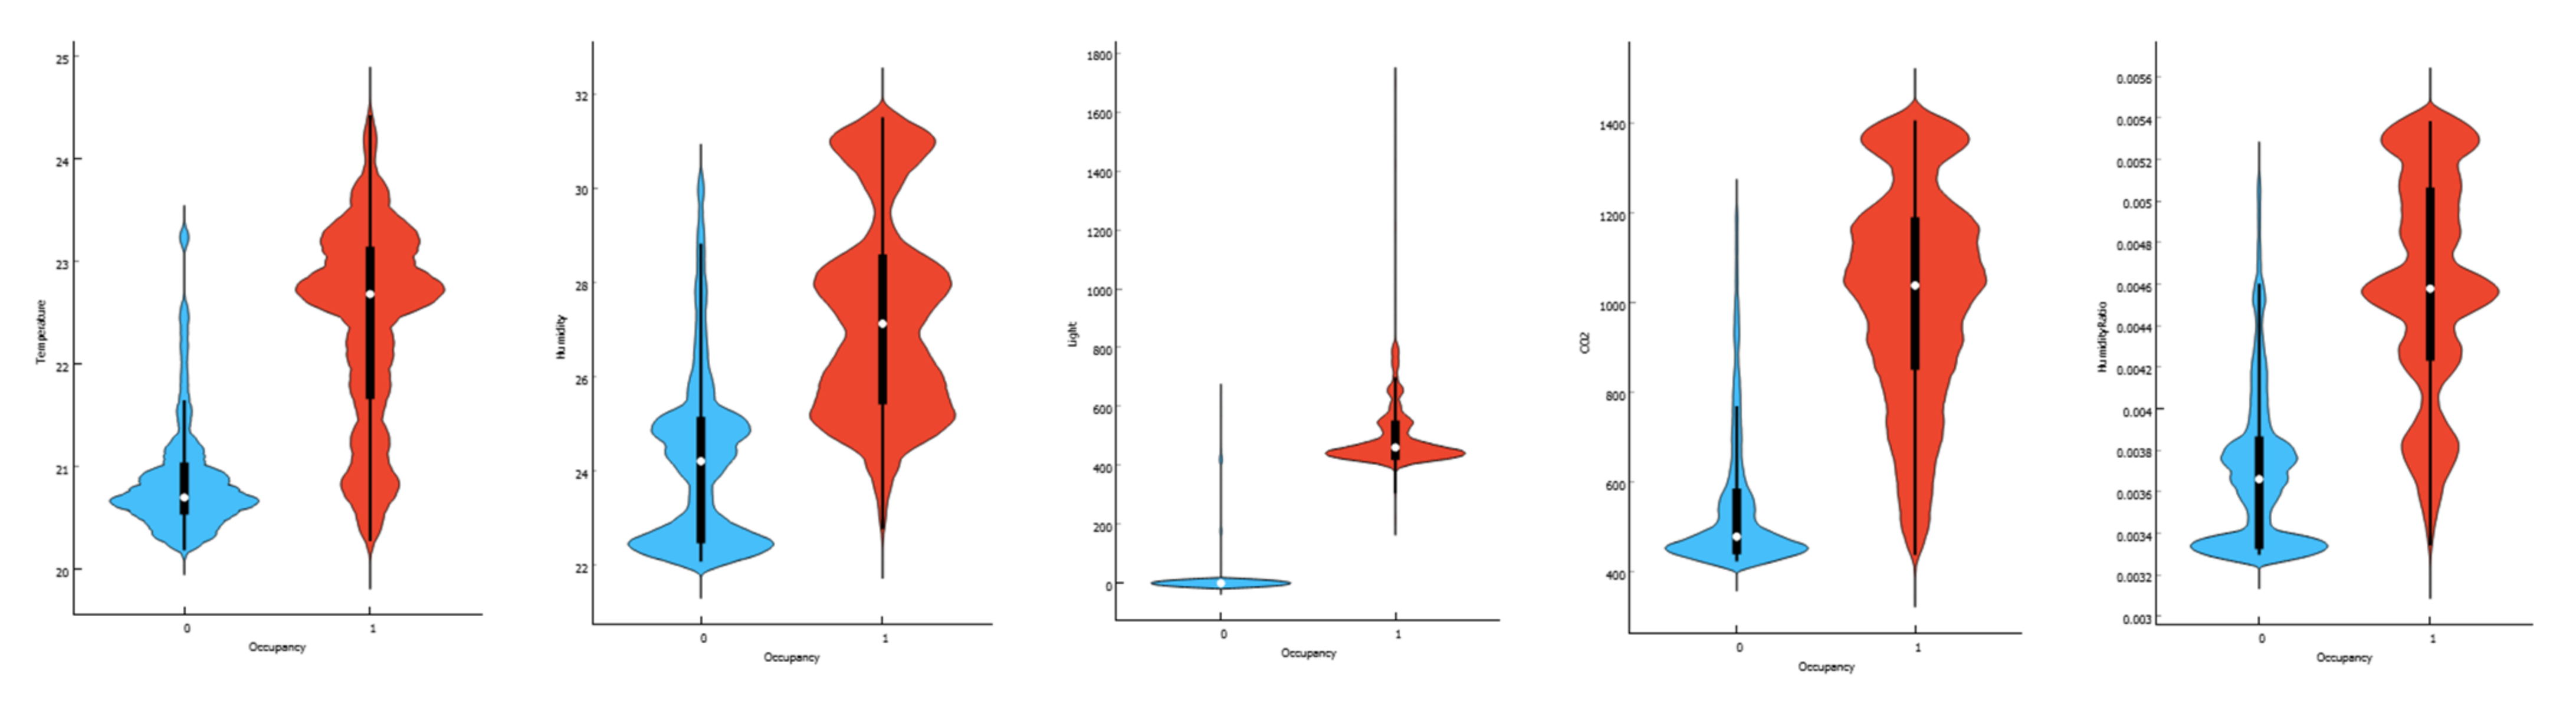
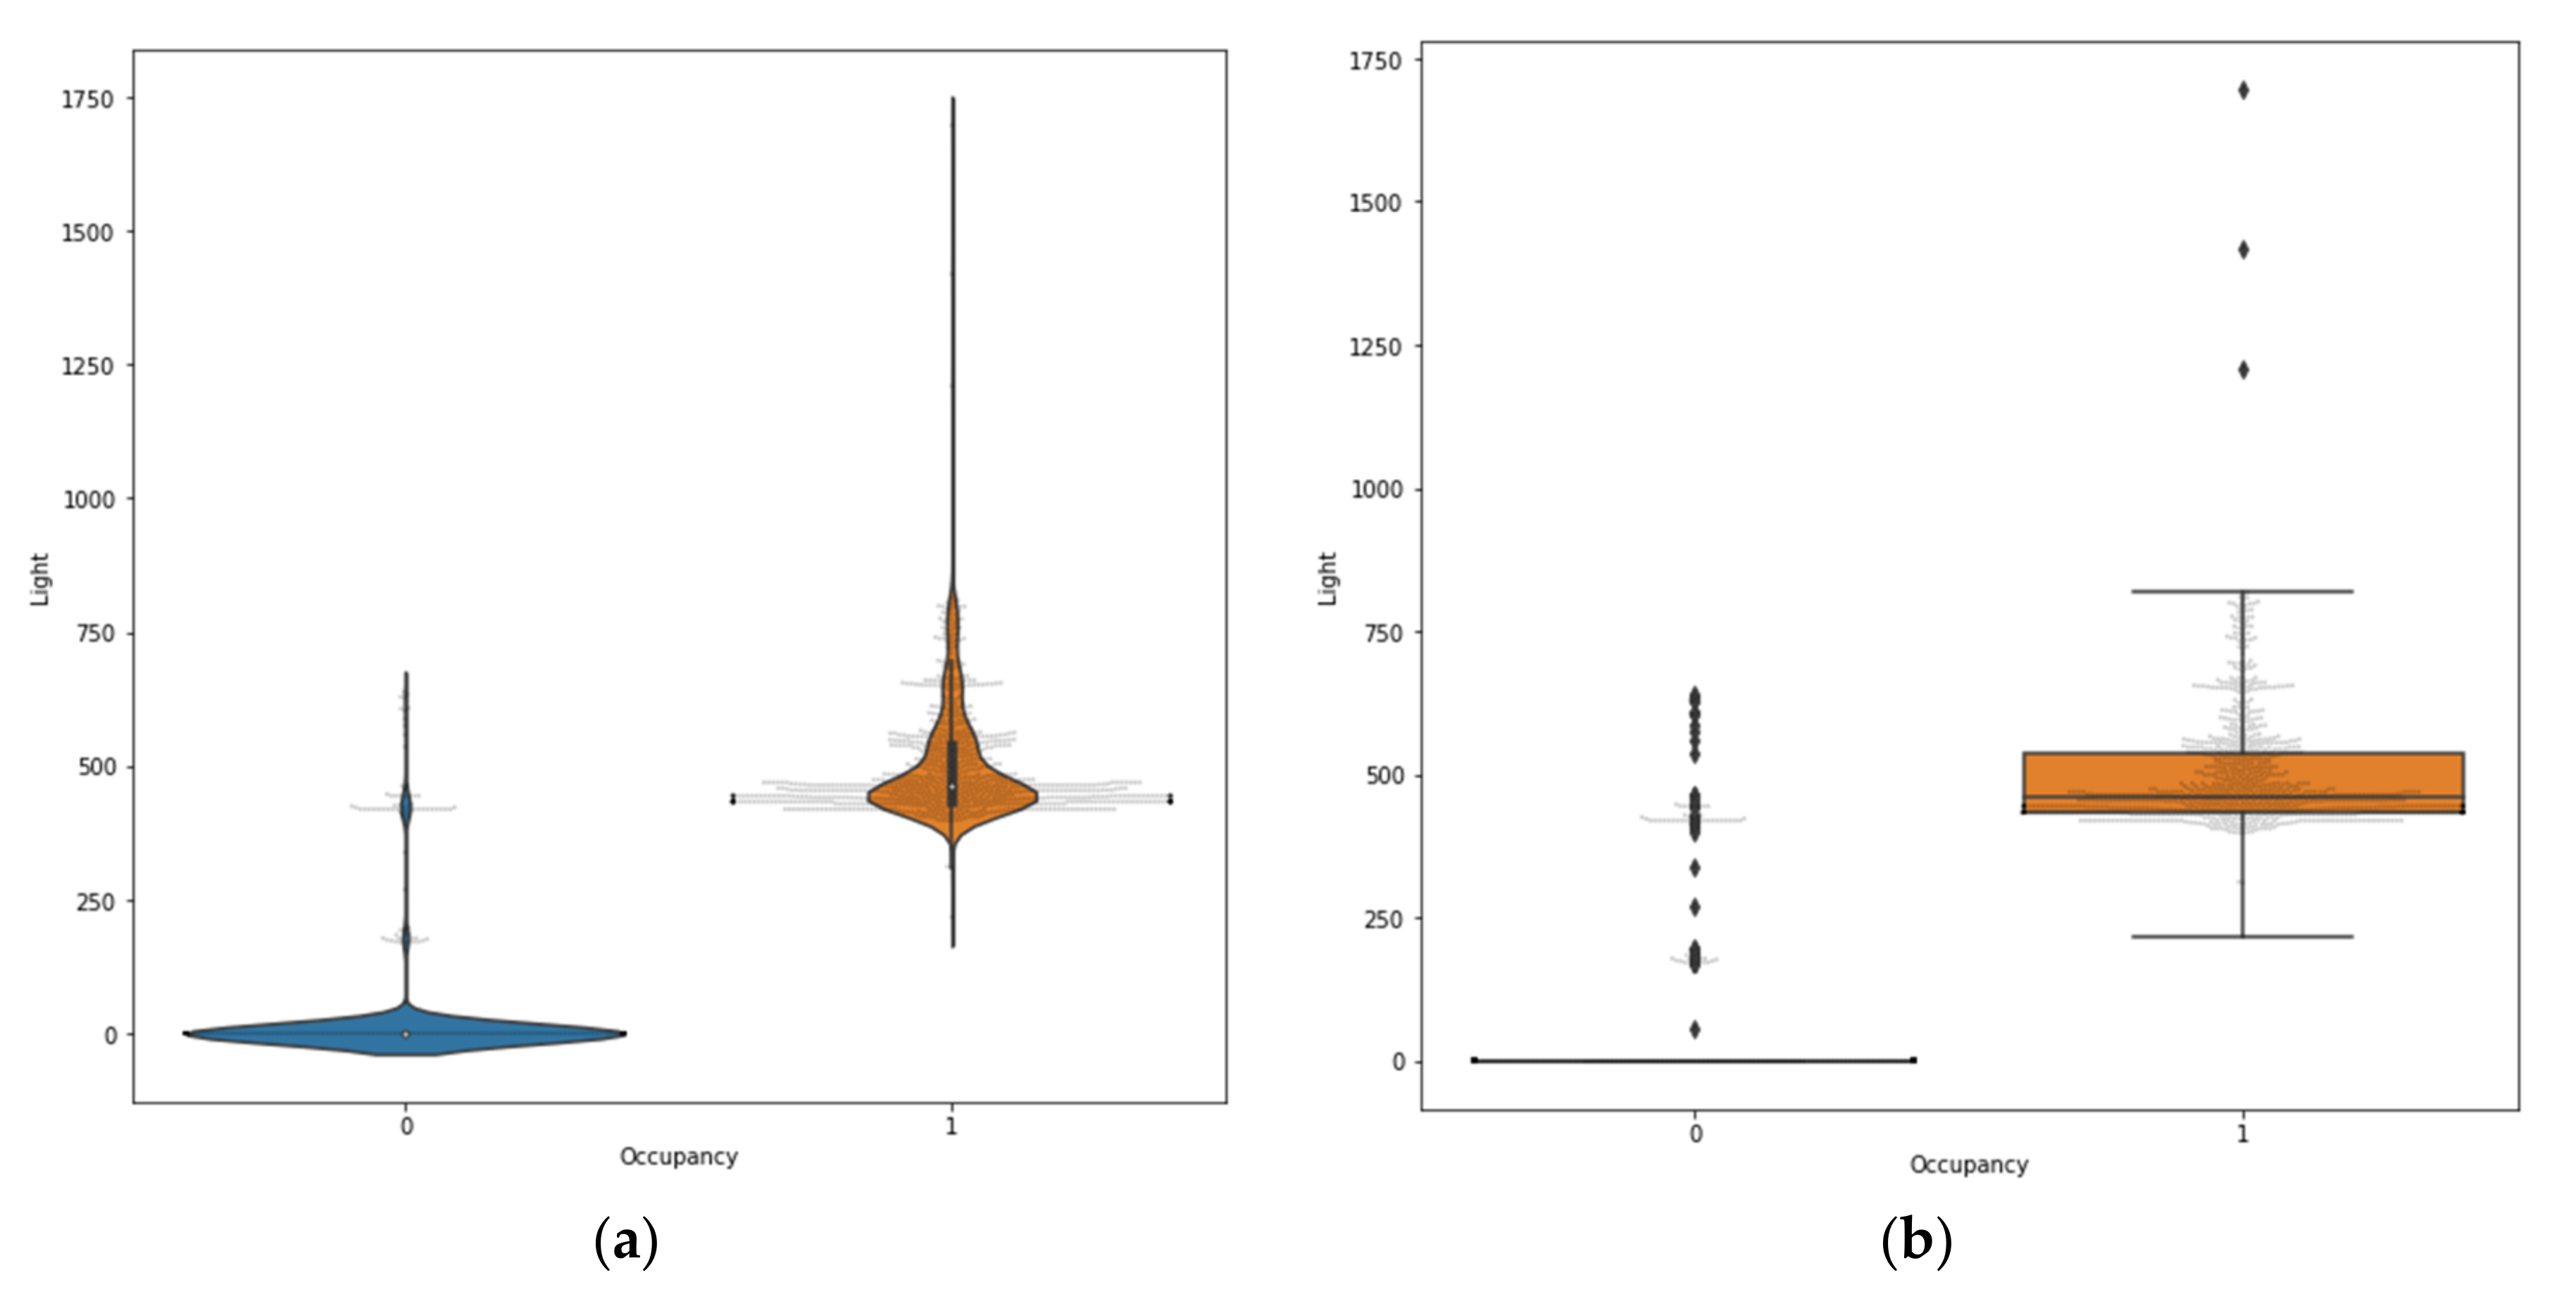
A violin plot [
66], which depicts data peaks, is a cross between a box plot and a kernel density plot. It demonstrates how a numeric room occupancy dataset is dispersed, as shown in
Figure 4 Unlike a box plot, which only displays summary data, violin results show statistical analysis for each feature and the intensity of each feature. The violin plot integrates with the box plot for light feature and occupancy, as shown in
Figure 5a,b. The violin plot is symmetrically displayed to the left and right of the (vertical) boxplot. Adding two density traces in
Figure 5 results in a symmetric display that makes the magnitude of the density easier to observe. This violin and box plot blend allows a quick and informative distribution comparison. When we interpret
Figure 5b, we see that there are light values in class 1 outside of the range, which must be avoided when dealing with data.
Figure 6 depicts a pairs plot illustrating the link between all features. The orange dots reflect an occupied state, whereas the blue dots represent an unoccupied status. The temperature and humidity map clearly shows no separation between the orange and blue dots. The same occurs when temperature and CO
2 are combined, as with humidity and CO
2, temperature and humidity ratio, humidity and humidity ratio, and CO
2 and humidity ratio. Temperature and light, humidity and light, light and CO
2, and light and humidity ratio, on the other hand, exhibit a strong separation trend for the orange and blue dots, indicating that these pair configurations are excellent fits for training the classification techniques.
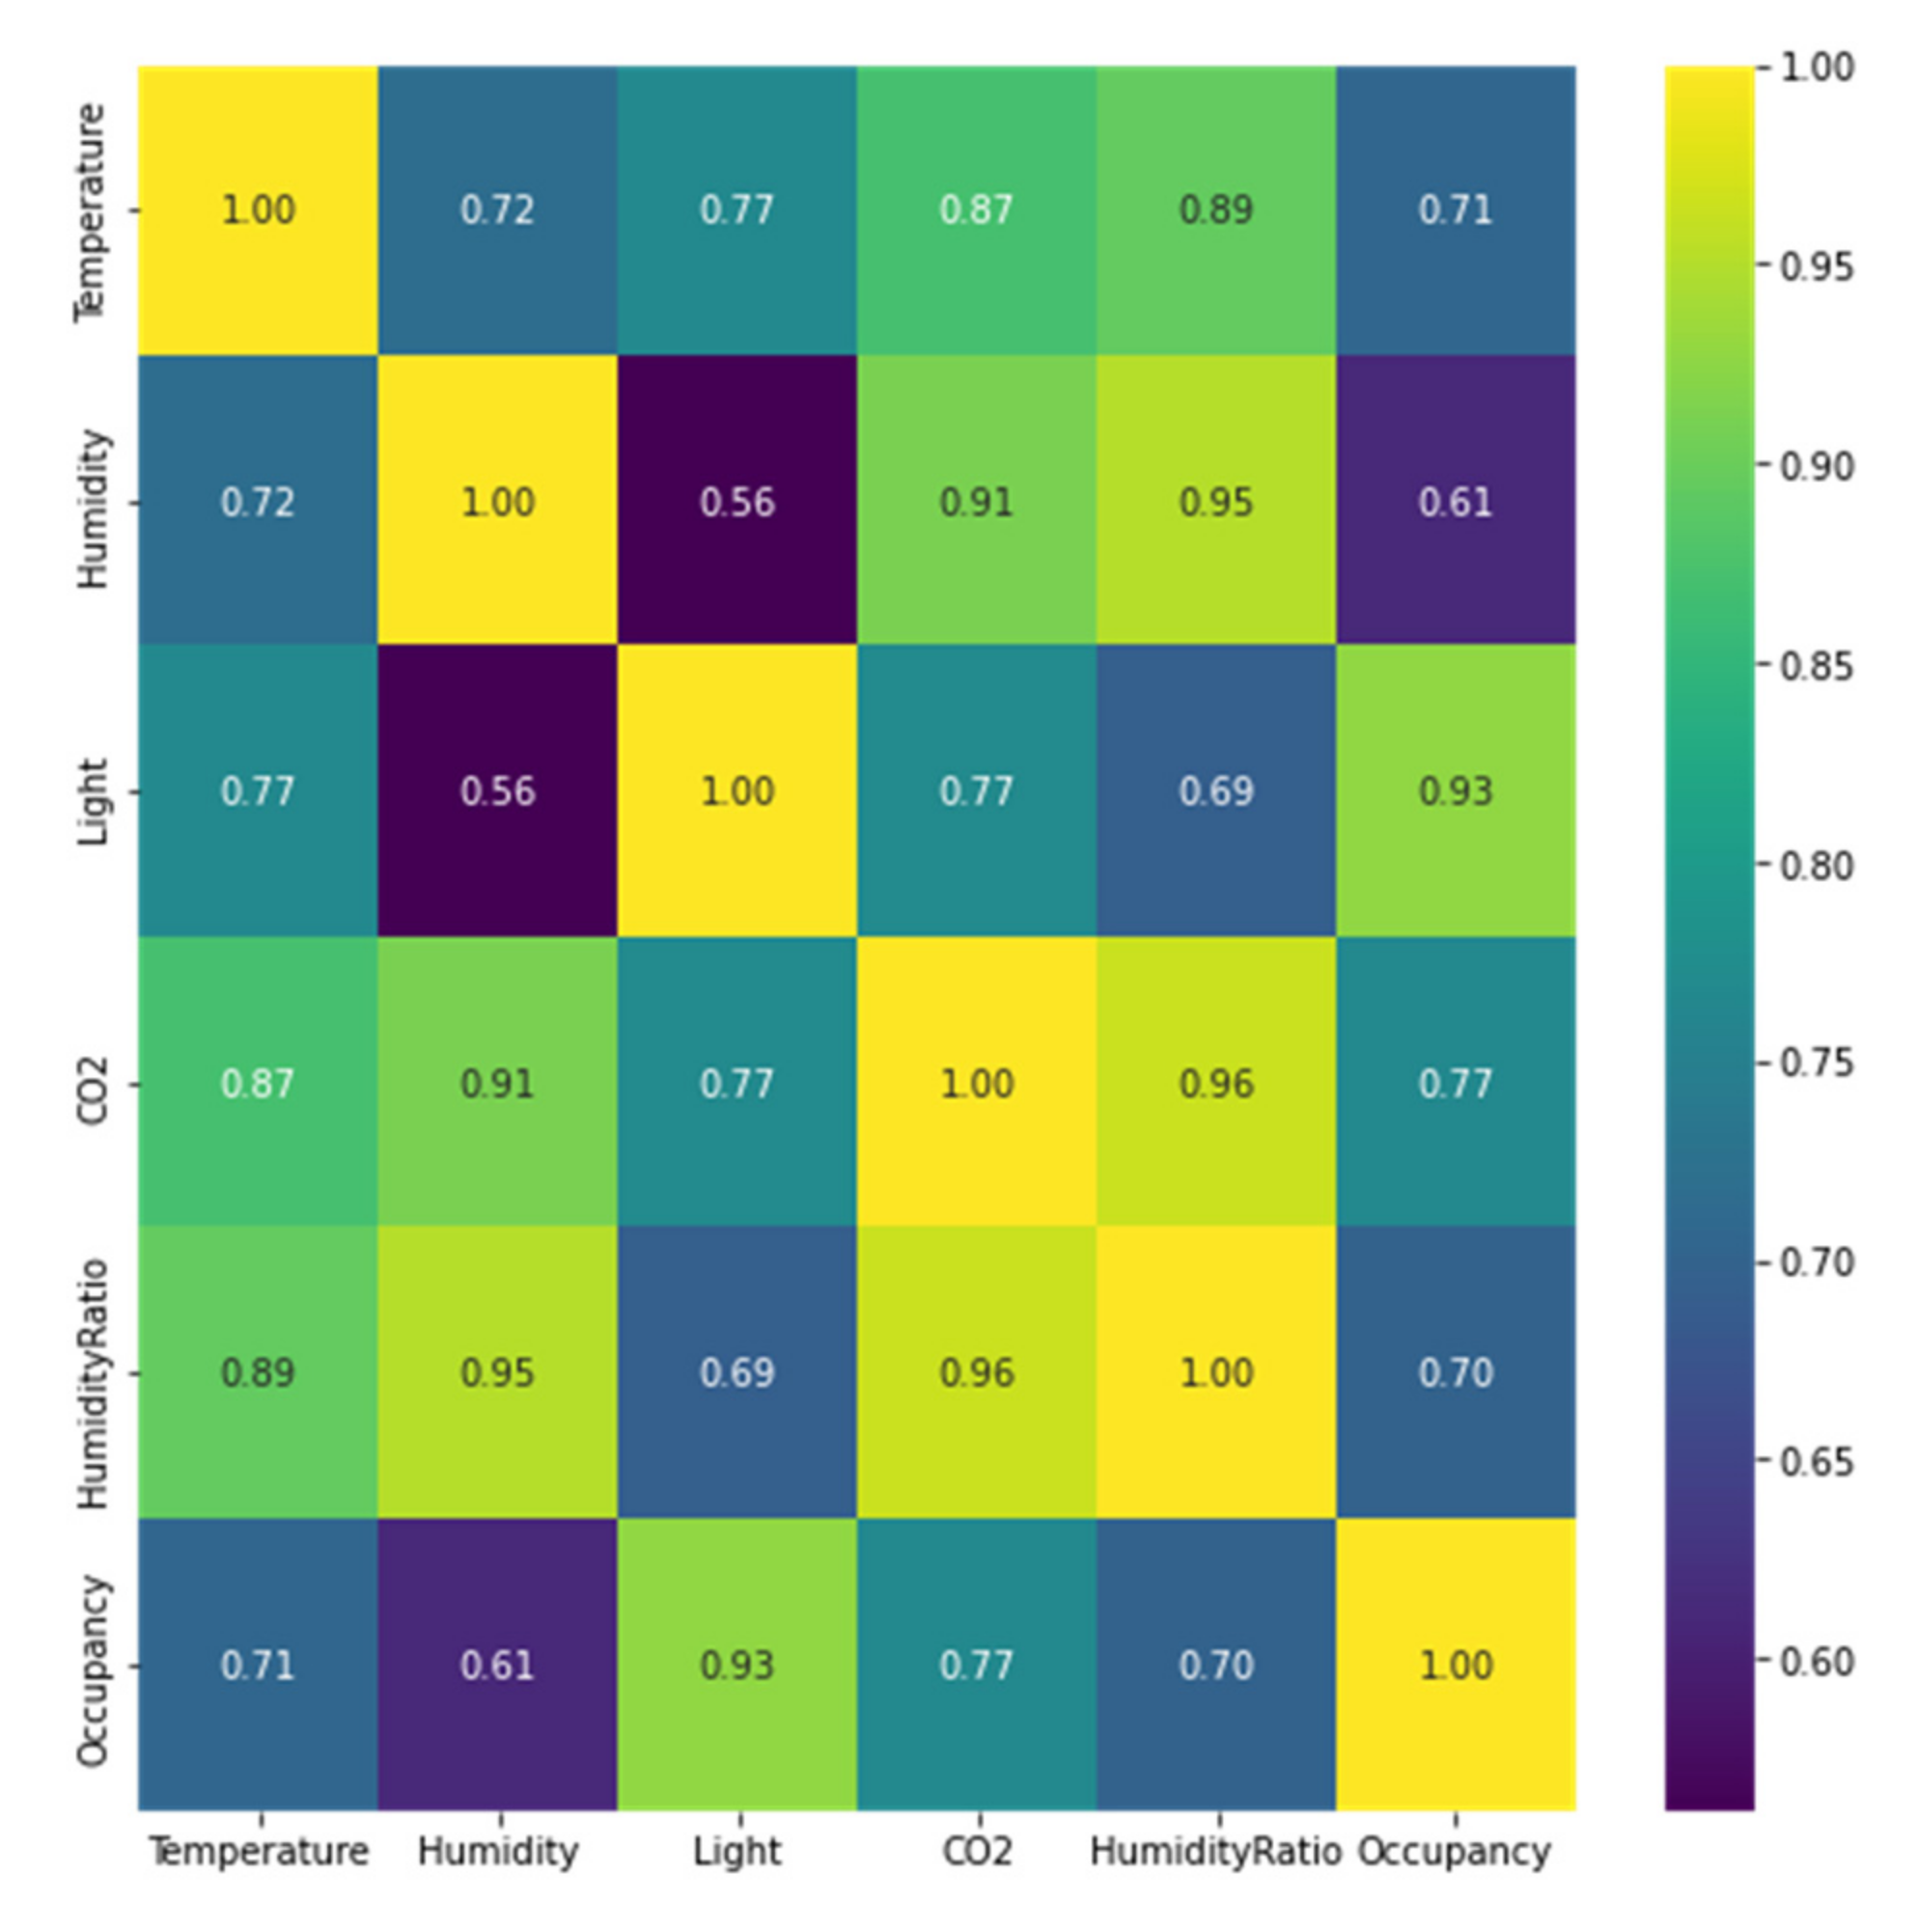
Figure 7 depicts a graphical representation of the orange package’s confusion matrix, which shows the relationship between all room environment features and occupancy in a color palette.
Figure 8 demonstrates a heatmap representing the correlation values ranged from 0 to +1. Positive and strong correlations are considered to be values near +1. The value of light and occupancy have a higher positive correlation of 0.93. Thus, features with a correlation value close to zero with the quality characteristic related to occupancy with a value of zero were not identified.
3.1.3. Room Occupancy Dataset Preprocessing
The ability to clean a dataset is frequently the difference between a successful and an average ML model. Outlier detection and treatment is one of the most challenging issues in data cleansing. Outliers are observations that are considerably different from the rest of the dataset. Even the best ML algorithms will underperform if outliers are not removed from the dataset. Outliers could negatively impact the ML algorithm’s training process, causing a loss of accuracy.
Outlier Treatment
As explained previously in the statistical analysis of the dataset, the dataset contains outlier values of features that are rejected using outlier rejection with standard deviation and mean [
67].
Min-Max Normalization
Many ML algorithm estimators require dataset standards; otherwise, they may misbehave if the individual features do not resemble standardized data. A Gaussian has a mean of zero and a variance of one. Min–Max Normalization, commonly known as (0–1) Normalization, converts
x to
x’s by transforming each value of features to a range between 0 and 1. The range might be between −1 and 1 if the data had negative numbers in Equation (1).
where
corresponds to the normalized value (feature),
x is an original feature, max(
x) is the maximum value of
x, and min(
x) is the minimum value of
x.
3.2. ML Classification
Three ML techniques, KNN, AO-ANN, and DT, were applied to classify the occupancy profile based on the environmental features of the room occupancy dataset.
3.2.1. K-Nearest Neighbors (KNN) Model
Because it is a nonparametric, nonlinear, distance-based technique, the k-nearest neighbors (KNN) algorithm is widely used for prediction and classification [
68]. Considering a training sample (
xi,
yi) with
i = 1, 2,…,
n and a testing sample
t, the distance,
di, between
t and
xi can be determined just like in Equation (2).
where ||.|| denotes the distance. The Euclidean distance is among the most commonly used distance calculations. After calculating the distance
di, where
i = 1, 2,…
N, the labels of the
i training samples with the least distance can be used. A majority vote will then determine the label of the testing sample.
Table 2 shows the values of parameters used in the KNN model [
69].
3.2.2. Hybrid Adam Optimizer–Artificial Neural Network–Back-Propagation Network (AO–ANN (BP)) Model
ANN method solves problems effectively in the human brain’s method; a network of basic neuron units connects the outputs to the inputs via directed and weighted graphs. The ANN algorithm’s skills are used in regression analysis, time series prediction, and modelling, classification (including pattern classification and sequencing decisions), and other areas [
70].
Adam Optimizer
The Adam optimizer (AO) was used in this paper to optimize the generation of weights and biases, as illustrated in
Figure 9. Adam is an adaptive learning rate method, which means it computes different learning rates for various features. It gets its name from adaptive moment estimation. Adam modifies the learning rate for each neural network weight by estimating the first and second moments of the gradient [
71].
The AO–ANN (BP) typically includes an input layer, a hidden layer, and an output layer with random weights. Training dataset (
xi,
yi).
xi is a data collection from selected features, and
yi is the matching occupancy characteristic feature.
Table 3 shows the values of parameters used in the AO–ANN (BP) model.
3.2.3. Decision Tree (DT) Model
The DT classifier is a way to multistage decisions, including table look-up rules, decision table converting to efficient decision trees and sequential methods. The primary principle behind any multistage strategy is to break down a complex decision into numerous simple options, hoping that the ultimate result will resemble the optimal solution.
3.3. Explainability (XIA) Pipeline with SHAP
The explainability of modelling has become an essential component of the ML workflow. Maintaining the ML technique as a “black box” is no longer an option [
72].
SHAP (Shapley Additive Explanations)
Fortunately, there are rapidly growing techniques that have become more widespread. Lundberg and Lee (2016) used Shapley Additive Explanations to explain specific predictions using game theoretically appropriate Shapley values. It is a popular cooperation game theory strategy offering attractive qualities. The SHAP is used to understand why machine learning models (DT, KNN, or AO–ANN) suggested that a room was occupied or vacant. In other words, the SHAP is used to demystify a black-box model. Shapley values are based on each possible combination of f features (f going from 0 to F, F is the number of all features available, called power set. SHAP requires training a distinct predictive model for each distinct coalition in the power set, meaning 2
F models. Needless to say, these models are completely equivalent to each other for what concerns their hyperparameters and their training dataset. The only thing that changes is the set of features included in the model, i.e., thermal comfort parameters.
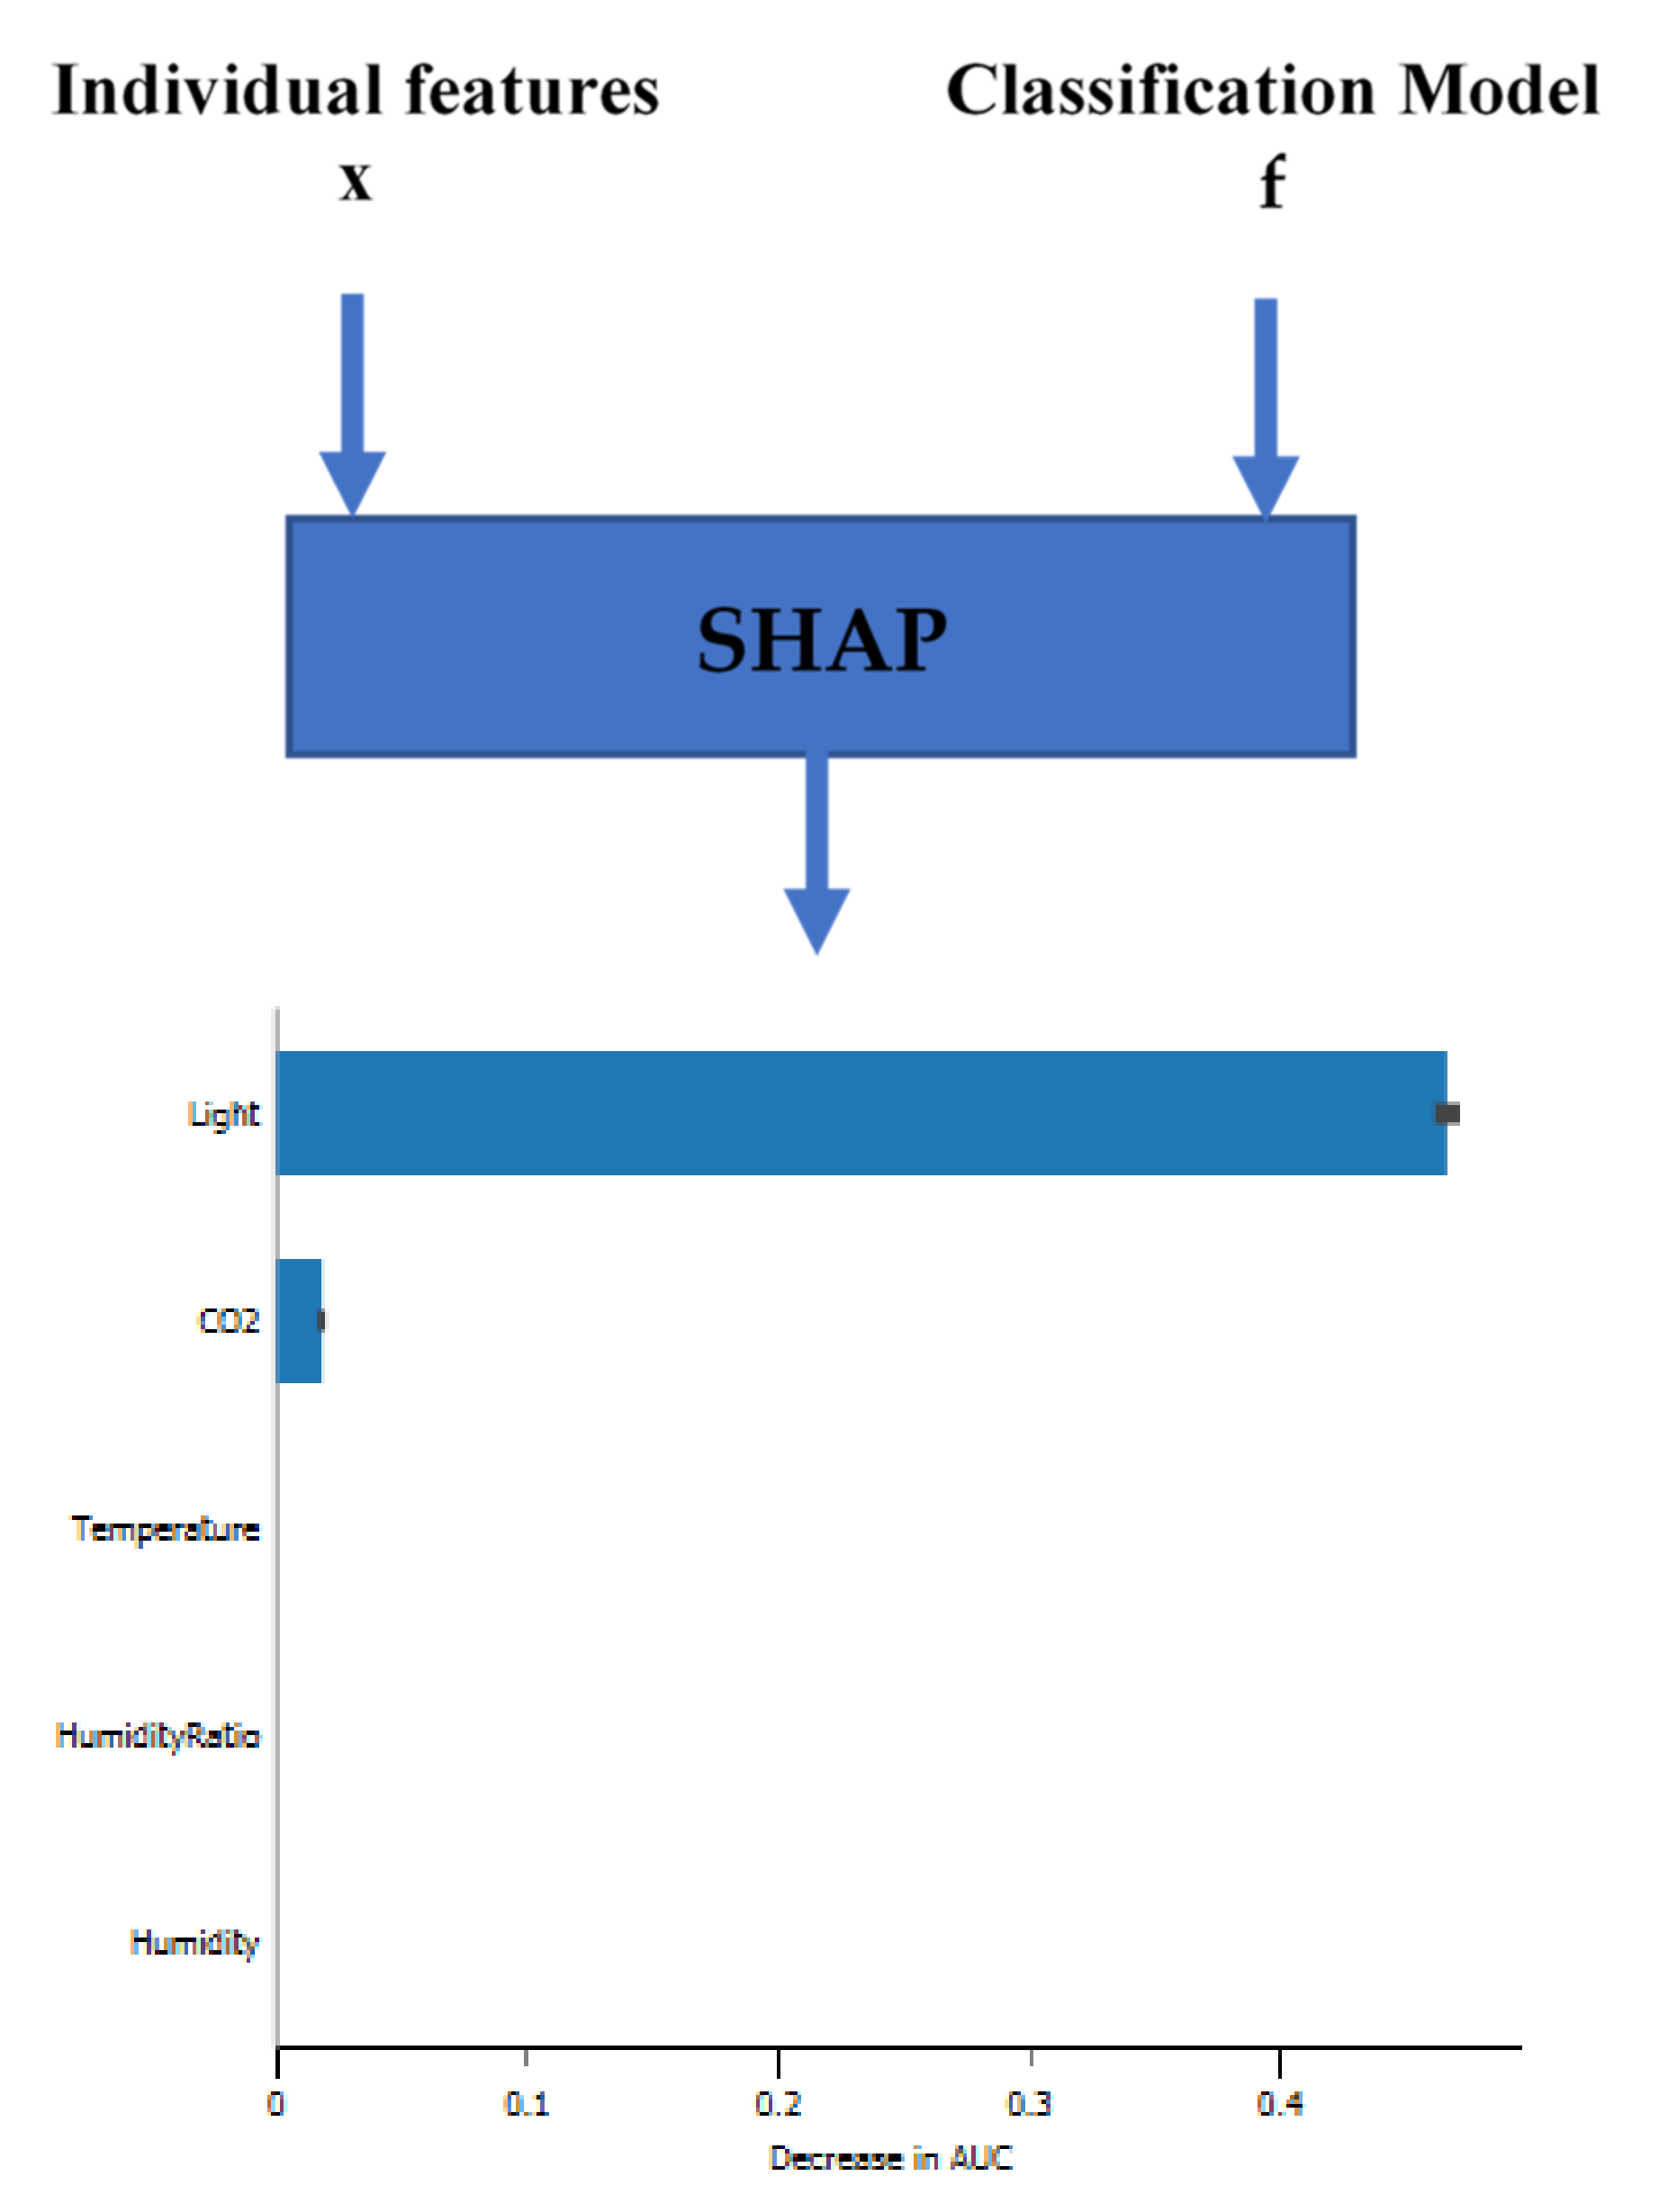
Figure 10 summarizes how to apply SHAP to interpret any model’s predictions.
A data instance’s attribute values operate as coalition members. The mean effective contribution of a selected attribute over all conceivable coalitions is the Shapley value.
According to SHAP [
73], the explanation is as follows:
where
Q is the explanation model,
∈{0, 1}
N is the coalition vector,
N is the maximum coalition size and
∈
R is the feature attribution for a feature
j, the Shapley values. This paper will refer to “coalition vector” as “simplified features” in the SHAP technique.
4. Evaluation Results
This section gives the findings on the performance of the two suggested workflows for occupancy classification and explores several use scenarios and their benefits and drawbacks. We employ explainability methods to examine the feature classification method of the second workflow thoroughly.
4.1. Environmental Experimental Setup
The following hardware specifications have been used to obtain and execute the results: CPU Intel core i7 11th Generation (one socket, eight cores, eight threads), RAM 16GB and Python ML packages, and orange data mining tool on Minecraft Windows 11 that is built on open-source machine learning and data visualization.
4.2. Results Evaluation
Accuracy, precision, recall, and F1-score are the four primary measures to evaluate a classification model, as shown in Equations (4)–(7).
Accuracy: the percentage of correctly predicted results for the testing data is accuracy. The unit is able to find out by dividing the number of correct predictions by the total number of predictions.
Precision: is the proportion of true positives among all examples that correspond to a specific class.
Recall: is defined as the proportion of instances predicted to belong to a class divided by the total number of cases that belong to the class.
F1-score: conveys a balance between precision and recall.
4.2.1. Analysis of ML Based Method
The dataset is separated into training and testing portions to analyze the proposed models: 75% for training and 25% for testing. The training data are used to specify and measure the models accurately. On the other hand, the test data are only used at the end of the model-generation process to determine how well the model performs.
Table 4 displays the results evaluation of ML models. The performance measures of three ML techniques, KNN, DT, and AO-ANN (BP), in terms of classification of the occupancy room, are depicted in
Table 4. The results demonstrate that the KNN performs better than the DT and AO-ANN (BP) classification models. And though the two classifiers in this study are designed to evaluate variations in interpretations, we must ensure that they have accurate detection.
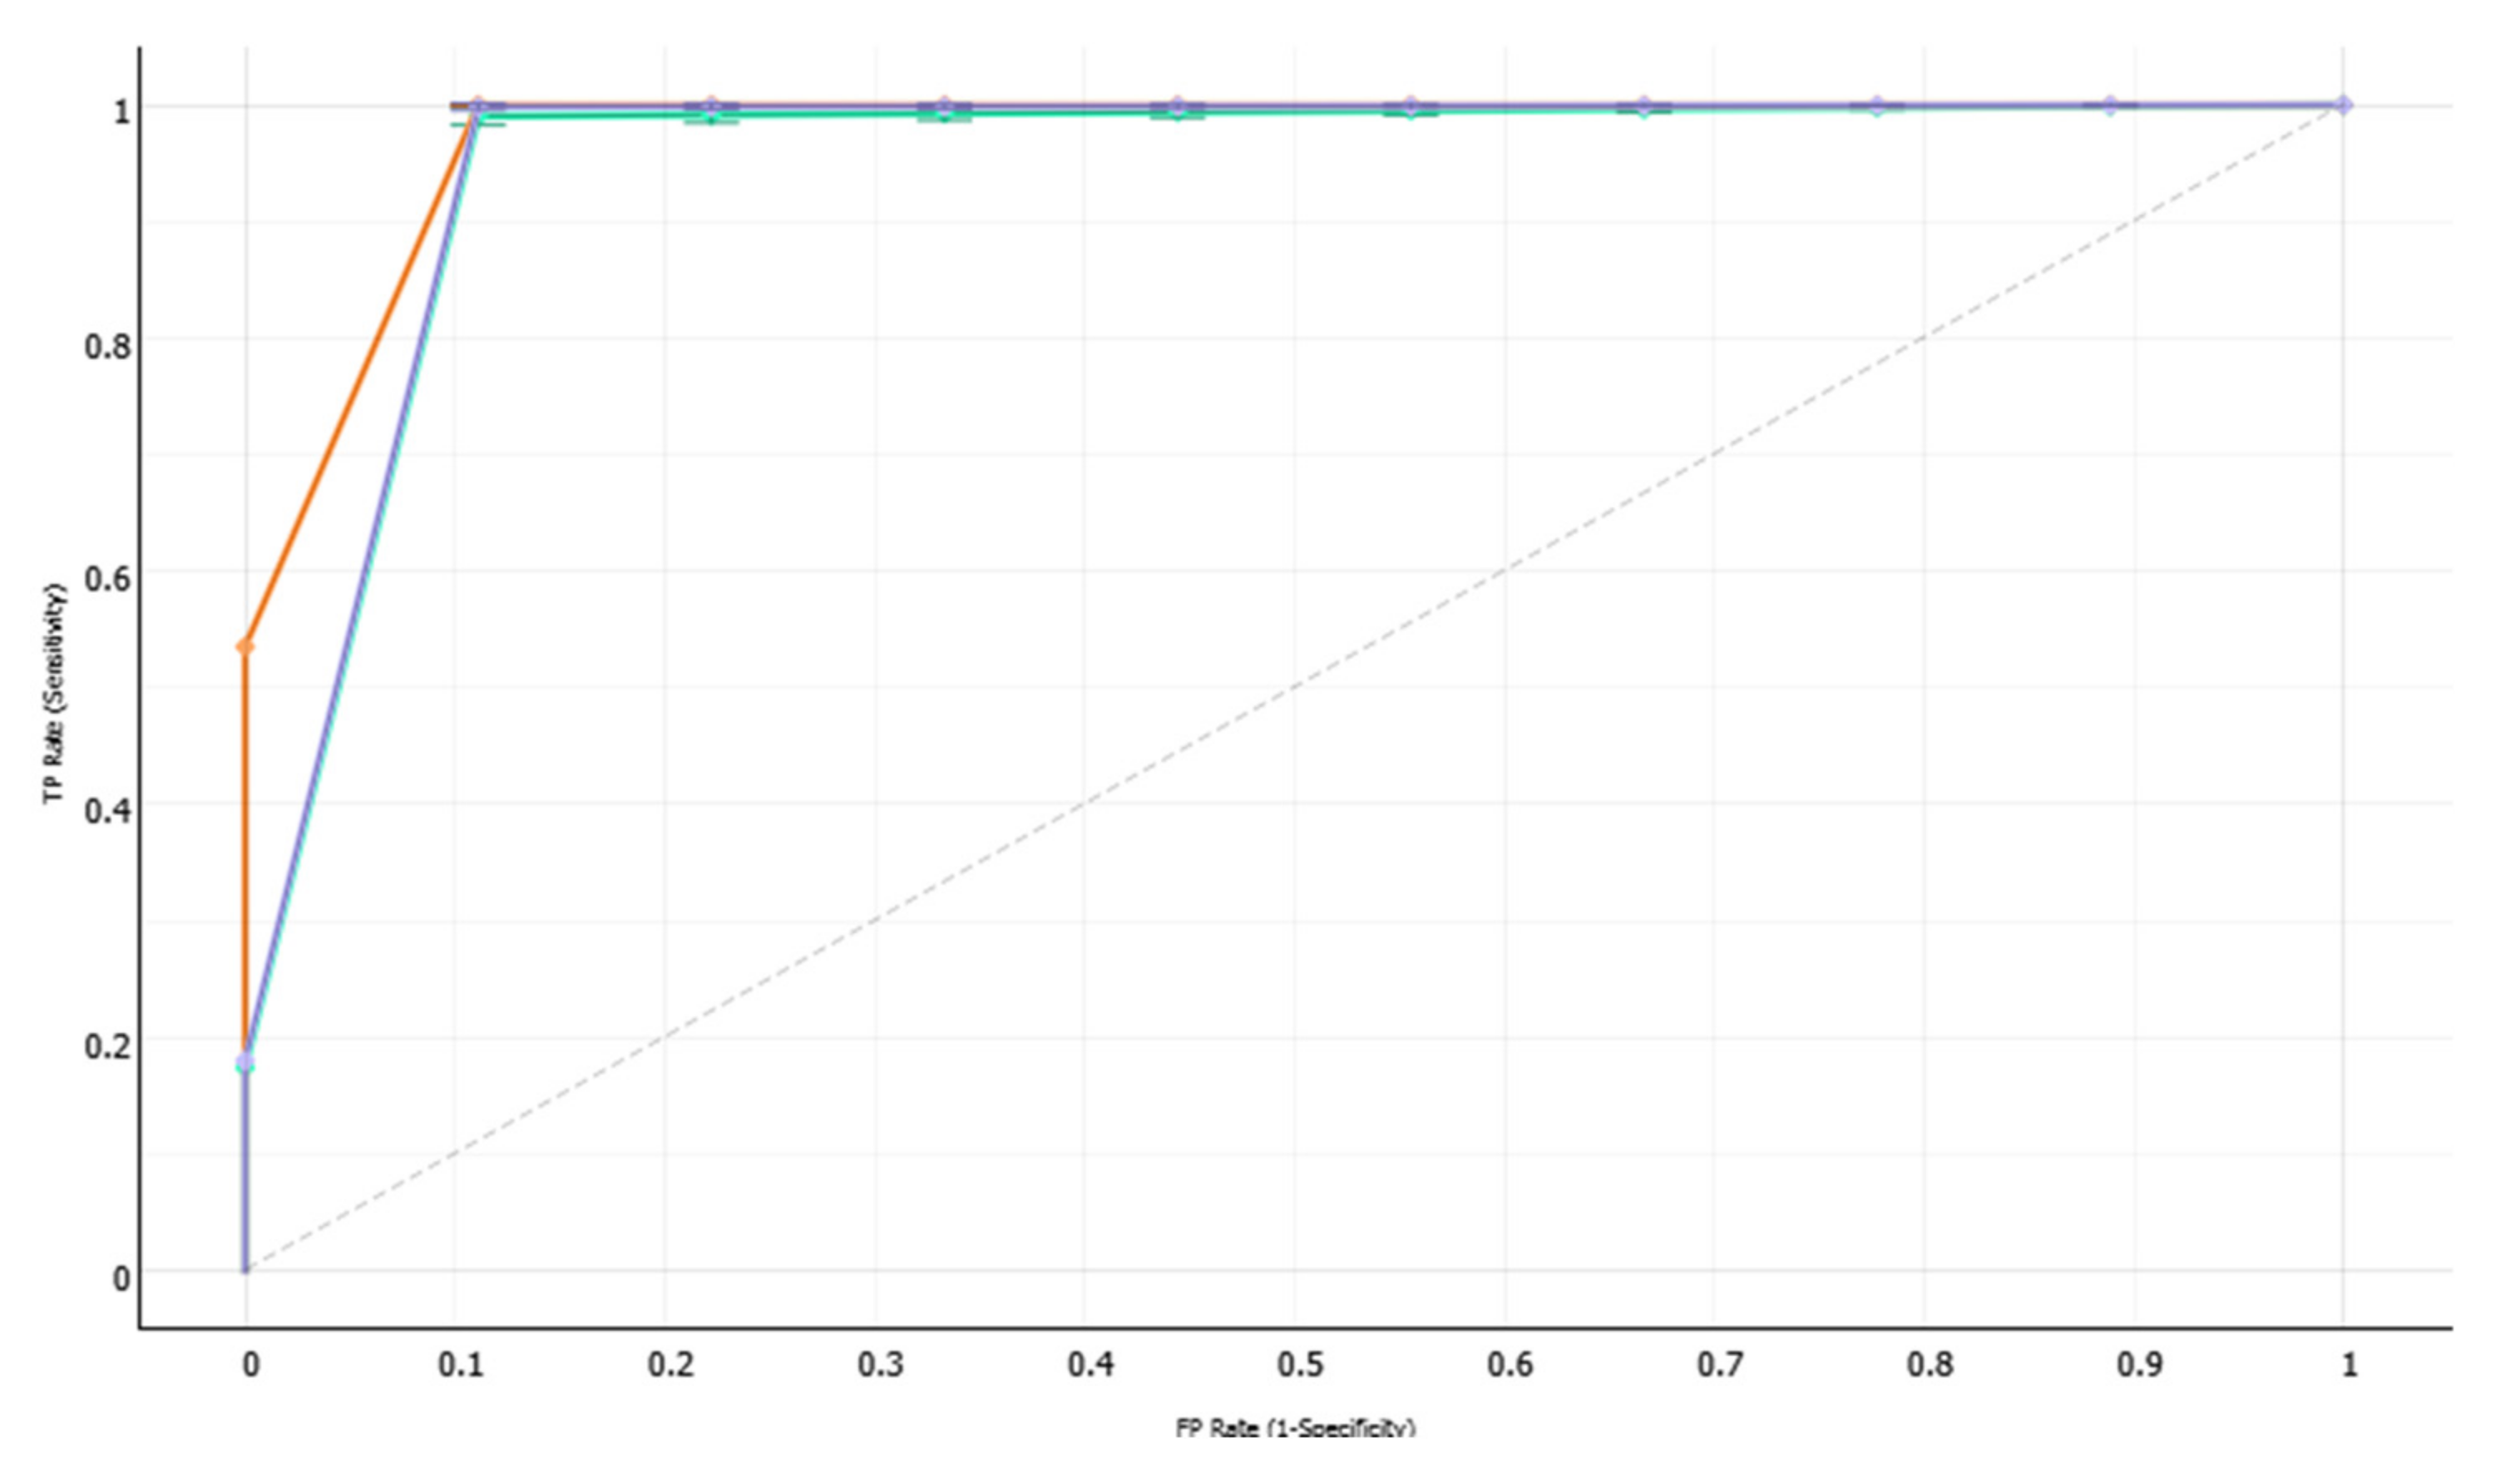
Sensitivity is the ability of a test to classify the room as non-occupied, denoted by (class 0), whereas the ability to classify the room as occupied correctly is called the test’s specificity (class 1), as shown in (
Figure 11 and
Figure 12) respectively.
4.2.2. Explanation of the Feature Contributions Based on XIA
This section discusses the results of the main features of room occupancy. Furthermore, the differences in important features extracted by SHAP among all classifiers are discussed.
For the first stage, we propose analyzing the significance of the feature. It is a critical understanding of the classifier’s models. In the following figures (
Figure 13,
Figure 14 and
Figure 15), you can see feature importance calculated by SHAP values (features with large absolute Shapley values are important) for three classifiers (KNN, DT, and AO-ANN (BP)).
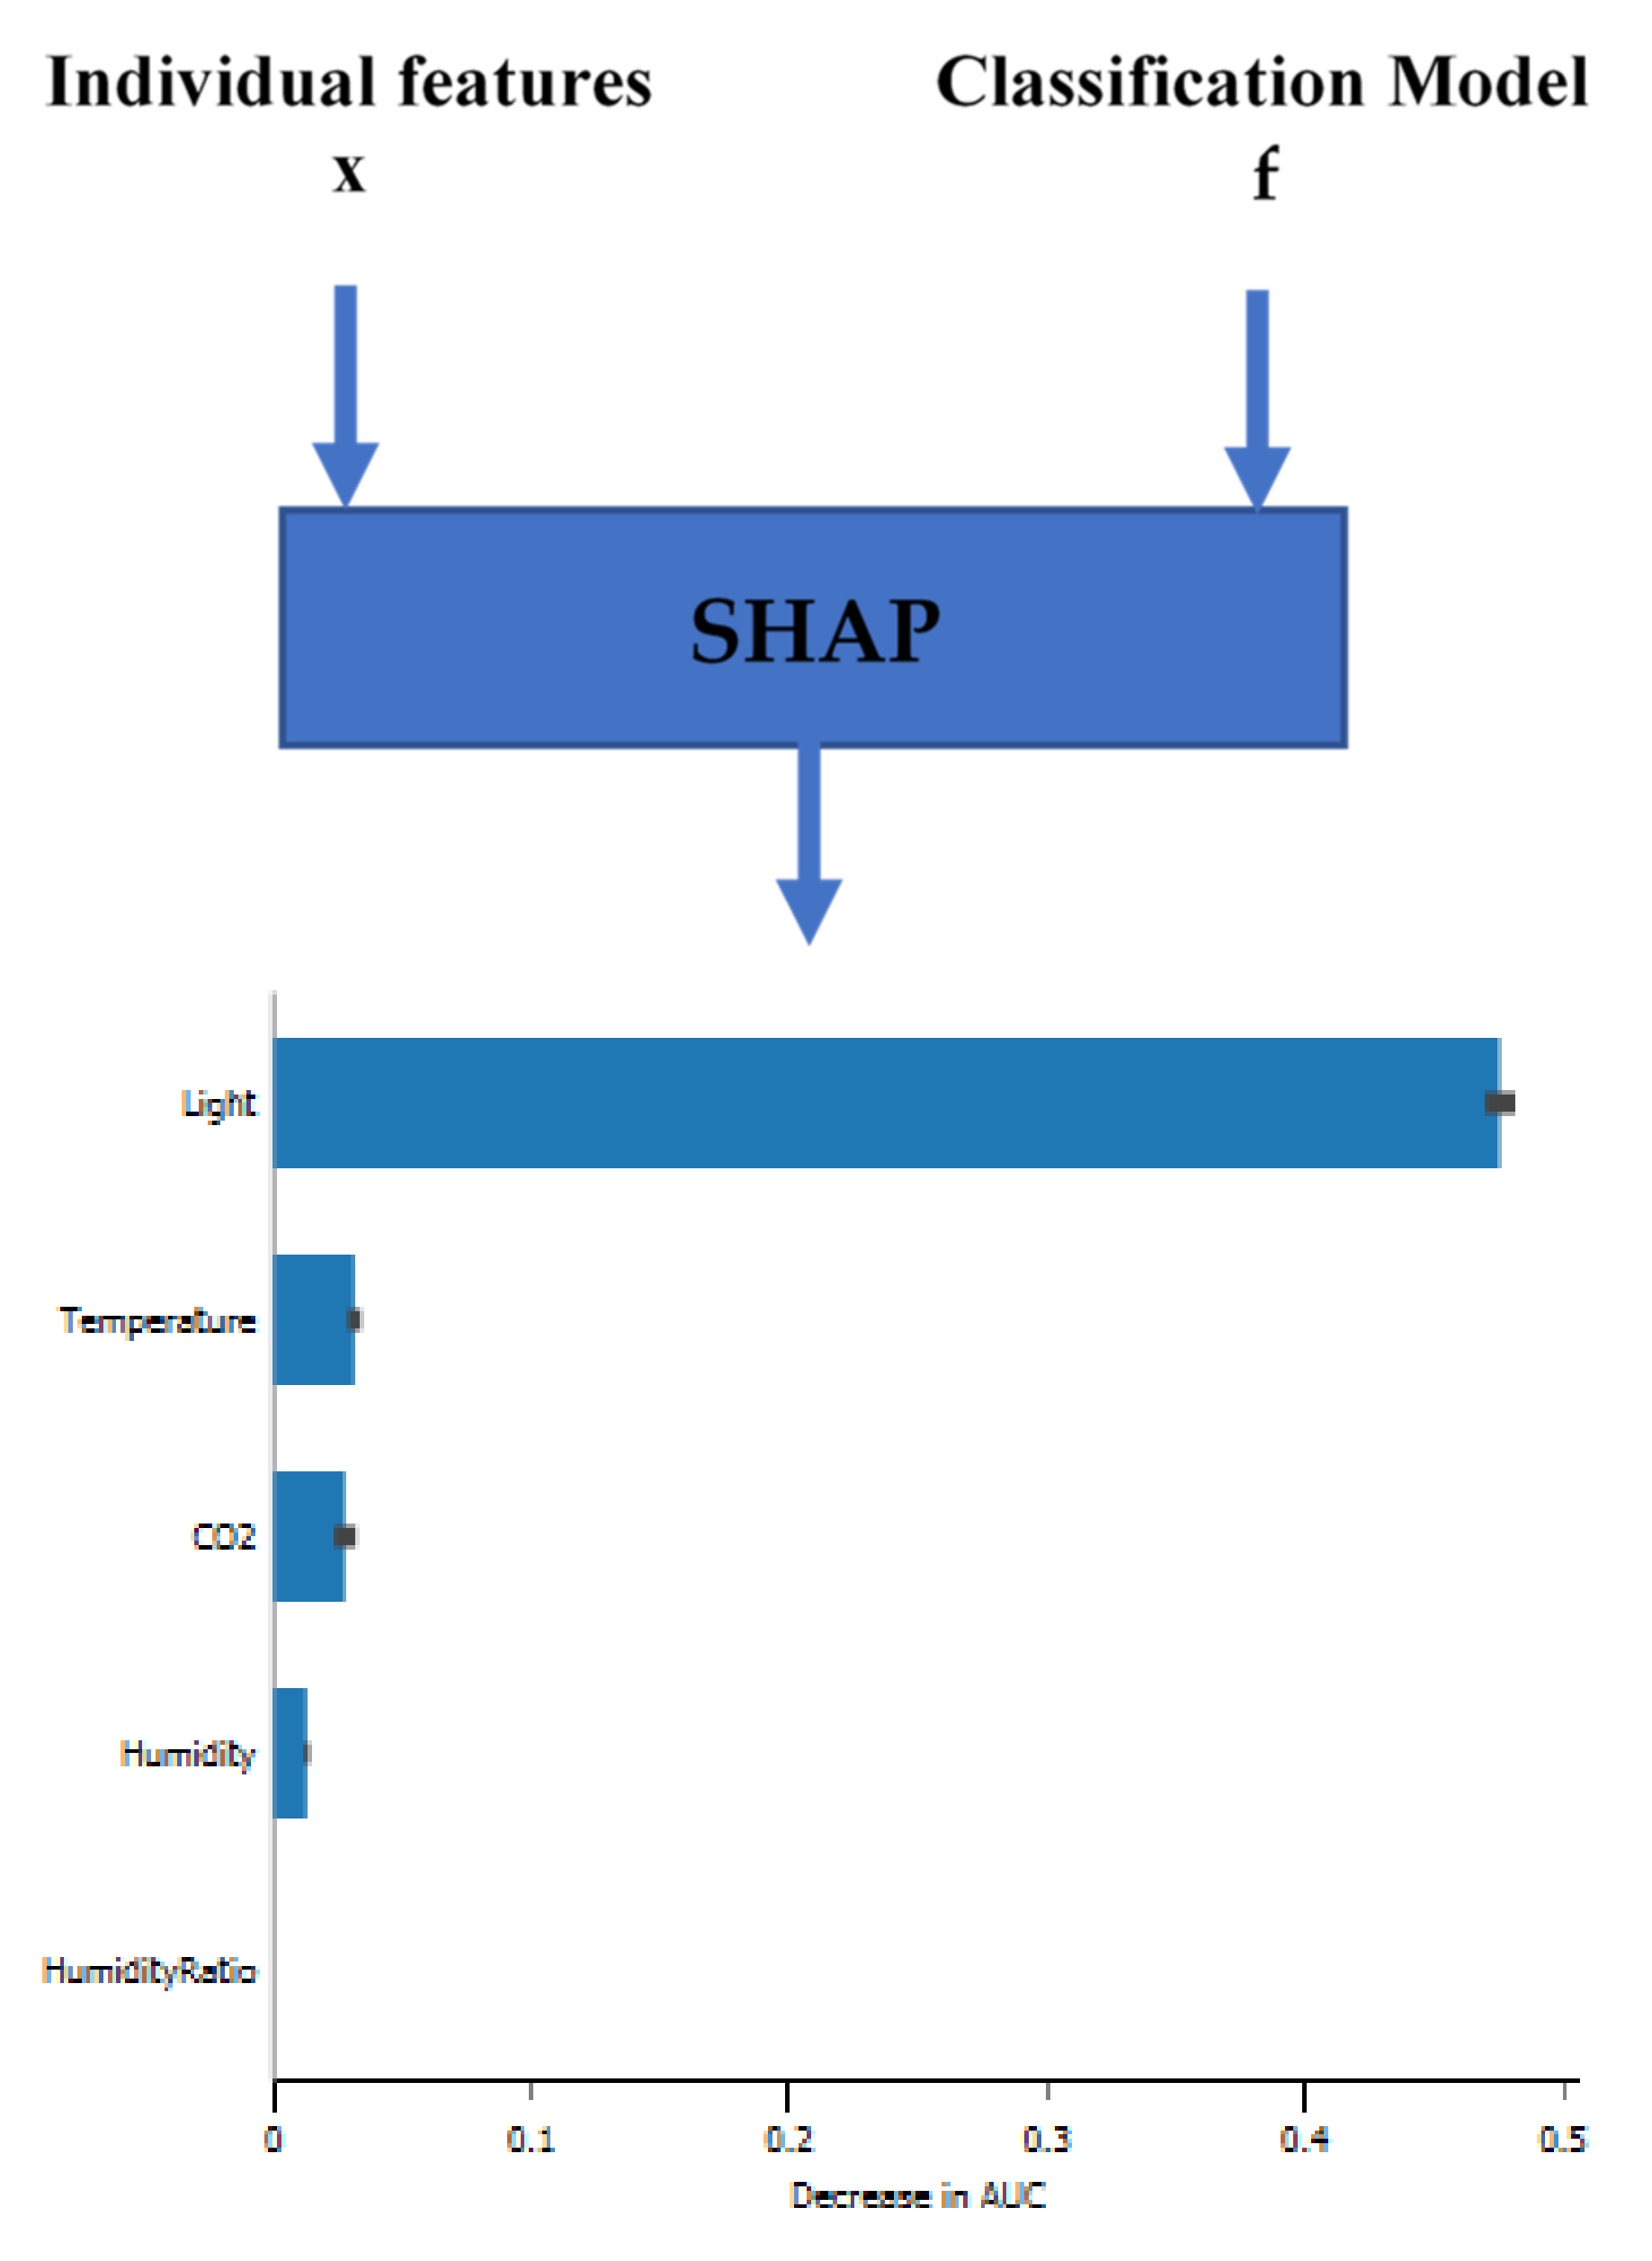
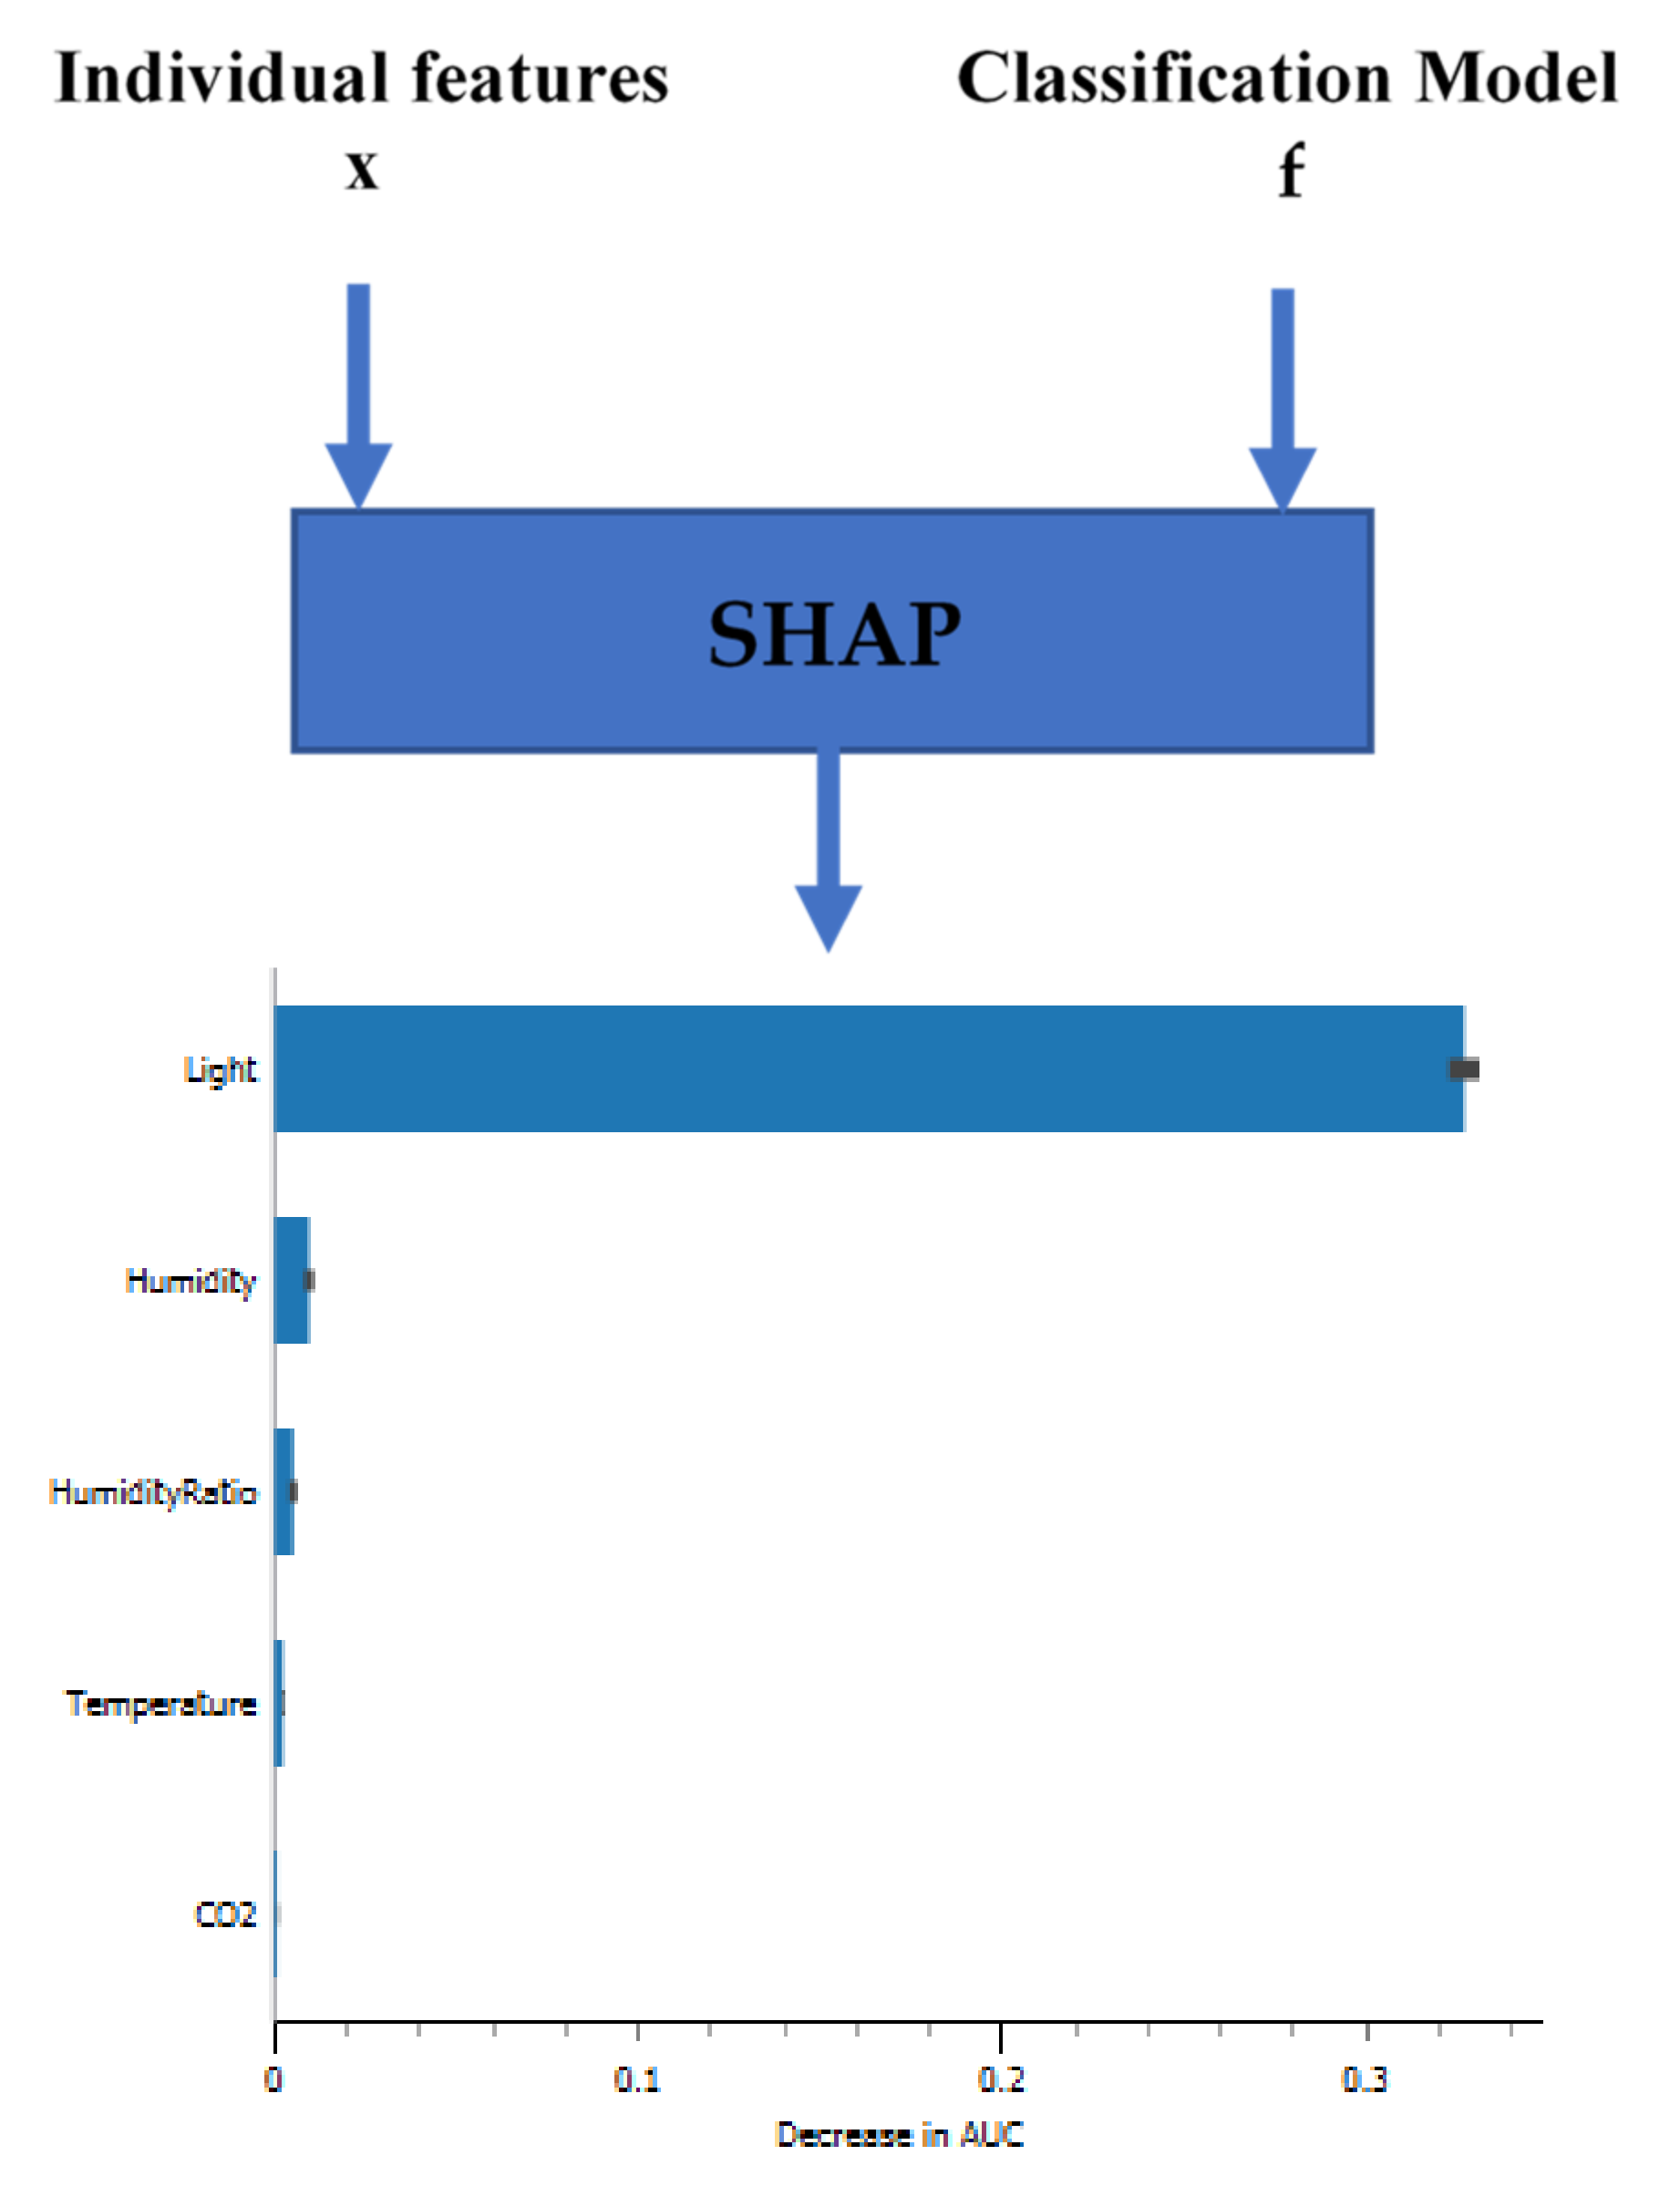
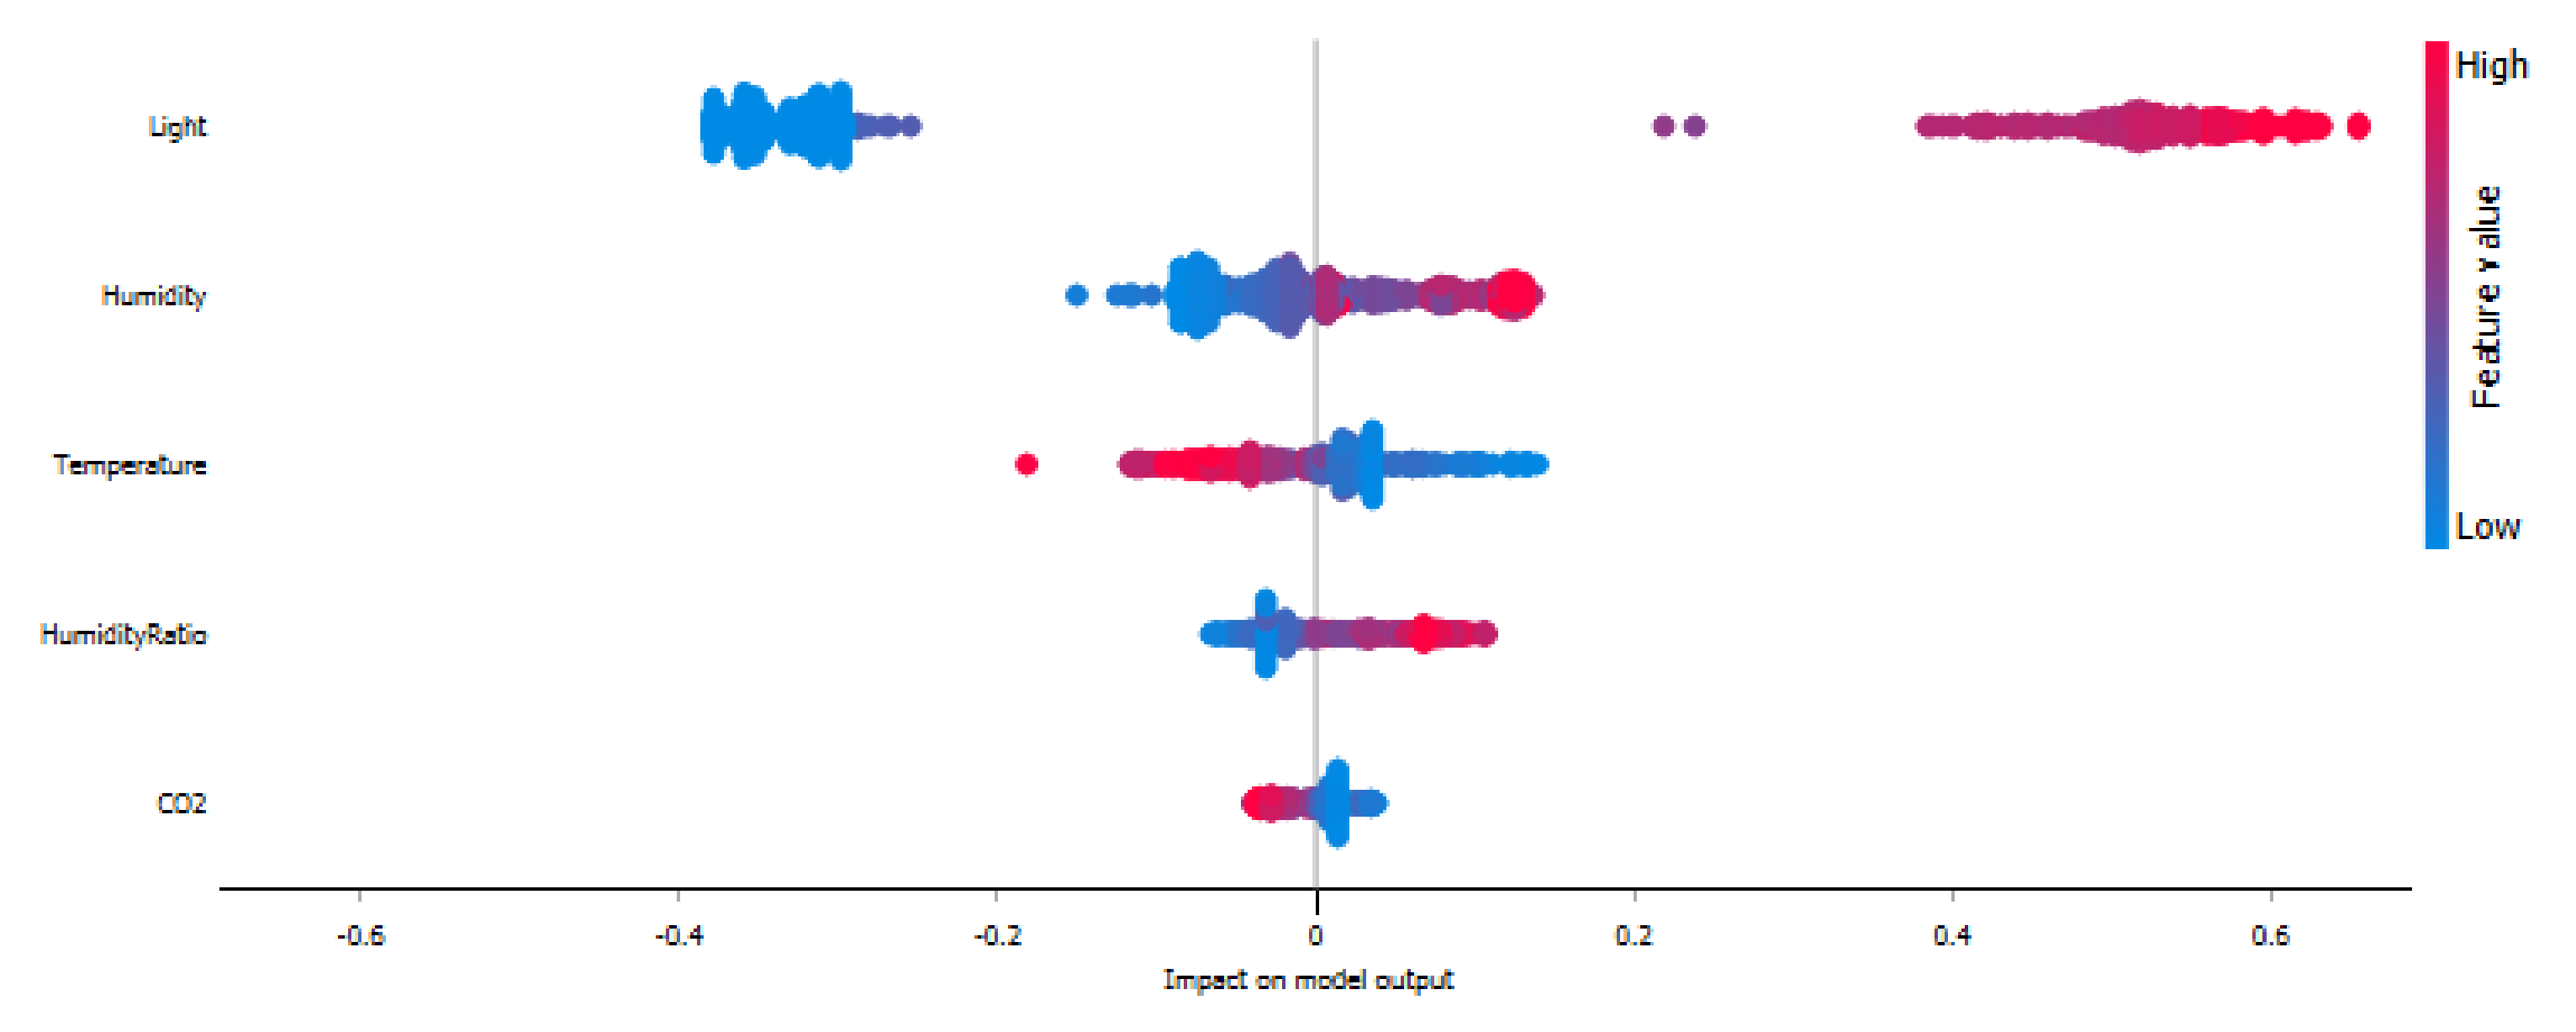
The figures (
Figure 16,
Figure 17 and
Figure 18) demonstrate the importance of features on the classes (0, 1) which is stacked to create the feature importance plot based on the classifiers. The figures combine feature importance with feature effects. Each point is a Shapley value for a feature or instance. The features define the location on the y-axis, while the Shapley value determines the location on the x-axis. The color denotes the feature’s value, ranging from low to high. Overlapping points are jittered in the y-axis direction to give us a sense of the Shapley value distribution per feature.
Figure 14 shows that the feature humidity ratio has low Shapley values, the least important feature. The features are ordered according to their importance for the KNN classifiers (light, CO
2, humidity, temperature, and humidity ratio). In
Figure 16 and
Figure 18, the larger the value for light, the larger the Shapley value. Hence, the feature value of light is larger; both the DT classifier and AO-ANN (BP) are more likely to consider the dataset room occupied.
As shown in
Figure 18, when the feature values of light or humidity are larger, the classifier is more likely to consider the data as occupied. Therefore, when these feature values are small, the AO-ANN (BP) classifier considers the data not occupied (empty).
5. Discussion
This study presented methodologies for developing artificial intelligence models for room occupancy detection in the current state and occupancy prediction in the future form using machine learning techniques. The following are the authors of the study’s main findings:
To properly understand the contribution of the developed room occupancy classification and explainable model, it is necessary to compare it to existing models. It evaluates the performance of the KNN, AO-ANN (BP), and DT models. Because of its higher accuracy, precision, recall, F1-score, and precision, the KNN model outperforms the AO-ANN (BP) and DT models. The application of SHAP is certainly intended to obtain explainability for each classifier used for accuracy performance.
As shown above, the room features of light and CO2 are the most influential and informative features that affect the accuracy of the KNN classifier, and light, temperature and CO2 are the features that most determine the accuracy of the DT classifier, and light and humidity are the most influential characteristics on the AO-ANN (BP).
ANN model was trained using sensor data from CO
2, sound, relative humidity, air temperature, computer temperature, and motion [
74,
75]. The model’s observed accuracy ranged from 75% to 84.5%. The electricity consumption from digital meters in five houses was applied to train classification models to determine building occupancy [
76].
For the occupancy determination, the accuracy was typically greater than 80%. It was discovered that when the house is occupied, it increases the likelihood of consuming more power. It was also found that the probability of decreased consumption even while the house is occupied is high because the inhabitants may not be using any electrical products [
35].
Several statistical classification models examined the accuracy of predicting occupancy in an office room using data from light, temperature, humidity, and CO2 sensors. The results indicate that a suitable feature selection combined with an appropriate classification model can significantly affect prediction accuracy.
Real-time occupancy detection using DT is demonstrated by [
77]. When using PIR motion sensor data, the stated accuracy was 97.9%. Data from light, sound, CO
2, power consumption, and motion sensors were used. The research also noted that the classification accuracy decreased when several sensor readings were added, and the cause is suspected to be overfitting.
As shown in
Table 5, the proposed framework results showed that when only the environmental features dataset was applied to learn occupancy predictors, the KNN-based, and BP-based occupancy predictor models were more suitable and accurate. Moreover, other classifiers are more accurate than their counterparts in
Table 5. Additionally, an interpreter for the results of SHAP classifiers was used, an added value not used by recent research in predicting room occupancy.
The room occupancy prediction model explores decreasing energy consumption through efficient use of available resources by predicting whether the room is occupied or vacant, leading to better management of systems such as lighting and HVAC. Understanding the nature of these parameters, whether combined or standalone, is a crucial point to assess implementing different measures to aid in energy efficiency and promote energy savings; these may be through disabling systems in areas that are labelled as vacant, leading to better operational costs and more efficient energy usage, ultimately leading to a healthier and less environmentally consuming building. The problem here may be that tailored indoor experiences for each user may not be readily achievable; instances where individuals prefer to stay in a dark room to work may not be present if motion sensors detect that the light should be turned on. It is also viable to say that lineaging spaces and treating them all the same may incur higher costs in the long run, due to constant operation of areas that should remain inoperable or with low operability. Thus, further research to enable user centered design is advised.
The results show that light was the main feature, followed by CO2 levels that predicted room occupancy across all the different modelling types. While that may be a logical explanation, it may not always be accurate. The idea that users may tend to leave the light on even when the space is not in use is a valid one; it is also feasible to argue that higher levels of CO2 does not guarantee immediate occupancy; rather, it amplifies that the space was in use and not necessarily currently occupied (the users may have already left). Another option may be the integration of the two factors most affecting the prediction model; light and CO2; these two may be combined to facilitate the prediction of room occupancy better; the higher the consistency of CO2 levels over a duration of time, the more likely, the room is occupied, thus also enabling motion sensors to work effectively when dual data is the input.
It is also evident from the results that while temperature, humidity, and relative humidity were set features in the dataset and are embedded in the model, their significance is not established; one theory would be that the conditions under which they were measured were regulated, as is often the case in indoor spaces using mechanical and HVAC systems, hence rendering them as void features. Another point may be when these features were measured during operational hours of the building or states of operation. The dataset shows slight fluctuation in these features, which may be biased to believing that they were measured during hours of operation, thus leading to the previous theory that it is a controlled indoor environment. That is to say that these may also be available for further research to measure these features on a standalone feature in both operational and non-operational hours to assess their true significance better. Further research to measure and assess the CO2 levels in indoor spaces and their monitoring with occupancy is advised to aid stakeholders and decision-makers in areas better to decrease costs and efficiently utilize resources.
Consistent data collected through sensors also facilitate the embedding of a management system to help regulate resource consumption and analyze overuse trends as well as increase/decrease appropriate flow according to the situation. Electronic management systems, when aided with the correct data, are game-changers in the resource efficiency paradigm.
6. Conclusions
Due to the problems associated with the rise in energy consumption, the focus on sustainable green buildings, and the optimization of energy usage to ensure that the SDGs are met, research on efficient use has emerged as a critical issue. One of the areas where this may be viable is implementing systems powered by machine learning algorithms in prediction models to utilize proper data and devise better solutions.
This research focused on predicting whether the room is occupied or vacant, using thermal comfort indices, which may lead to better usage of resources through better management of systems such as lighting and HVAC, ultimately leading to energy-saving in buildings. The accuracy of occupancy prediction has been tested and analyzed on data from differences in light, CO2, and humidity levels. In addition, we investigated the creation of a proposed framework to improve the explainability of machine learning methods in room occupancy. Additionally, the results indicate the importance of independent features for introducing room occupancy.
Room occupancy detection ease was associated with both CO2 and light levels: the first in the overall amount of CO2 present to depict the quantity emitted by people using the space and the second by the sheer thought that if the light is turned on, the room is occupied. These two features yield the highest probability of whether the room was occupied or vacant. However, as two standalone features, they may not be definitive as user differences and diversity may be obstacles if set parameters are instigated. That is why combining different features in the prediction model is better and does not rely on one sole feature of the indices provided.
The proposed framework contribution includes (a) a prediction method for room occupant behavior using different ML algorithms, (b) determining which features are informative for all prediction methods by using SHAP, the explainability of machine learning algorithms, and (c) an outline of the importance of consistent data collection to facilitate decision making regarding resource consumption and efficiency according to user centered experiences and needs. We intend to expand the proposed methodology in future work to include explanations of smart cities and power consumption scenarios, as these are necessary ideas for efficient consumption, automated processes and sustainability measures, ultimately leading to better health and the well-being of users.


