
A Novel Safety Assessment Framework for Pavement Friction Evolution Due to Traffic on Horizontal Curves
by
 ,
,
Guilong Xu
1 ,
,
Jinliang Xu
1,*,
Chao Gao
1,
Rishuang Sun
2,
Huagang Shan
3,
Yongji Ma
1 and
Jinsong Ran
1 1
School of Highway, Chang’an University, Xi’an 710064, China
2
Shandong Transportation Planning and Design Institute Group Co., Ltd., Jinan 250061, China
3
Shaoxing Transportation Investment Group Co., Ltd., Shaoxing 312000, China
*
Author to whom correspondence should be addressed.
Sustainability 2022, 14(17), 10714; https://doi.org/10.3390/su141710714
Submission received: 4 July 2022
/
Revised: 2 August 2022
/
Accepted: 22 August 2022
/
Published: 28 August 2022
(This article belongs to the Special Issue Road Traffic Engineering and Sustainable Transportation - The Second Edition)
Abstract
:The friction coefficient is one of the dominant parameters affecting vehicle driving stability on horizontal curves. However, there is no comprehensive framework to assess the traffic safety on the horizontal curve with the evolution of the friction coefficient caused by the traffic flow. In light of this, this paper developed an integrated risk-assessment framework to evaluate the safety on the horizontal curve with the friction coefficient evolving under different traffic characteristics. The speed distribution on the horizontal curve of the freeway is obtained through field experiments that serve as the basic parameters of the model. A new multi-vehicle risk index (MRI) is introduced to assess the traffic safety risk for the horizontal curve by coupling the reliability theory and negative binomial. Three traffic characteristics are considered in the analysis: cumulative traffic volume (CTV), annual average daily traffic (AADT), and average daily traffic of heavy goods vehicles (AADTHGV). The results show that the AADT and AADTHGV have a considerable impact on the road risk level. When the truck traffic volume is less than 1000 veh/d, the risk of horizontal curves changes less as road operational time goes. The research results can provide a reference for the road maintenance department to determine the timing of road maintenance.
1. Introduction
The friction coefficient of the road surface seriously affects the accident risk on the highway. Especially on horizontal curves, an insufficient friction coefficient will significantly increase the severity of traffic accidents. According to the National Highway Traffic Safety Administration (NHTSA), approximately 6.4 million people in the United States are involved in traffic accidents each year, 3 million people are injured in these accidents, and 42,000 people have died. Among these accidents, fatal accidents related to wet roads accounted for 13.5%, and traffic accidents accounted for 25% [1]. Furthermore, according to the accident data provided by the Texas Department of Transportation (TxDOT), Buddhavarapu, et al. [2] analyzed the traffic accidents that occurred on the horizontal curve from 2006 to 2009. They found that there is a significant negative correlation between the lateral friction coefficient of the horizontal curve and the severity of the accident. In other words, an insufficient friction coefficient will significantly increase the severity of the accident. Therefore, sufficient road friction coefficient is of great significance to ensuring road traffic safety.
The friction coefficient from the road is defined as the resistance to motion between the vehicle tires and road surface. It is mainly dependent on the road surface texture, which is defined by two scale levels: micro-texture and macro-texture [3]. Macro-texture helps induce friction for vehicles travelling at high speeds and the micro-texture is related to low slip speed friction [1]. However, the road surface texture varies under the polishing of cumulative traffic volume (CTV) [4]. It is worth noting that these variations of the surface texture due to traffic polishing will reduce the pavement friction resistance [3,5]. The low friction may result in potential skidding risk for the vehicles on the horizontal curve [6,7]. Specifically, when the vehicles traverse a horizontal curve, the friction supply from pavement plays a critical role against the centrifugal force to stay driving stability of vehicles [8]. If the friction coefficient supply from the road can’t meet the friction demand for turning, the vehicles will be involved in departure [1,9]. Therefore, it is significantly worthy to investigate the effect of the friction evolution due to polishing for traffic safety on the horizontal curve.
Some efforts have been made to investigate how the friction on the curves affects traffic safety. The studies could be divided into two categories: crash-data-based approach and the proactive one. For the former, statistic models, such as the probit model and Poisson model, etc. are commonly adopted in the analysis [2,10,11]. For instance, Buddhavarapu, Banerjee, and Prozzi [2] utilized an ordered probit (OP) response model for crash-level injury severity analysis by integrating a crash and pavement surface database. Historical crash and friction data are collected to conduct safety analysis in their research. They found that significant correlation is evident between pavement friction and crash injury severity. Nevertheless, there are key limitations associated with crash data including under-reporting and unobserved heterogeneity [12,13,14]. Hence the proactive studies have been conducted to investigate impact of the horizontal curve friction on traffic safety. For example, based on the reliability theory, Echaveguren, Bustos, and de Solminihac [9] proposed a limit state function determined as the difference between friction supply on the exiting road and friction demand. A nice concept was developed to evaluate the safety margin on the existing road in their works. However, they did not consider the impact of friction coefficient changes on traffic safety. Although You, et al. [15] had conducted some attempts to address this issue, the friction factors were determined by authors’ assumption in their models, lacking guidance for policy and practice. Traffic flow is one of the critical factors leading to the reduction of the friction coefficient during the road operation, but as far as we know, the influence of friction evolution due to traffic polishing for traffic safety is still not investigated.
In order to understand the relationship between the evolution of friction and the traffic safety, this paper proposed a novel risk assessment framework to evaluate the effect of the friction evolution due to traffic on safety for horizontal curves. The reliability theory is employed to calculate the single-vehicle skidding probability for cars and heavy goods vehicles. Then a multi-vehicle risk index is developed to analyze the multi-vehicle safety on horizontal curves by combining the single-vehicle failure probability and negative binomial. The research results can evaluate the risk of existing roads in different operational periods and provide a reference for road maintenance departments to determine the timing of road maintenance.
In the following sections, the methodology proposed in this paper will be introduced and followed by an intelligible numerical study.
2. Methodology
A risk-assessment framework is developed by combining reliability theory and negative binomial to investigate the influence of friction coefficient evolution due to traffic, and it is shown in Figure 1. The friction demand mainly depends on the speed of vehicles. The road friction evolution model proposed by Hofko, et al. [16] is utilized to determine the friction supply. Then a skidding limit state function is set up by difference between the friction supply and the friction demand. After that, the reliability theory is used to calculate the single-vehicle skidding probability (SSP). Finally, a multi-vehicle risk index is developed by SSP and a negative binomial. The specific process is described in detail as follows.
2.1. Single-Vehicle Risk Assessment Model
2.1.1. Evolution of Friction Supply
Under the effect of long-term polishing of traffic volume, the friction coefficient of the road surface will decrease. Hofko, Kugler, Chankov, and Spielhofer [16] used the cumulative traffic volume (CTV) and the average annual traffic flow of heavy goods vehicles (AADTHGV) to establish the friction evolution model of the SMA asphalt pavement, expressed by Equation (1):
where is the the road friction coefficient when the vehicle speed is 60 km/h, and is the number of polishing times of traffic flow, given by Equation (2):
where is the weight of traffic flow, calculated by Equation (3):
where is the cumulative traffic volume (veh), and is the average annual traffic flow of heavy goods vehicles (veh/d).
Equations (1)–(3) can calculate the friction coefficient under the polishing of different traffic levels, but this model is only applicable when the car speed is 60 km/h. Wambold, et al. [17] provided a model to calculate friction coefficient at different driving speeds:
where is the friction coefficient when the car speed is , is the driving speed (km/h), and is the speed constant (km/h) and its value is related to the pavement texture. The Equation is expressed as below:
where , are the constants of texture structure measuring equipment. The values of reference Donnell et al. [18] are , . is the mean profile depth (MPD), with a value from 0.5 to 50 mm [19]. It should be noted that Hofko, Kugler, Chankov, and Spielhofer [16] measure the coefficient of friction in the straight. When the car is traversing a horizontal curve, the radial friction coefficient is 0.925 times of the straight [20]. The value of the radial friction coefficient from horizontal curve can be obtained by Equation (6):
As for heavy goods vehicles (HGV), studies have shown that the friction coefficient for HGV is only 70% of the car [21].
2.1.2. Skidding Limit State Function
The current road design theory [8,22] regards the vehicle as a point-mass model, using the critical conditions of skidding to calculate the radius of the horizontal curve:
where is the gravitational acceleration (9.81m/s2), is the driving speed (m/s), is the side fraction factor, and is the superelevation. The anti-skid friction demand of the mass point model is shown in Equation (8):
However, all vehicles now have a suspension system. When the vehicle traverses a horizontal curve, the suspension system will rotate outward under the action of centrifugal force. The force diagram is shown in Figure 2. In order to improve the defects of the point-mass model, Chang [23] analyzed the mechanical stability of a vehicle with a suspension system when driving in a curve, and derived a radius based on the vehicle’s sideslip stability, which is given by
where is the distance from the center of rotation to the road surface (m), is the distance from the center of gravity of the vehicle to the road surface (m), and is the rotation rate of the suspension system. From Equation (9), the anti-skid friction demand of a vehicle with a suspension system can be obtained as
The skidding limit state function of the mass-point model can be obtained by Equation (8), which is shown as
From Equation (10), the skidding limit state function of a vehicle with a suspension system is obtained as
2.2. Reliability Theory
In the engineering structure, assuming that the load-bearing capacity of the structure is and the load is , the performance function of the structure is defined as Equation (13):
The distribution of structural performance function can be obtained by using the distribution of structural resistance and load . The reliability . The probability of failure expression can be given by Equation 14:
When the structural performance function is affected by multiple variables, it can be written as . represents the response variable of the structural performance function. The limit state of the structure is expressed as . When the structural performance function is a linear or non-linear expression of the response variable. Hasofer and Lind [24] proposed the first-order reliability method (FORM) to solve the structural probability of failure .
In single-vehicle risk assessment model developed in this paper, the friction supply of the road surface represents the structural resistance , and the friction demand for automobile anti-skid refers to the load . The random factors affecting the supply and demand of the friction are adopted as the response variable . The structural performance function is expressed by the difference between the supply and demand of the friction.
2.3. Multi-Vehicle Risk Index
The probability of failure calculated by reliability theory is a single-vehicle risk index [6], which could only evaluate the risk for the single vehicle. In order to comprehensively understand the safety on horizontal curves, this paper developed a risk-assessment model for multiple vehicles by negative binomial.
The negative binomial has been widely employed to model traffic accidents [12,25,26,27], and it defines the number of cars skidding as a random variable with values of 0, 1, 2, ... before the count of cars that traverse the horizontal curve safely reaches a certain value within the counting interval of a day [27]. The probability of each value is as follows:
where is the annual average daily traffic volume (AADT), is the probability of failure (POF), and is the number of cars skidding. Then we developed a multi-vehicle risk index (MRI), which represents the probability that at least one car skids during the counting interval and it is as follows:
3. Numerical Study
3.1. Basic Model Parameters
Among the basic parameters of the above framework, the speed of the vehicle and the mean profile depth (MPD) are considered as random variables. The speed of the vehicle on the horizontal curve was collected through the laser gun, and the K-S test was adopted to verify that the speed distribution state of the vehicle is normal. MPD referenced the data from Plati and Pomoni [28]. The radius of the horizontal curve, the superelevation, the height of the center of gravity of the vehicle, and the height of the center of rotation of the suspension system are considered as deterministic variables. The radius and superelevation of the horizontal curve adopt the data of the Xianyang–Chunhua motorway in Shaanxi Province, China, supplied by CCCC First Highway Consultants Co. Ltd. The height of the gravity center of the vehicle and the height of the rotation center of the suspension system adopt the values recommended by Gillespie [29]. The specific parameters information is illustrated below subsections.
3.1.1. Speed
The Xianyang–Chunhua Motorway in Shaanxi Province, China with a small traffic volume (e.g 250 veh/h in the peak hour) is convenient for collecting vehicles’ speed under good driving conditions. The midpoint of a horizontal curve with a radius of 1000 m is selected as the measuring location. There is no speed limit sign on the experimental road section. The geometric data of the experimental road is provided by CCCC First Highway Consultants Co. Ltd, as shown in Table 1.
Laser guns were used to collect the speed of cars and HGV. During the data collection process, the experimenters concealed themselves in the bushes beside the motorway to prevent the driver from disturbance. A total of 117 samples of cars and 79 of HGV are effectively collected in the experiment. The specific information of the data is shown in Figure 3. Velocity mean and standard deviation of car are 103.27 and 11.17, which is employed in model Z1 and Z1 for the car. The counterparts of HGV are 78.56 and 9.38, utilized in model Z1 and Z1 for HGV. The Kolmogorov–Smirnov test results of the speed data are shown in Table 2. The two-tailed asymptotic significance value is 0.2, which is greater than 0.05. Therefore, it could be considered that the speeds of cars and HGV have a normal distribution in a statistical significance. This finding was consistent with Sil, et al. [30] and Himes [31].
3.1.2. Mean Profile Depth (MPD)
As an important parameter to characterize the texture structure of the road surface, MPD has been proven by previous studies to obey a normal distribution [9]. Plati and Pomoni [28] measured the MPD of the road in the initial period and after 11 years. The detailed traffic and road geometric data with regard to MPD are shown in Table 3. The means and the standard deviations are 1.26 mm, 0.17 mm and 1.36 mm, 0.24 mm respectively. The change in mean and standard deviations is relatively little. Therefore, this study assumes that the MPD of the road has a normal distribution with a mean value of 1.3 mm and a standard deviation of 0.2 mm, namely MPD~.
3.1.3. Vehicle Parameters
The present study refers the values recommended by Gillespie [29] in Fundamentals of vehicle dynamics. For a typical car, , , and . For a typical heavy goods vehicle, , , and .
3.2. Parametric Study Results
The proposed framework is demonstrated in the horizontal curve mentioned above. All parameters are illustrated in the previous section except the traffic flow characteristic. In order to investigate the impact of friction coefficient evolution due to traffic on safety, the risk-assessment framework introduced by the earlier section is adopted to calculate the single-vehicle risk index and multi-vehicle risk index (MRI) under different traffic flow characteristics.
3.2.1. Influence of Traffic Characteristics on Friction Coefficient
Figure 4 shows the evolution of friction coefficient caused by traffic characteristics. The friction coefficient for the Y-axis refers to the , which is the road friction coefficient when the vehicle speed is 60 km/h. It is found that the friction coefficient decreases with the increase of cumulative traffic volume (CTV) and annual average daily traffic of heavy goods vehicles (AADTHGV). In the early stage of road operation (e.g., CTV = 30 million vehicles or less), the friction coefficient drops dramatically as the CTV increases. After that, the rate of decrease of the friction coefficient slows down with the increase of CTV. This evolution trend of friction coefficient is consistent with Kane, et al. [32].
Moreover, the impacts of AADTHGV on friction coefficient is more substantial for a higher CTV (e.g., CTV over 40 million vehicles). When CTV exceeds 20 million vehicles, most of the curves tend to be parallel. Pavement friction coefficient in these curves with AADTHGV = 5000 veh/d is only 80% of AADTHGV = 1000 veh/d for a certain value of CTV. This result verifies the point that the friction coefficient of the road is significantly affected by the truck [1,32]. Therefore, freeways with numerous truck volumes need more road maintenance work to ensure that the road can provide sufficient friction coefficient for vehicles.
3.2.2. Model Comparison
Figure 5 compares the reliability (gray line) and the skidding probability (red line) for the mass point model Z1 and the suspension vehicle model Z2 under different CTV where AADTHGV equals to 2000 veh/d. It can be seen that the reliability of model Z2 is lower than that of model Z1 for car. Therefore, the skidding probability of model Z2 is higher than model Z1. This result indicates that the car’s suspension system reduces the safety when turning, which is consistent with You, Sun, and Gu [15]. A similar finding is obtained for HGV.
It is worth noting that for HGV, the probability of failure for the model with the suspension system (HGV-Z2) is very small (close to 0). However, compared to the HGV, the suspension system substantially affects the safety for car. This result illustrates that the mass point model adopted by current road design theory has less impact for skidding failure probability of HGV, but has strong influence for the car. The reason may be that the driving speed of HGV is too low in contrast with the cars’ speed, leading to a reduced skidding risk.
An interesting finding is that the failure probability difference between Car-Z1 and Car-Z2 becomes more and more significant as the road operation time goes. When the CTV is equal to 100 million vehicles, the skidding probability for Car-Z2 is about 22 times that of the Car-Z1. It not only demonstrates that traditional road design theory underestimates the risk of cars, but also that the hidden dangers caused by such underestimation will be magnified over time.
3.2.3. Safety Assessment for Different Traffic Characteristics
From the analysis in Section 3.2.2, it is concluded that the probability of failure (POF) for cars with a suspension system is much higher than that of heavy goods vehicles (HGV) and the point model cars, so the risk assessment of the suspension car model will be carried out below.
The truck traffic volume is assumed as a determined value (AADTHGV = 2000 veh/d) to analysis the impact of AADT for safety on the horizontal curve over time. Figure 6 exhibits the multi-vehicle risk index of the varying AADT changes over the years. It is found that the safety on the horizontal curve is very sensitive to the AADT. Among these five traffic characteristics, the AADT with a value of 10,000 veh/d has the least threat to vehicle accident risk. Although for a curve with a heavy traffic volume (e.g., AADT over 30,000 veh/d), the multi-vehicle risk index (MRI) rises rapidly to 100% after four years, indicating that the road has not be maintained during this period, the probability that one or more cars skid will reach to 100%. Therefore, this result suggests that the freeway with heavy traffic flow need to be frequently maintained.
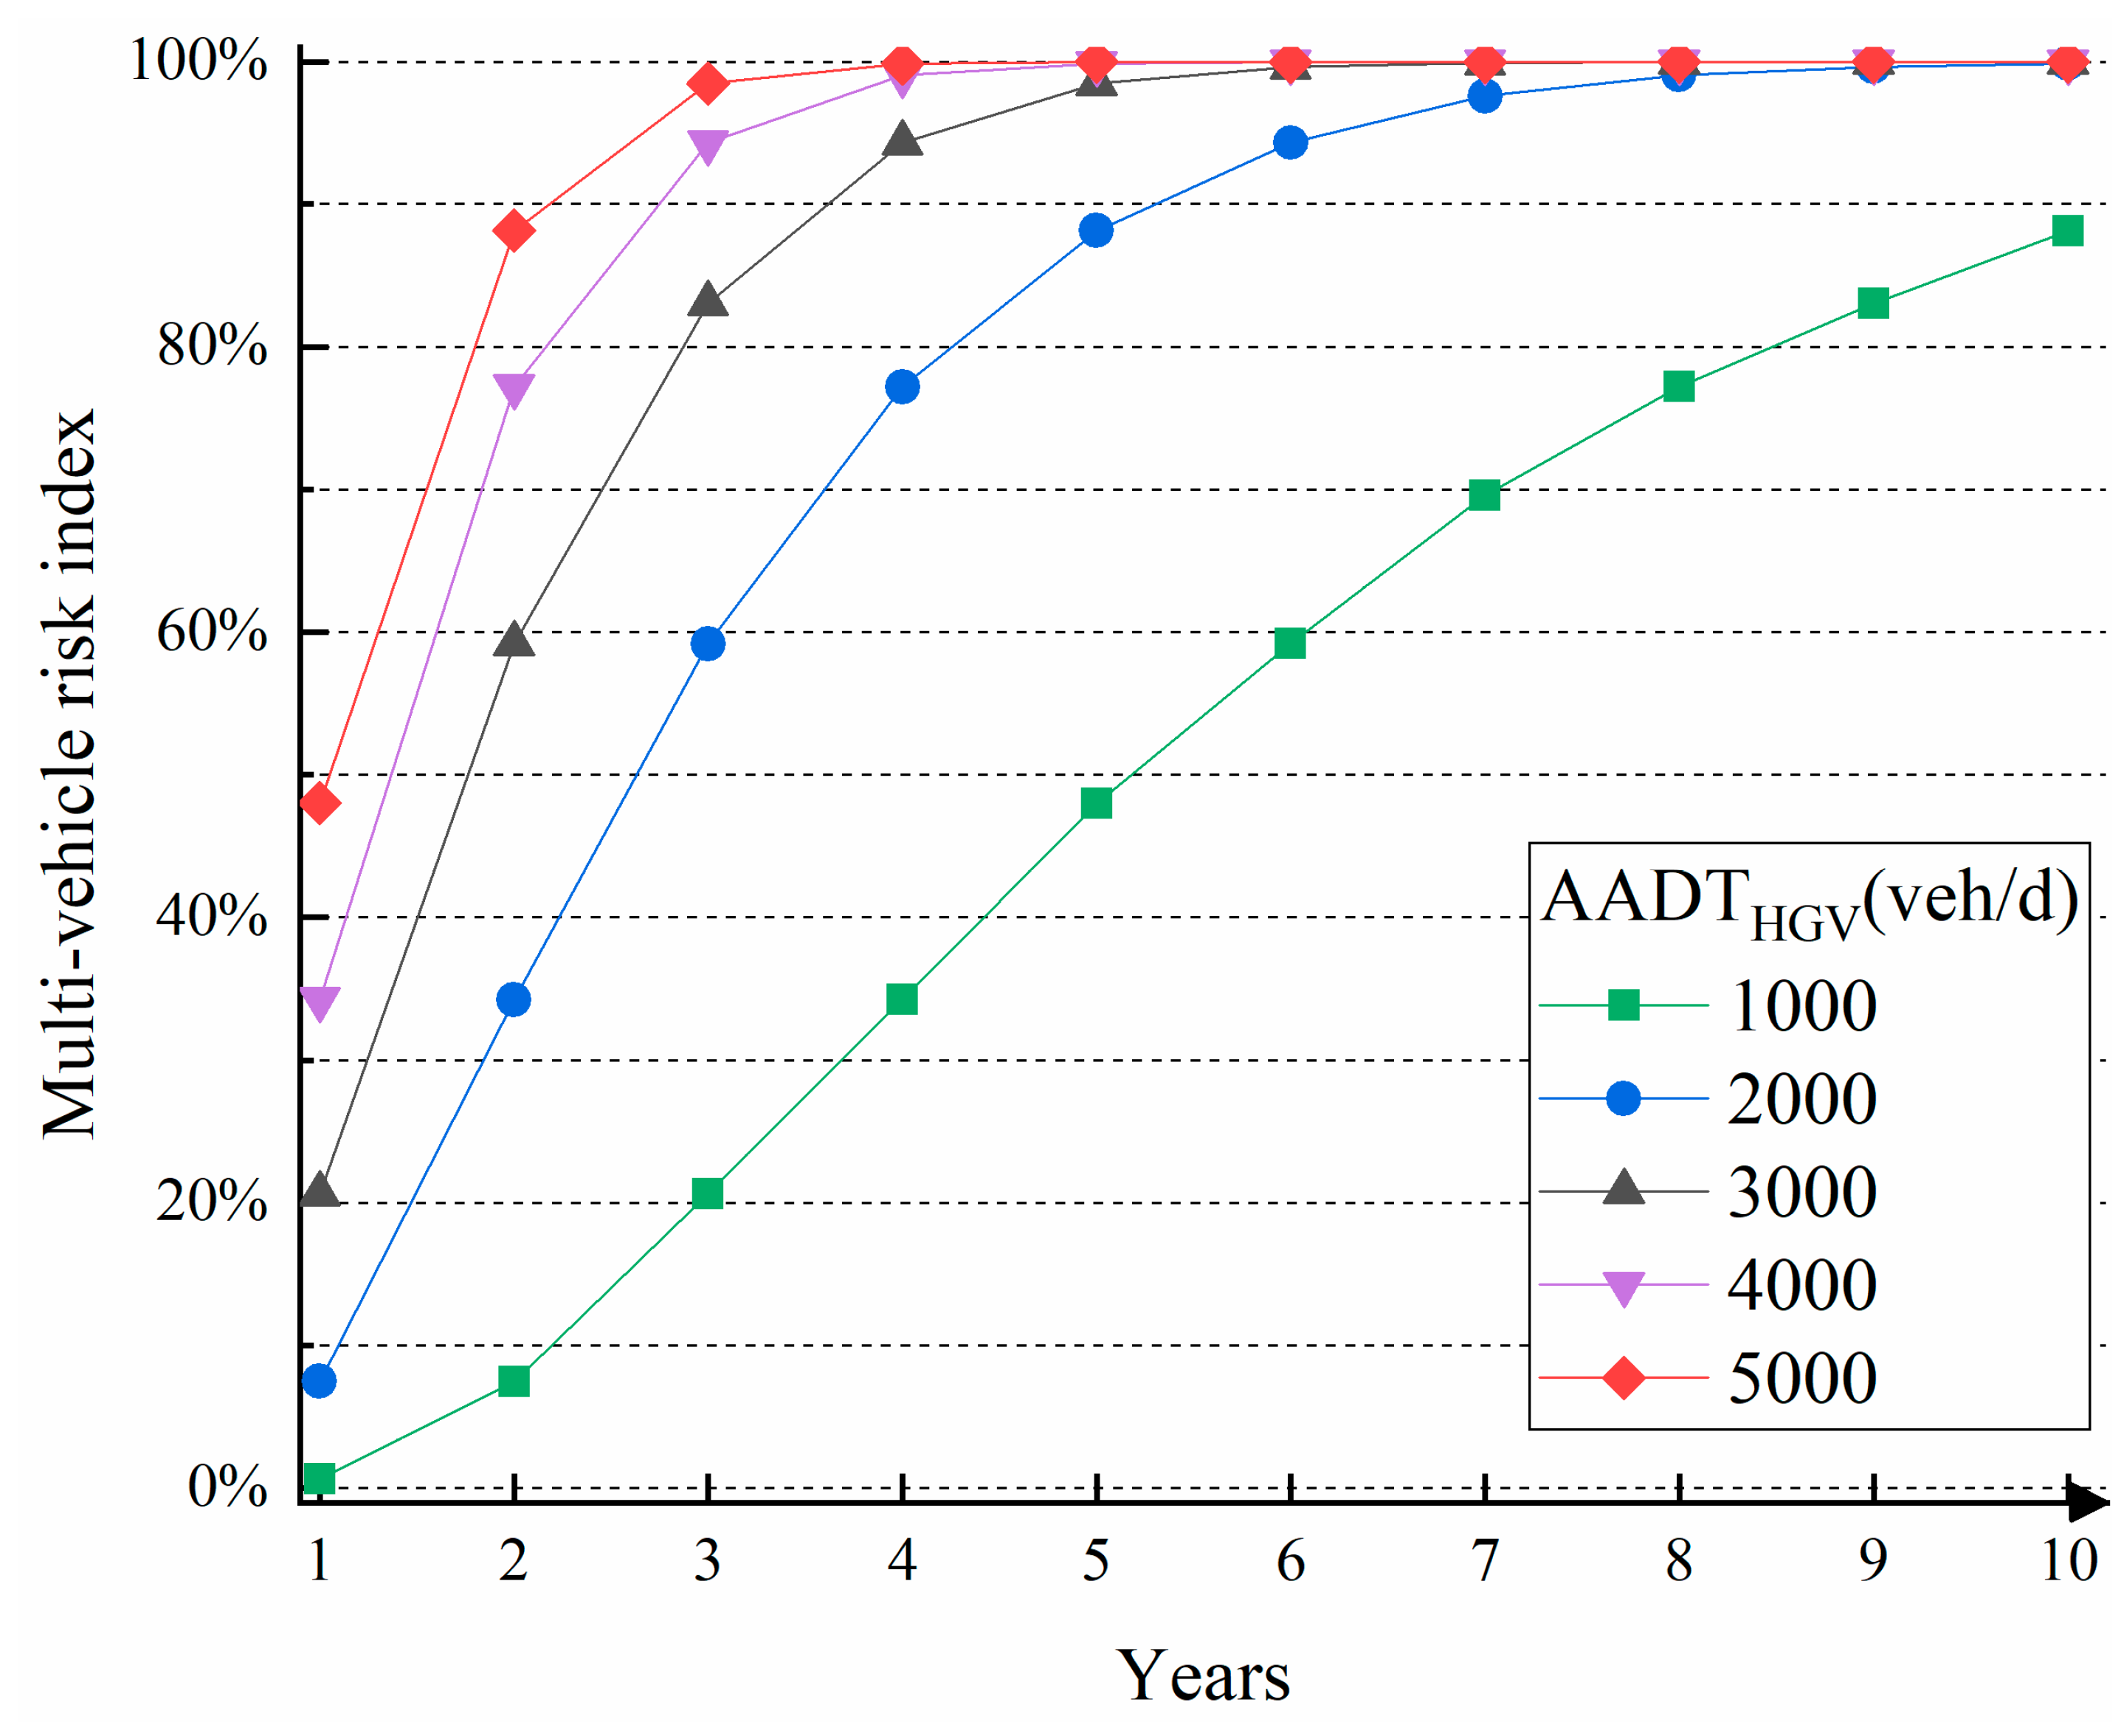
As discussed earlier, different truck traffic volume has a considerable impact for the friction coefficient. In order to further investigate the influence of truck traffic in skidding risk on the horizontal curve, the multi-vehicle risk indexes (MRI) of different truck traffic volume are compared in this section when the AADT equals to 20,000 veh/d. The MRI changes for five kinds of truck traffic volume over the years are displayed in Figure 7. It can be seen that the MRI shows a similar trend for all five types of truck traffic characteristics. The MRI will increase rapidly over the years when the truck traffic volume is over 2000 veh/d whereas accident risk on a road with low truck traffic volume (AADTHGV = 1000 veh/d) will rise much slower. This result indicates that the large truck traffic volume not only leads to lower friction coefficient, but also causes higher hidden slippery risk.
4. Conclusions
Based on the reliability theory and negative binomial, an integrated framework assessing the influence of the friction evolution caused by traffic on safety for the horizontal curve is proposed in this paper. The present research provides a dynamic insight to understand the relationship between road service life and traffic safety. The main conclusions from the numerical study are as follows.
(1) At the beginning of road operation, the friction coefficient decreases rapidly under traffic flow polishing. As the road use time increases, the friction coefficient decreases at a slower rate. After further analysis, we found that the traffic volume of heavy goods vehicles significantly affects the value of the friction coefficient. Large truck traffic volume will lead to more serious road wear and lower friction coefficient.
(2) The modern road design theory regards the car as a mass point model, which underestimates the skidding risk when a car traverses the curve. Furthermore, we found that with the increase of cumulative traffic volume, the mass point model underestimates the skidding risk more and more seriously. This conclusion can help road designers re-recognize the defect of the mass point model.
(3) The multi-vehicle risk indexes (MRI) are highly sensitive to the AADT. The MRI for the road with heavy traffic volume will reach 100% after 4 years without any road maintenance. In addition, we found that the truck volume also has a noteworthy impact for the MRI. The larger the truck traffic volume, the higher hidden slippery risk. The conclusion can help road maintenance department evaluate the risk for the road with different traffic conditions and determine the time of road retreatment.
This study provides a proactive evaluation framework to analyze the effect of pavement friction evolution due to traffic polishing on traffic safety. The proposed method can be further employed for both practice implications and the benefit of the research community. In terms of practice implication, a skidding risk assessing system for the horizontal curve could be developed to get rapid assessment for pavement friction according to the framework in this paper. This nice idea has been validation and the software can be found in https://www.ccopyright.com.cn/ (accessed on 25 June 2021). For the research community, the framework developed in this study could be expanded to appraise skidding risk in rainy or snowy days. The pavement friction will be affected by water film on rainy days or snow in snowy days, leading to a similar analysis process of this study.
This paper proposed an innovative risk assessment framework, but it also has some limitations remaining for future improvements. The evolution model of friction coefficient adopted in this paper is established for the SMA pavement. Therefore, the risk-assessment framework proposed in this paper is limited to this one. In the future, different risk-assessment models can be established for different types of pavement. In addition, the relationship between the MRI and the realistic traffic accident data needs to be further investigated and validated. Finally, the influence of model parameters on the results is interesting. For instance, MPD is a critical parameter because it stands for texture structure of road surface. The impact of MPD on skidding failure probability need further research.
Author Contributions
Conceptualization, G.X.; data curation, G.X., C.G., R.S., H.S., Y.M. and J.R.; formal analysis, G.X.; funding acquisition, J.X., R.S. and H.S.; methodology, G.X.; project administration, J.X.; supervision, J.X. validation, C.G., R.S., H.S., Y.M. and J.R.; writing—original draft, G.X.; writing—review and editing, J.X. All authors have read and agreed to the published version of the manuscript.
Funding
This research was sponsored jointly by the Key Science and Technology Projects of the Ministry of Transport (Grant No. 2018-ZD1-001) and the Scientific Research Project of Zhejiang Provincial Department of Transportation (Grant No. 2020025).
Institutional Review Board Statement
Not applicable.
Informed Consent Statement
Not applicable.
Data Availability Statement
The data are not publicly available due to privacy restrictions.
Acknowledgements
The authors are grateful to the CCCC First Highway Consultants Co. Ltd. for providing road geometrical data.
Conflicts of Interest
The authors declare that they have no conflicts of interest.
References
- Hall, J.W.; Smith, K.; Titus-Glover, L.; Evans, L.; Wambold, J.; Yager, T.; Rado, Z. NCHRP Web-Only Document 108: Guide for Pavement Friction; Transportation Research Board of the National Academies: Washington, DC, USA, 2009; p. 257. [Google Scholar]
- Buddhavarapu, P.; Banerjee, A.; Prozzi, J.A. Influence of pavement condition on horizontal curve safety. Accid. Anal. Prev. 2013, 52, 9–18. [Google Scholar] [CrossRef] [PubMed]
- Wang, D.; Chen, X.; Oeser, M.; Stanjek, H.; Steinauer, B. Study of micro-texture and skid resistance change of granite slabs during the polishing with the Aachen Polishing Machine. Wear 2014, 318, 1–11. [Google Scholar] [CrossRef]
- Zou, Y.; Yang, G.; Huang, W.; Lu, Y.; Qiu, Y.; Wang, K.C.P. Study of Pavement Micro- and Macro-Texture Evolution Due to Traffic Polishing Using 3D Areal Parameters. Materials 2021, 14, 5769. [Google Scholar] [CrossRef] [PubMed]
- Wang, D.W.; Zhang, Z.Y.; Kollmann, J.; Oeser, M. Development of aggregate micro-texture during polishing and correlation with skid resistance. Int. J. Pavement Eng. 2020, 21, 629–641. [Google Scholar] [CrossRef]
- Chen, F.; Chen, S.R. Reliability-based assessment of vehicle safety in adverse driving conditions. Transp. Res. Pt. C-Emerg. Technol. 2011, 19, 156–168. [Google Scholar] [CrossRef]
- Hou, G.Y.; Chen, S.R.; Chen, F. Framework of simulation-based vehicle safety performance assessment of highway system under hazardous driving conditions. Transp. Res. Pt. C-Emerg. Technol. 2019, 105, 23–36. [Google Scholar] [CrossRef]
- AASHTO. A Policy on Geometric Design of Highways and Streets, 7th ed.; American Association of State Highway and Transportation Officials: Washington, DC, USA, 2018. [Google Scholar]
- Echaveguren, T.; Bustos, M.; de Solminihac, H. Assessment of horizontal curves of an existing road using reliability concepts. Can. J. Civ. Eng. 2005, 32, 1030–1038. [Google Scholar] [CrossRef]
- Pratt, M.P.; Geedipally, S.R.; Wilson, B.; Das, S.; Brewer, M.; Lord, D. Pavement Safety-Based Guidelines for Horizontal Curve Safety. Texas A&M University: College Station, TX, USA, 2018. [Google Scholar]
- Pratt, M.P.; Geedipally, S.R.; Avelar, R.E.; Le, M. Horizontal Curve Evaluation Handbook; Texas A&M Transportation Institute: Austin, TX, USA, 2020. [Google Scholar]
- Lord, D.; Mannering, F. The statistical analysis of crash-frequency data: A review and assessment of methodological alternatives. Transp. Res. Pt. A-Policy Pract. 2010, 44, 291–305. [Google Scholar] [CrossRef]
- Mannering, F.L.; Shankar, V.; Bhat, C.R. Unobserved heterogeneity and the statistical analysis of highway accident data. Anal. Methods Accid. Res. 2016, 11, 1–16. [Google Scholar] [CrossRef]
- Zheng, L.; Sayed, T.; Mannering, F. Modeling traffic conflicts for use in road safety analysis: A review of analytic methods and future directions. Anal. Methods Accid. Res. 2021, 29, 100142. [Google Scholar] [CrossRef]
- You, K.; Sun, L.; Gu, W. Reliability-Based Risk Analysis of Roadway Horizontal Curves. J. Transp. Eng. 2012, 138, 1071–1081. [Google Scholar] [CrossRef]
- Hofko, B.; Kugler, H.; Chankov, G.; Spielhofer, R. A laboratory procedure for predicting skid and polishing resistance of road surfaces. Int. J. Pavement Eng. 2019, 20, 439–447. [Google Scholar] [CrossRef]
- Wambold, J.C.; Antle, C.E.; Henry, J.J.; Rado, Z. International PIARC Experiment to Compare and Harmonize Texture and Skid Resistance Measurements. In PIARC Technical Committee on Surface Characteristics C-1; World Road Association: Paris, France, 1995; p. 346. [Google Scholar]
- Donnell, E.; Wood, J.; Himes, S.; Torbic, D. Use of Side Friction in Horizontal Curve Design A Margin of Safety Assessment. Transp. Res. Rec. 2016, 2588, 61–70. [Google Scholar] [CrossRef]
- PIARC World Road Association. Report of the Committee on Surface Characteristics; PIARC: Brussels, Belgium, 1987. [Google Scholar]
- Lamm, R. Highway Design and Traffic Safety Engineering Handbook; McGraw-Hill: New York, NY, USA, 1999. [Google Scholar]
- Olson, P.L.; Cleveland, D.E.; Fancher, P.S.; Kostyniuk, L.P.; Schneider, L.W. Parameters Affecting Stopping Sight Distance; Transportation Research Board, National Research Council: Washington, DC, USA, 1984. [Google Scholar]
- Co.Ltd, CFHC. Design Specification for Highway Alignment; China Communication Press: Beijing, China, 2017; Volume JTG D20-2017. [Google Scholar]
- Chang, T.-H. Effect of vehicles’ suspension on highway horizontal curve design. J. Transp. Eng. 2001, 127, 89–91. [Google Scholar] [CrossRef]
- Hasofer, A.M.; Lind, N.C. An Exact and Invariant First-order Reliability Format. J. Eng. Mech. 1973, 100, 111–121. [Google Scholar]
- Caliendo, C.; Guida, M.; Parisi, A. A crash-prediction model for multilane roads. Accid. Anal. Prev. 2007, 39, 657–670. [Google Scholar] [CrossRef] [PubMed]
- Gaweesh, S.M.; Ahmed, M.M. Evaluating the safety effectiveness of a weather-based variable speed limit for a rural mountainous freeway in Wyoming. J. Transp. Saf. Secur. 2020, 12, 1205–1230. [Google Scholar] [CrossRef]
- Wang, W.; Chen, J.; Guo, X. Traffic Engineering; Southeast University Press: Nanjing, China, 2019. [Google Scholar]
- Plati, C.; Pomoni, M. Impact of Traffic Volume on Pavement Macrotexture and Skid Resistance Long-Term Performance. Transp. Res. Rec. 2019, 2673, 314–322. [Google Scholar] [CrossRef]
- Gillespie, T.D. Fundamentals of Vehicle Dynamics; ASME: New York, NY, USA, 1995; Volume 48, p. B154. [Google Scholar]
- Sil, G.; Nama, S.; Maji, A.; Maurya, A.K. Effect of horizontal curve geometry on vehicle speed distribution: A four-lane divided highway study. Transp. Lett. 2019, 10, 713–722. [Google Scholar] [CrossRef]
- Himes, S.C. Reliability Based Design of Horizontal Curves Considering the Effects of Grades; The Pennsylvania State University: State College, PA, USA, 2013. [Google Scholar]
- Kane, M.; Zhao, D.; De-Larrard, F.; Do, M.T. Laboratory evaluation of aggregate polishing as a function of load and velocity. Application to the prediction of damages on skid resistance of road surfaces due to trucks and passenger cars. Road Mater. Pavement Des. 2012, 13, 312–326. [Google Scholar] [CrossRef]
Figure 1.
Flowchart of risk assessment framework.
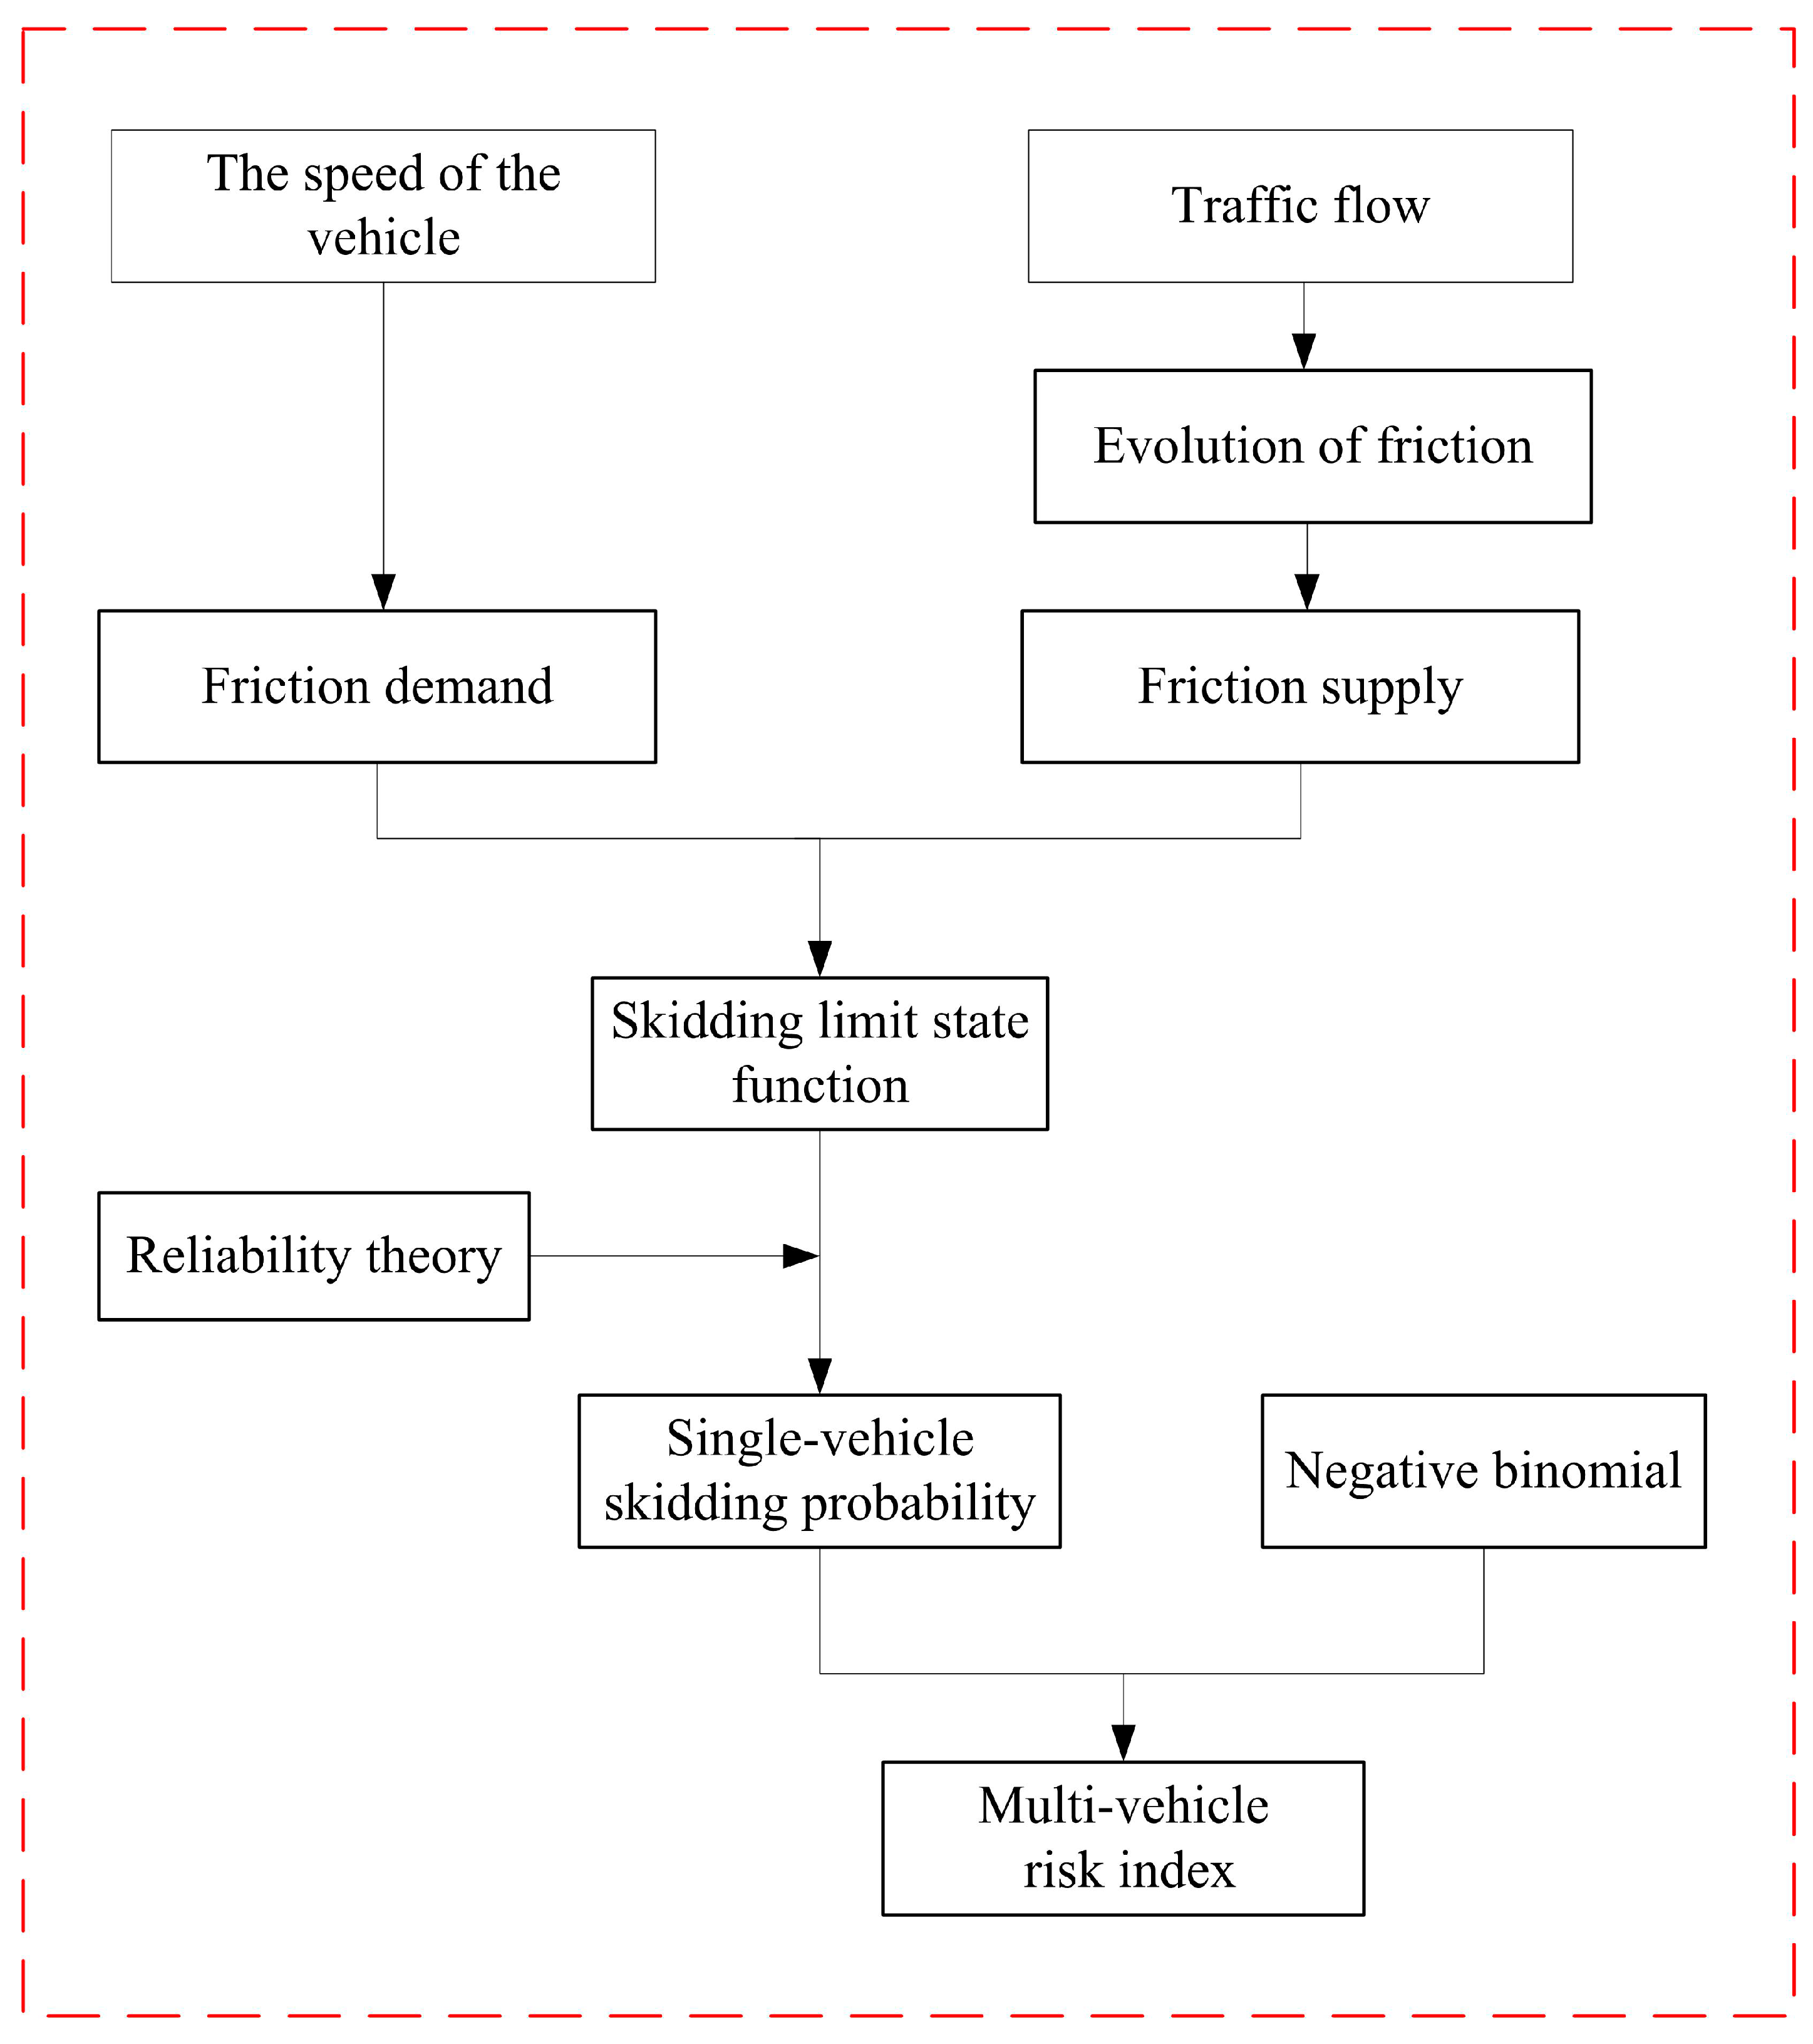
Figure 2.
Vehicle model with suspension system.
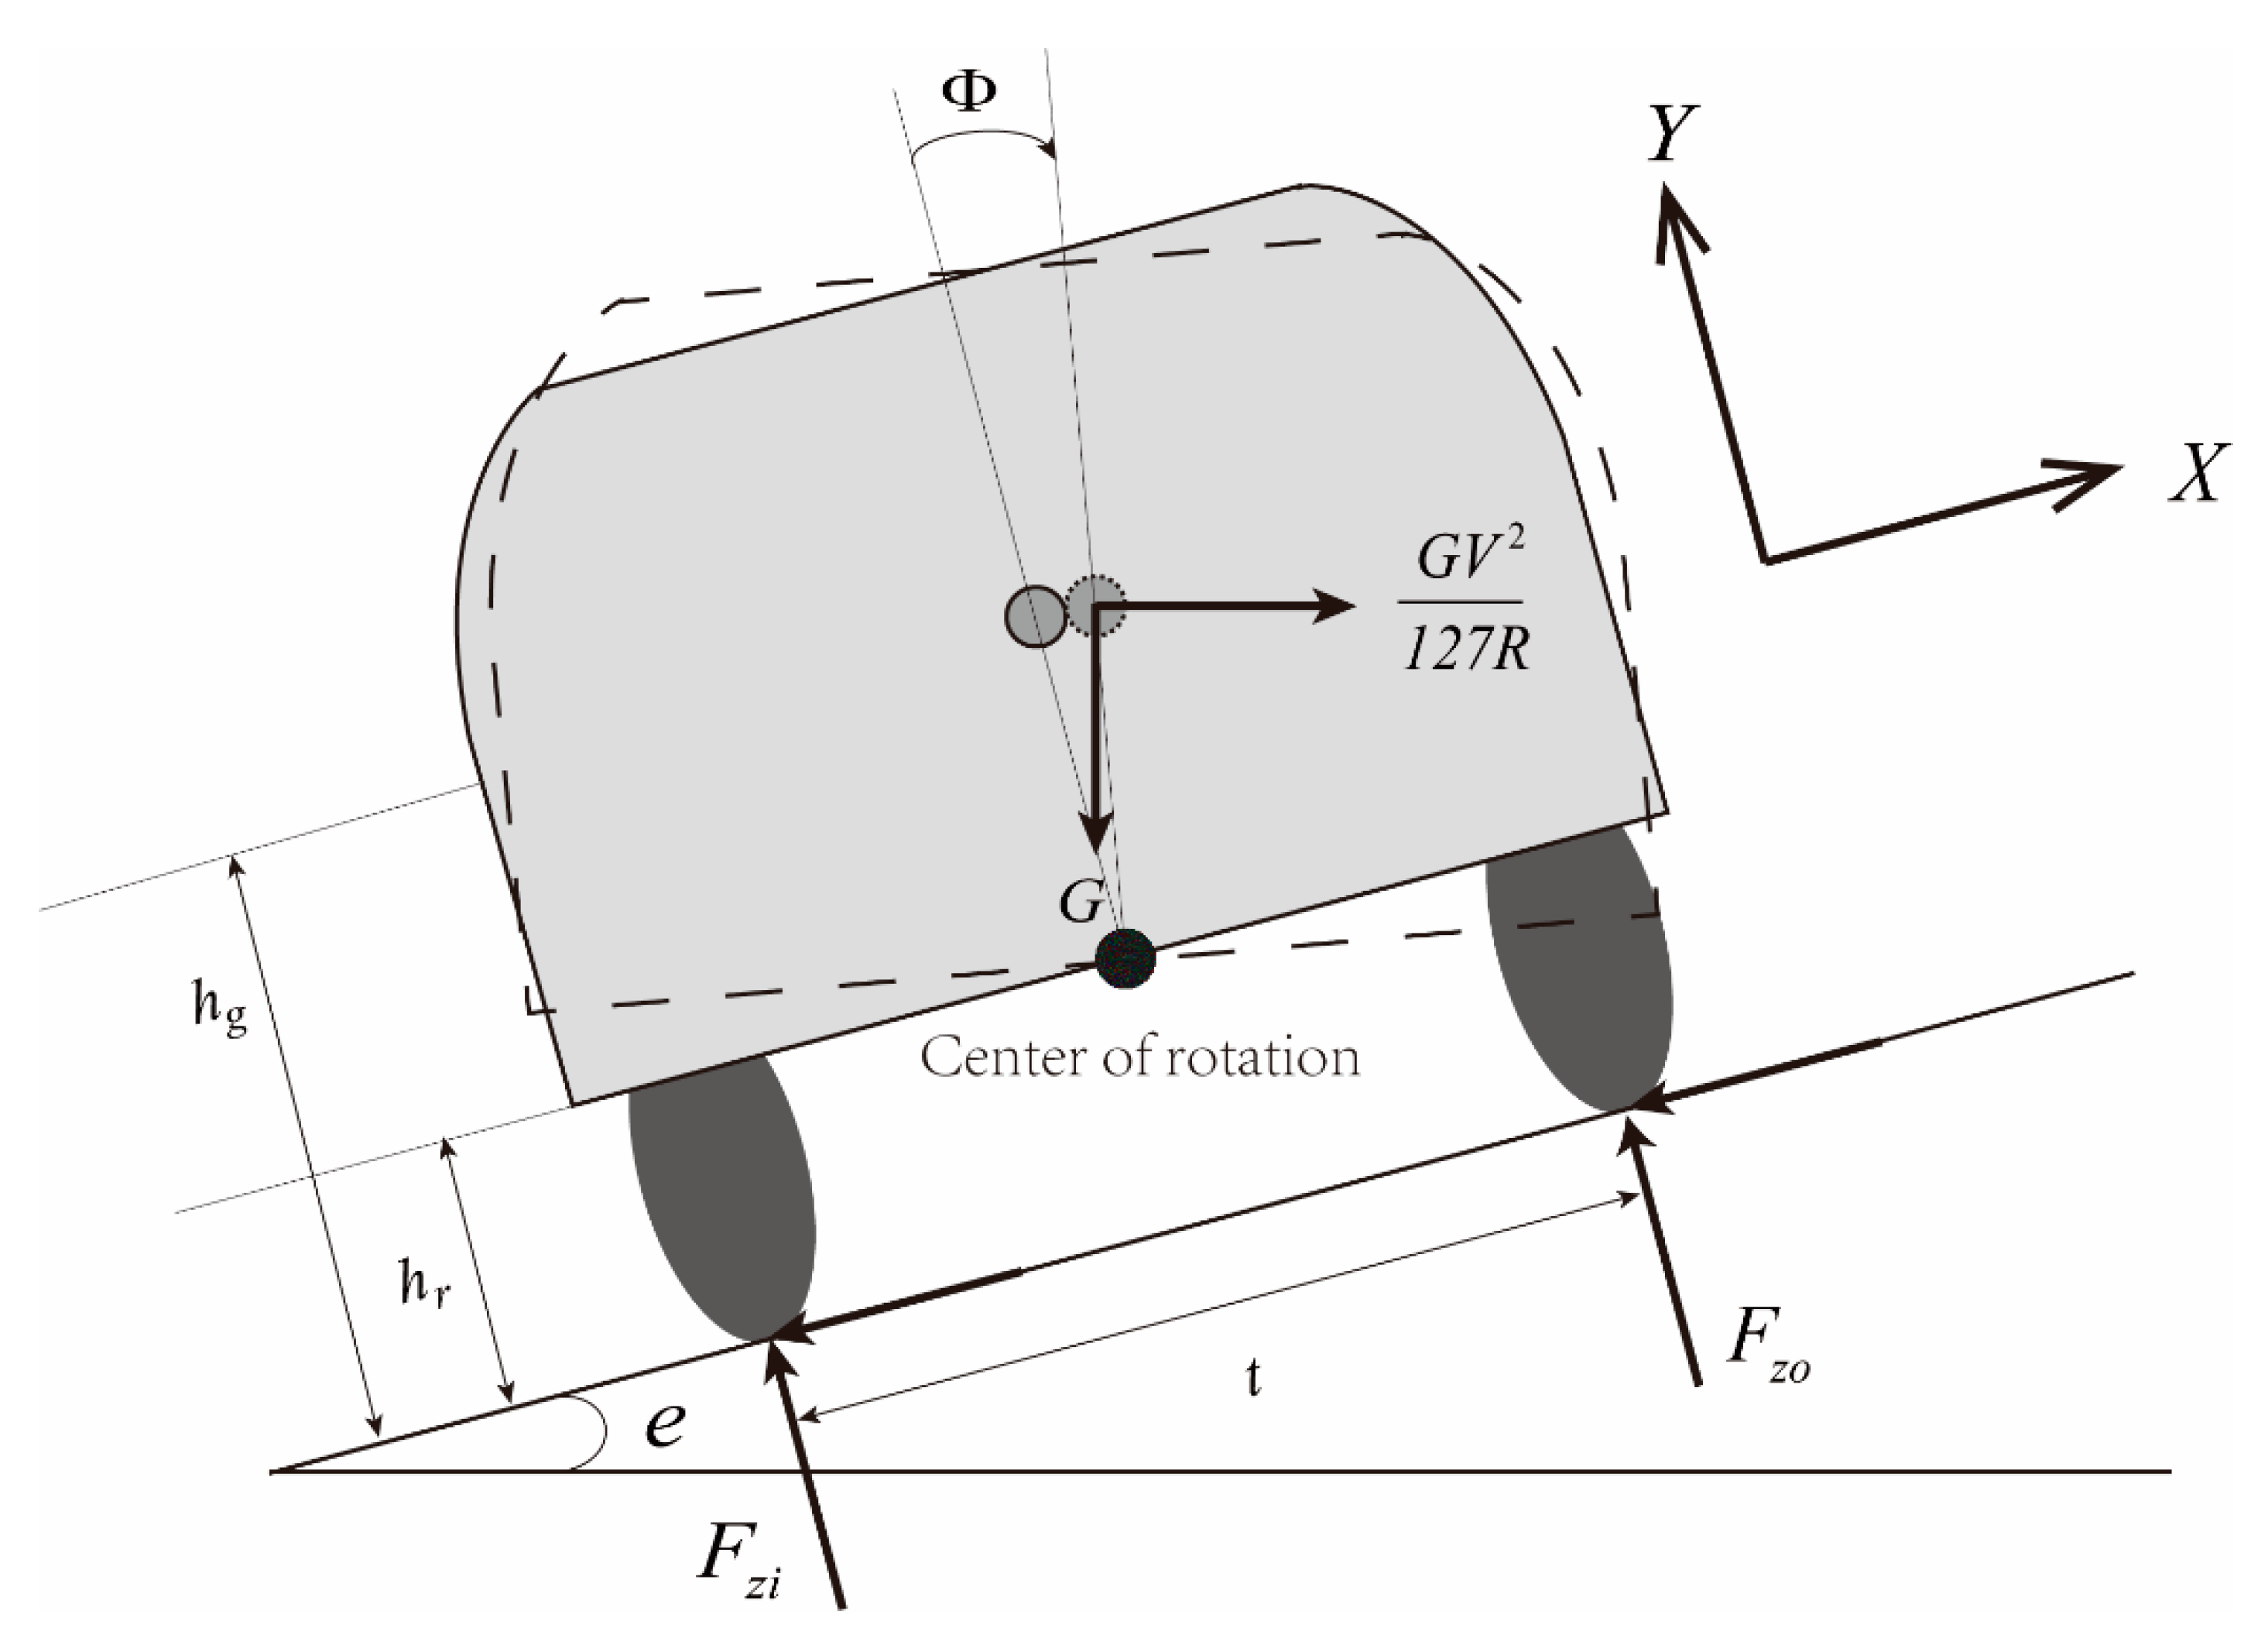
Figure 3.
Velocity information: (a) car, (b) heavy goods vehicle.
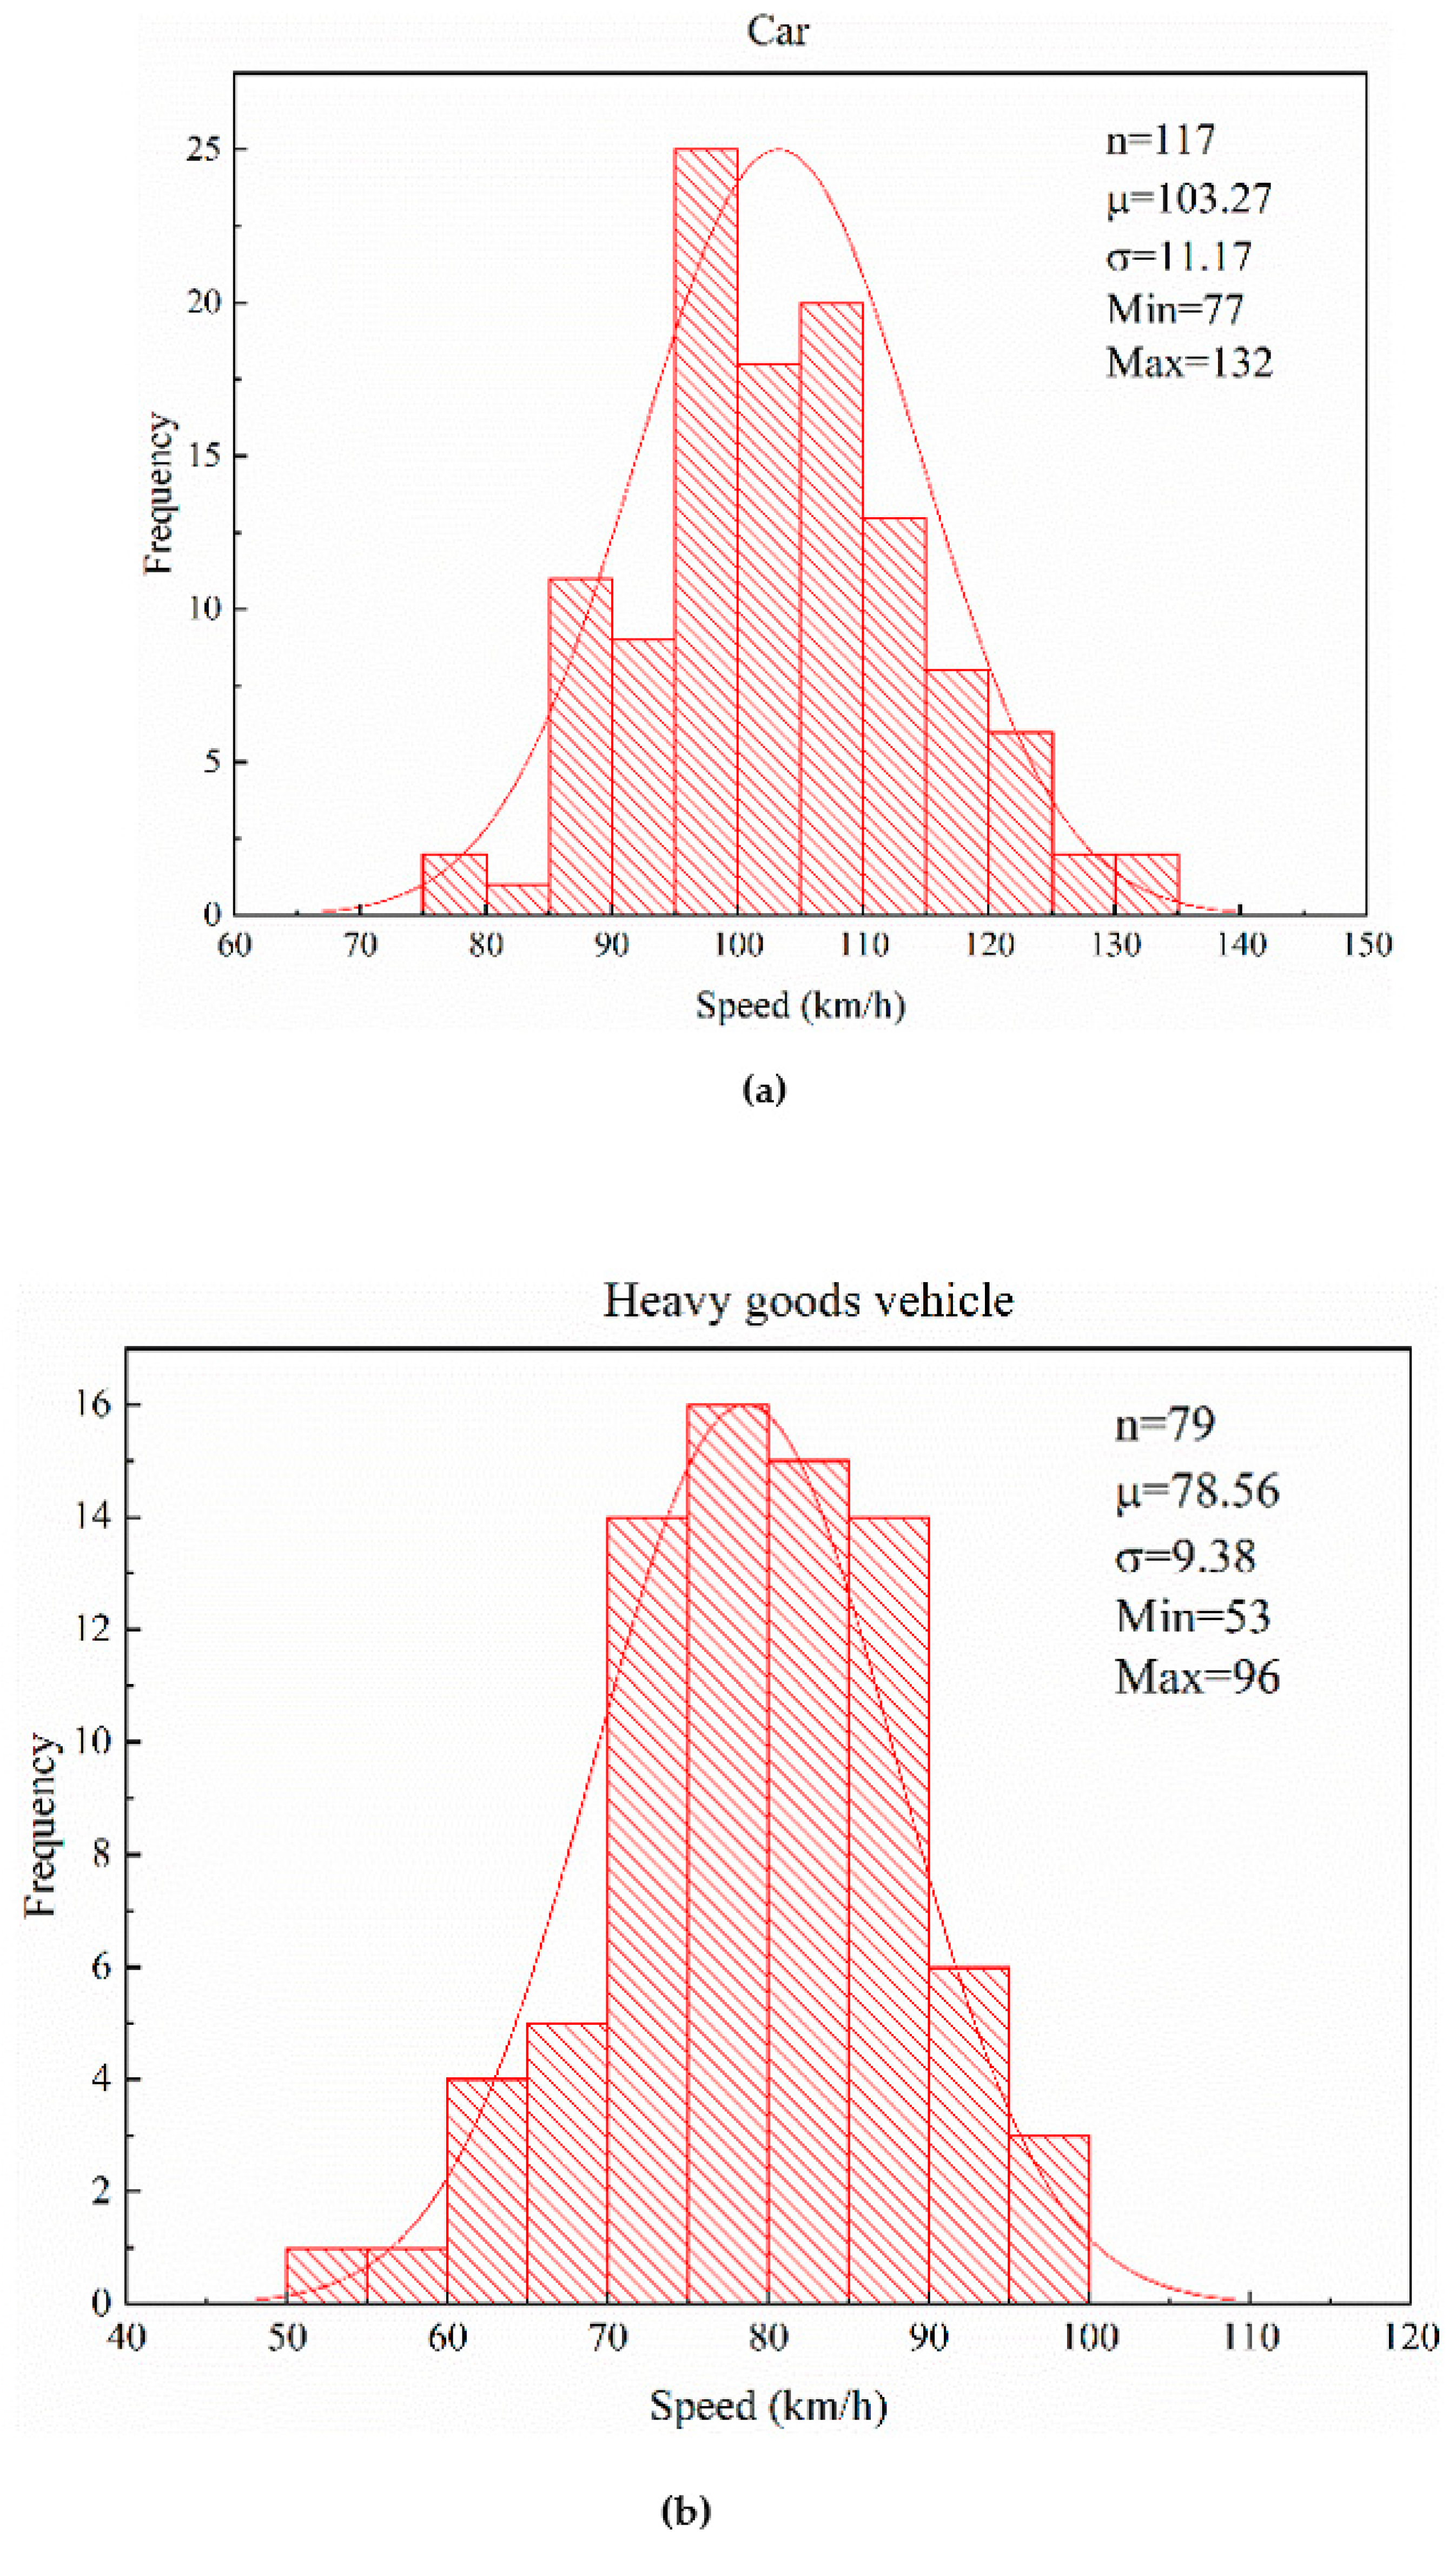
Figure 4.
Influence of AADTHGV and CTV on friction coefficient. CTV, cumulative traffic volume.

Figure 5.
Risk comparison of different models (AADTHGV = 2000 veh/d). POF, probability of failure; HGV, heavy goods vehicle.
Figure 5.
Risk comparison of different models (AADTHGV = 2000 veh/d). POF, probability of failure; HGV, heavy goods vehicle.
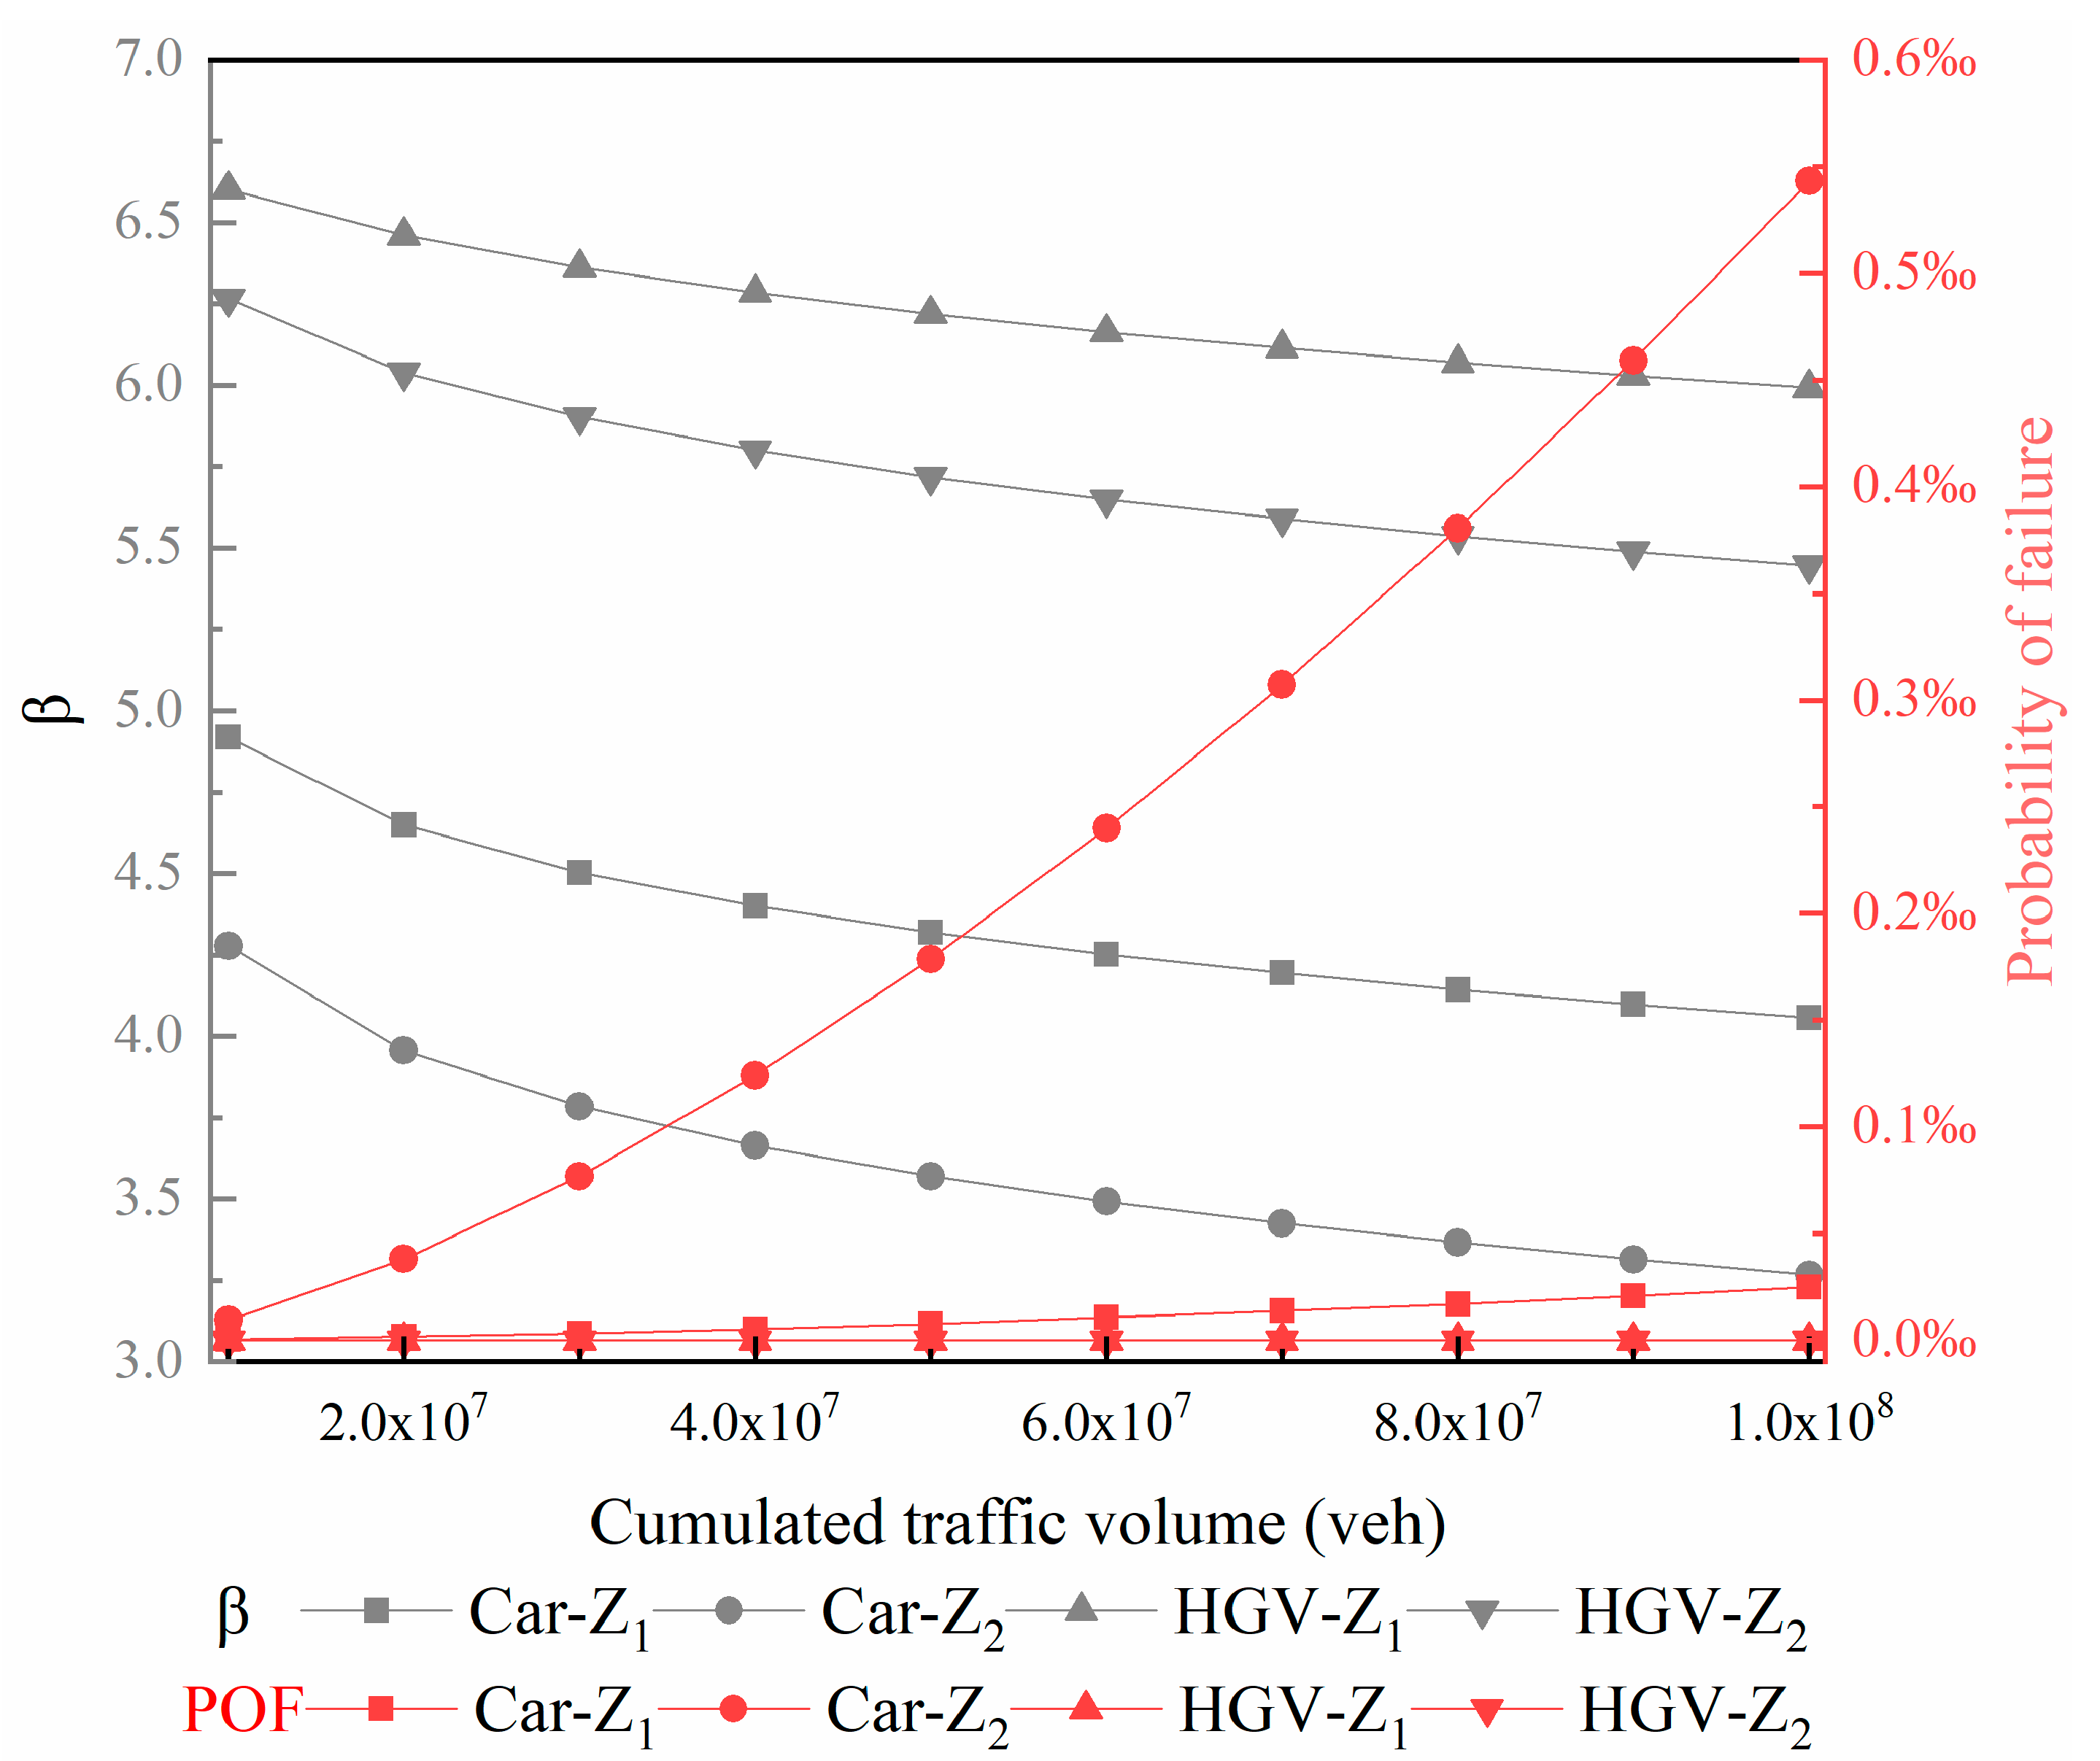
Figure 6.
Multi-vehicle risk index with different AADT (AADTHGV = 2000 veh/d).
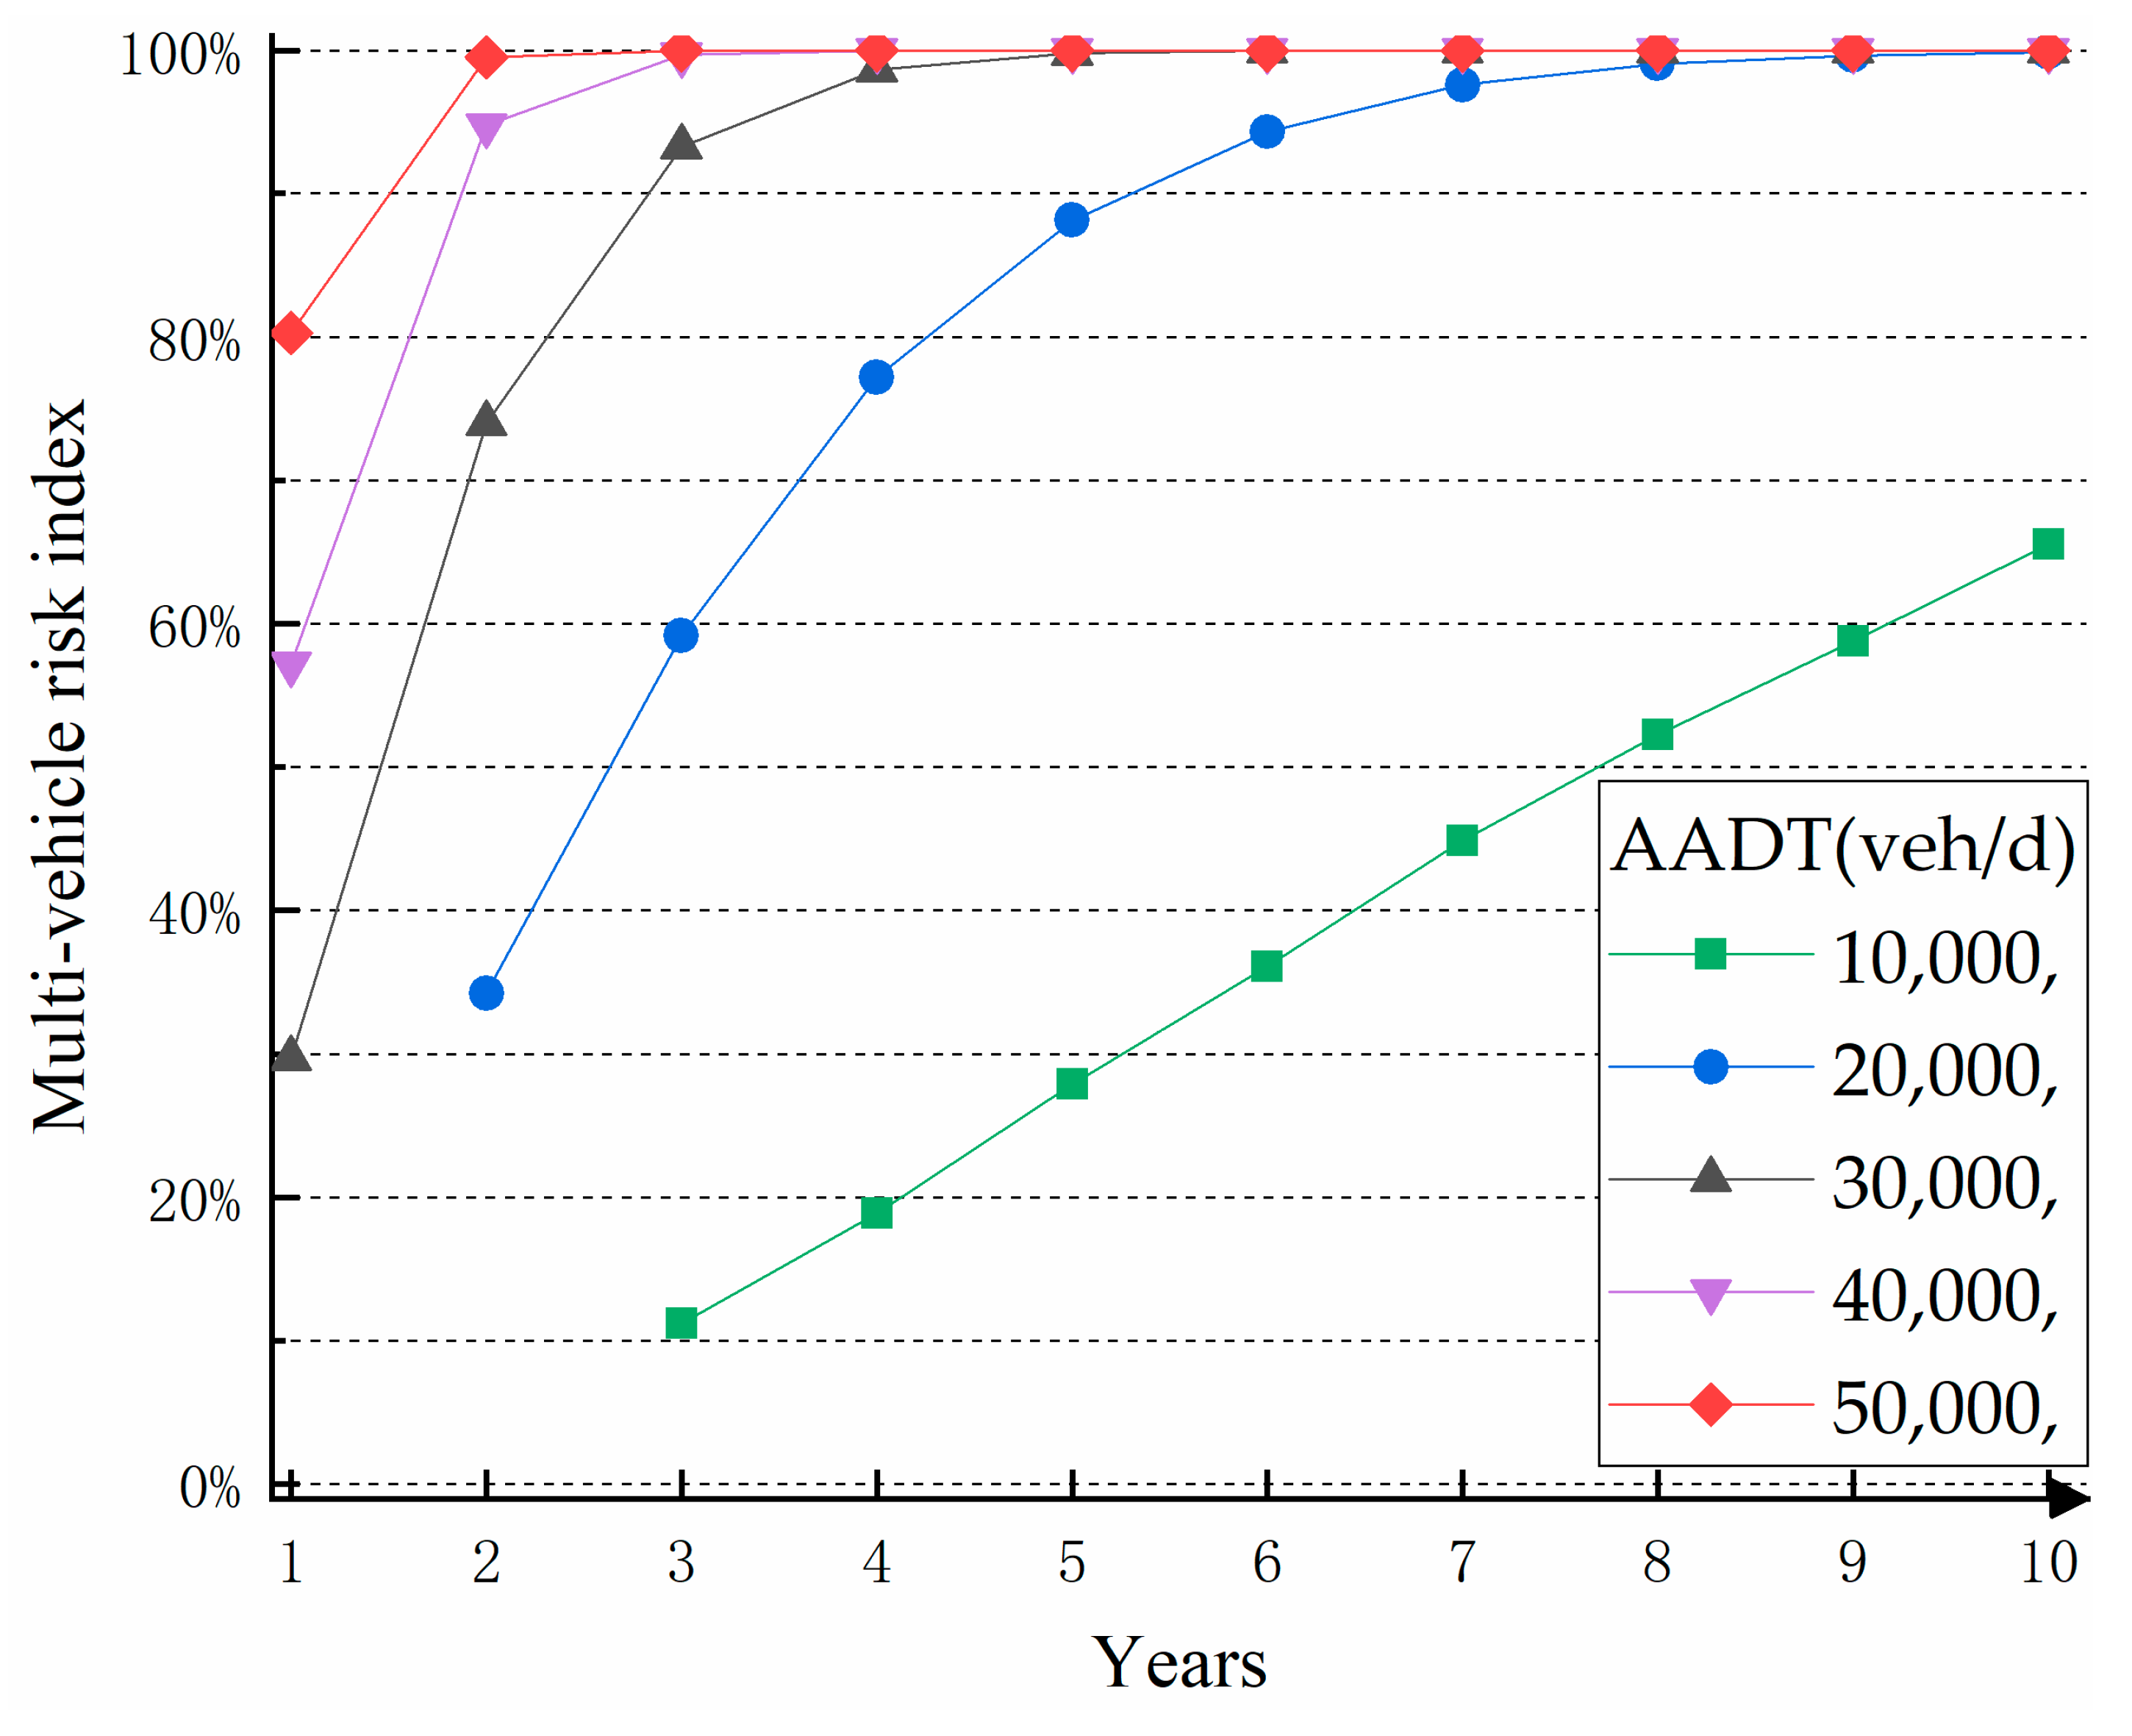
Figure 7.
Multi-vehicle risk index with different AADTHGV (AADT = 20000 veh/d).

Table 1.
Geometric data.
| Radius (m) | Design Speed (km/h) | Posted Speed(km/h) | Lane | Length (m) | Gradient (%) | Superelevation (%) |
|---|---|---|---|---|---|---|
| 1000 | 100 | 100 | 4 | 574 | 2.84 | 5 |
Table 2.
Kolmogorov–Smirnov test.
| Vehicles | Sample Size | Normal Parameters | Most Extreme Differences | Asymp.sig. (2-Tailed) | Kolmogorov- Smirnov Z | |||
|---|---|---|---|---|---|---|---|---|
| Mean | Std.Deviation | Absolute | Positive | Negative | ||||
| Car | 117 | 103.27 | 11.17 | 0.06 | 0.06 | -0.04 | 0.06 | 0.20 |
| HGV | 79 | 78.56 | 9.38 | 0.09 | 0.09 | -0.07 | 0.09 | 0.20 |
Note: HGV, heavy goods vehicle.
Table 3.
Measurements of MPD for 11 Years.
| Section | Geometrical Design | CTV (veh) | Initial MPD (mm) | Recent MPD (mm) |
|---|---|---|---|---|
| A1 | Straight/relatively straight alignment and slope less than 3% | 22 × 107 | 1.02 | 1.04 |
| A2 | 22 × 107 | 1.02 | 1.04 | |
| A3 | 22 × 107 | 1.08 | 1.15 | |
| A4 | 21.7 × 10⁷ | 1.16 | 1.22 | |
| A5 | 34.2 × 10⁷ | 1.1 | 1.14 | |
| A6 | 33.6 × 10⁷ | 1.17 | 1.16 | |
| B1 | Straight/relatively straight alignment and slope less than 3% | 9.16 × 10⁷ | 1.26 | 1.31 |
| B2 | 5.31 × 10⁷ | 1.26 | 1.43 | |
| B3 | 9.47 × 10⁷ | 1.42 | 1.66 | |
| B4 | 5.07 × 10⁷ | 1.27 | 1.61 | |
| B5 | 3.58 × 10⁷ | 1.19 | 1.26 | |
| C1 | Higher curvature and maximum slope 3–6% | 17 × 107 | 1.59 | 1.69 |
| C2 | 18.5 × 10⁷ | 1.55 | 1.73 | |
| C3 | 8 × 10⁷ | 1.34 | 1.5 | |
| C4 | 8.41 × 10⁷ | 1.27 | 1.46 |
Note: CTV-cumulative traffic volume.
Publisher’s Note: MDPI stays neutral with regard to jurisdictional claims in published maps and institutional affiliations. |
© 2022 by the authors. Licensee MDPI, Basel, Switzerland. This article is an open access article distributed under the terms and conditions of the Creative Commons Attribution (CC BY) license (https://creativecommons.org/licenses/by/4.0/).
Share and Cite
MDPI and ACS Style
Xu, G.; Xu, J.; Gao, C.; Sun, R.; Shan, H.; Ma, Y.; Ran, J. A Novel Safety Assessment Framework for Pavement Friction Evolution Due to Traffic on Horizontal Curves. Sustainability 2022, 14, 10714. https://doi.org/10.3390/su141710714
AMA Style
Xu G, Xu J, Gao C, Sun R, Shan H, Ma Y, Ran J. A Novel Safety Assessment Framework for Pavement Friction Evolution Due to Traffic on Horizontal Curves. Sustainability. 2022; 14(17):10714. https://doi.org/10.3390/su141710714
Chicago/Turabian StyleXu, Guilong, Jinliang Xu, Chao Gao, Rishuang Sun, Huagang Shan, Yongji Ma, and Jinsong Ran. 2022. "A Novel Safety Assessment Framework for Pavement Friction Evolution Due to Traffic on Horizontal Curves" Sustainability 14, no. 17: 10714. https://doi.org/10.3390/su141710714
Note that from the first issue of 2016, this journal uses article numbers instead of page numbers. See further details here.