
Improved Neural Network Algorithm Based Flow Characteristic Curve Fitting for Hydraulic Turbines

1
College of Energy and Electrical Engineering, Hohai University, Nanjing 211100, China
2
College of Water Conservancy and Hydropower Engineering, Hohai University, Nanjing 210003, China
*
Author to whom correspondence should be addressed.
Sustainability 2022, 14(17), 10757; https://doi.org/10.3390/su141710757
Submission received: 30 July 2022
/
Revised: 20 August 2022
/
Accepted: 24 August 2022
/
Published: 29 August 2022
(This article belongs to the Special Issue Ocean and Hydropower)
Abstract
:One of the most important characteristic curves in the economic operation of hydropower plants is the turbine flow characteristic curve, which illustrates the law of fluctuation between the characteristic parameters of the turbine under various operating situations. This article proposes an IPSO-LSTM-based refinement method for fitting the turbine flow characteristic curve using deep learning methods, and verifies the effectiveness of the method by comparison to solve the problem that traditional mathematical fitting methods are difficult to meet the requirements of today’s many complex working conditions. Firstly, a deep LSTM network model is established based on the input and output quantities, and then the IPSO method is used to find the optimum number of neurons, the learning rate and the maximum number of iterations of the LSTM units in the network model and other key parameters to determine the relevant training parameters. The results show that the model can effectively improve the accuracy of fitting and predicting the turbine flow characteristics, which is of great significance to the study of the economic operation of hydropower plants and the non-linear characteristics of the turbine.
1. Introduction
In-plant economic operation of hydropower plants is an important way to achieve reasonable load distribution and efficient economic operation of hydropower plant units. In the process of unit load allocation, the solution algorithm will obtain the relationship between hydraulic head, flow and output at the corresponding moment according to the flow characteristic curve of the unit, and then carry out the load allocation among units [1,2]. Therefore, the accuracy of the unit flow characteristic curve fitting has an important impact on the load distribution of hydropower plant units and the economic operation of the plant.
Due to site and cost constraints, the flow characteristic curve of a hydropower plant unit is usually first tested by the manufacturer in a model, then converted to obtain the characteristic curve of a prototype turbine, and finally, the flow rate of power consumption of the unit is calculated according to the turbine output formula [3,4]. In this process, due to the size effect, there is a certain gap between the model test and the prototype test, and the unit parameters of the model and the prototype cannot fully satisfy the similarity law, and there is a difference in the efficiency of the unit under the same operating conditions. At the same time, there is also a large difference between the unit flow consumption calculated according to the unit output formula and the actual unit flow consumption [5]. Therefore, using the large amount of real machine data generated by the actual operation of the unit to process the flow characteristic curve is the most realistic way to reflect the relationship between the characteristic parameters of the unit at each operating condition.
Traditional mathematical interpolation and neural network methods have been applied in the fitting of hydraulic turbine characteristic curves. Zhang Rongsheng et al. [6] used triangular dissection for interpolation of discrete hydraulic turbine comprehensive characteristic data to avoid the duality of data obtained by geometry-based methods; Liu Dong et al. [7] used power station monitoring data input to modify the hydraulic turbine characteristic curve model, which effectively improved the simulation accuracy of the model; Li Junyi [8] and Huang Xianrong [9] used BP neural network and radial basis function neural network to fit the hydraulic turbine comprehensive characteristic curve respectively.
From long time scales, the actual operation of hydropower units accumulates a large number of historical operating characteristics parameters, each set of parameters corresponds to an operating condition, and each condition reflects the current moment of the unit load allocation decisions. These historical data have a certain degree of repeatability and the accumulated historical data have a certain reference significance for future unit operating conditions. The traditional research approach ignores the significance of historical data as a guide, and once the curve fitting model and method have been established, the accuracy and speed of calculation will not change over time. The deep learning method is self-learning and self-evolving [10]. It can improve the accuracy of fitting and predicting the unit’s flow characteristics curve through continuous learning of operational data during the long-term operation of the unit so that the coupling relationship between the unit’s characteristics parameters is closer to the actual operating conditions of the unit.
To this end, this article is based on the real machine operation data of a domestic hydropower station. Firstly, a deep LSTM (Long Short-Term Memory) network model is established based on the input and output quantities. Then the IPSO (Improved Particle Swarm Optimization) method is used to find the optimum number of neurons, network learning rate and maximum number of iterations of the LSTM units in the network model, determine the relevant training parameters and propose an IPSO-LSTM-based method for fitting the flow characteristics curve of a hydraulic turbine. Finally, the validity of the method is verified through relevant example analysis.
2. Theoretical Foundation
For traditional mathematical fitting methods, a logical and clear correspondence between the input and output quantities needs to be established. Once this mapping relationship is established, it cannot be modified and self-learning. The curve fitting method based on traditional neural networks, although capable of self-learning using real machine operating data, is not capable of extracting data features and mining historical data, and is unable to fully explore the relationship between historical operating data and the connection between historical operating data and future operating conditions.
To overcome the above disadvantages, this article proposes an IPSO-LSTM-based method for fitting the flow characteristics curve of hydraulic turbines, using the advantages of deep learning to train the network with a large amount of historical data to construct a mapping relationship between the input and output quantities. The advantage of the deep learning method is that its computational accuracy improves with the increasing amount of training data, but the disadvantage is that if the amount of data is small, the accuracy of the computational results is difficult to guarantee.
The basic framework diagram is shown in Figure 1, where H in the input quantity represents the turbine hydraulic head, P denotes output force and Q in the output quantity denotes flow rate. The basic steps of the turbine flow characteristic curve fitting method used in this article are as follows:
- (1)
- Data pre-processing: Normalization of the collected unit operation data to eliminate the influence of different characteristic parameters with different magnitudes on the learning ability of the network.
- (2)
- Network parameter search for optimization: According to the established deep learning network model, using the improved particle swarm algorithm to optimize the important network parameters and determine the key parameters.
- (3)
- Model training and prediction: After the network parameters are determined, the deep learning network is trained using the training set data, and its prediction performance is evaluated on the test set.
2.1. Data Pre-Processing
The data in this article come from the leading hydropower station in Lancang River Basin. Many sensors in the hydropower plant can read the operation status data of hydropower units in real time. After reading the data, a round of data processing will be done in the hydropower plant. Except for normal data, this step greatly avoids abnormal values in the data set. In addition, when fitting the flow characteristic curve of a turbine, different variables have a wide range of values due to their different amplitudes. If the value is too large, considering the output of the non-linear activation function in the network model, the neuron may be saturated. Therefore, after obtaining the unit data, this research also needs to normalize the training data [11].
We normalize the collected unit hydraulic head, flow and output data and transform the values to the interval [0, 1]:
where , represents the input and output of a data sample, and and denote the minimum and maximum values of each variable, respectively. When normalizing the training set data, both the input and output quantities need to be normalized, whereas the test set only needs to be normalized for the input quantities and the output quantities are inversely normalized.
2.2. LSTM Neural Network
As the operating conditions of the turbine vary with the external load and the characteristic data are collected on a time scale, this article uses Long Short-Term Memory (LSTM) to construct the model. Due to its unique design structure, LSTM is suitable for processing and predicting important events with very long intervals and delays in the time series. LSTM is an extension of the ordinary Recurrent Neural Networks (RNN), which solves the problem of gradient explosion or gradient disappearance during the training process of RNN neural networks, and it makes up for the disadvantage that it does not have a long-term memory function.
As shown in Figure 2, the LSTM network model contains three gates: an input gate, an output gate and a forget gate. Let the input sequence be and the output sequence be , where n is the length of the sequence; is the output of the implied layer; is the state cell of the implied layer, representing the state of the cell at the current moment; is the output of the forget gate; is the output of the input gate; is the output of the output gate; and are the activation functions [12]. , , and represent the corresponding weighting factor matrices respectively [13].
Each gate in the network is effectively a fully connected layer whose output is a vector with element size between [0, 1], which is used to control the transfer of information. The activation function (Sigmoid) of a gate can be expressed as:
The activation function of the hidden layer in the LSTM unitary structure can be expressed as:
2.3. Network Modeling
To better explore the hidden relationships between the characteristic parameters of the turbine, a deep neural network model is used for feature extraction of the data. At moment t, the LSTM network hidden layer structure established in this article is shown in Figure 3. The overall structure can be divided into three major parts: the input layer, the hidden layer and the output layer. As the input data has two features, hydraulic head and force (the output of hydraulic turbine), the input layer is set as a 2-dimensional full connection (FC) layer; the hidden layer has two LSTM layers, and each LSTM layer has multiple memory units inside. The output data is flow rate, so the output layer is set as a 1-dimensional full connection layer. Except for the data exchange between the neurons within the LSTM layer, the neurons in the remaining layers are independent of each other, and the only information is exchanged between the layers. The training set data of length T is input to the hidden layer after normalization. To prevent overfitting of the model, a Dropout layer [14] is added after each LSTM layer. It is then back-normalized and output from the output layer is obtained to give the predicted value Y of the model.
The forward propagation process of LSTM networks can be summarized as [15]: At moment t, the input to the hidden layer of the LSTM network is , the output is and the memory cell is . The input gate is used to control how much of the input data flows into the memory cell at the current moment of the network, i.e., the amount saved into , with the following values:
The forget gate is a key component of the LSTM unit, whose role is to determine the information to be retained or forgotten and to circumvent in some way the phenomenon of gradient disappearance or explosion that occurs when the gradient is propagated backward. The forget gate selects the information to be erased, i.e., it determines the magnitude of the effect of the information in the memory element at the previous moment on the information in the memory element at the current moment.
The output gate determines the magnitude of the action of the memory cell on the output value at the current moment, i.e., the output value of the memory cell at moment t. The value of the output gate is shown in Equation (7) and the output of the LSTM cell at moment t can be obtained by Equation (8).
In this article, the Adam algorithm [16] is used to train the LSTM network model. The product of the input quantities and the corresponding weight coefficients are first calculated, and then the sum of these products is passed through the action of the activation function. In backpropagation, the gradient value of the loss function for each parameter is calculated, and this is used to update the weight parameter W and the bias parameter b to complete the training process of the network model. Mean Square Error (MSE) was chosen as the loss function, and the formula was calculated as follows:
where n denotes the sequence length, denotes the label value, and denotes the predicted value of the network model.
3. IPSO-Based Neural Network Parameter Optimization
The number of neurons and layers in the hidden layer of a neural network directly determines the fitting ability of the model, while the learning rate and the number of iterations affect the training process and the effect of the model. To solve the problem that the number of hidden layer neurons, learning rate and the number of iterations is difficult to be determined, an Improved Particle Swarm Optimization (IPSO) algorithm is used to optimize the hyper-parameters of the established neural network model to determine the optimal parameter settings of the network model.
3.1. IPSO Algorithm
The basic principle of Particle Swarm Optimization (PSO) can be summarized as follows: in the D-dimensional search space, the position and velocity information of the particles are randomly initialized, and the i-th particle is the velocity and position can be denoted as and . The fitness value of each particle is obtained from the fitness function, from which two extremes of the particle population can be determined: the individual extremum and the global extremum . The particle velocity and position information are updated as shown in Equations (10) and (11) [17].
where I = 1, 2, …, n; d = 1, 2, …, D; k is the number of iterations;
w is the inertia weight; and are the learning factors for the individual and the whole population respectively, generally taken as a random number between (0, 2);
is the velocity of the i-th particle in dimension d at the k-th iteration;
is the position of the i-th particle in dimension d at thek-th iteration;
is the individual extreme value of the i-th particle in the d dimension;
is the extreme value in d dimension in the current iteration of the population.
To make the particle swarm algorithm superiority-seeking ability and speed, non-linear variation of weights is used to improve the performance of PSO [18]. The form of w variation in this article is shown in Equation (12).
where and are the maximum and minimum values of w, respectively; t is the current number of iterations; and is the maximum number of iterations.
When the particle swarm first starts searching, t is small and w is close to its maximum value. Then, w decreases slowly, ensuring the algorithm’s optimization capability. As t increases, w decreases non-linearly and the magnitude of the decrease increases, ensuring the algorithm’s local optimization capability and thus making the algorithm more flexible in its search.
3.2. Network Parameter Optimization
For the key parameters in the established network model, such as the number of neurons in the first and second hidden layers (,), the model learning rate () and the number of training sessions (ep), the dimension of the search solution space of the particles is set to 4 dimensions. The fitness value of the i-th particle is calculated as shown in Equation (13).
where denotes the fitness value of the i-th particle; n is the number of samples in the test set; and and denote the predicted and labeled values of the network pa rameters for the j-th sample of the model corresponding to particlei. The predicted values are calculated based on the information of the parameters carried by the particle after training the network model.
As shown in Figure 4, the neural network parameters for IPSO optimization are calculated as follows:
- (1)
- Initialize each individual’s parameters. Determine the population size, the number of iterations, the learning factor and the range of intervals in which the velocity and position of the particles are taken.
- (2)
- Initialize the position and velocity information of the particles. Randomly generate a certain number of population particles , i = 1, 2, …, n, with the values of the particles in each dimension within a limited interval.
- (3)
- Calculate the fitness value corresponding to each particle according to the established objective function equation, determine the global extremes and individual extremes of the initial population, and use the best position of each particle as its historical best value.
- (4)
- In each iteration, update the velocity and position information of the particles according to Equations (9) and (10), calculate the fitness value of each particle of the new population after the update, and determine the individual extreme value and global extreme value of the current population.
- (5)
- Repeat steps (3) and (4) until the maximum number of iterations or accuracy is satisfied, output the optimal network parameters and train the network model.
3.3. Evaluation Indicators
To be able to evaluate the calculated results of the fitted models established, the mean square error, Mean Absolute Error (MAE), Root Mean Square Error (RMSE) and coefficient of determination (R2) were selected as the basis for judging the effectiveness of the various fitting methods, which were calculated using the following formulae:
where n is the length of the sequence, is the label value, is the predicted value of the network model and is the average of the label values. For unit flow characteristic curve fitting, the smaller the value of MAE and RMSE and the larger the value of R2, the better the model is fitted and the higher the accuracy.
4. Case Analysis
4.1. Parametric Optimization
In this article, we take a leading hydropower station in a terrace basin as an example, and the experimental model data of the root unit and the real machine operation data are shown in Figure 5, which clearly shows that the real machine operation data are more concentrated, in line with the actual situation that the unit is mostly operated in the economic zone; the model data are full hydraulic head operating conditions data, which are more comprehensive. Using the comprehensiveness of the model data and the specificity of the real machine data, the training data set of the network model is combined, which effectively takes into account the full hydraulic head operating conditions of the unit, but also more comprehensively combines the efficient operating zone of the unit in the actual operation process, avoiding the prediction accuracy and precision problems of using a single data source for training the network.
The operation data was collected in the form of 96 samples a day, collecting the characteristics data of the unit for one year of operation, with a total data volume of 365 × 96. The model test data was provided by the manufacturer, with a total of 1220 samples. The data set was divided into a training set, validation set and test set, where the training set accounted for 90% of the total quantity, the test set accounted for 10% and the validation set accounted for 20% of the training set. Afterwards the hyper-parameters of the established network model were optimized according to the divided data set.
The necessity of choosing a two-layer network is first verified. Separate single-layer and double-layer LSTM network models are built and validated using the processed data. The input dimension is 2-dimensional and the output dimension is 1-dimensional; the number of neurons in the hidden layer is 5; the maximum number of training sessions is 500; the learning rate is 0.01; and the activation function is a Sigmoid function. The prediction results of the single-layer and double-layer networks are shown in Table 1. As can be seen from the table, under the condition of the same network hyper-parameters, the MAE and MSE of the prediction results of the deep layer network are significantly smaller than those of the shallow layer network in multiple calculations, both of which are reduced by about 46%, and the accuracy and stability of the prediction results are significantly improved.
According to the above experimental results, the deep neural network model for the fitting of hydraulic turbine characteristic curve is constructed by using the advantage of deep network for data feature extraction, and the hyper-parameters of the network model are optimization-seeking selected. The optimized parameters are set as follows: the number of neurons in the input layer is 2; the number of neurons in the output layer is 1; the internal parameters of the LSTM unit are trained by Adam’s algorithm; and the initialization method is Xavier. The parameters of the improved particle swarm algorithm are set as follows: the number of populations is 5; the number of evolution is 20; the learning factor of the particles is taken as , any particle for each dimension parameter in the range of [1, 100], [1, 100], [0.0001, 0.01] and [300, 600], and the velocity of the particle in the range of [−5, 5], [−5, 5], [−0.0005, 0.0005] and [−10, 10]. In IPSO,,; In PSO, w = 0.5.
In this article, the programming language is Python and the programming platform is PyCharm 2021.2. The version of TensorFlow and TensorFlow-GPU library is 2.4.0. The Keras module of TensorFlow framework is used for model building, and the hardware environment is as follows: GPU model is NVIDIA GeForce RTX 3070 and CPU model is Intel(R) Core(TM) i7-7800X CPU. The results are shown in Figure 6. Both PSO and IPSO results were averaged over 10 calculations. The IPSO method was then used to calculate the number of neurons in each hidden layer, the network learning rate and the number of training sessions, with the same algorithm settings as before. It can be clearly seen from the Figure 6 that the final fitness values of PSO and IPSO are similar, but the initial value of IPSO is significantly better than that of PSO. Moreover, PSO converged gradually at the 12th iteration, while IPSO converged at the 5th iteration, indicating that IPSO has better optimization ability. Therefore, IPSO has more advantages than PSO in overall performance.
The change in the number of neurons in each hidden layer of the LSTM network model is shown in Figure 7. As can be seen from the figure, the number of neurons in the first hidden layer of the network model, , finally stabilizes at 40, and the number of neurons in the second hidden layer, , finally stabilizes at 32 as the number of iterations increases. Figure 8 shows the variation of the network learning rate with the number of iterations, with the value eventually stabilizing at 0.0015 as the number of iterations increases. Figure 9 reflects the variation of the training number of the LSTM network with the number of IPSO iterations ep, with the final value stabilizing at 342. Based on the results of hyper-parameter search, i.e., and ep = 342. After determining the network structure, the LSTM network was used to train the divided training set data.
4.2. Model Training and Prediction
Once the important parameters of the network model have been determined using the IPSO method, the model can be trained, and when the set accuracy or the maximum number of iterations is reached, the training is completed, the trained network model is saved, and finally the performance of the model on the test set data is observed.
The network structure and the output dimension of each layer of the network established in the article are shown in Table 2. There are four layers in the network. In order to prevent the model from overfitting, the Dropout method is used to process between two LSTM network layers respectively, and the ratio is set to 0.2.
To demonstrate the self-learning and self-evolving capability of the deep learning method, the training set sample data volumes were taken to be 3, 6 and 9 months, respectively, and the prediction results were then evaluated using three metrics: MSE, MAE and R2. The training parameters were set to epochs = ep, bath size = 32, learning rate =; Adam’s algorithm was chosen as the optimization algorithm and MSE was chosen as the loss value. The training was stopped when the number of epochs was reached and the trained model was used to predict the test set data and the results were compared to both Support Vector Machine (SVM) [19] and Extreme Learning Machine (ELM) [20] methods. The results are shown in Figure 10 and Figure 11. It can be seen from the figures that the error value gradually decreases as the number of samples increases.
As can be seen from Figure 10, as the number of samples in the training set keeps increasing, the value of R2 increases from 98.16% at the beginning to 99.43%, MSE decreases from 36.71% to 11.43%, and MAE decreases from 43.90% to 28.03%. This is due to the fact that the LSTM-based deep learning model performs uninterrupted self-correction as training samples are accumulated, so its decision accuracy increases as the number of training samples increases, reflecting a strong self-learning capability.
For comparison, the number of neurons in the ELM network is set to , and the maximum training number is ep = 342; the kernel function of SVM is set to Radial Basis Functions (RBF). The programming language for both models was still Python, and the running platform was PyCharm 2021.2. The prediction results were evaluated using three evaluation metrics, MSE, MAE and RMSE, as shown in Table 3.
As can be seen from Figure 11 and Table 3, the prediction results of IPSO-LSTM method are significantly better than those of SVM method and ELM method. Among them, SVM has a larger prediction error compared to the other two methods, while the MSE of the proposed method is reduced by about 46%, the MAE by about 25% and the RMSE by about 27% compared to the ELM method.
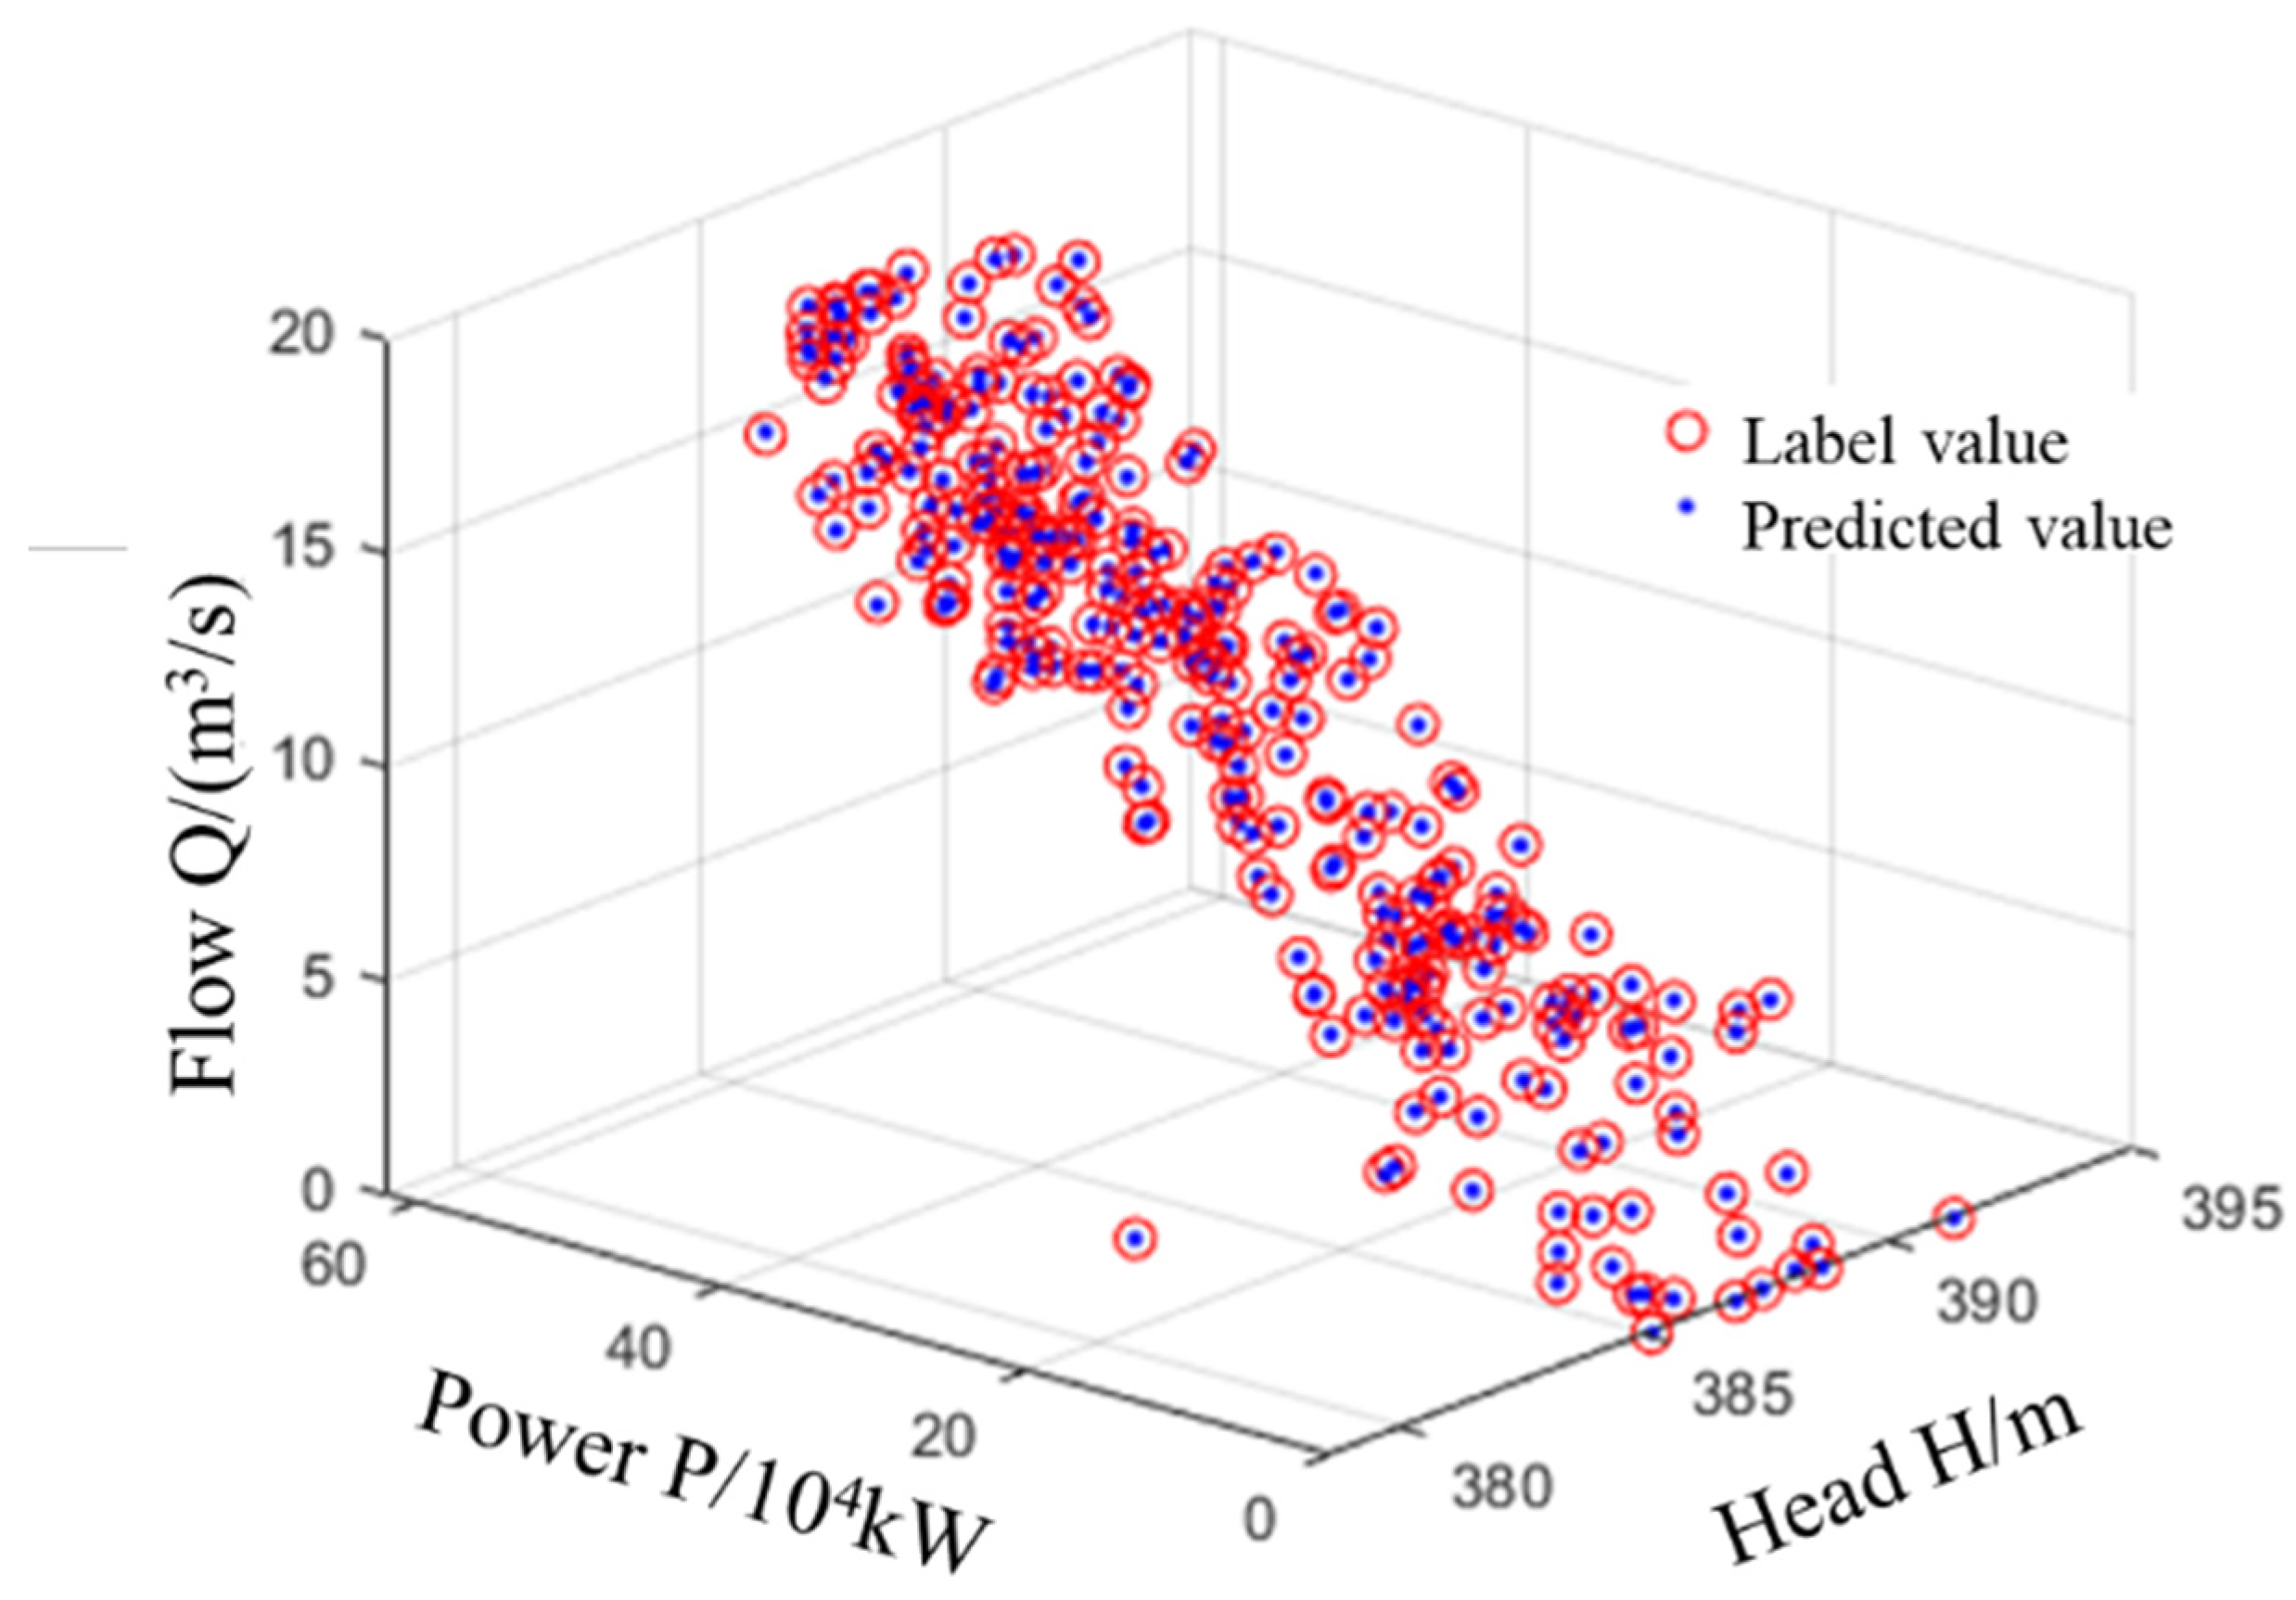
The final output of the IPSO-LSTM model is shown in Figure 12. The horizontal coordinate of the XOY plane is the hydraulic head H, the vertical coordinate is the outflow P, and the Z-direction represents the flow rate Q of the unit, which is also the output value of the network model. The blue dots in the figure indicate the predicted values and the red circles indicate the labeled values from the test set. As can be seen from the graph, the coordinates of the labeled and predicted values almost overlap, indicating that the proposed method has high prediction accuracy, reflecting the reliability of the method and providing an important guarantee for the economic and stable operation of the unit.
5. Conclusions
In this article, a method for fitting turbine flow characteristics curve with self-learning capability based on deep learning is proposed, and the conclusions obtained are as follows:
- (1)
- The deep learning-based hydraulic turbine flow characteristic curve fitting method can continuously train and correct the model by continuously accumulating historical data, and its fitting accuracy will improve with the accumulation of the number of training sets, so the method has the characteristics of self-learning and self-correction.
- (2)
- The training process of the IPSO-LSTM-based deep learning model for fitting the flow characteristics of hydraulic turbines is closely related to the number of training sets; the more samples in the training set, the faster the model training converges and the smaller the error.
- (3)
- Since the deep learning-based hydraulic turbine flow characteristic curve fitting method uses a large amount of real machine operation data to train the model and construct a mapping relationship between input and output quantities, compared with traditional mathematical fitting methods and machine learning methods, it can effectively discover the laws in a large amount of historical operation data, use the connection between historical data and future operating conditions, and make accurate calculations of future unit operating conditions characteristics and parameters. It can also make reasonable predictions for certain unknown operating conditions and has good adaptability.
- (4)
- The hydraulic turbine flow characteristics curve fitting method combining hydraulic turbine model test data and real machine operation data proposed in this article, i.e., considering the full working condition operation characteristics of the hydraulic turbine in the model test and combining the vibration avoidance operation characteristics of the real machine data. Compared with the traditional fitting method, the fitting model learns the operating characteristics of the hydraulic turbine in each working condition and the actual operating characteristics at the same time. Therefore, the results of the fitting calculations using the method proposed in this article are accurate and economical at the same time.
Author Contributions
Software, F.L.; Writing—original draft, C.H. and F.F.; Writing—review & editing, H.P. and Y.Z. All authors have read and agreed to the published version of the manuscript.
Funding
This work was supported by the National Key R&D Program Key Project of Intergovernmental International Science and Technology Innovation Cooperation under Grant 2019YFE0105200, in part by the Science and Technology Project of Huaneng Group Headquarters under Grant HNKJ20-H20, and in part by the Multi-Dimensional Fault Diagnosis Method of Hydropower Unit Based on Improved Deep Learning Strategy under Grant 51809082.
Institutional Review Board Statement
Not applicable.
Informed Consent Statement
Not applicable.
Data Availability Statement
Not applicable.
Conflicts of Interest
The authors declare no conflict of interest.
References
- Yang, Z.; Yang, K.; Su, L.; Hu, H. The short-term economical operation problem for hydropower station using chaotic normal cloud model based discrete shuffled frog leaping algorithm. Water Resour. Manag. 2020, 34, 905–927. [Google Scholar] [CrossRef]
- Chen, S.; Liang, B.; Lu, H. Derivation of the aggregation-decomposition principle for optimal load distribution of hydropower station. J. Hydraul. Eng. 2017, 48, 1185–1194. [Google Scholar]
- Zhao, W. The Study of the Economic Operation of Hydropower Station Based on APSO-SA Algorithm; Huazhong University of Science and Technology: Wuhan, China, 2016. [Google Scholar]
- Zhang, Y.; Zang, W.; Zheng, J.; Cappietti, L.; Zhang, J.; Zheng, Y.; Fernandez-Rodriguez, E. The influence of waves propagating with the current on the wake of a tidal stream turbine. J. Appl. Energy. 2021, 290, 116729. [Google Scholar] [CrossRef]
- Zheng, Y.; Chen, D. Water Turbine; China WaterPower Press: Beijing, China, 2011. [Google Scholar]
- Zhang, R.; Liu, Z.; Wang, L.; Zhang, Y. Data interpolation by Delaunay triangulation for the combined characteristic curve of a turbine. J. Hydroelectr. Eng. 2011, 30, 197–201+221. [Google Scholar]
- Liu, D.; Hu, X.; Zeng, Q.; Zhou, H.K.; Xiao, Z.H. Refined hydro-turbine characteristic curve model based on input-output correction. J. Hydraul. Eng. 2019, 50, 555–564. [Google Scholar]
- Li, J.; Chen, Q.; Chen, G. Study on synthetic characteristic curve processing of Francis turbine conbined with BP neural network. J. Hydroelectr. Eng. 2015, 34, 182–188. [Google Scholar]
- Huang, X.; Liu, D. The treatment of hydroturbine synthetic characteristic curve by radial basis networks. J. Hydroelectr. Eng. 2007, 26, 114–118. [Google Scholar]
- Kilinc, H.C.; Yurtsever, A. Short-Term Streamflow Forecasting Using Hybrid Deep Learning Model Based on Grey Wolf Algorithm for Hydrological Time Series. Sustainability 2022, 14, 3352. [Google Scholar] [CrossRef]
- Zhu, Q.; Li, H.; Wang, Z.; Chen, J. Short-Term Wind Power Forecasting Based on LSTM. Power Syst. Technol. 2017, 41, 3797–3802. [Google Scholar]
- Dai, J.; Song, H.; Sheng, G. Prediction Method for Power Transformer Running State Based on LSTM Network. High Volt. Eng. 2018, 44, 1099–1106. [Google Scholar]
- Zhou, D.; Zhuang, X.; Zuo, H. A hybrid deep neural network based on multi-time window convolutional bidirectional LSTM for civil aircraft APU hazard identification. Chin. J. Aeronaut. 2022, 35, 344–361. [Google Scholar] [CrossRef]
- Nitish, S.; Geoffrey, E.; Hinton, A.K.; Ilya, S.; Ruslan, S. Dropout: A simple way to prevent neural networks from overfitting. J. Mach. Learn. Res. 2014, 15, 1929–1958. [Google Scholar]
- Wang, X.; Wu, J.; Liu, C.; Yang, H.; Du, Y.; Niu, W. Exploring LSTM based recurrent neural network for failure time series prediction. J. Beijing Univ. Aeronaut. Astronaut. 2018, 44, 772–784. [Google Scholar]
- Kingma, D.P.; Ba, J. Adam: A method for stochastic optimization. arXiv 2014, arXiv:1412.6980. [Google Scholar]
- Xue, L.; Dezhi, H.; Letian, D.; Qiuting, T. Intrusion detection of wireless sensor networks based on IPSO algorithm and BP neural network. Int. J. Comput. Sci. Eng. 2020, 22, 221–232. [Google Scholar]
- Li, W.; Feng, F.; Jiang, Q. Prediction for railway passenger volume based on modified PSO optimized LSTM neural network. J. Railw. Sci. Eng. 2018, 15, 3274–3280. [Google Scholar]
- Wang, Q.; Li, J.; Chen, S.; Wang, X. SVM-based Implicit Stochastic Scheduling Mode for Cascade Hydropower Stations. MATEC Web Conf. 2018, 246, 2046. [Google Scholar] [CrossRef]
- Zhou, J.; Yu, X.; Jin, B. Short-Term Wind Power Forecasting: A New Hybrid Model Combined Extreme-Point Symmetric Mode Decomposition, Extreme Learning Machine and Particle Swarm Optimization. Sustainability 2018, 10, 3202. [Google Scholar] [CrossRef] [Green Version]
Figure 1.
Basic framework chart.

Figure 2.
LSTM unit structure.
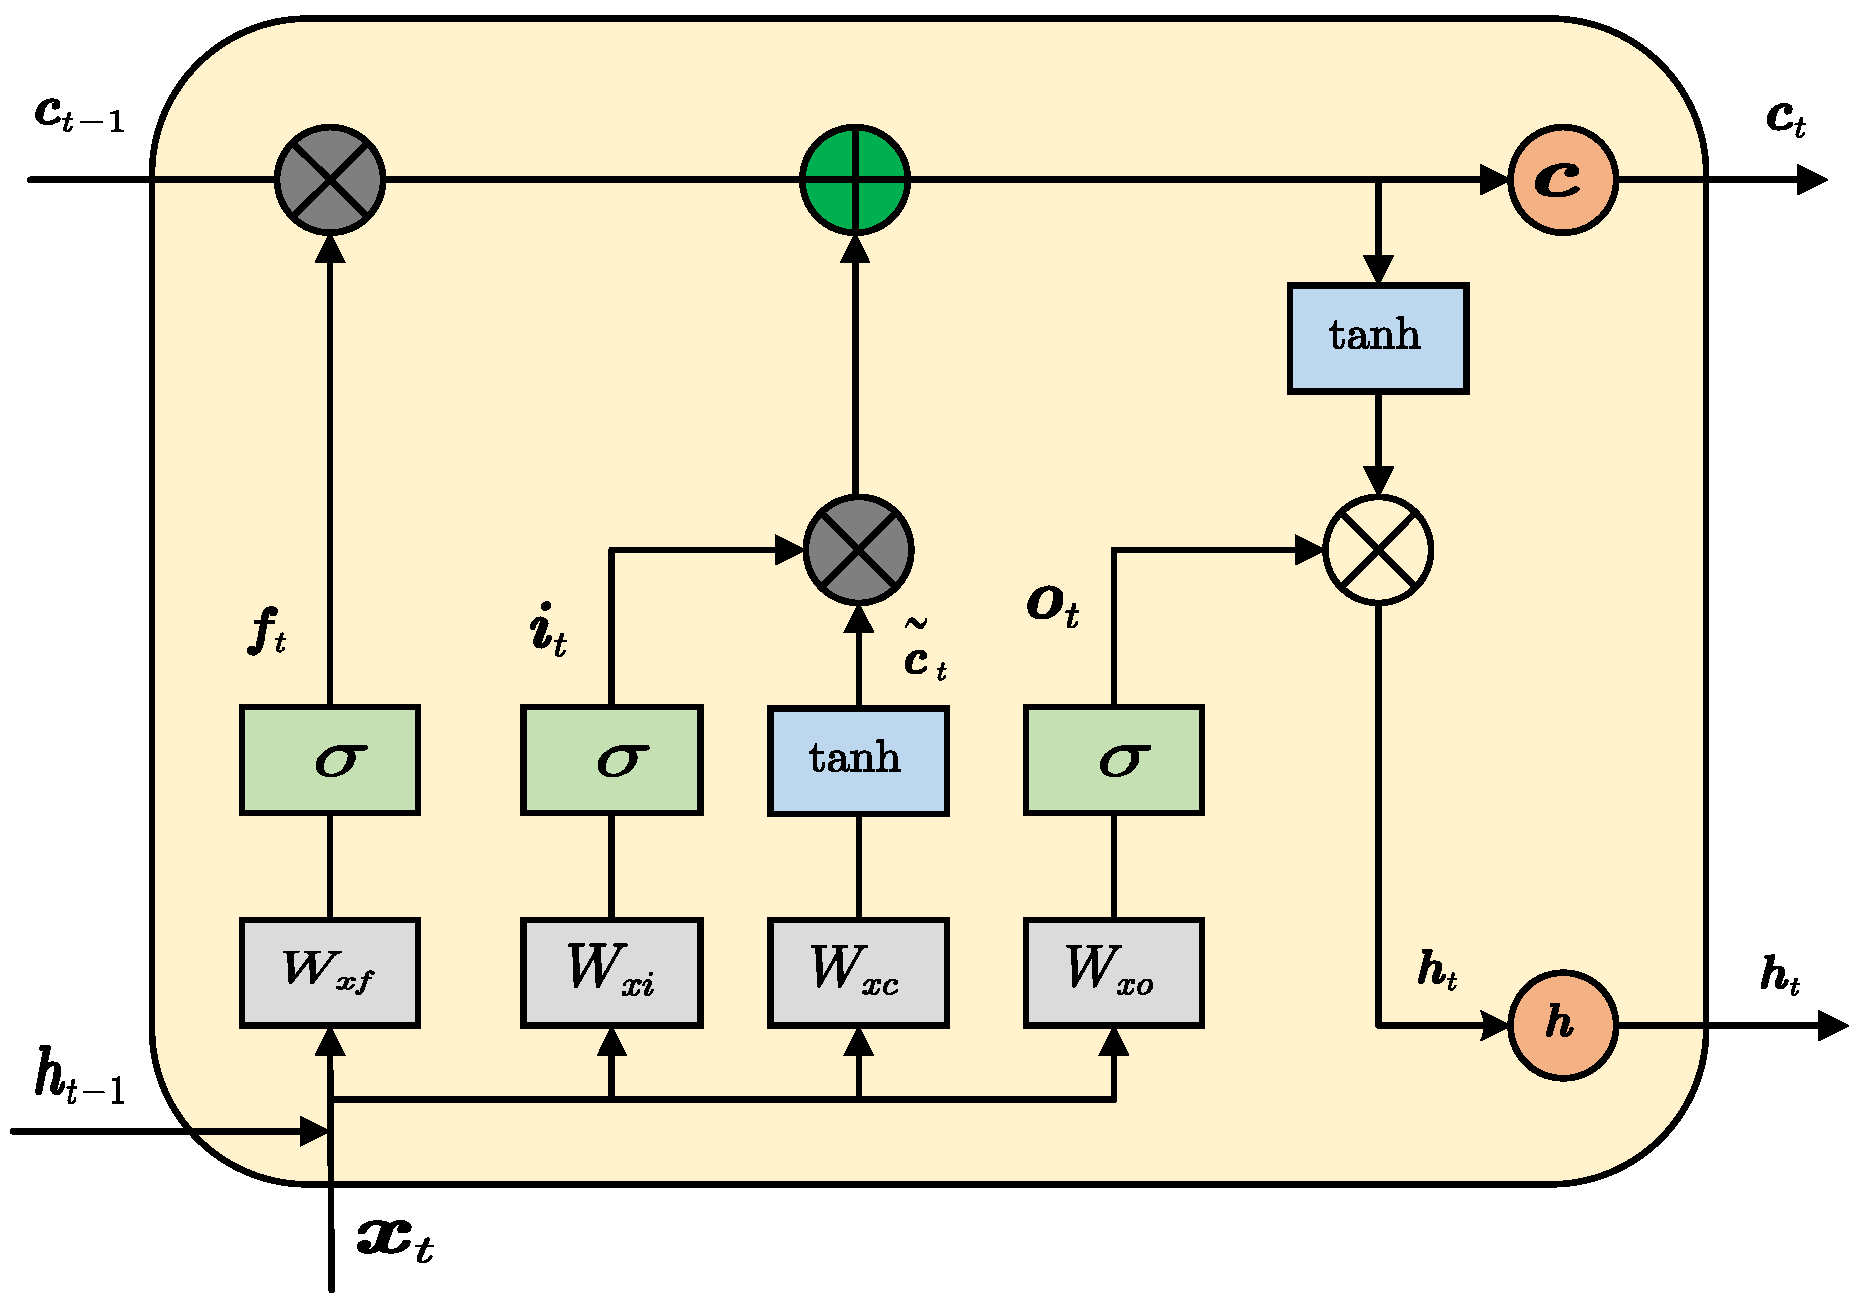
Figure 3.
LSTM network structure.
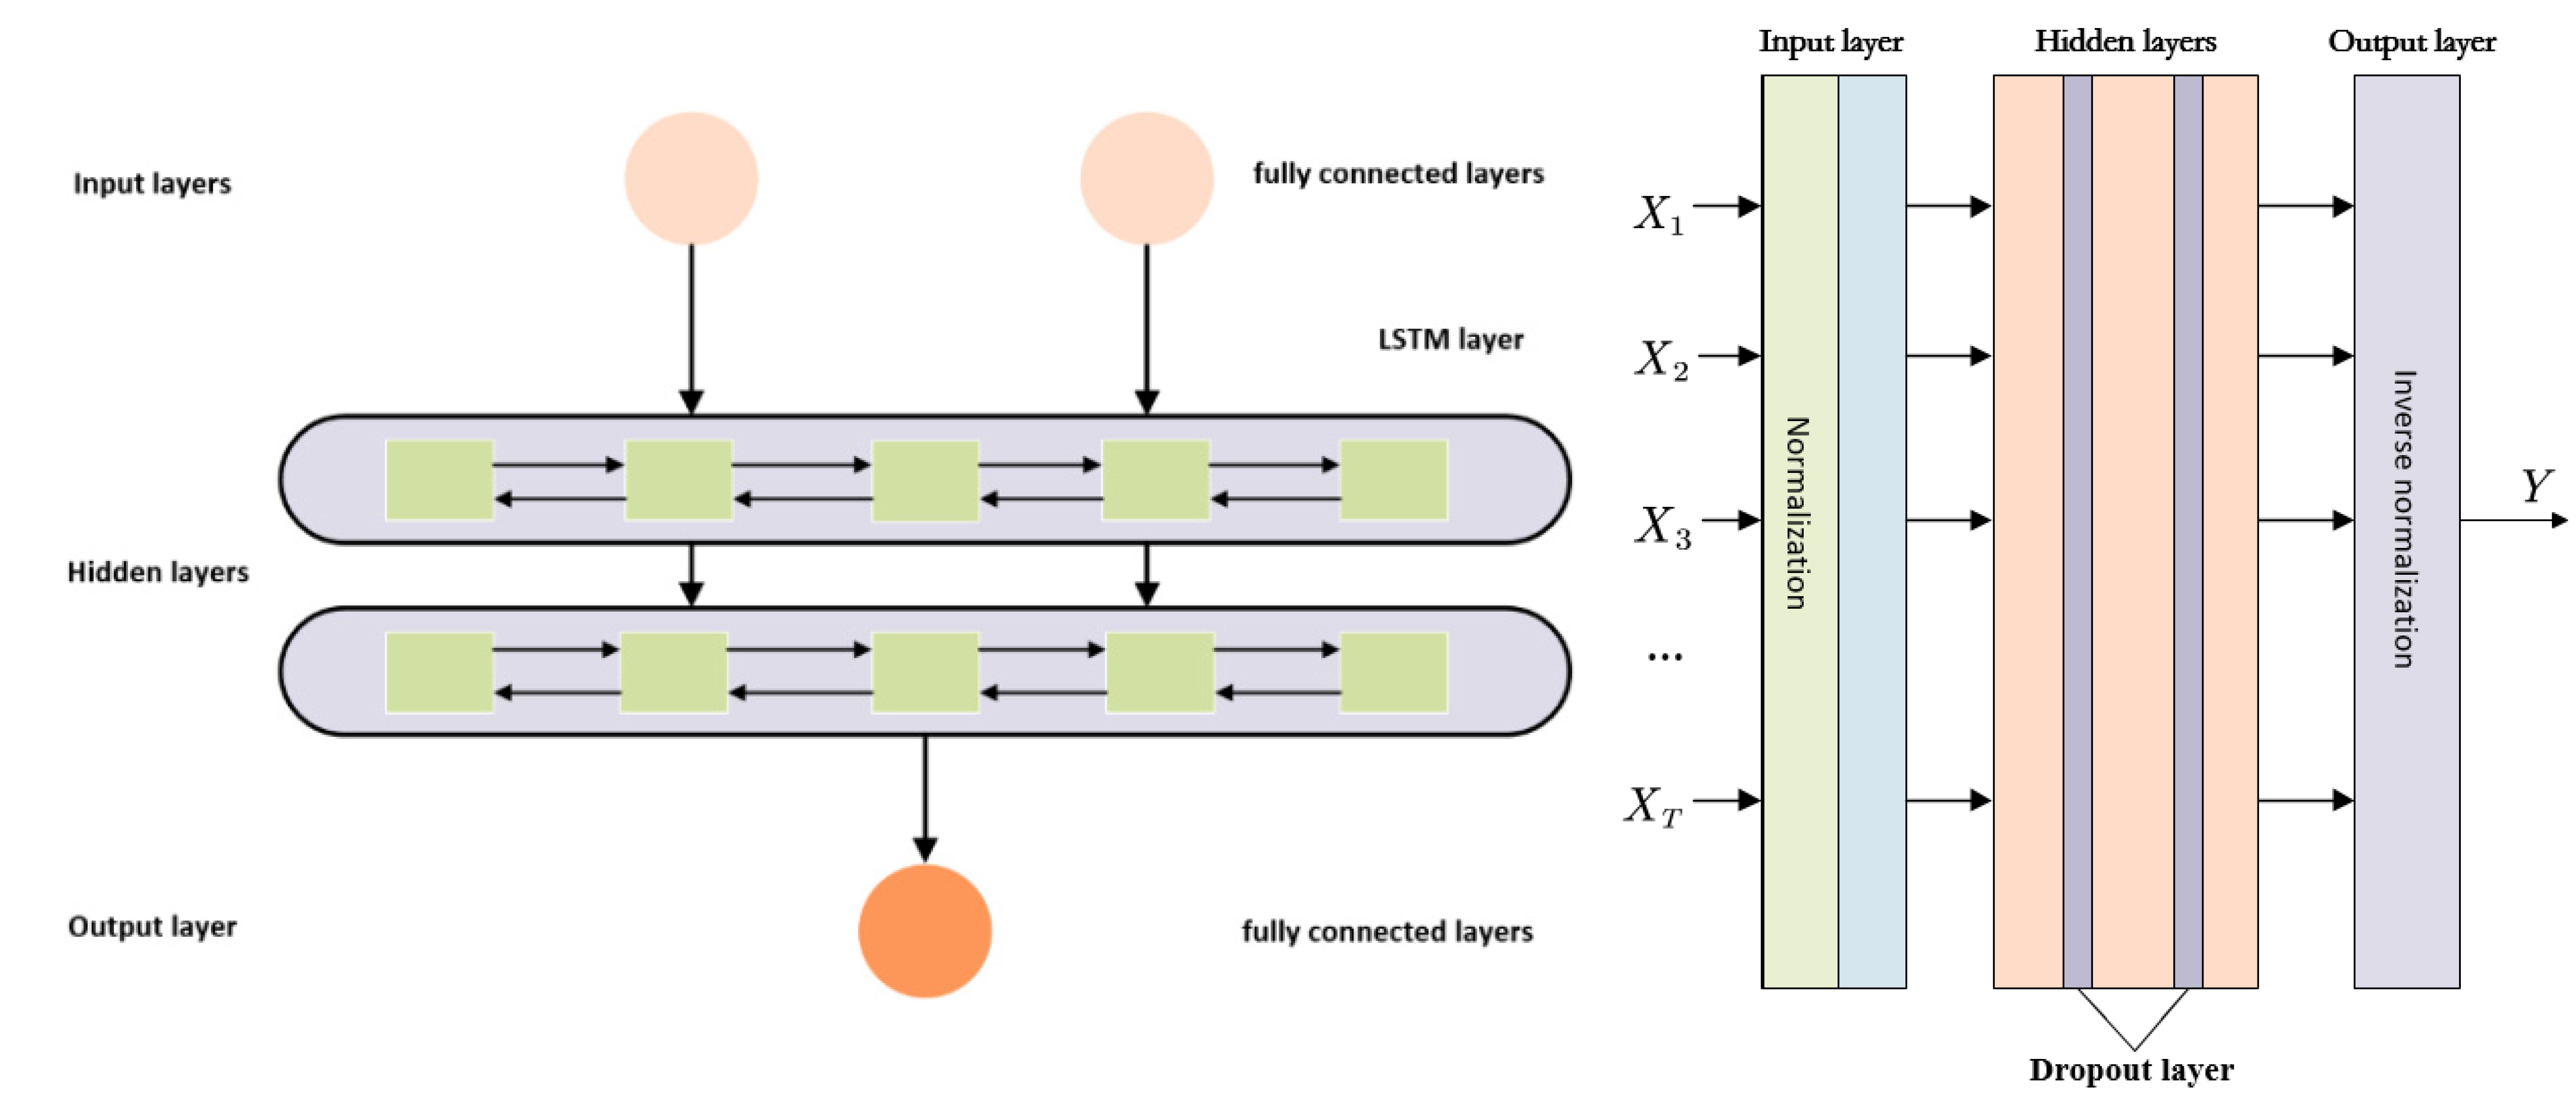
Figure 4.
IPSO optimized network parameters flow chart.

Figure 5.
Hydraulic turbine model experiments and real machine operation data.

Figure 6.
Change in the fitness of the objective function.
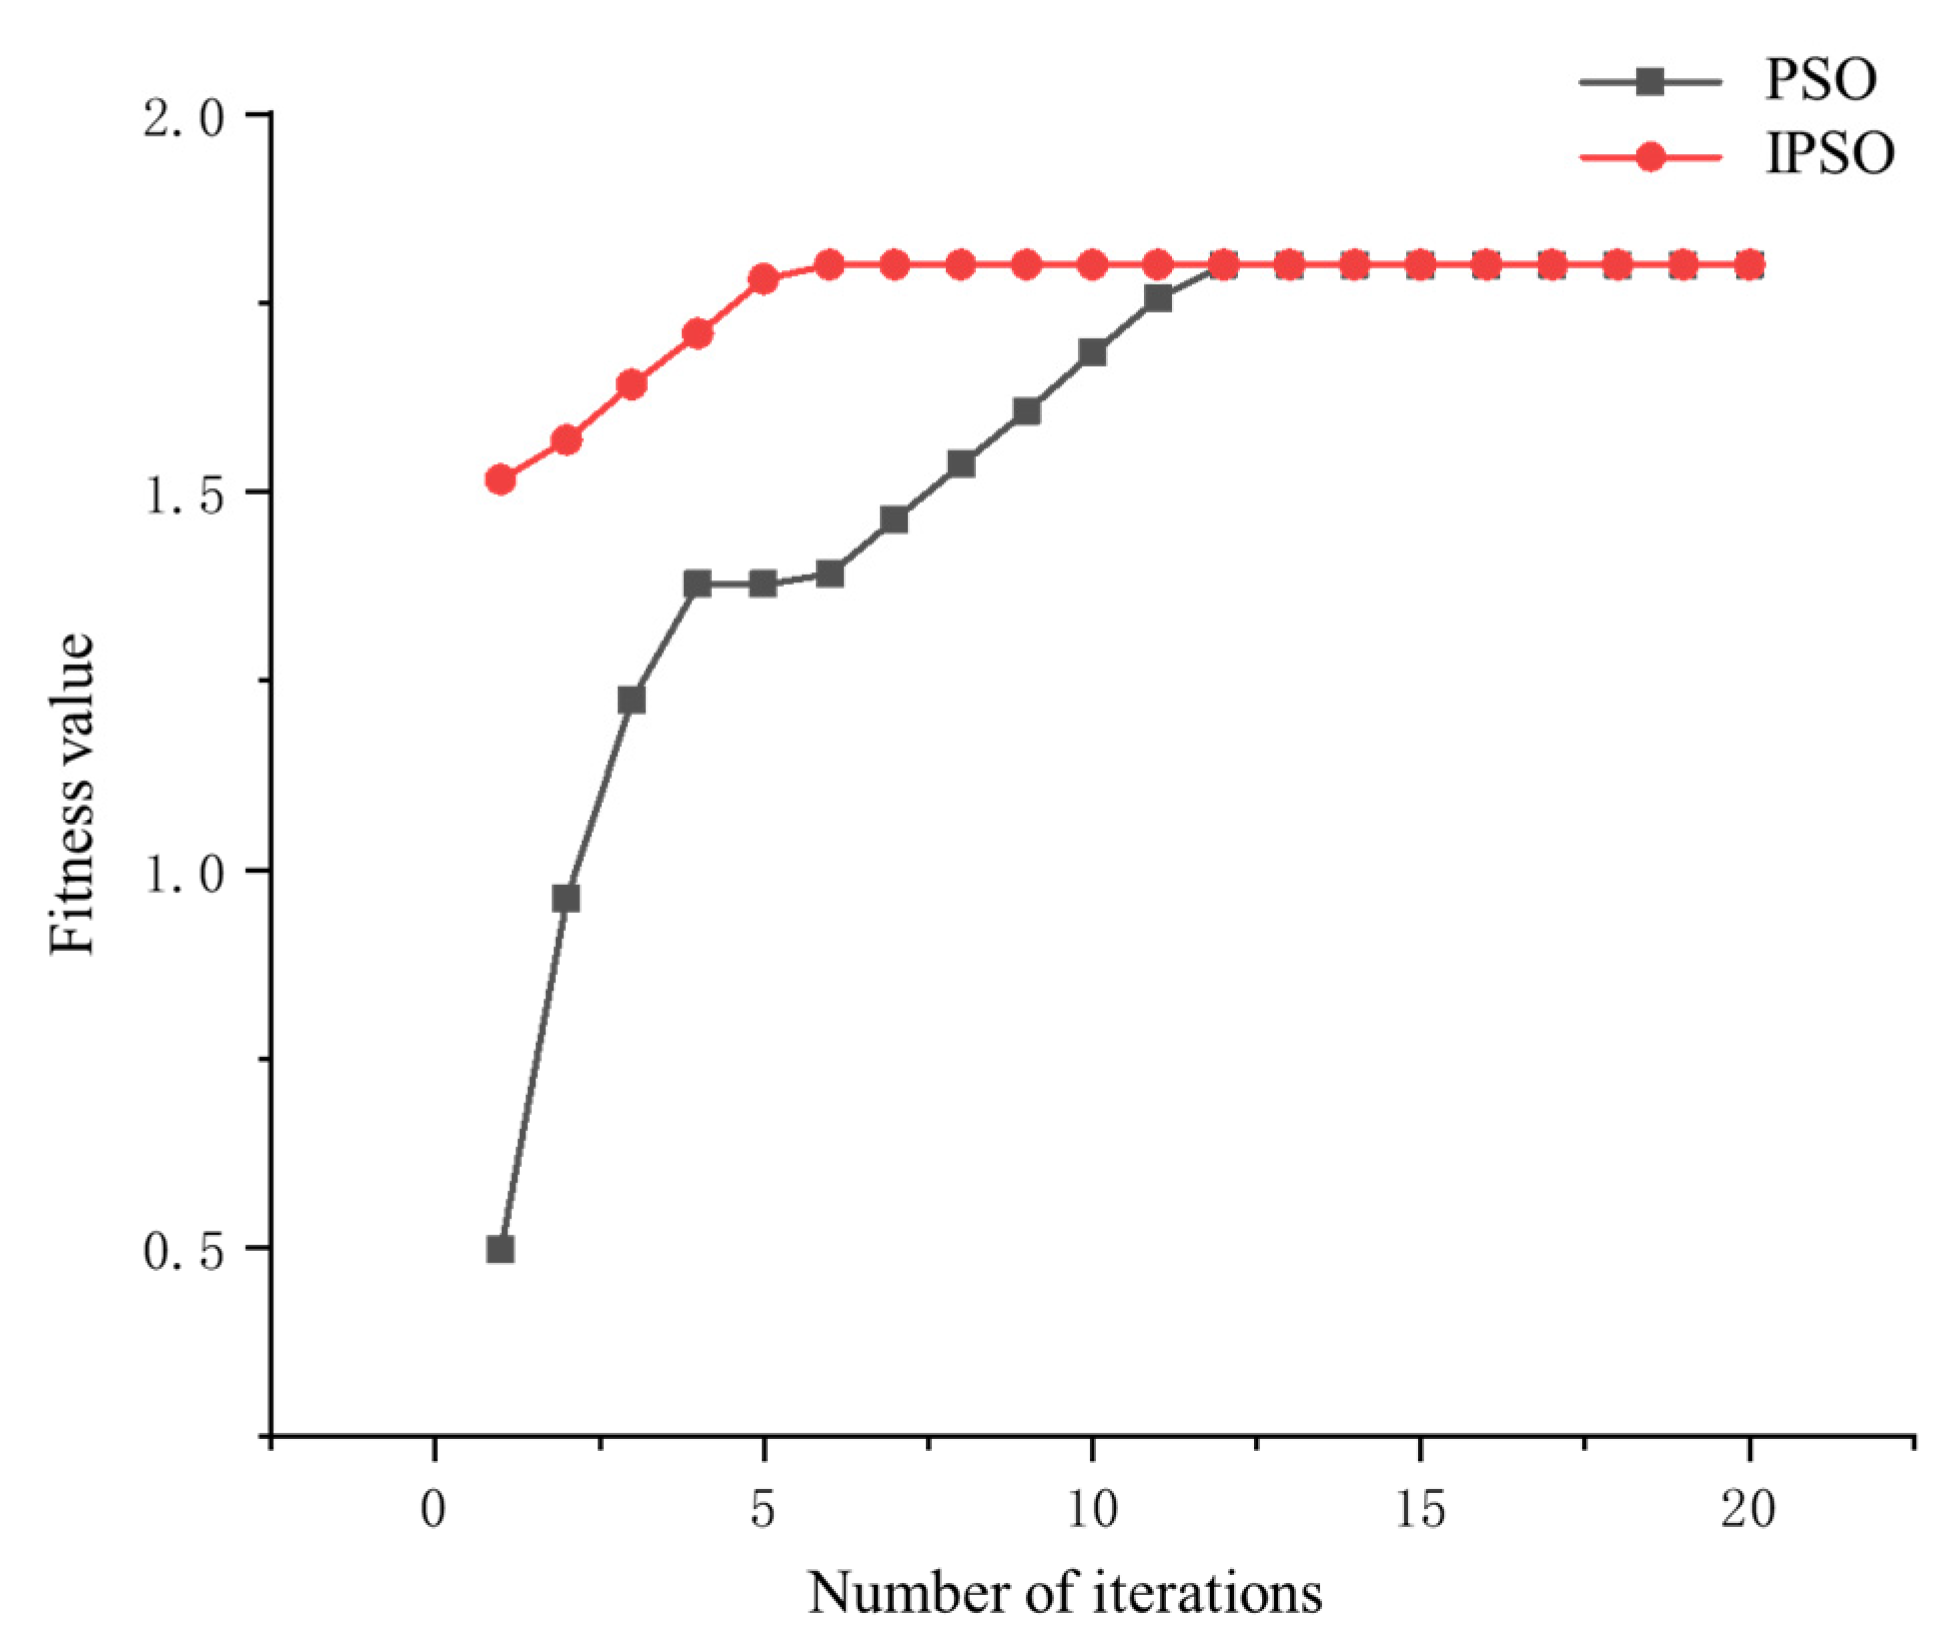
Figure 7.
Change in neuron numbers.

Figure 8.
Change in online learning rates.

Figure 9.
Change in number of network training sessions.

Figure 10.
Self-learning process.

Figure 11.
Comparison of predicted results.

Figure 12.
IPSO-LSTM fitting of turbine characteristic curves.

Table 1.
Comparison of prediction accuracy between deep and shallow networks.
| MAE | MSE | RMSE | |
|---|---|---|---|
| Single-layer | 1.09440 | 0.00076 | 0.06373 |
| Double-layer | 0.59028 | 0.00041 | 0.02752 |
Table 2.
Network structure.
| Network Layer (type) | Output Dimension |
|---|---|
| dense1 (FC) | 2 |
| lstm1 (LSTM) | |
| dropout1 (Dropout) | |
| lstm2 (LSTM) | |
| dropout2 (Dropout) | |
| dense2 (FC) | 1 |
Table 3.
Comparison of predicted results.
| Indicators | MSE | MAE | RMSE | |
|---|---|---|---|---|
| Methods | ||||
| SVM | 0.57100 | 0.5916 | 0.7556 | |
| ELM | 0.00160 | 0.0347 | 0.0400 | |
| IPSO-LSTM | 0.00086 | 0.0259 | 0.0293 | |
Publisher’s Note: MDPI stays neutral with regard to jurisdictional claims in published maps and institutional affiliations. |
© 2022 by the authors. Licensee MDPI, Basel, Switzerland. This article is an open access article distributed under the terms and conditions of the Creative Commons Attribution (CC BY) license (https://creativecommons.org/licenses/by/4.0/).
Share and Cite
MDPI and ACS Style
Pan, H.; Hang, C.; Feng, F.; Zheng, Y.; Li, F. Improved Neural Network Algorithm Based Flow Characteristic Curve Fitting for Hydraulic Turbines. Sustainability 2022, 14, 10757. https://doi.org/10.3390/su141710757
AMA Style
Pan H, Hang C, Feng F, Zheng Y, Li F. Improved Neural Network Algorithm Based Flow Characteristic Curve Fitting for Hydraulic Turbines. Sustainability. 2022; 14(17):10757. https://doi.org/10.3390/su141710757
Chicago/Turabian StylePan, Hong, Chenyang Hang, Fang Feng, Yuan Zheng, and Fang Li. 2022. "Improved Neural Network Algorithm Based Flow Characteristic Curve Fitting for Hydraulic Turbines" Sustainability 14, no. 17: 10757. https://doi.org/10.3390/su141710757
Note that from the first issue of 2016, this journal uses article numbers instead of page numbers. See further details here.