
Assessing Ground Vibration Caused by Rock Blasting in Surface Mines Using Machine-Learning Approaches: A Comparison of CART, SVR and MARS

 and
and
Abstract
:1. Introduction

| Authors | Models | Input Parameters | No. of Datasets | Best Model | Performance Indices |
|---|---|---|---|---|---|
| Ke et al. [13] | SVR, GEP, ANN-SVR, Empirical predictor | HDM, BH, HD, B, S, Hc, PF, MCPD, D | 297 | ANN-SVR | R2 = 0.887 RMSE = 1.232 |
| Nguyen and Bui [14] | HGS–ANN, GOA–ANN FA–ANN, PSO–ANN | HD, MCPD, B, PF, D, SL, S NDS, DTS | 252 | HGS– ANN | R2 = 0.922 RMSE = 1.761 |
| Singh [15] | ANN | HDM, NH, HD, B, S, SL, Hdis, Rdis | 200 | ANN | R2 = 0.83 |
| Nguyen et al. [16] | MARS, ANN, PSO–ANN, MARS-PSO–ANN, Empirical predictor | MCPD, D, HD, B, S, SL, PF | 193 | MARS-PSO–ANN | R2 = 0.902 RMSE = 1.569 |
| Singh et al. [17] | ANFIS, MVRA | MCPD, D | 192 | ANFIS | R2 = 0.98 |
| Lawal et al. [18] | ANN, BK, GEP, MLR | S/B, BH/B, B/HDM, SL/B, SD/B, UCS, ρr, MCPD, D | 191 | ANN | R2 = 0.948 RMSE = 0.0008 |
| Singh and Verma [19] | ANFIS | B, S, D, IS, TC | 187 | ANFIS | R2 = 0.77 |
| Monjezi et al. [20] | ANN | HD, T, MCPD, D | 182 | ANN | R2 = 0.949 (ANN) |
| Khandelwal and Singh [21] | ANN, MVRA | HD, S, D, E, P-wave, B, MCPD, BI, µ, VOD | 174 | ANN | R2 = 0.98 |
| Khandelwal [22] | SVM, MVRA, Empirical predictor | MCPD, D | 174 | SVM | R2 = 0.96, MAE = 0.257 |
| Khandelwal and Singh [23] | ANN | TC, D | 170 | ANN | R2 = 0.998 |
| Monjezi et al. [24] | MLPNN, RBFNN, GRNN | D, B/S, MCPD, NHPD, UCS, DPR | 169 | MLPNN | R2 = 0.954, RMSE = 0.03 |
| Yu et al. [25] | ELM, HHO–ELM, GOA–ELM, | D, HD, B/S, MCPD, PF | 166 | GOA–ELM | R2 = 0.9105 RMSE = 2.855 |
| Mohamed [26] | FS, ANN, MVRA | D, MCPD | 162 | FS | RMSE = 0.17 VAF = 87(%) |
| Bayat et al. [1] | GEP | B, S, T, D, MCPD | 154 | GEP | R2 = 0.91 RMSE = 5.78 |
| Khandelwal and Kumar [27] | ANN, Empirical predictor | MCPD, D | 150 | ANN | R2 = 0.919, RMSE = 0.352 |
| Singh et al. [28] | GA, MVRA, ANN, ANFIS, SVM | UCS, ρr, Hc, ɳ, ABS, FRC | 150 | GA | MAPE = 0.198 |
| Zhou et al. [29] | RF, ANN, XGBoost, AdaBoost, Bagging, Jaya-X-GBoost Empirical predictor | HDM, HD, CPH, S, B, CL, BI, E, D, µ, P-wave, VOD, ρe | 150 | Jaya-XGBoost | R2 = 0.957 RMSE = 4.088 |
| Mohamed [30] | ANN | P-wave, HDM, VOD, B, S, BH, HI, D, ρe, ρr, MCPD, E, TC, ɳ, UCS, | 149 | ANN | R2 = 0.94, MSE = 0.00920 |
| Rana et al. [31] | CART, ANN, MVRA, Empirical predictor | TC, TS, MCPD, NH, HDM, D, HD, CPH | 137 | CART | R2 = 0.95, RMSE = 1.56 |
| Verma and Singh [32] | SVM, ANN, MVRA | HD, B, S, T, MCPD, TC, D | 137 | SVM | MAPE = 0.001 |
| Verma and Singh [33] | GA, ANN, MVRA, Empirical predictor | HD, B, S, T, MCPD, TC | 127 | GA | R2 = 0.99, MAPE = 0.088 |
| Ghasemi et al. [34] | FS, MRA, Empirical predictor | B, S, T, NHPD | 120 | FS | R2 = 0.945, RMSE = 2.73 |
| Ghasemi et al. [35] | ANFIS-PSO, SVR | B, S, T, NH, MCPD, D | 120 | ANFIS-PSO | R2 = 0.957, RMSE = 1.83 |
| Bui et al. [36] | ANN, SVM, Tree-based ensembles, CSO–ANN Empirical predictor | MCPD, CPH, D, B, S, PF | 118 | CSO–ANN | R2 = 0.99 RMSE = 0.246 |
| Dehghani and Ataee-pour [37] | ANN, Empirical predictor, Dimensional analysis | S, B, DPR, NH, PF, D, CPD, MCPD, PLI | 116 | ANN | R2 = 0.945, RMSE = 0.0245 |
| Zhongya [38] | BPNN, MVRA, ELM- FA MIV | D, MCPD, B/S, NHPD, UCS, DPR | 108 | ELM-FA MIV | R2 = 0.96, RMSE =0.21 |
| Armaghani et al. [39] | MPMR, LSSVM, GPR PSO–ELM, AGPSO–ELM | B/S, MCPD, D, T, PF, HD | 102 | AGPSO–ELM | R2 = 0.90 RMSE = 0.08 |
| Faradonbeh et al. [40] | GEP, NLMR | T, B/S, PF, D, HD, MCPD | 102 | GEP | R2 = 0.874 |
| Mokfi et al. [41] | GMDH, GEP, NLMR | MCPD, PF, T, B/S, D, HD | 102 | GMDH | R2 = 0.874, RMSE = 0.963 |
| Ismail et al. [42] | GEP, ANFIS, SCA-ANN Empirical predictor | D, MCPD, ρr, SRH | 100 | SCA-ANN | R2 = 0.999 RMSE = 0.0094 |
| Hajihassani et al. [43] | ICA-ANN, ANN, MLR | B/S, T, MCPD, P-wave, E, D | 95 | ICA-ANN | R2 = 0.97 |
| Chen et al. [44] | FA–SVR, PSO–SVR, GA–SVR, FA–ANN, PSO–ANN, GA–ANN, MFA–SVR | B/S, T, MCPD, D, E, P-wave | 95 | MFA–SVR | R2 = 0.984 RMSE = 0.614 |
| Peng et al. [45] | ANN, ANN-PSO, ANN-GA, ANN | MCPD, D, PF, SD, RQD, B, S | 93 | ANN-PSO | R = 0.945 RMSE = 0.680 |
| Hasanipanah et al. [46] | CART, MLR, Empirical predictor | MCPD, D | 86 | CART | R2 = 0.95, RMSE = 0.17 |
| Hudaverdi and Akyildiz [47] | ANN, MLR Empirical predictor | MCPD, D, B, S | 86 | ANN | RMSE = 5.28 |
| Zhu et al. [48] | ANN, ANFIS, RANFIS CRANFIS, CRANFIS-PSO, Empirical predictor | B, S, T, PF, MCPD, D | 84 | CRANFIS-PSO | R2 = 0.997 RMSE = 0.076 |
| Shahnazar et al. [49] | PSO-ANFIS, ANFIS | D, MCPD | 81 | ANFIS-PSO | R2 = 0.984, RMSE = 0.4835 |
| Hasanipanah et al. [50] | SVM, Empirical predictor | MCPD, D | 80 | SVM | R2 = 0.96, RMSE = 0.34 |
| Abbaszadeh Shahri et al. [51] | GFFN-FA, GFFN-ICA, GFFN | B, S, TC, D, MCPD | 78 | GFFN-FMA | R2 = 0.97 RMSE = 0.187 |
| Saadat et al. [52] | ANN, Empirical predictor | MCPD, D, SL, HD | 69 | ANN | R2 = 0.95, RMSE = 8.79 |
| Álvarez-Vigil et al. [53] | ANN, MLR | RMR, BCPRA, D, HDM, S, HD, B, MCPD, VOD, TC, NH | 60 | ANN | R2 = 0.96, RMSE = 0.65 |
| Lawal et al. [3] | ANN, GEP, MFO-ANN, MLR, Empirical predictor | HD, CPD, NH, TC, D, RMR | 56 | MFO-ANN | R2 = 0.957 MSE = 0.0008 |
| Amini et al. [54] | ANN | D, ρe Ve, B, S, TC | 51 | ANN | R2 = 0.96 |
| [55] | CART, MR, Empirical predictor | MCPD, D | 51 | CART | R2 = 0.92, RMSE = 0.97 |
| Iphar et al. [56] | ANFIS, MLR | MCPD, D | 44 | ANFIS | R2 = 0.98, RMSE = 0.80 |
| Armaghani et al. [57] | BP-ANN, PSO–ANN | HDM, HD, MCPD, S, B, SL, PF, ρr, SD, NR | 44 | PSO–ANN | R2 = 0.93 |
| Lapčević et al. [58] | ANN | CPH, DT, MCPD, TC, D | 42 | ANN | R2 = 0.95 |
| Mohamadnejad et al. [59] | SVM, GRNN, Empirical predictor | MCPD, D | 37 | SVM | R2 = 0.89, RMSE = 1.62 |
| Monjezi et al. [60] | GEP, MLR, NLMR | D, MCPD | 35 | GEP | R2 = 0.918, RMSE = 2.321 |
| Li et al. [61] | SVM, Empirical predictor | MCPD, D | 32 | SVM | R2 = 0.945 |
| Ravilic et al. [62] | MCPD, D, TC | ANN, Empirical predictor | 32 | ANN | R2 = 0.9 RMSE = 0.018 |
| Monjezi et al. [12] | ANN, Empirical predictor | TC, MCPD, D | 20 | ANN | R2 = 0.924, RMSE = 0.071 |
| Ragam and Nimaje [63] | GRNN, Empirical predictor | D, MCPD | 14 | GRNN | R2 = 0.999, RMSE = 0.0001 |
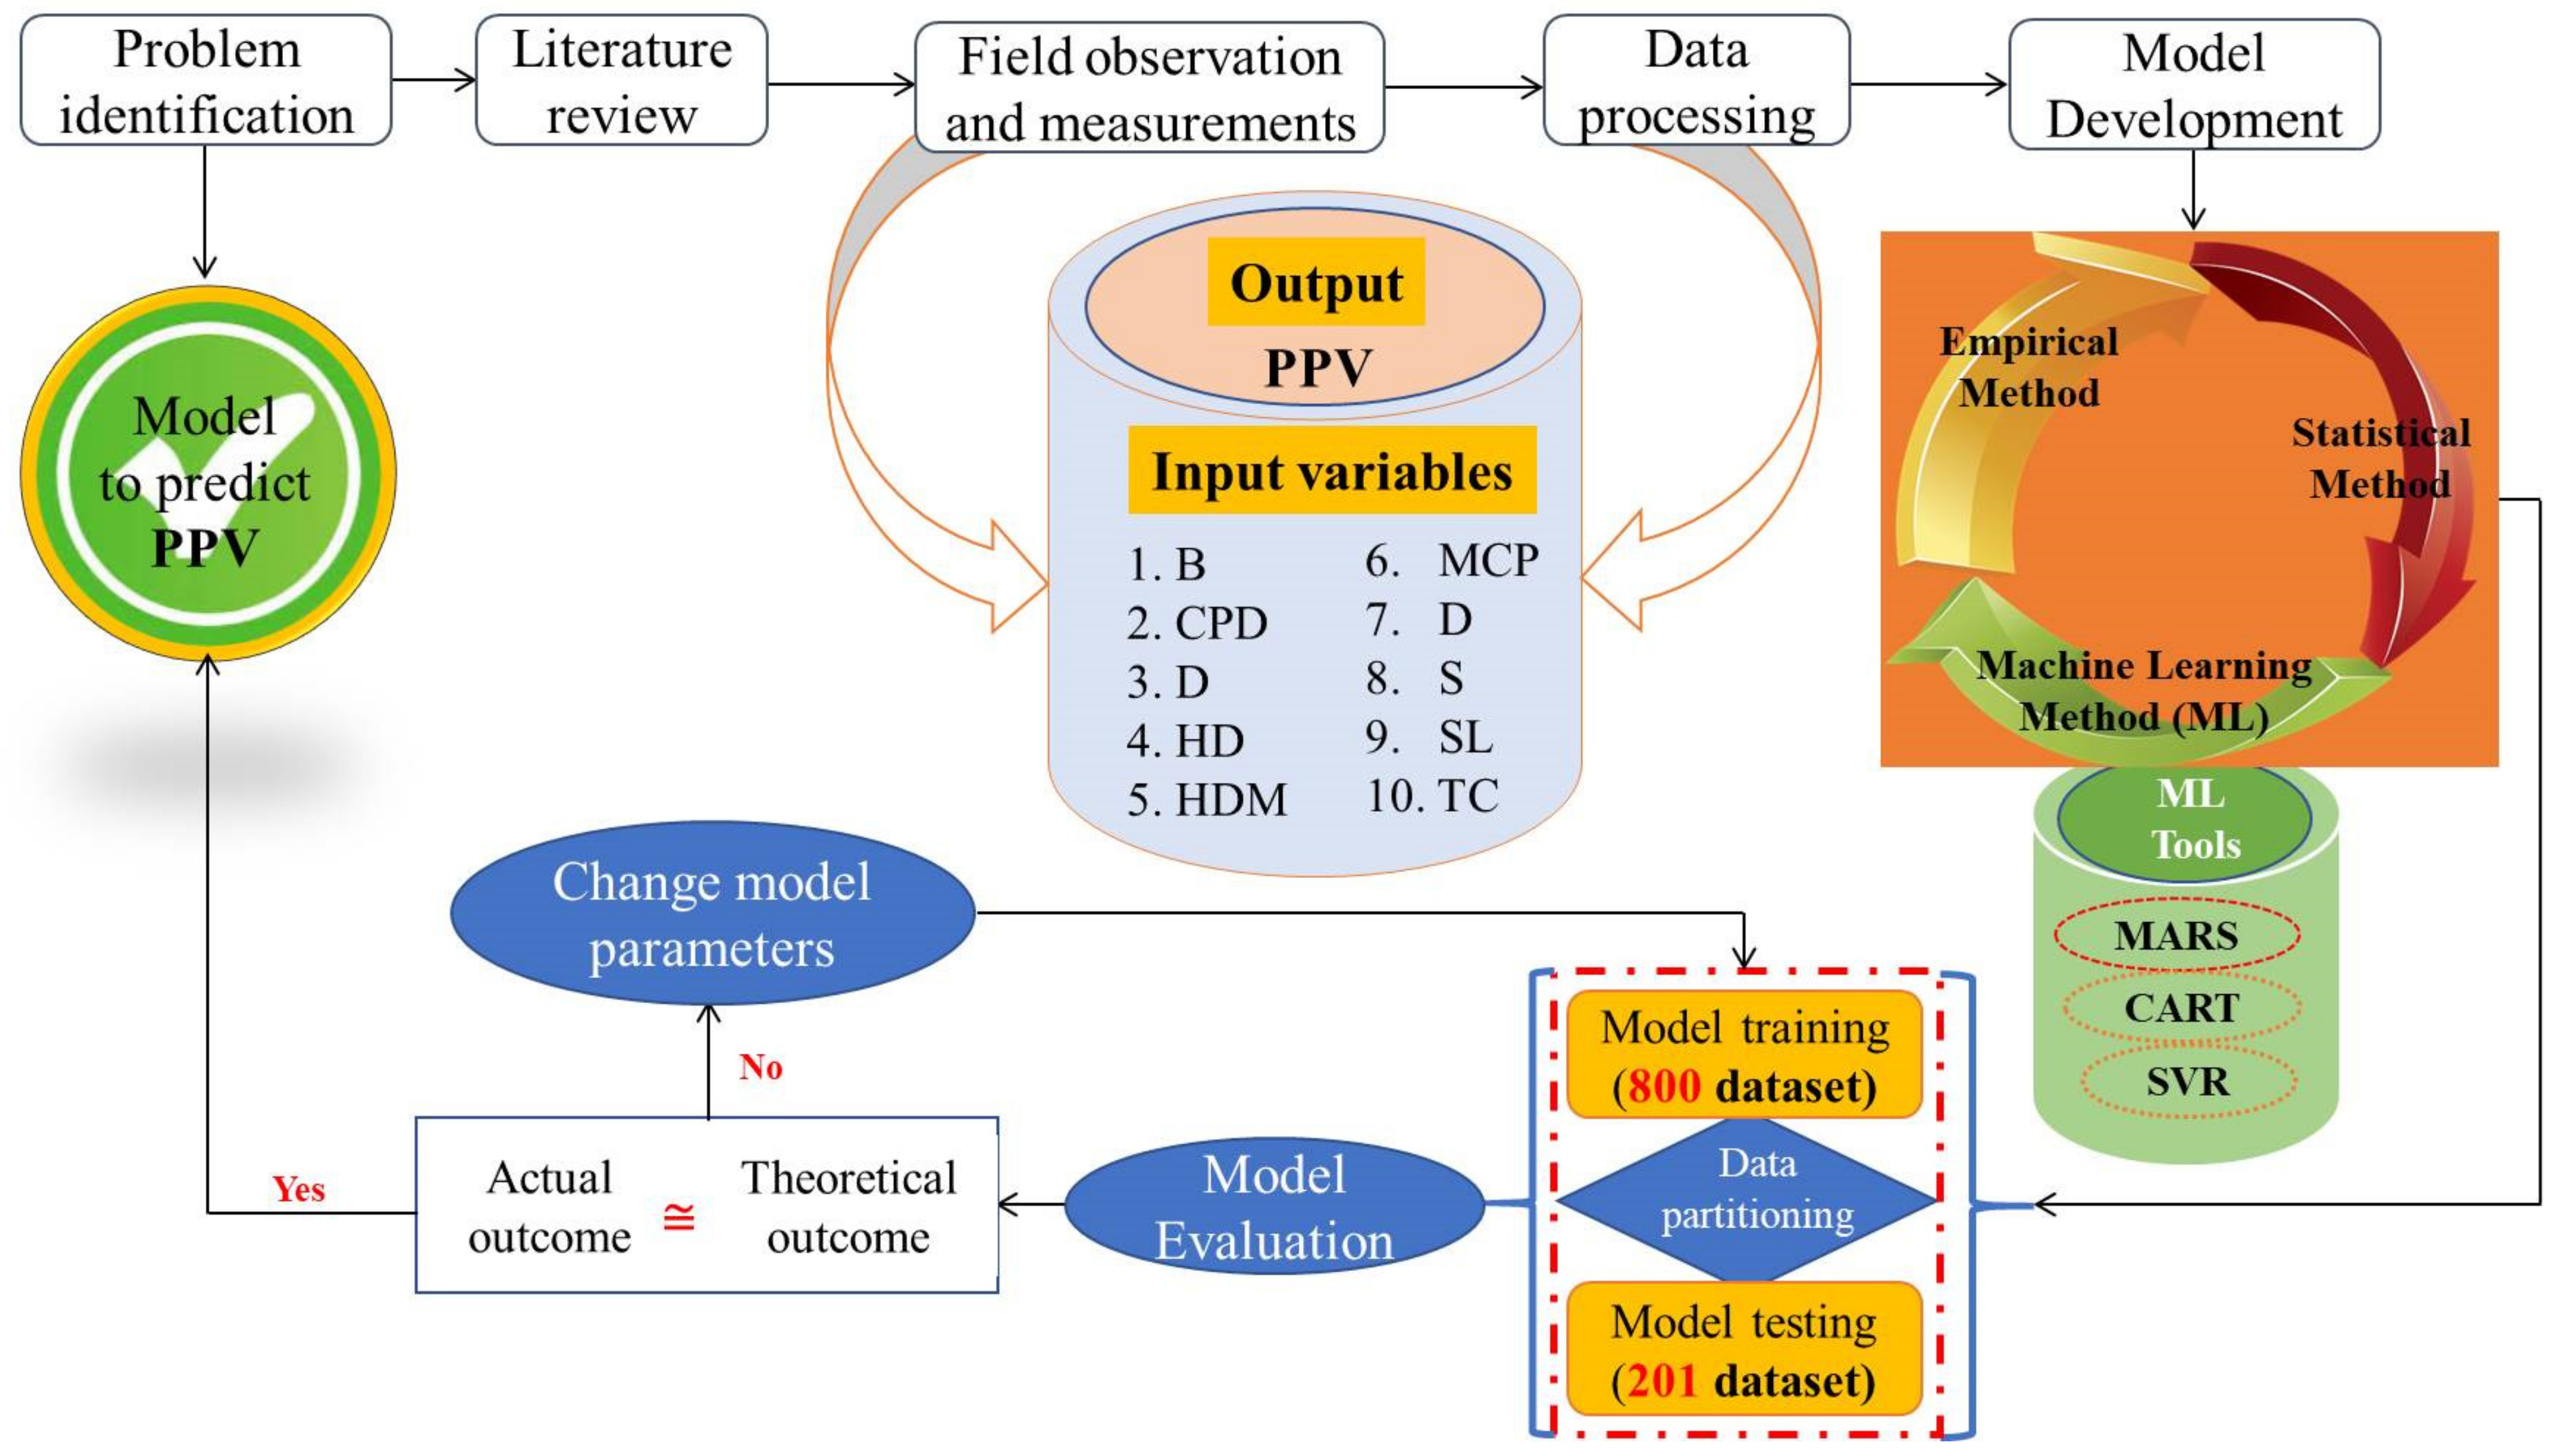
2. Materials and Methods
2.1. Materials
2.2. Methods
2.2.1. Empirical Methods
2.2.2. Multiple Linear Regression (MLR)
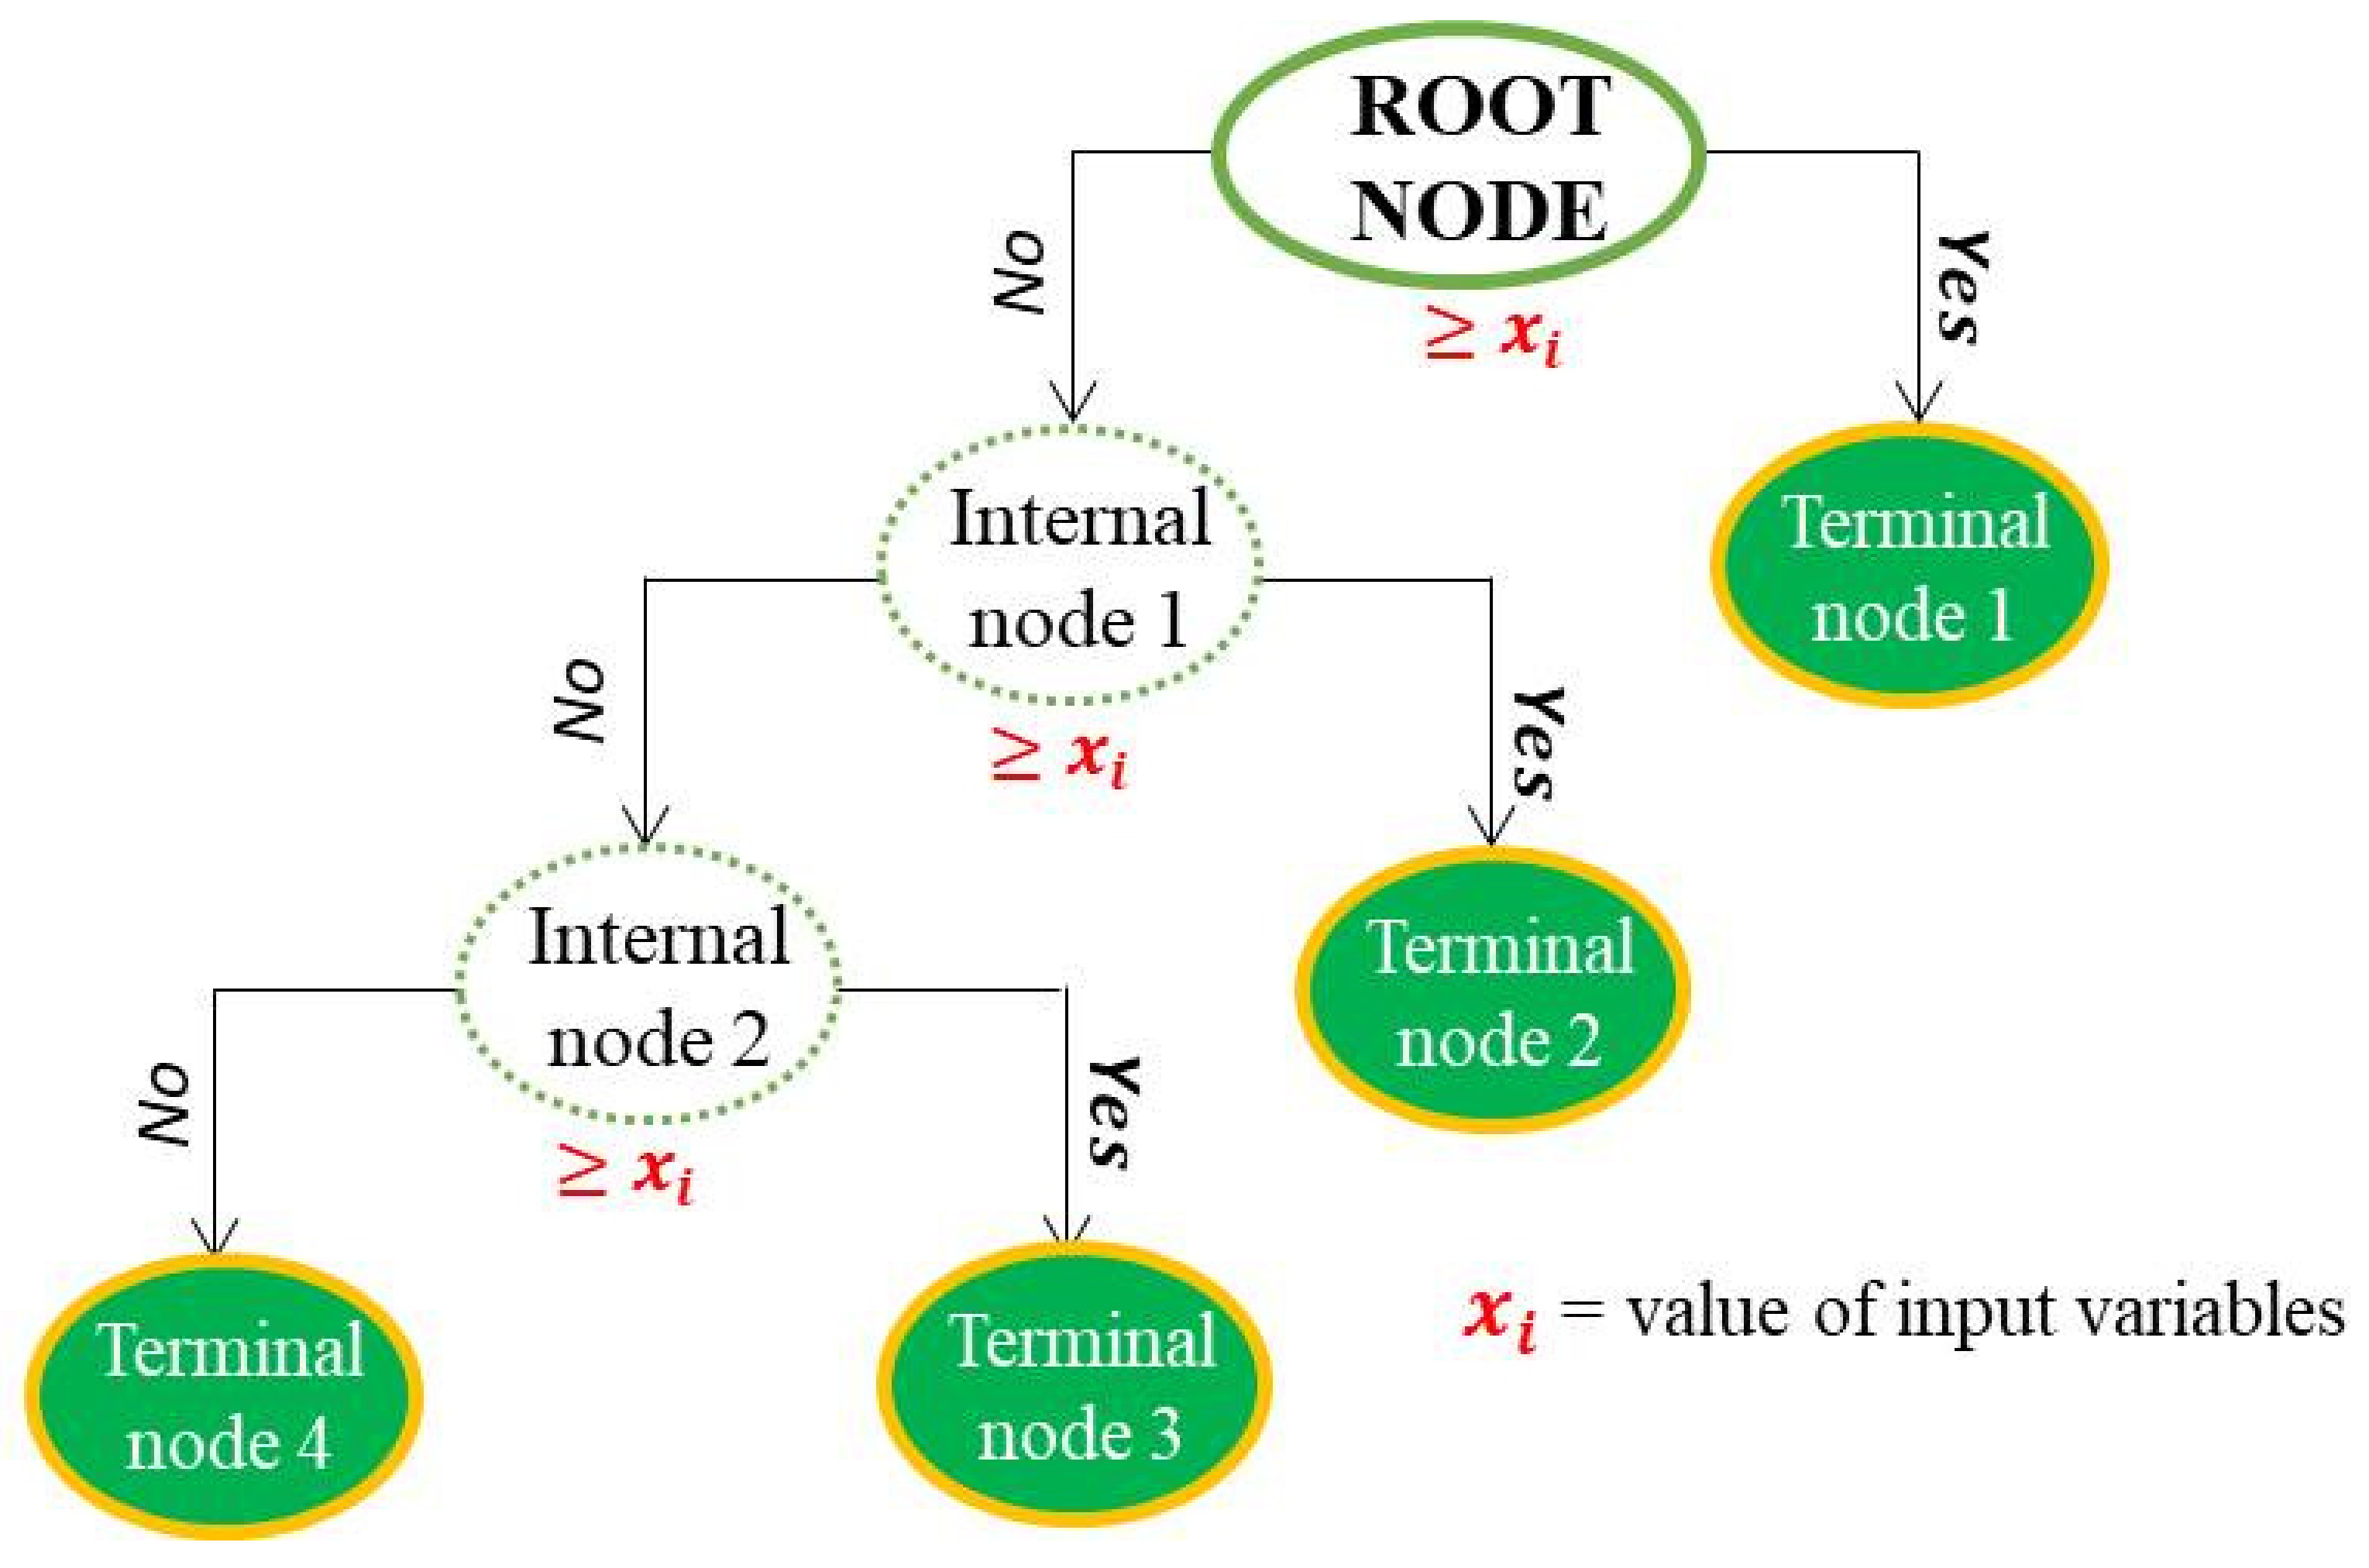
2.2.3. Classification and Regression Tree (CART)
2.2.4. Support Vector Regression (SVR)
2.2.5. Multivariate Adaptive Regression Splines (MARS)
3. Results
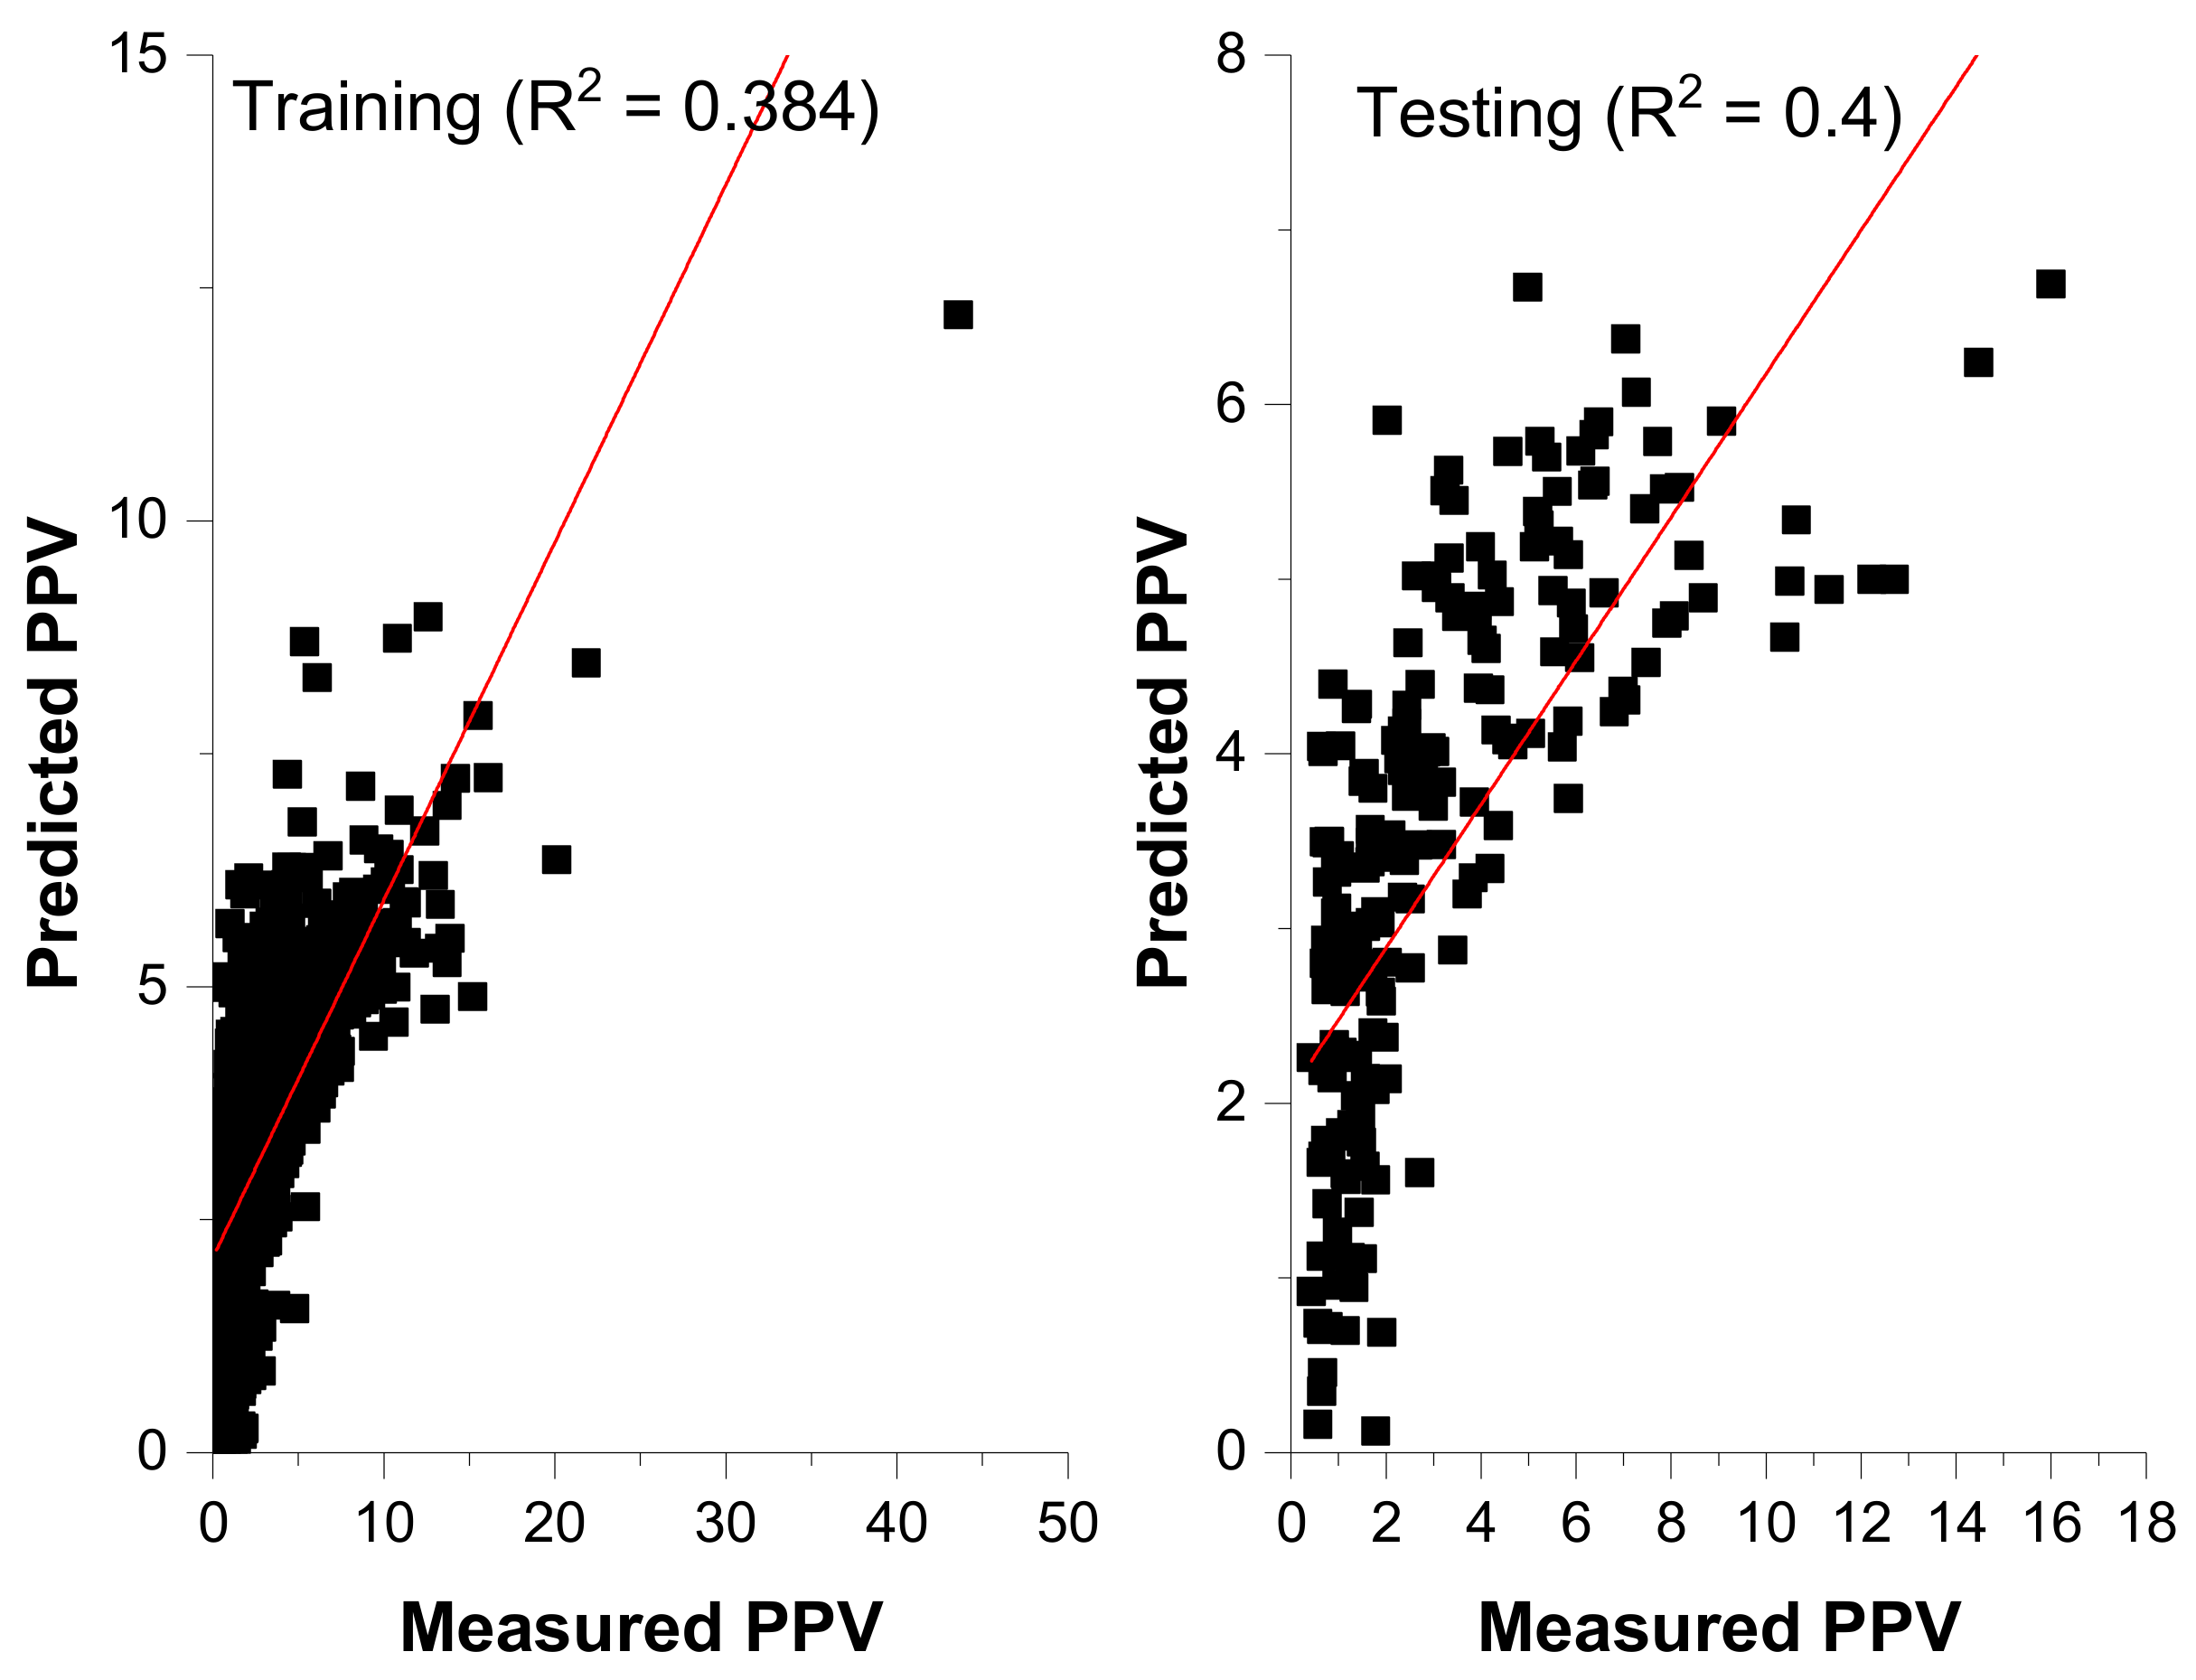
3.1. MLR
− 0.01635 × CPH + 0.0003 × TC − 0.000019 × MCPD − 0.011698 × D
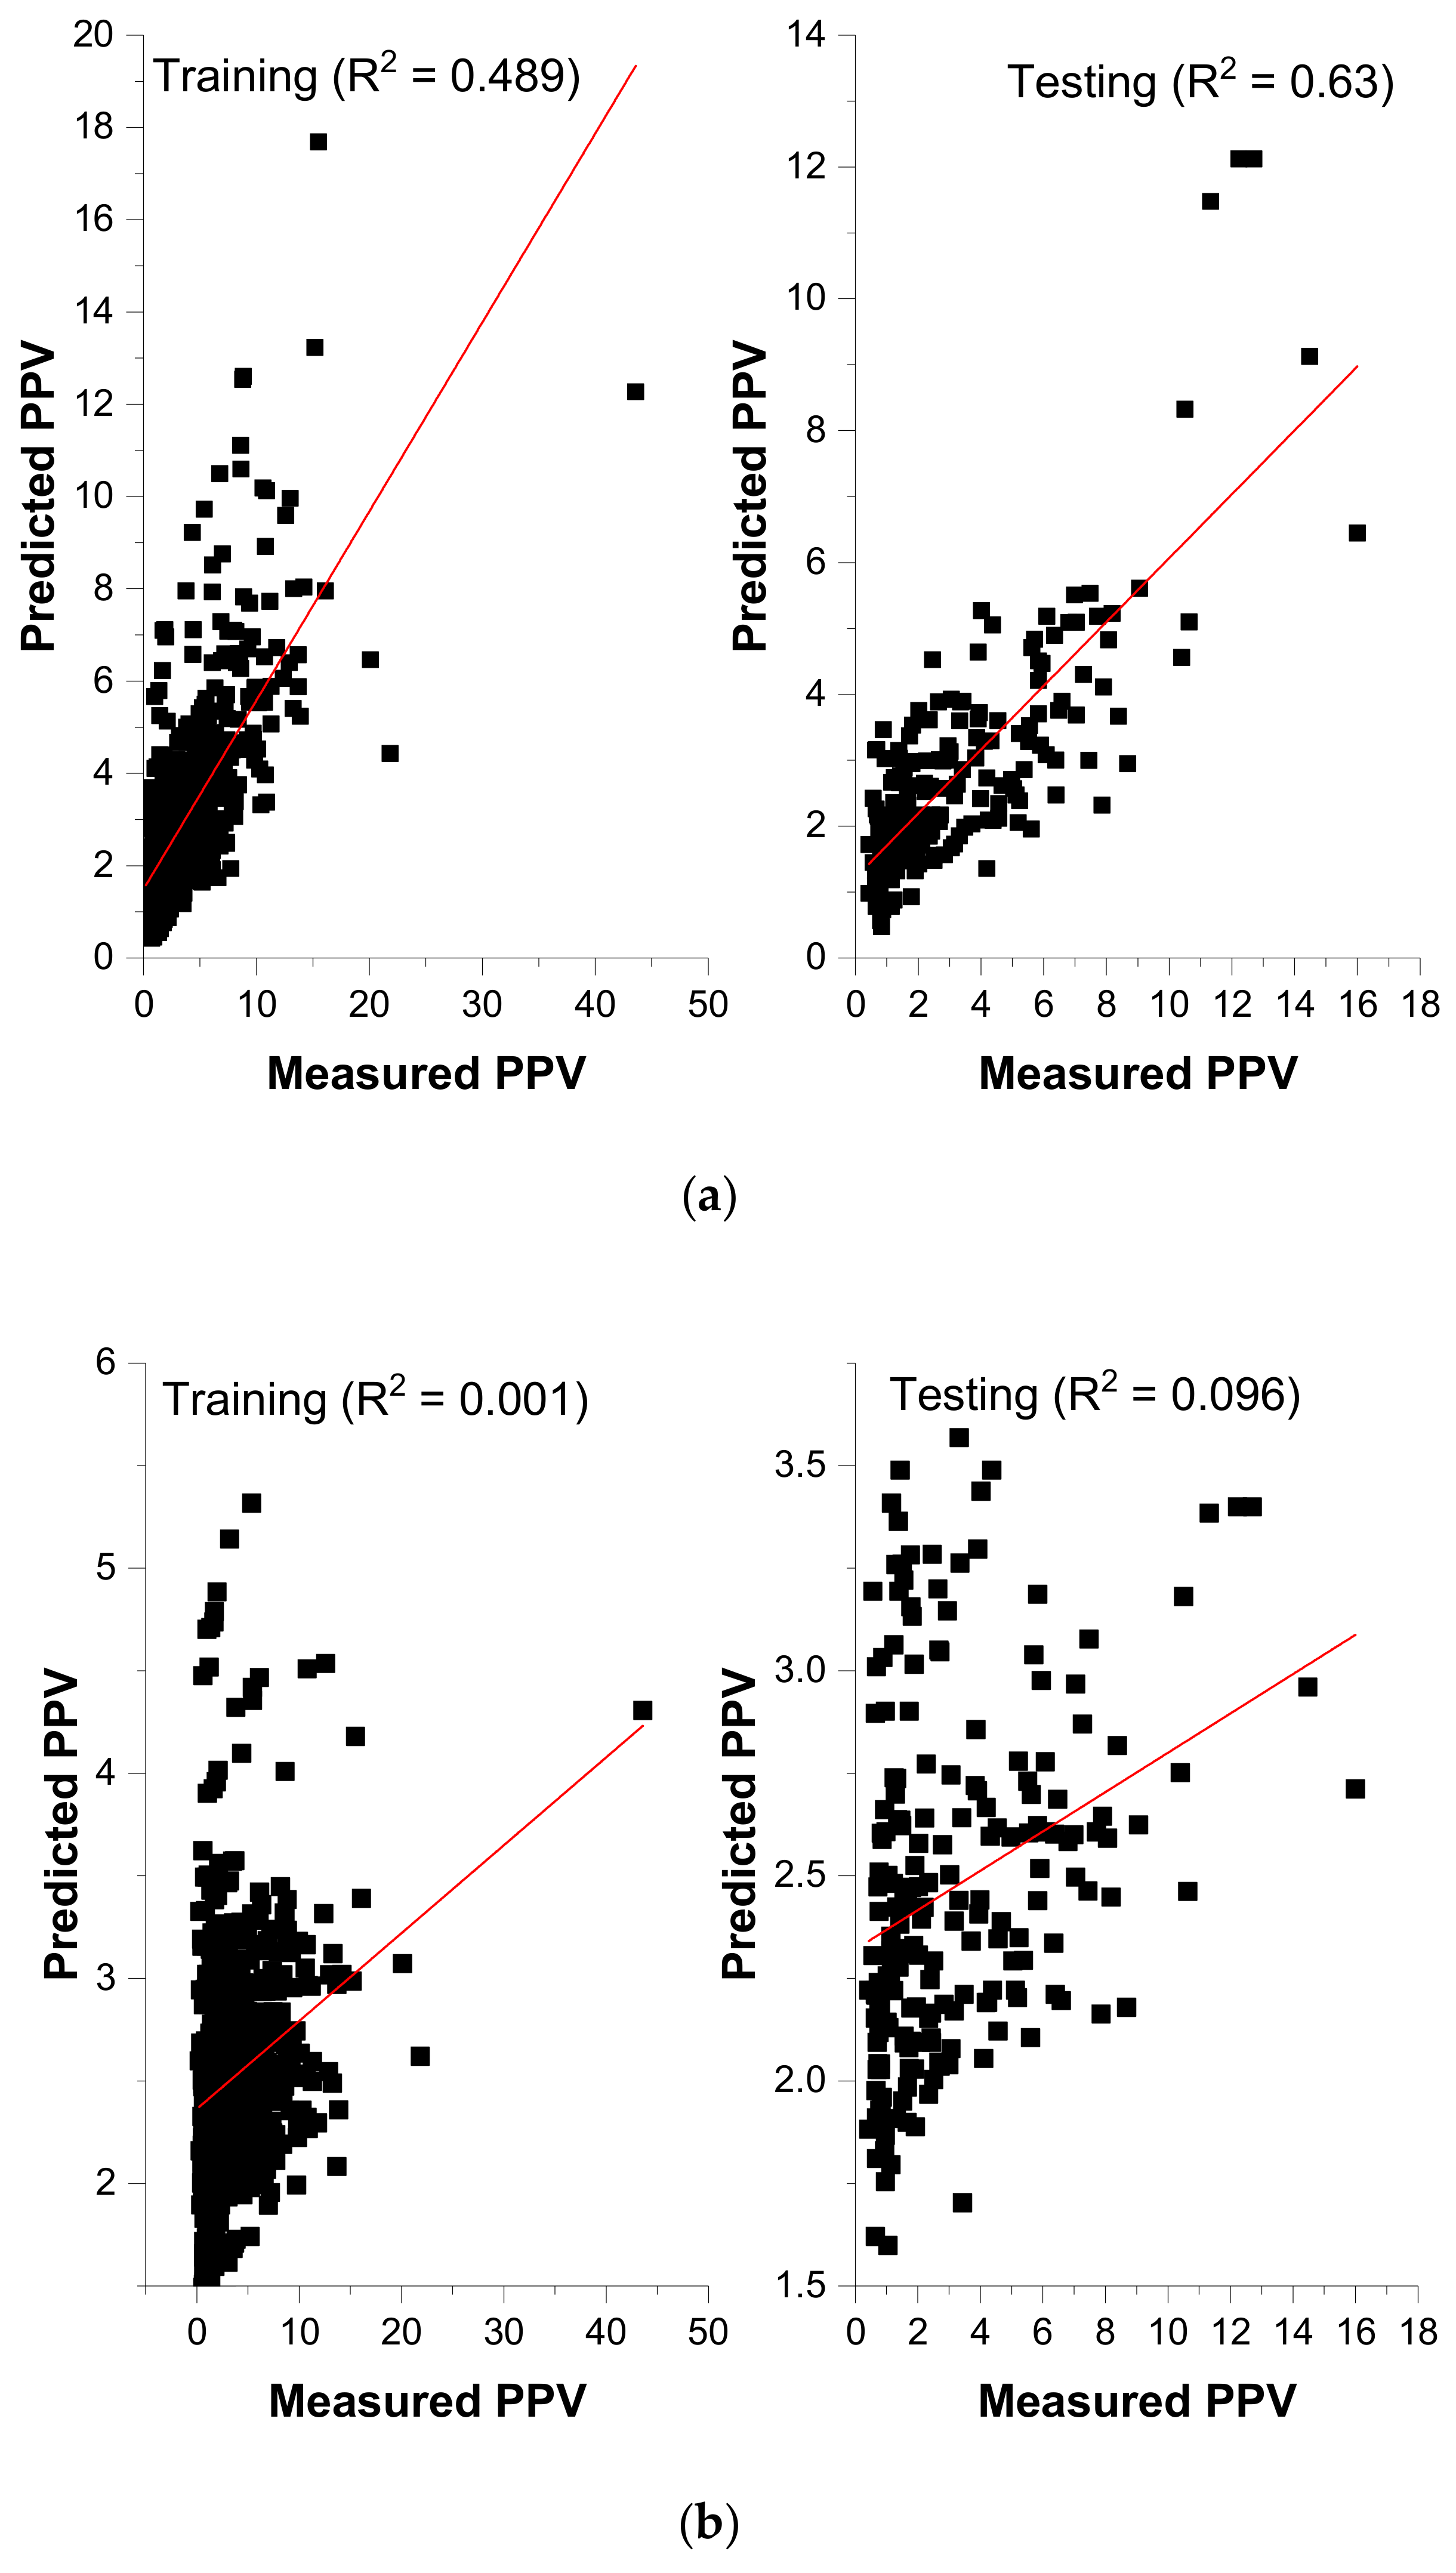
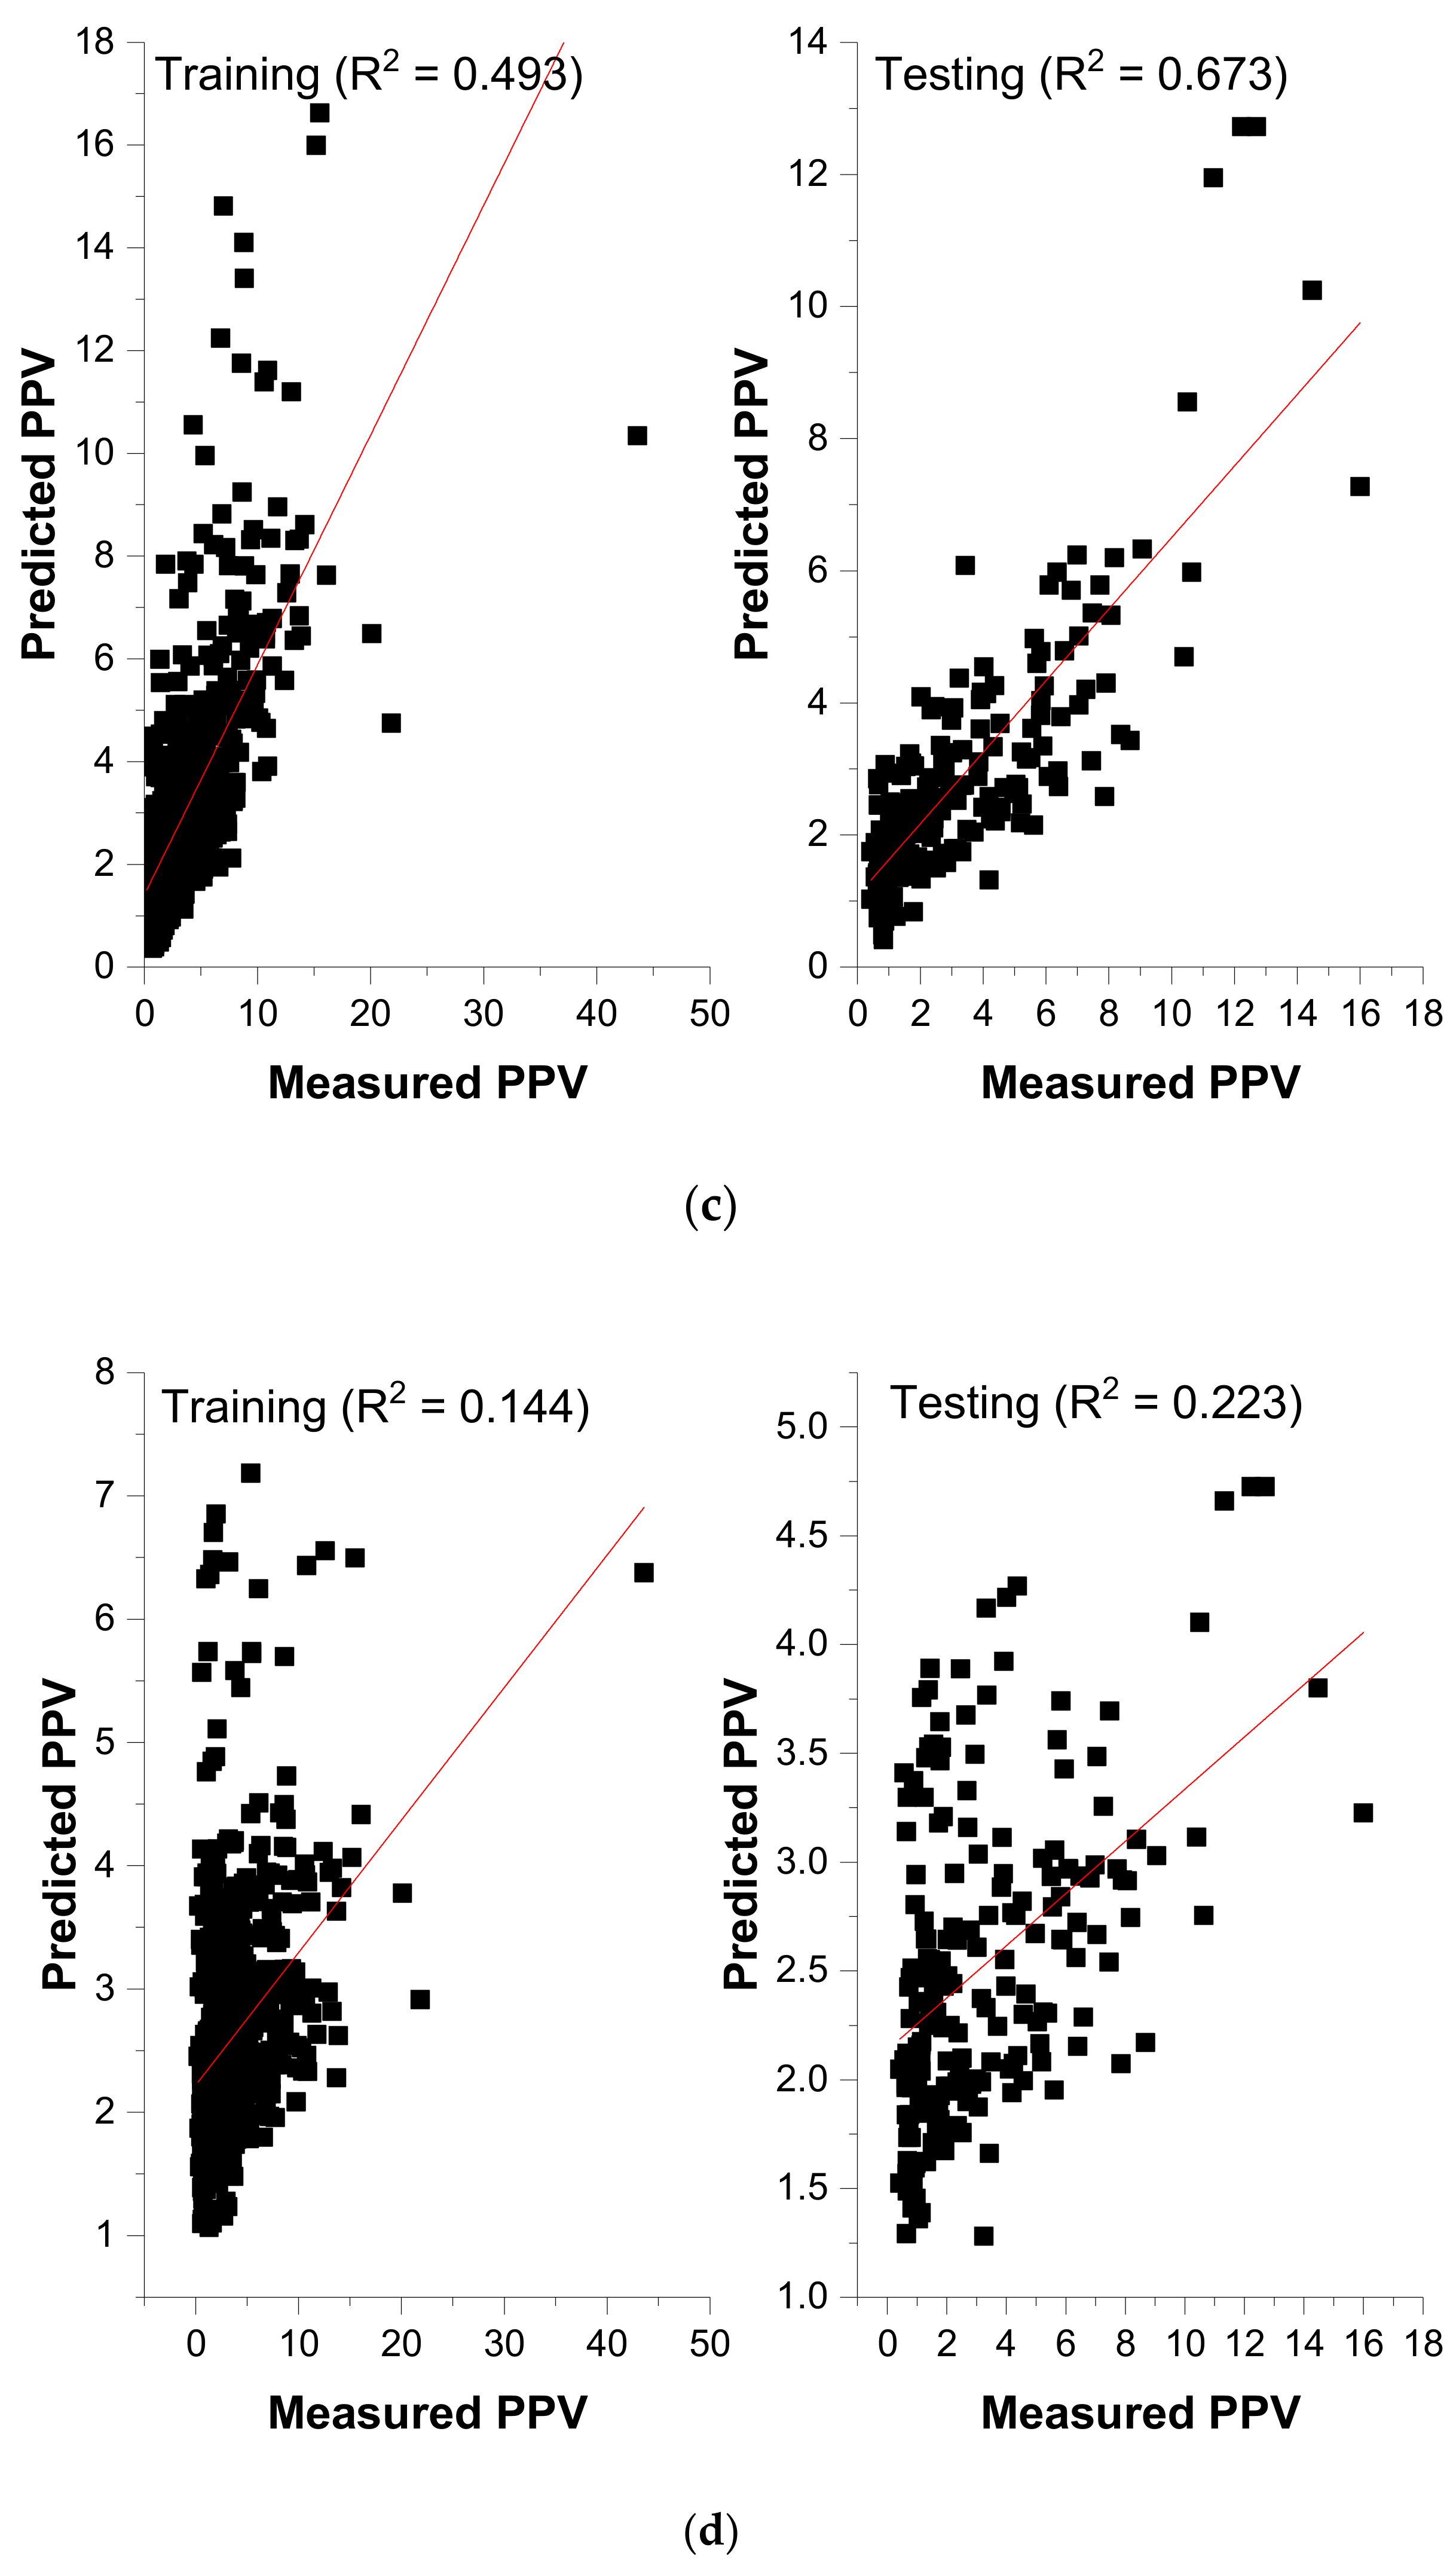
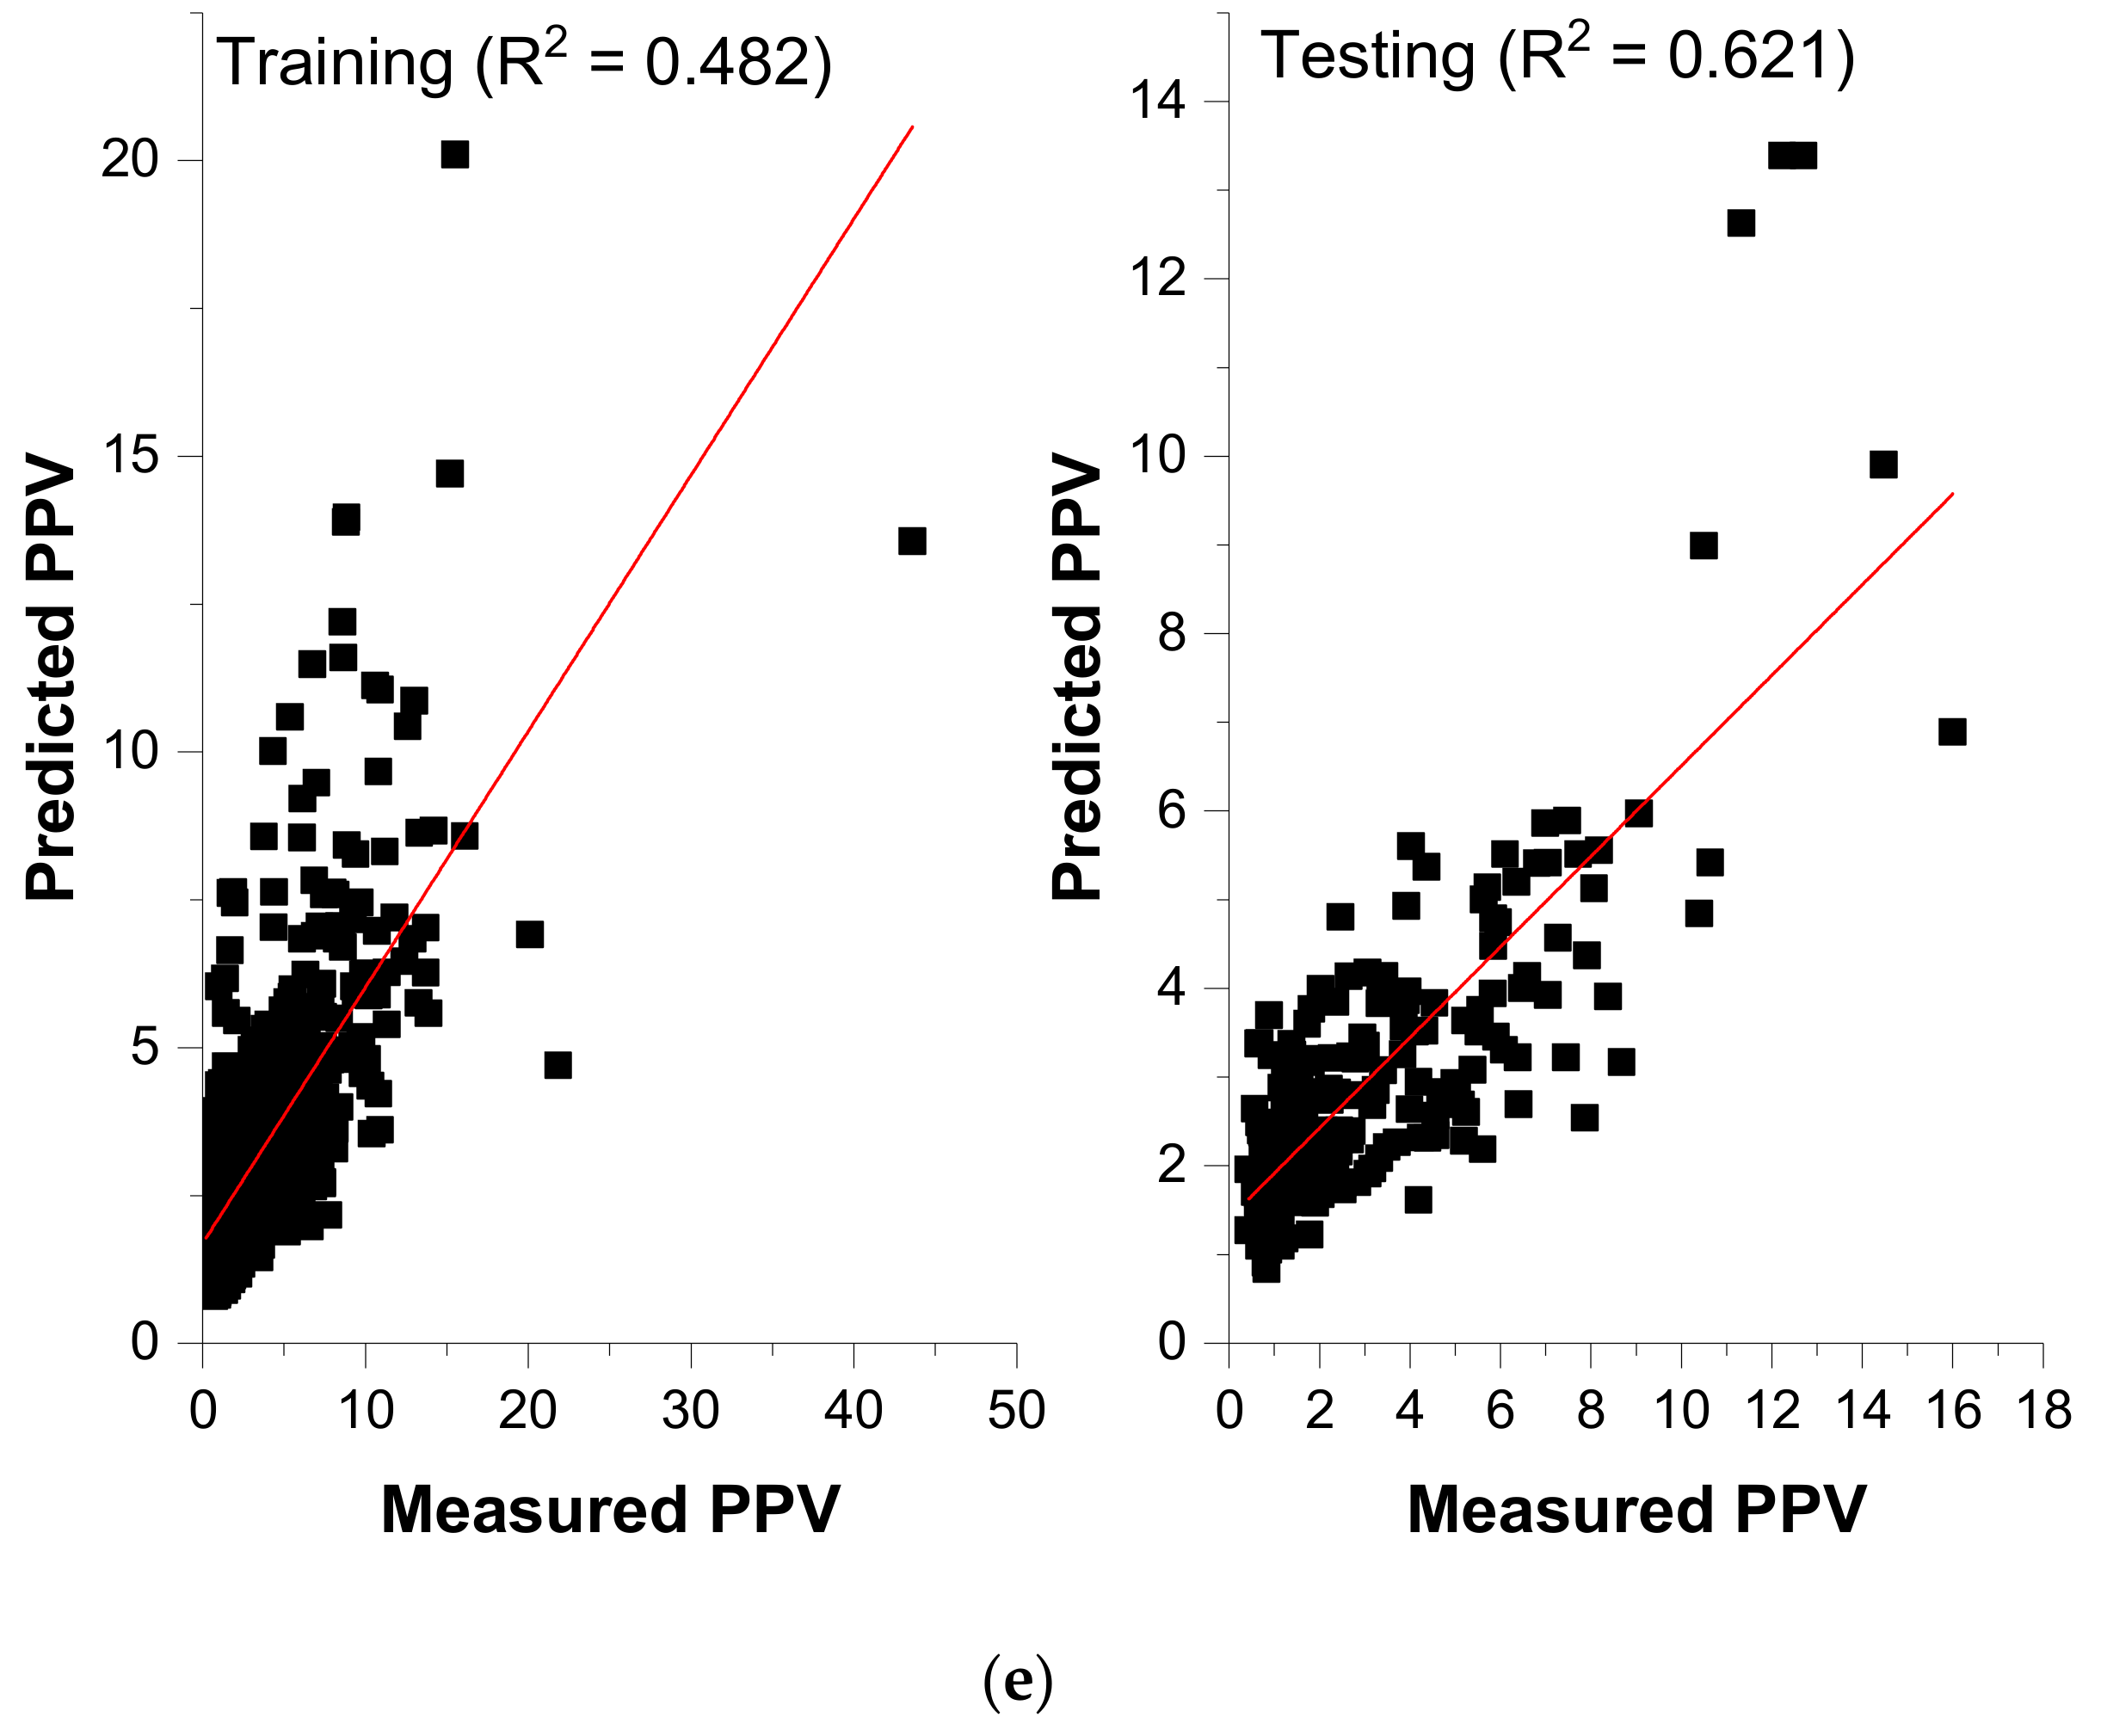
3.2. Empirical Methods
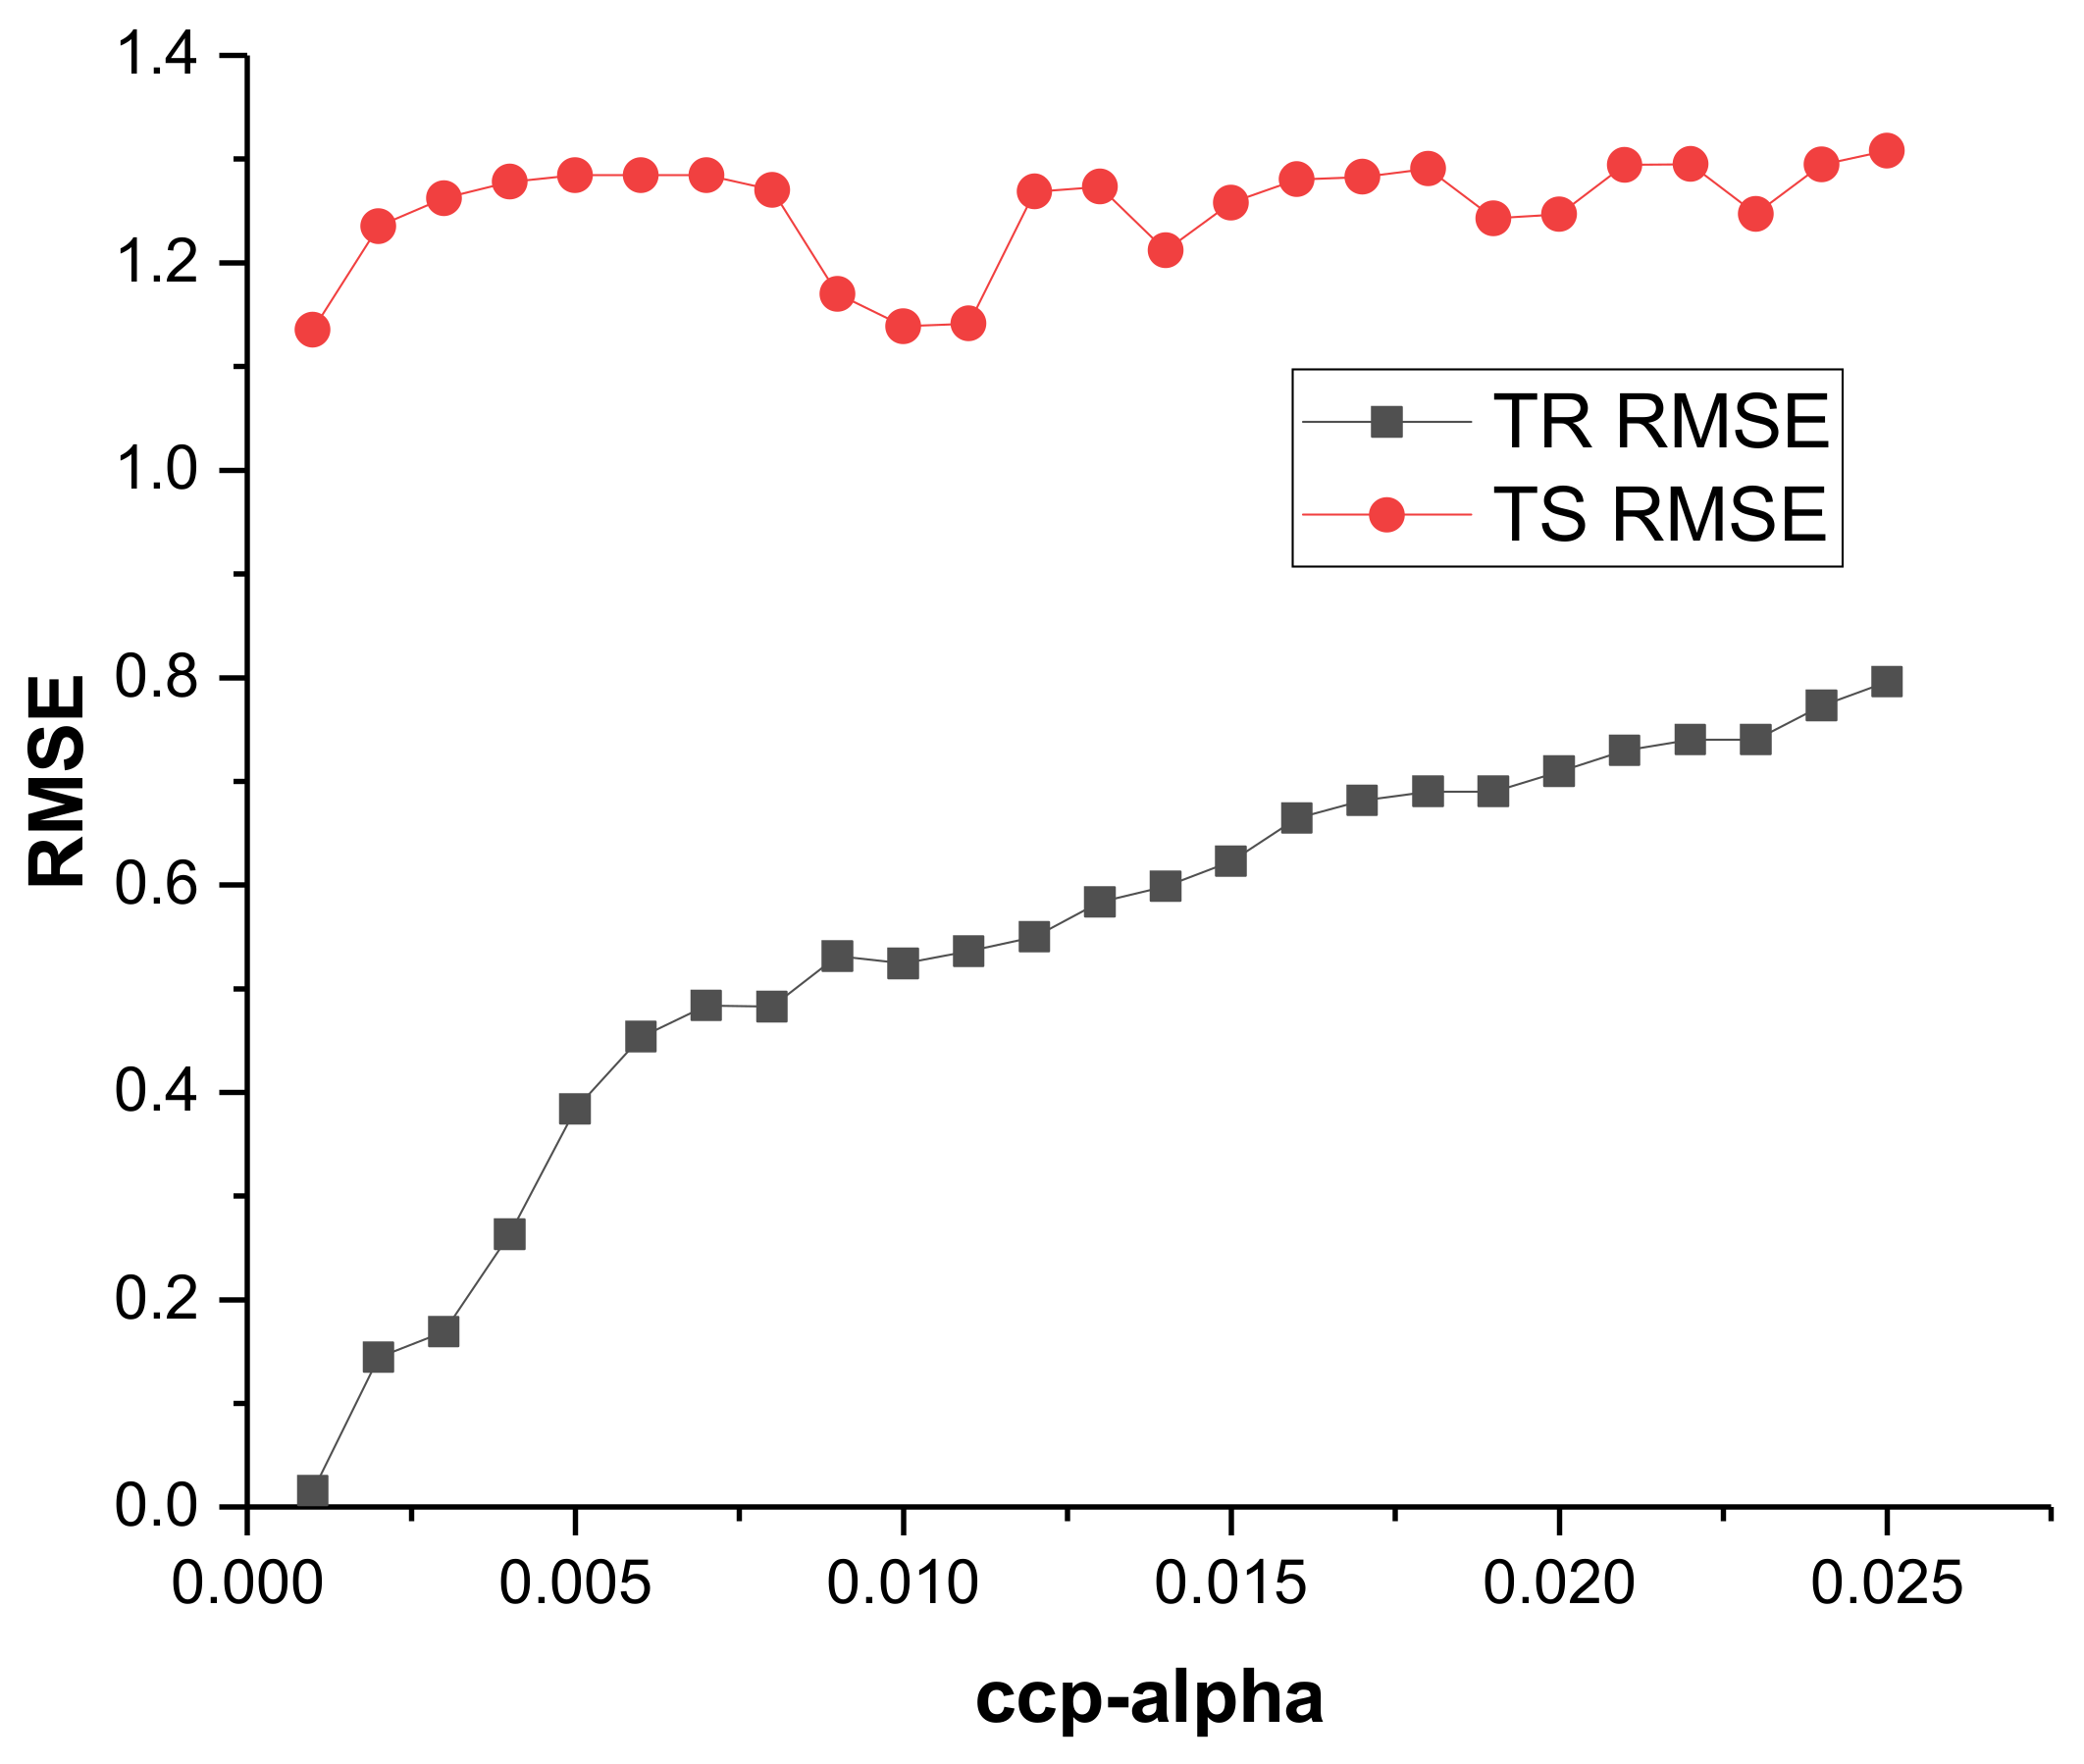
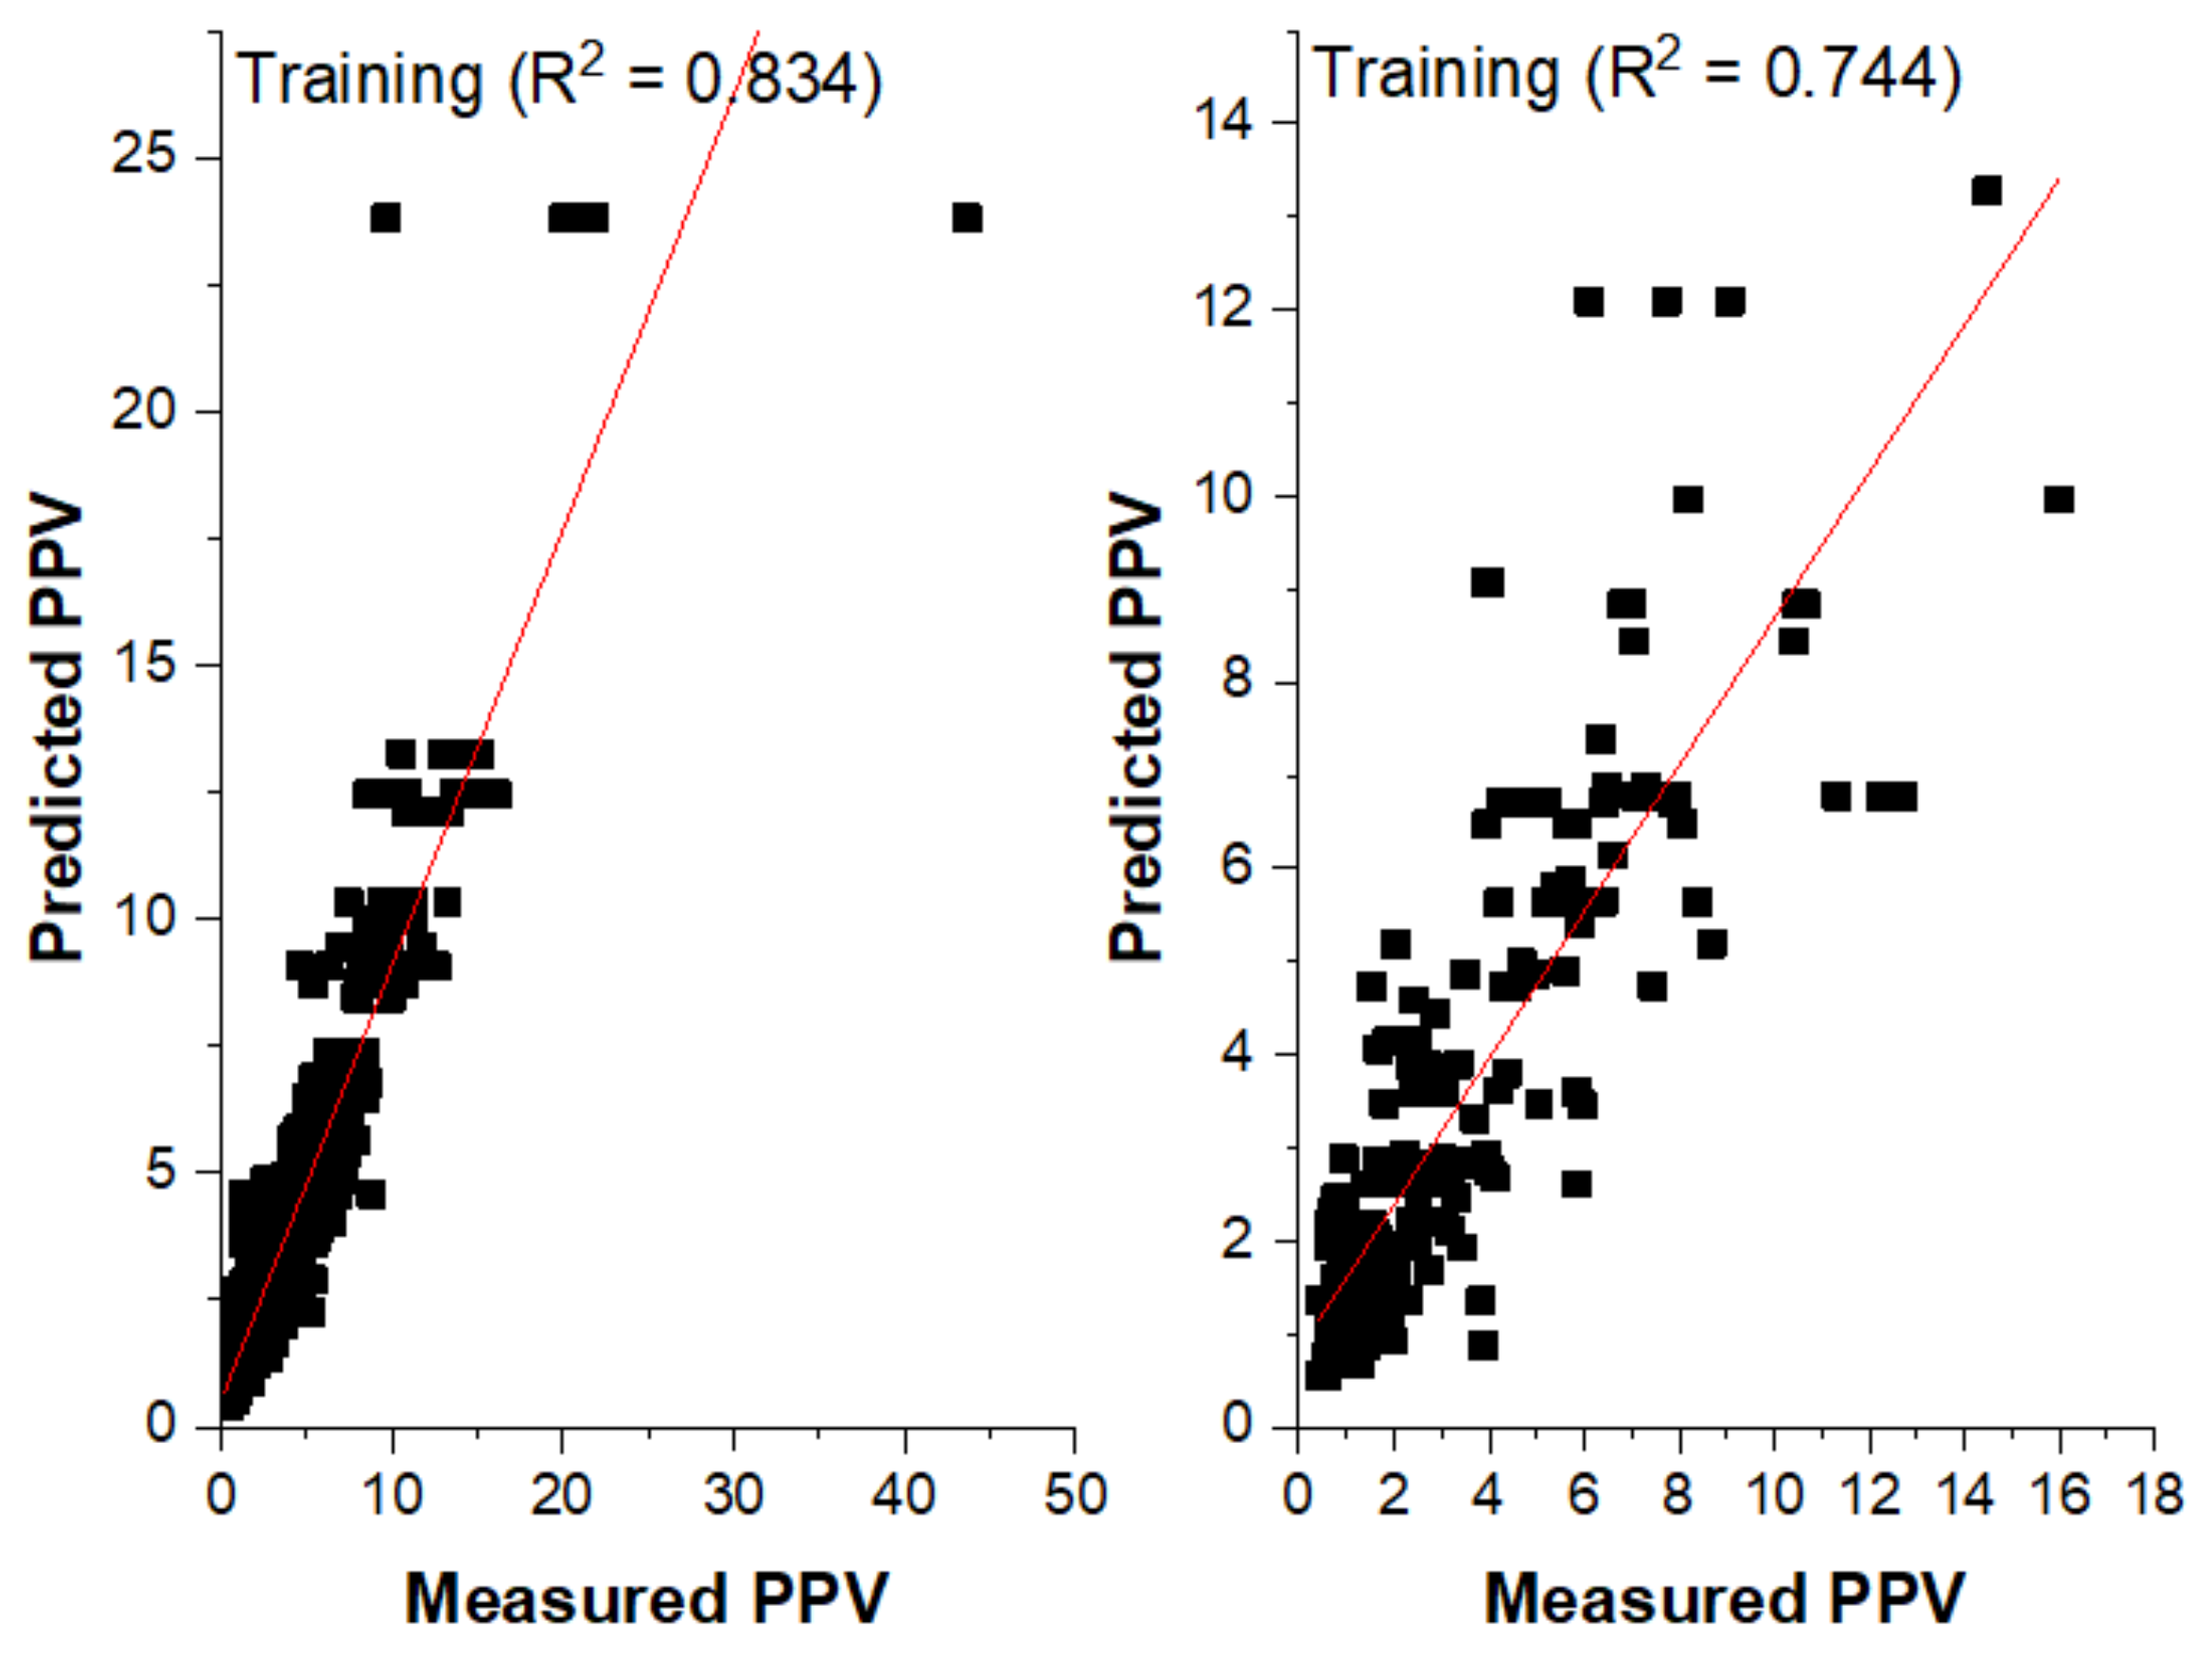
3.3. CART Model for the Prediction of PPV
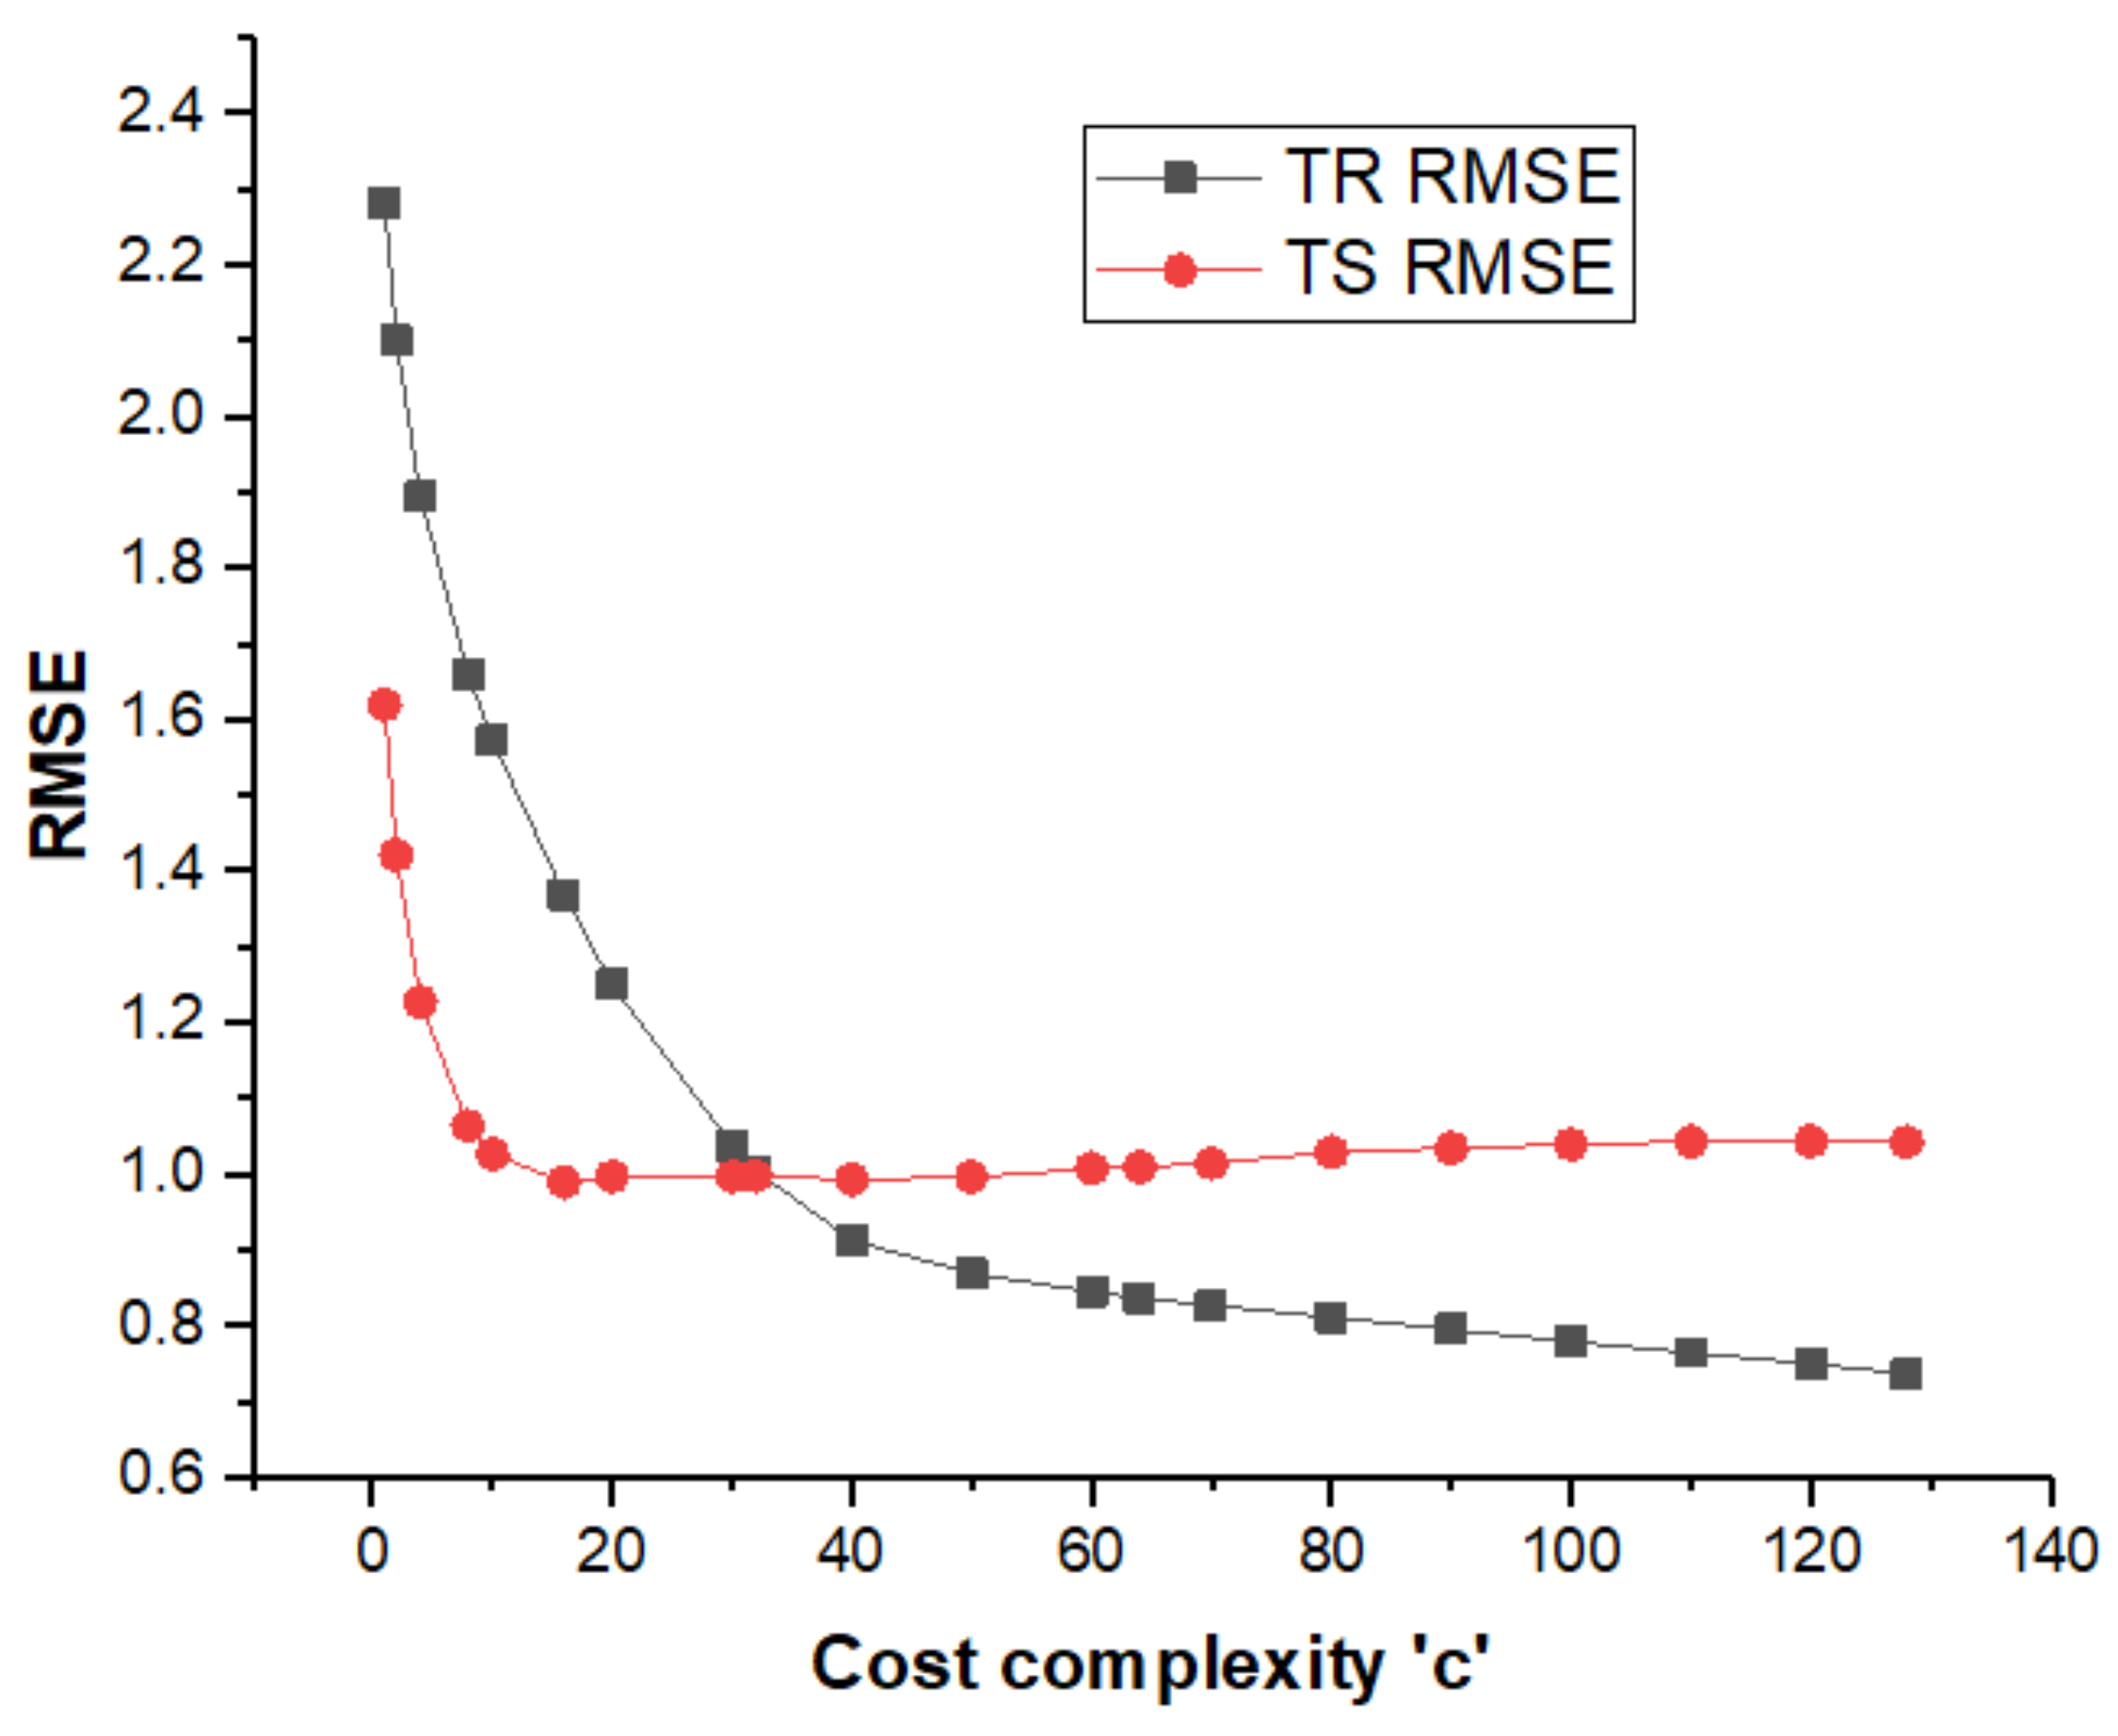
3.4. SVR Model for the Prediction of PPV
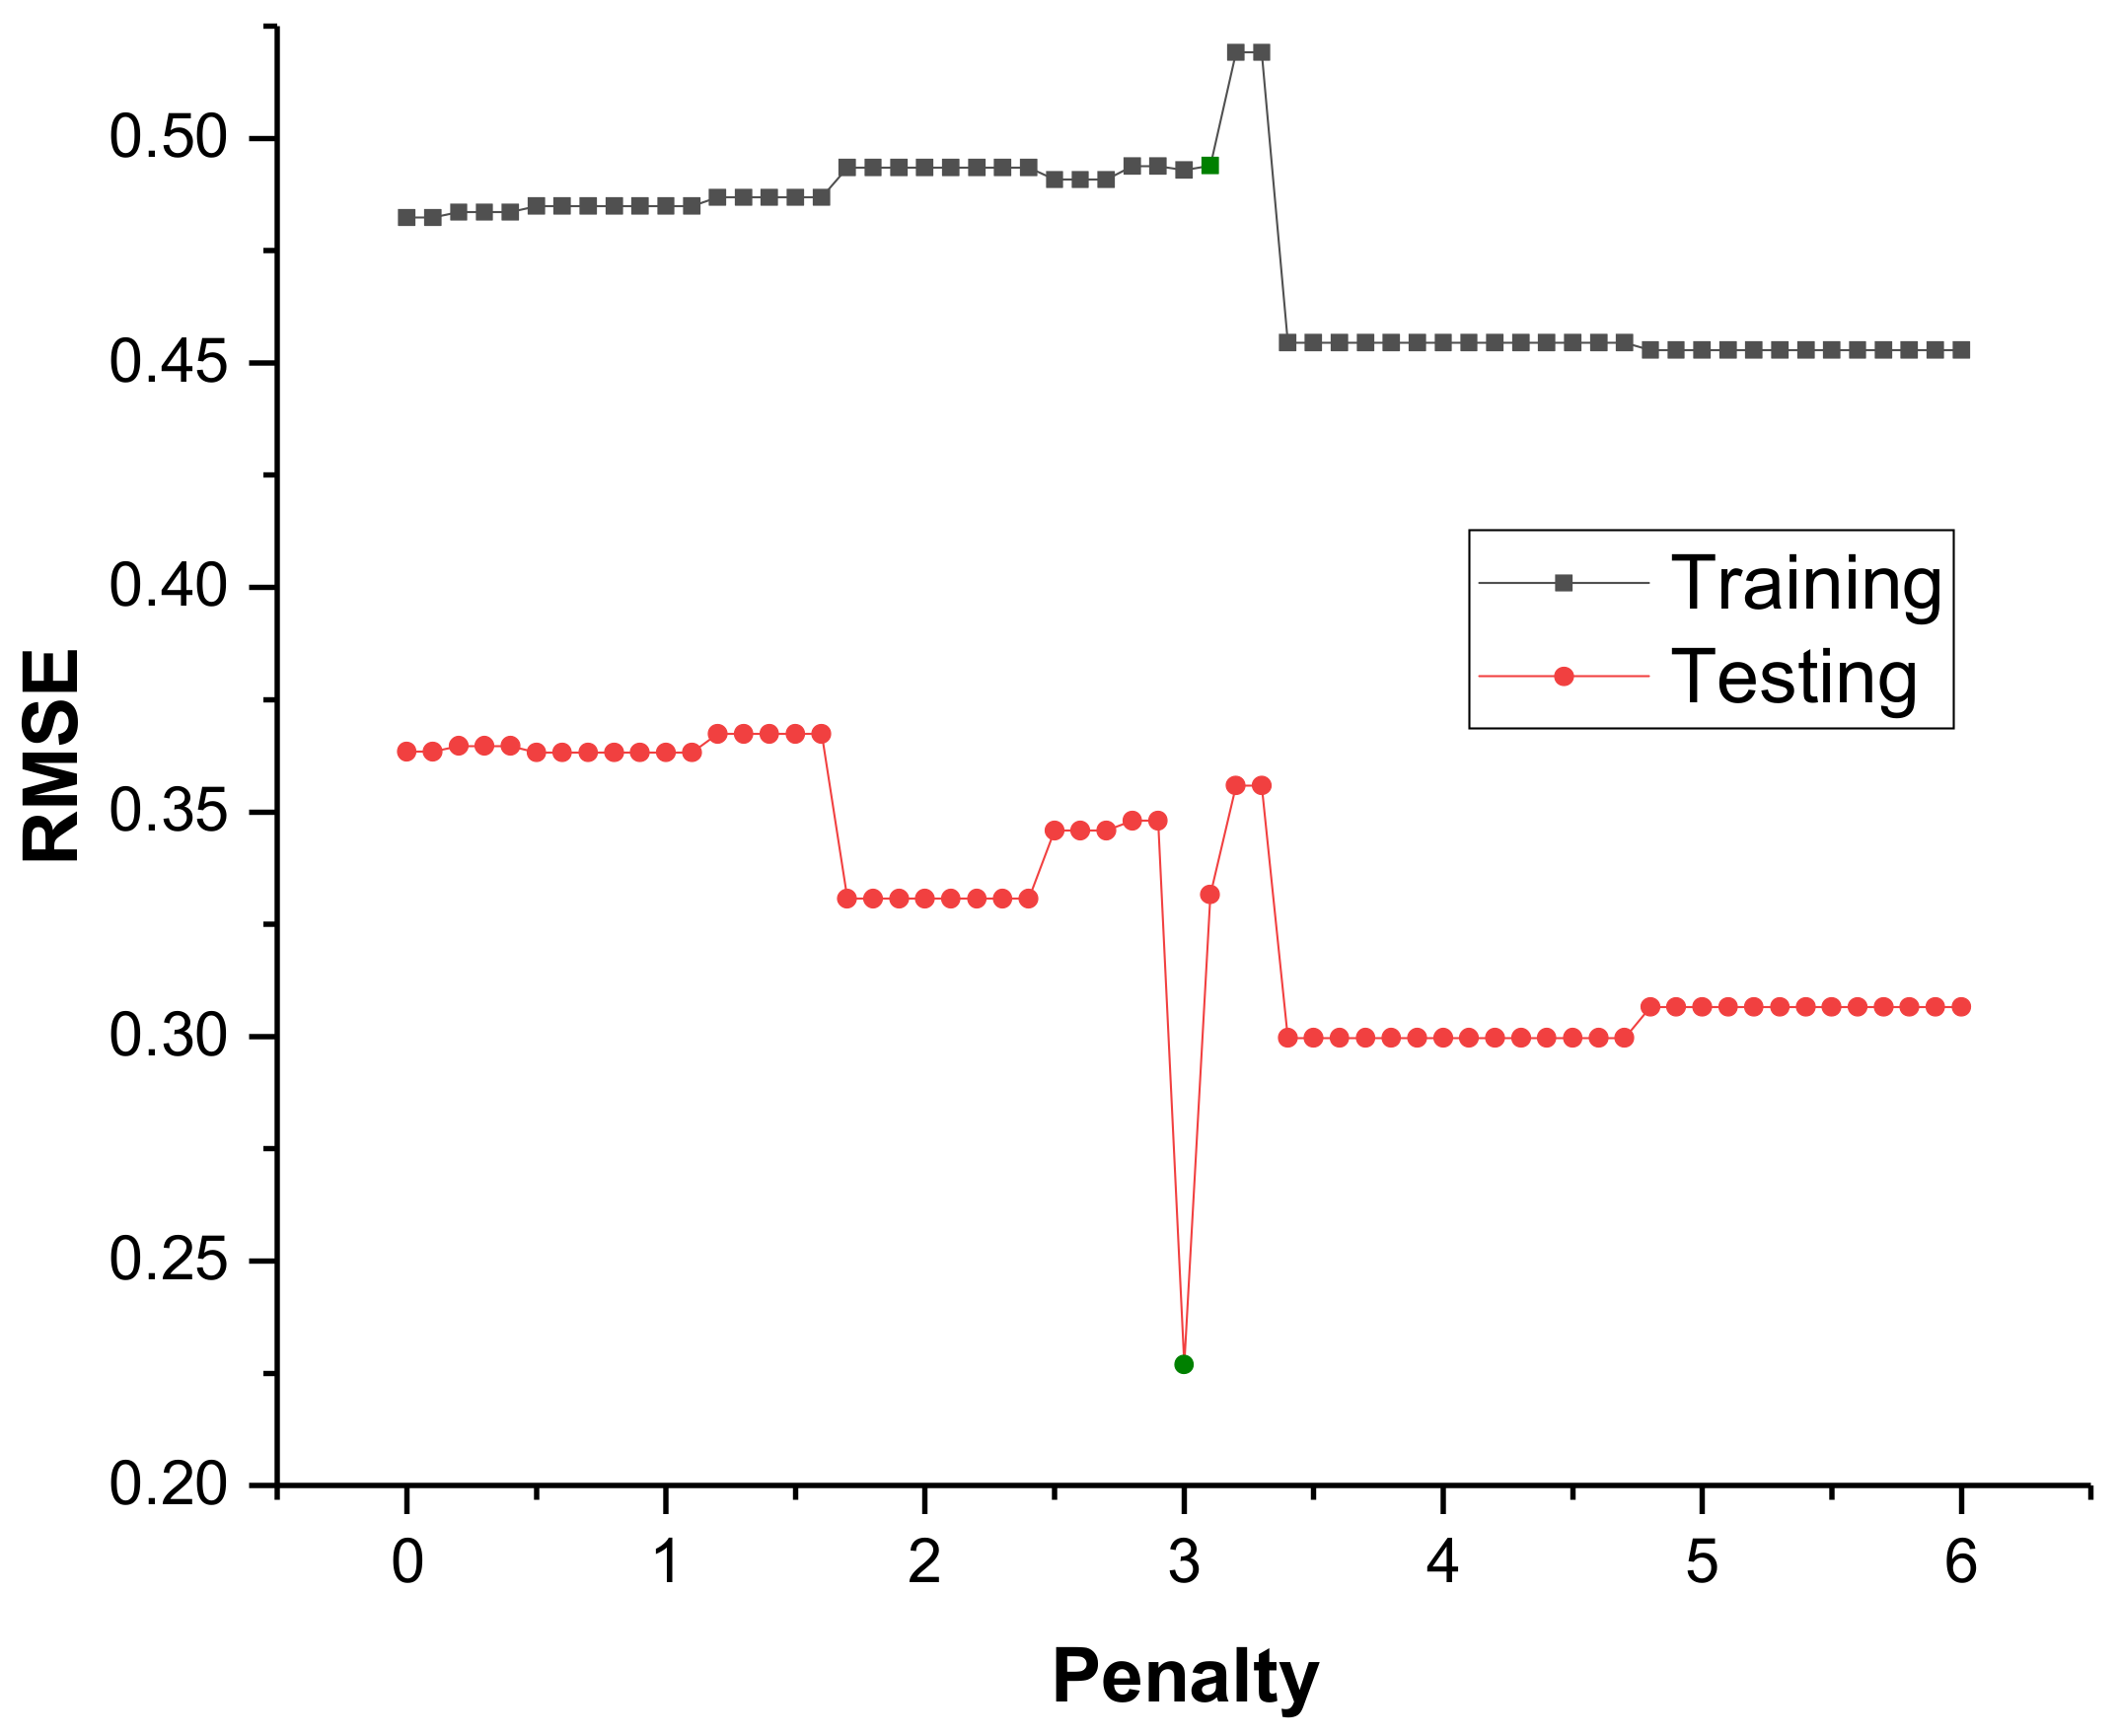
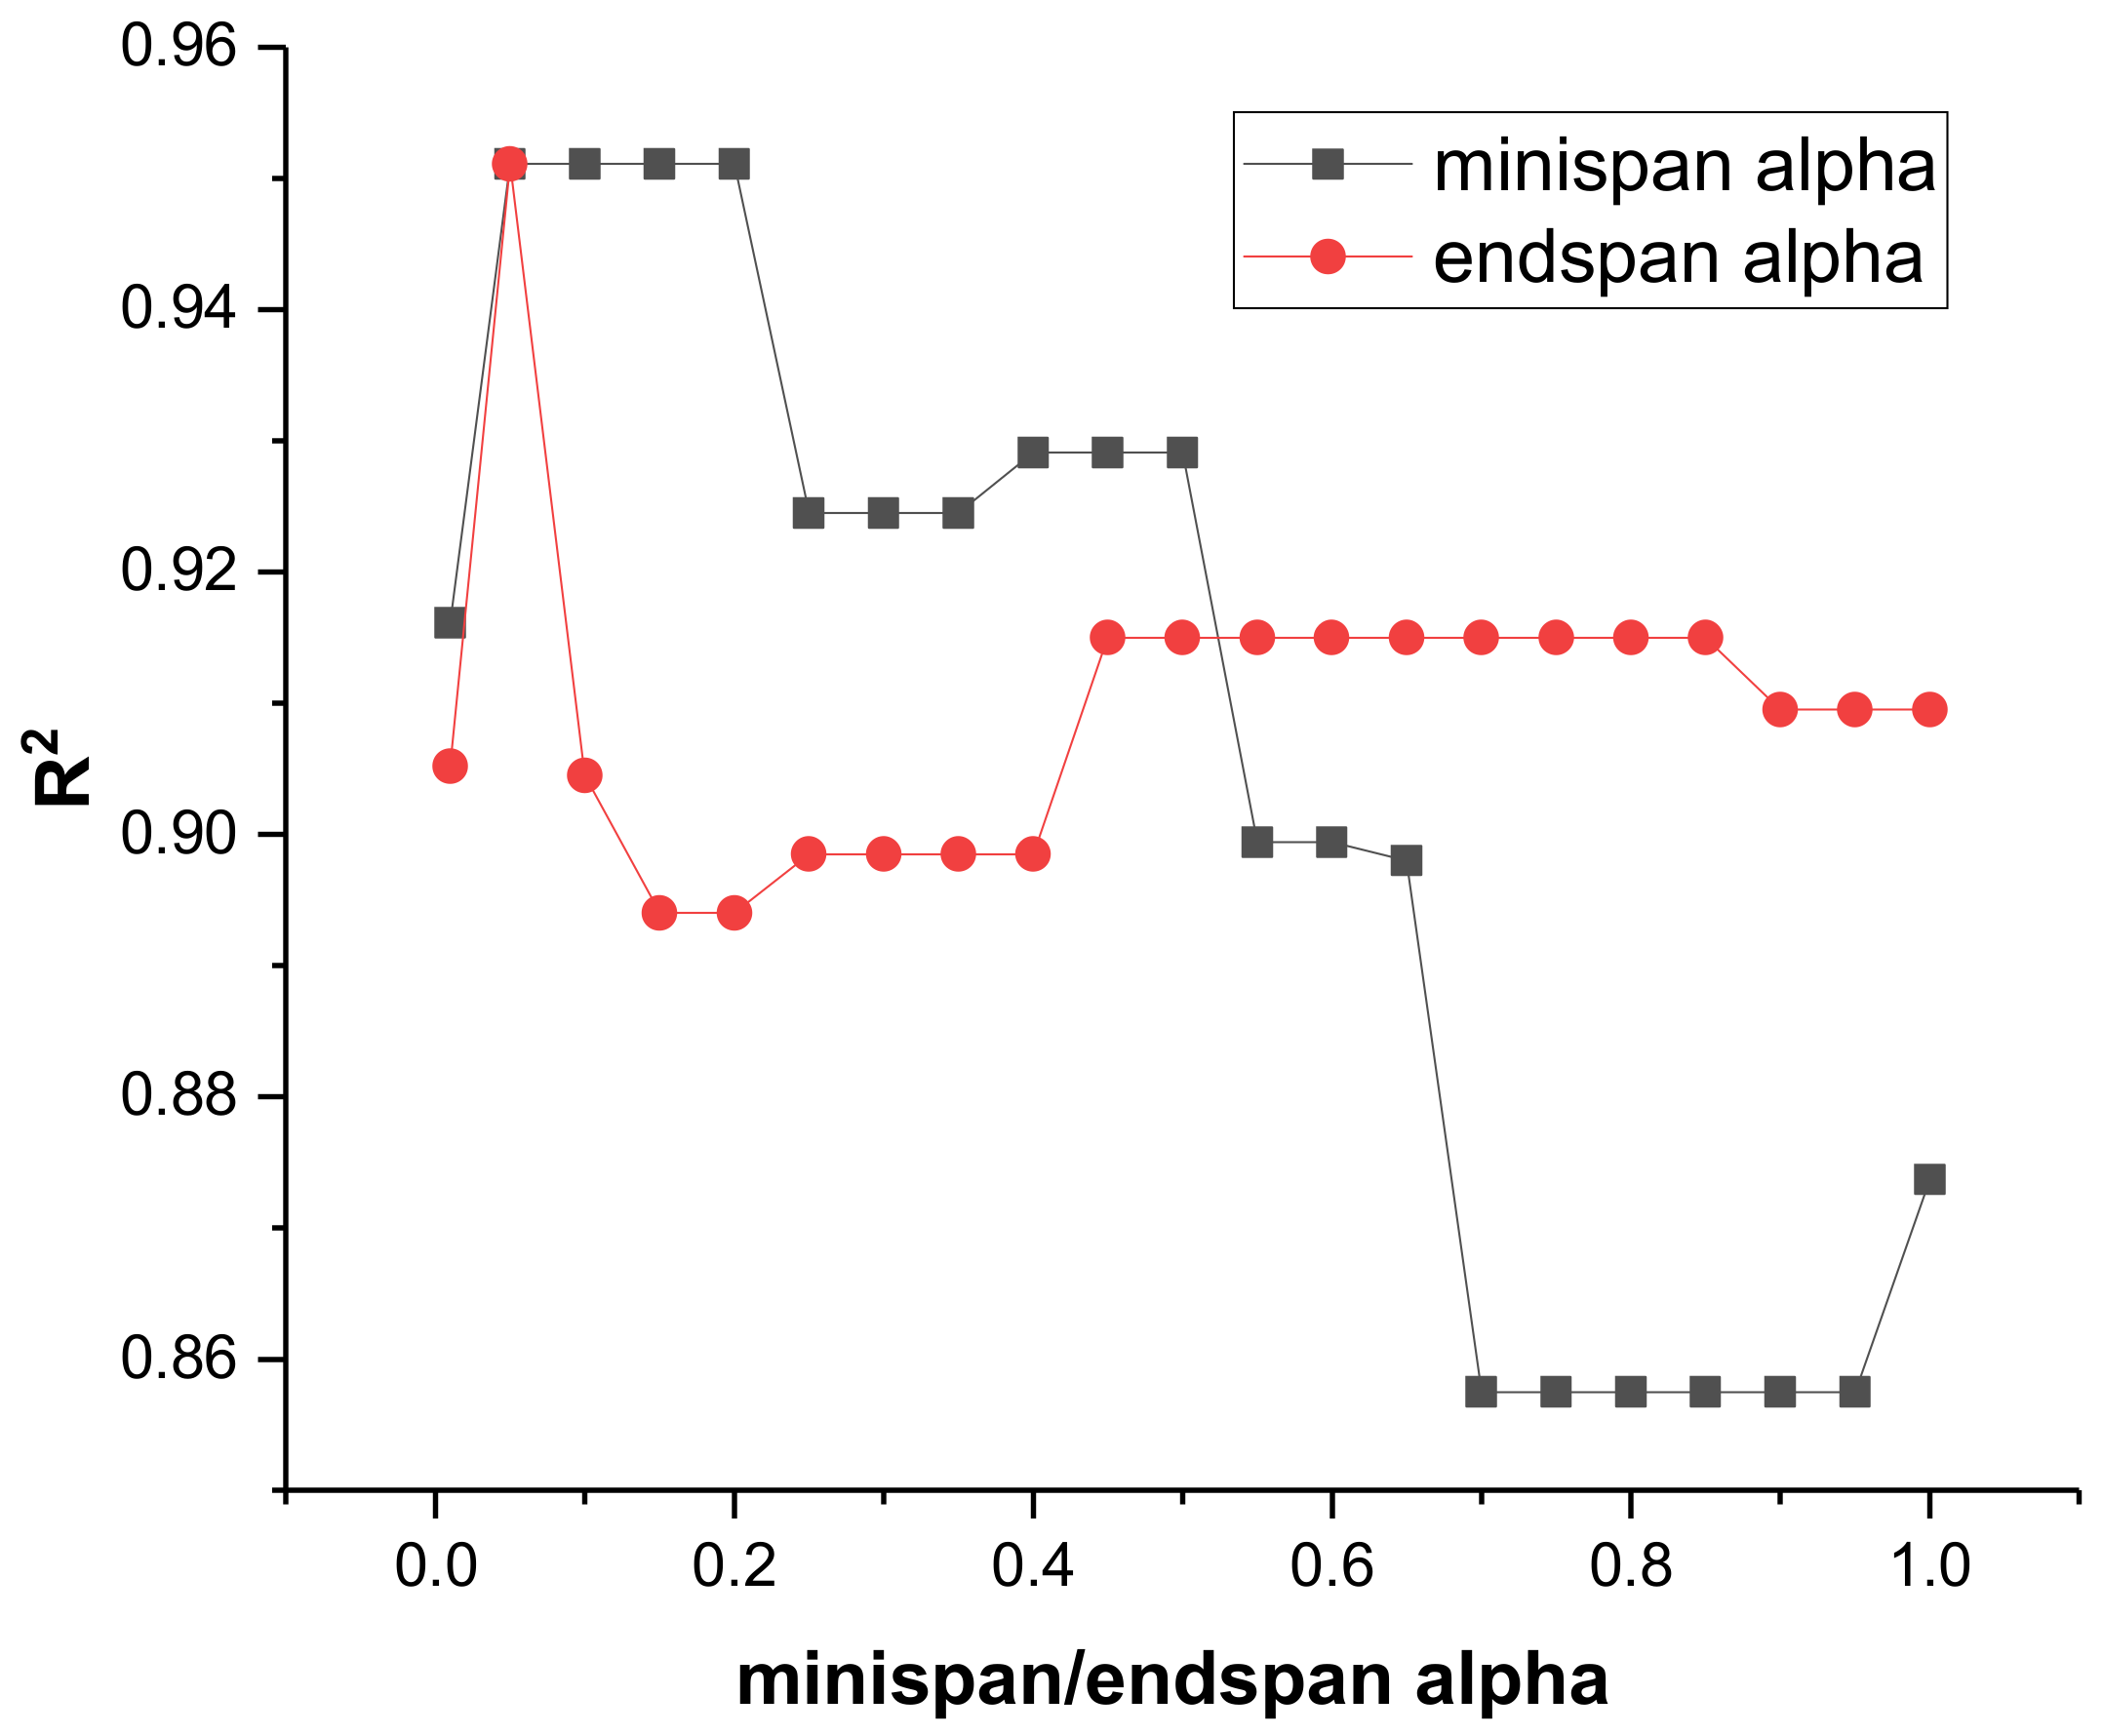
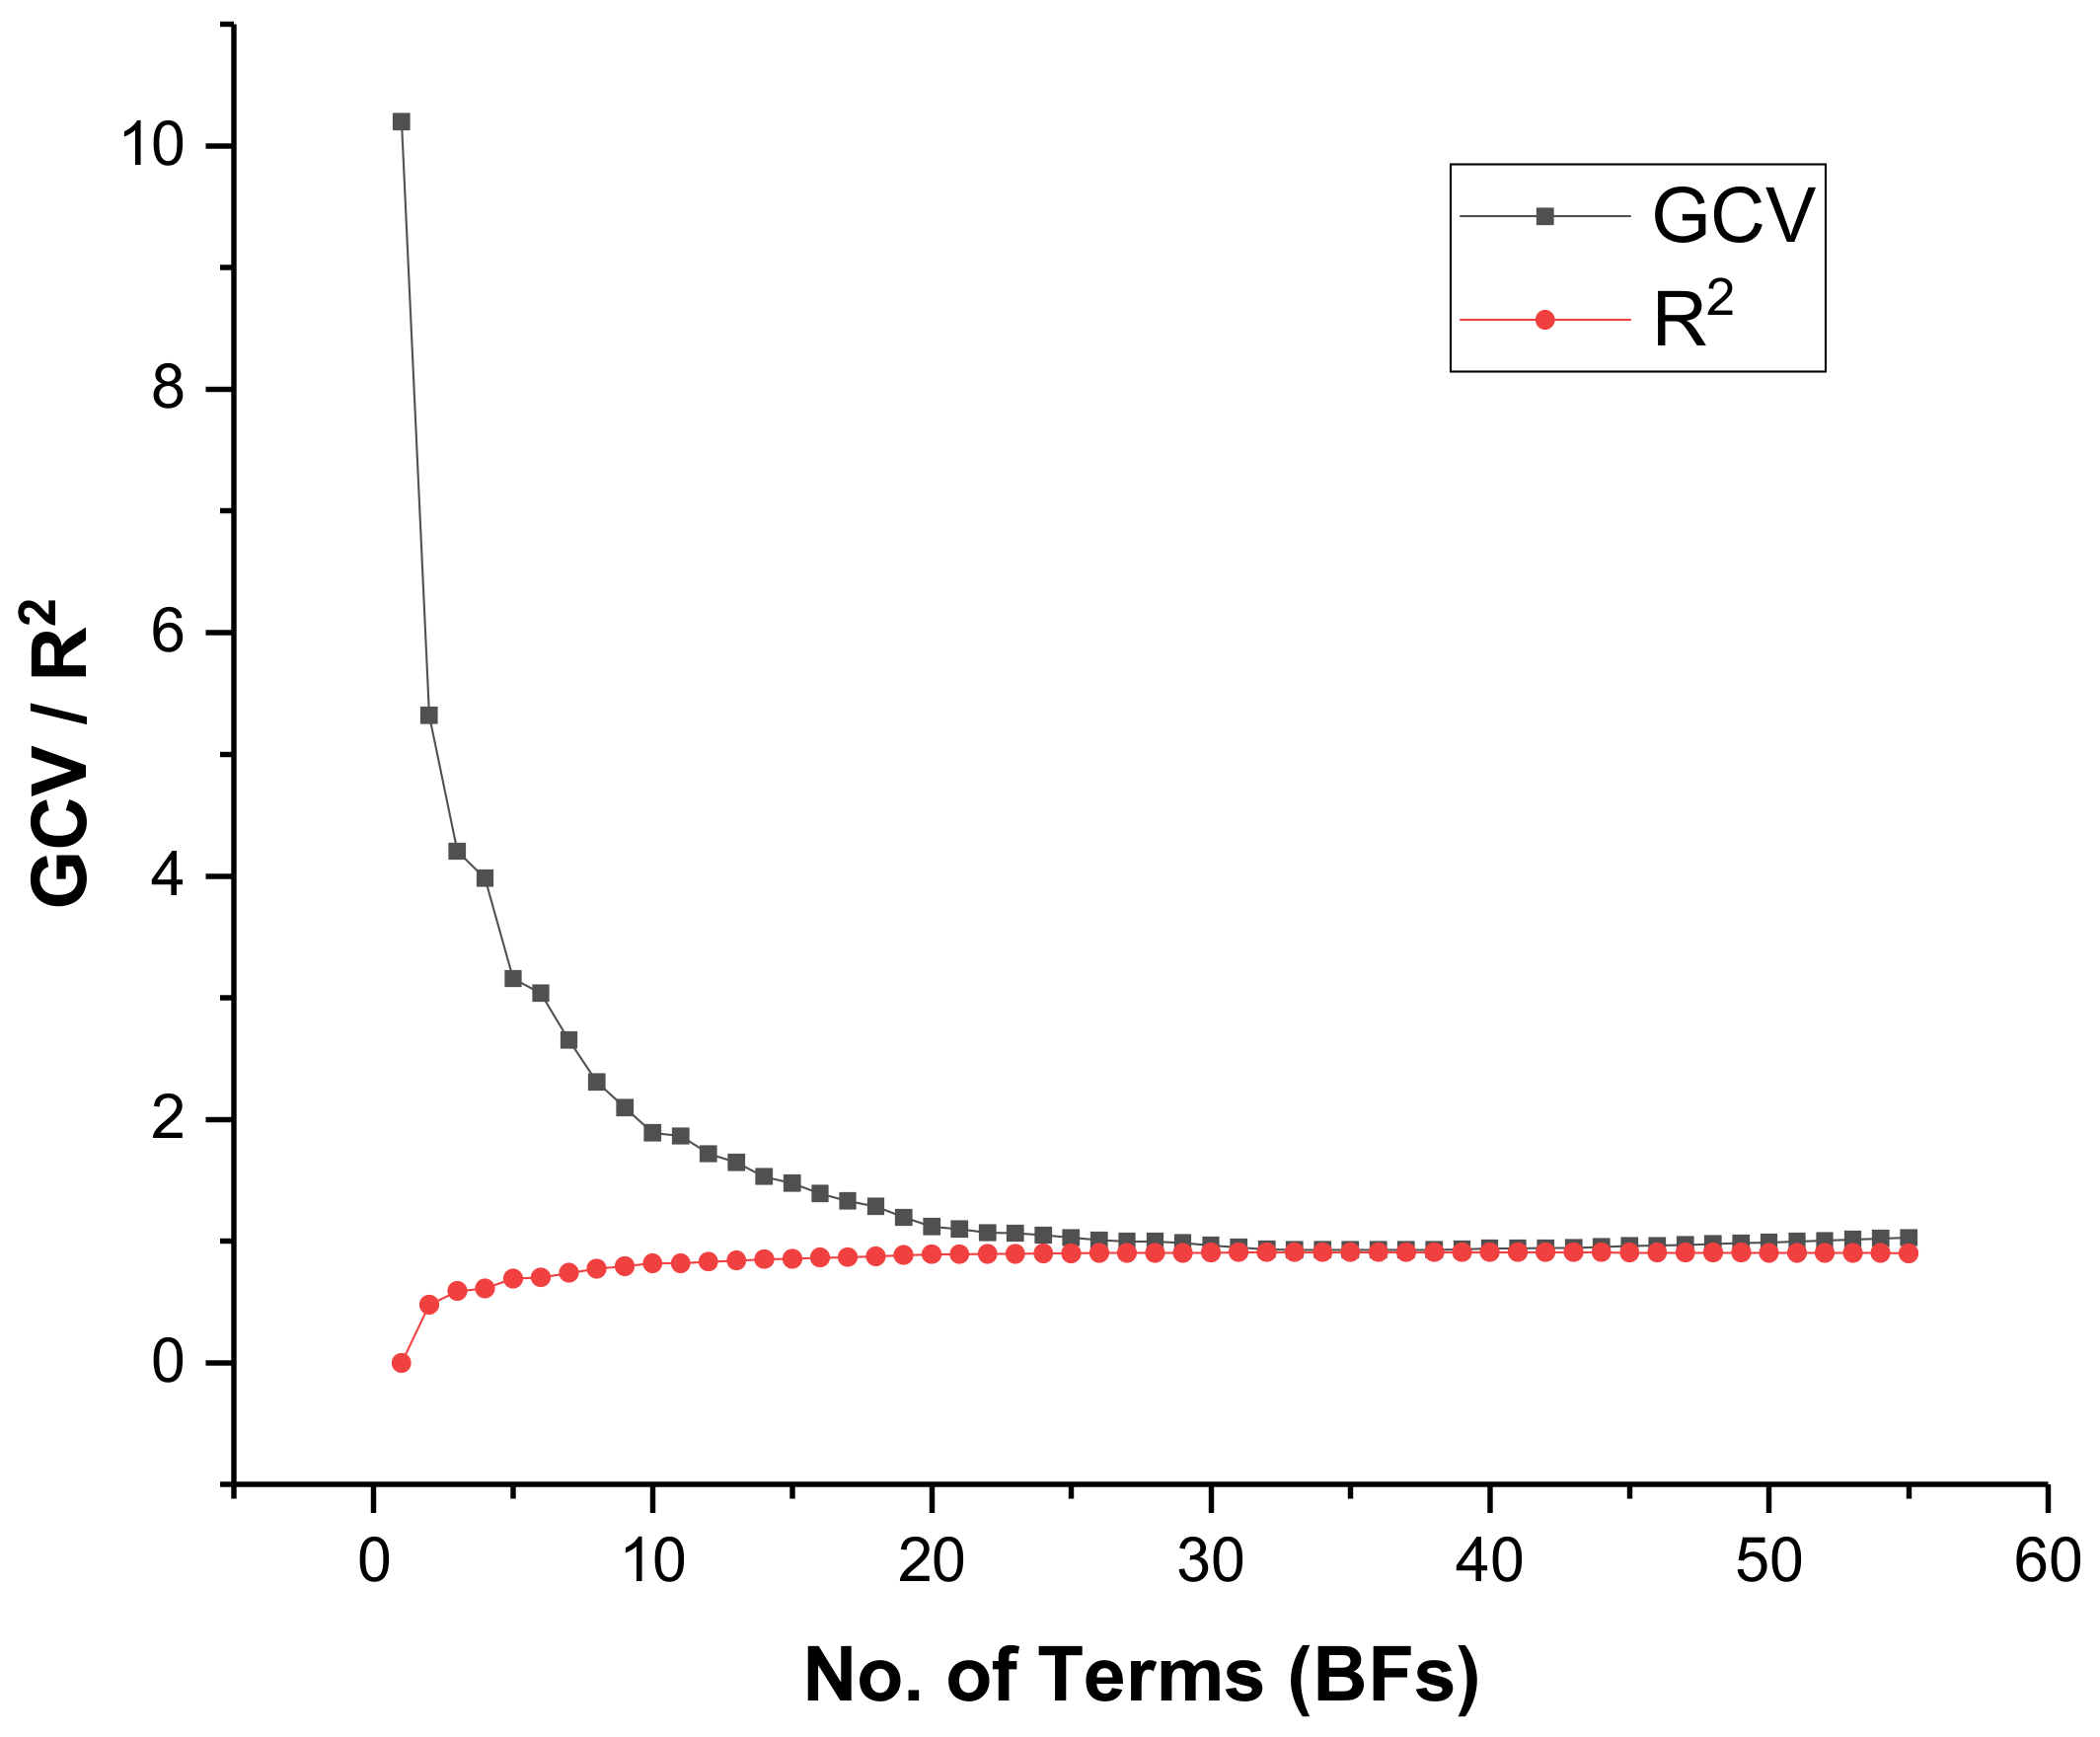
3.5. MARS Model for the Prediction of PPV
4. Discussion
5. Conclusions
- ▪
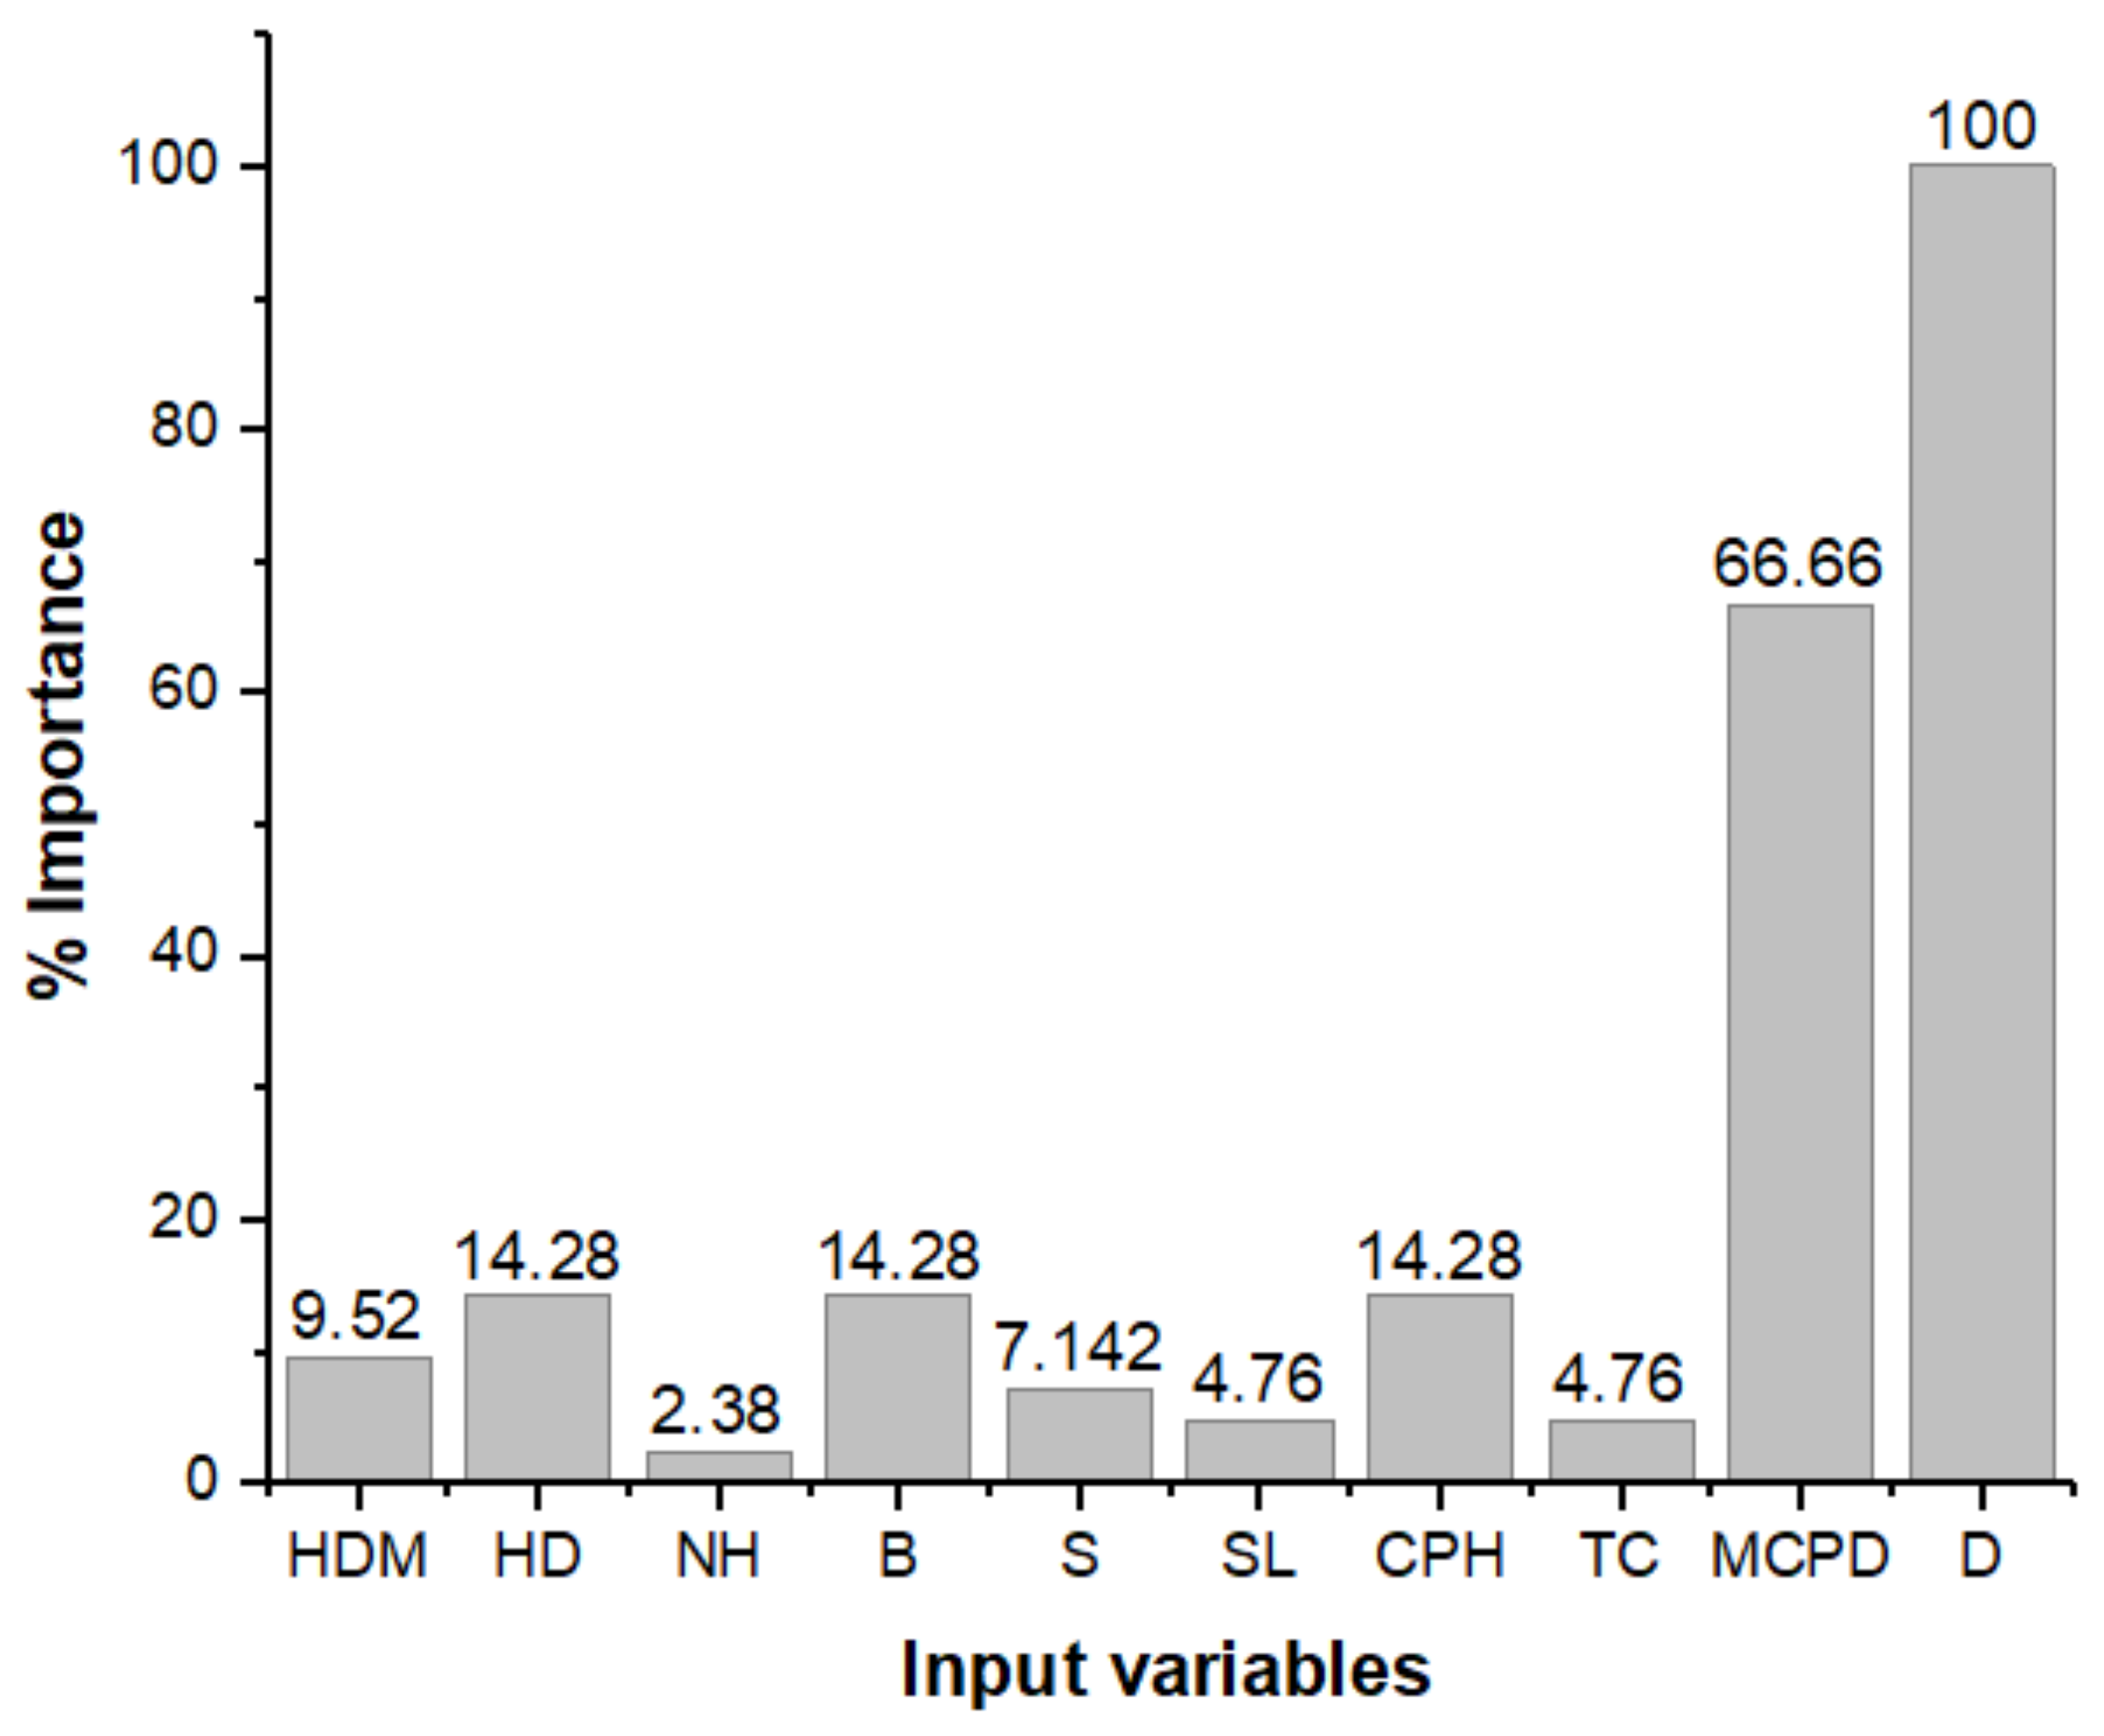
- Based on 1001 datasets, the effective parameters on PPV were assessed using sensitivity analysis. PPV depends upon various blast-design parameters such as hole diameter, hole depth, number of holes, burden, spacing, stemming length, charge per hole, total charge, maximum charge per delay, and monitoring distance.
- ▪
- Machine-learning techniques outperformed traditional prediction techniques including empirical and statistical methods and better explain the non-linear interaction between input variables and the response PPV.
- ▪
- A comprehensive quantitative interaction between input variables and the response PPV is obtained from CART and MARS models, and can be easily employed to predict PPV with reasonable accuracy.
- ▪
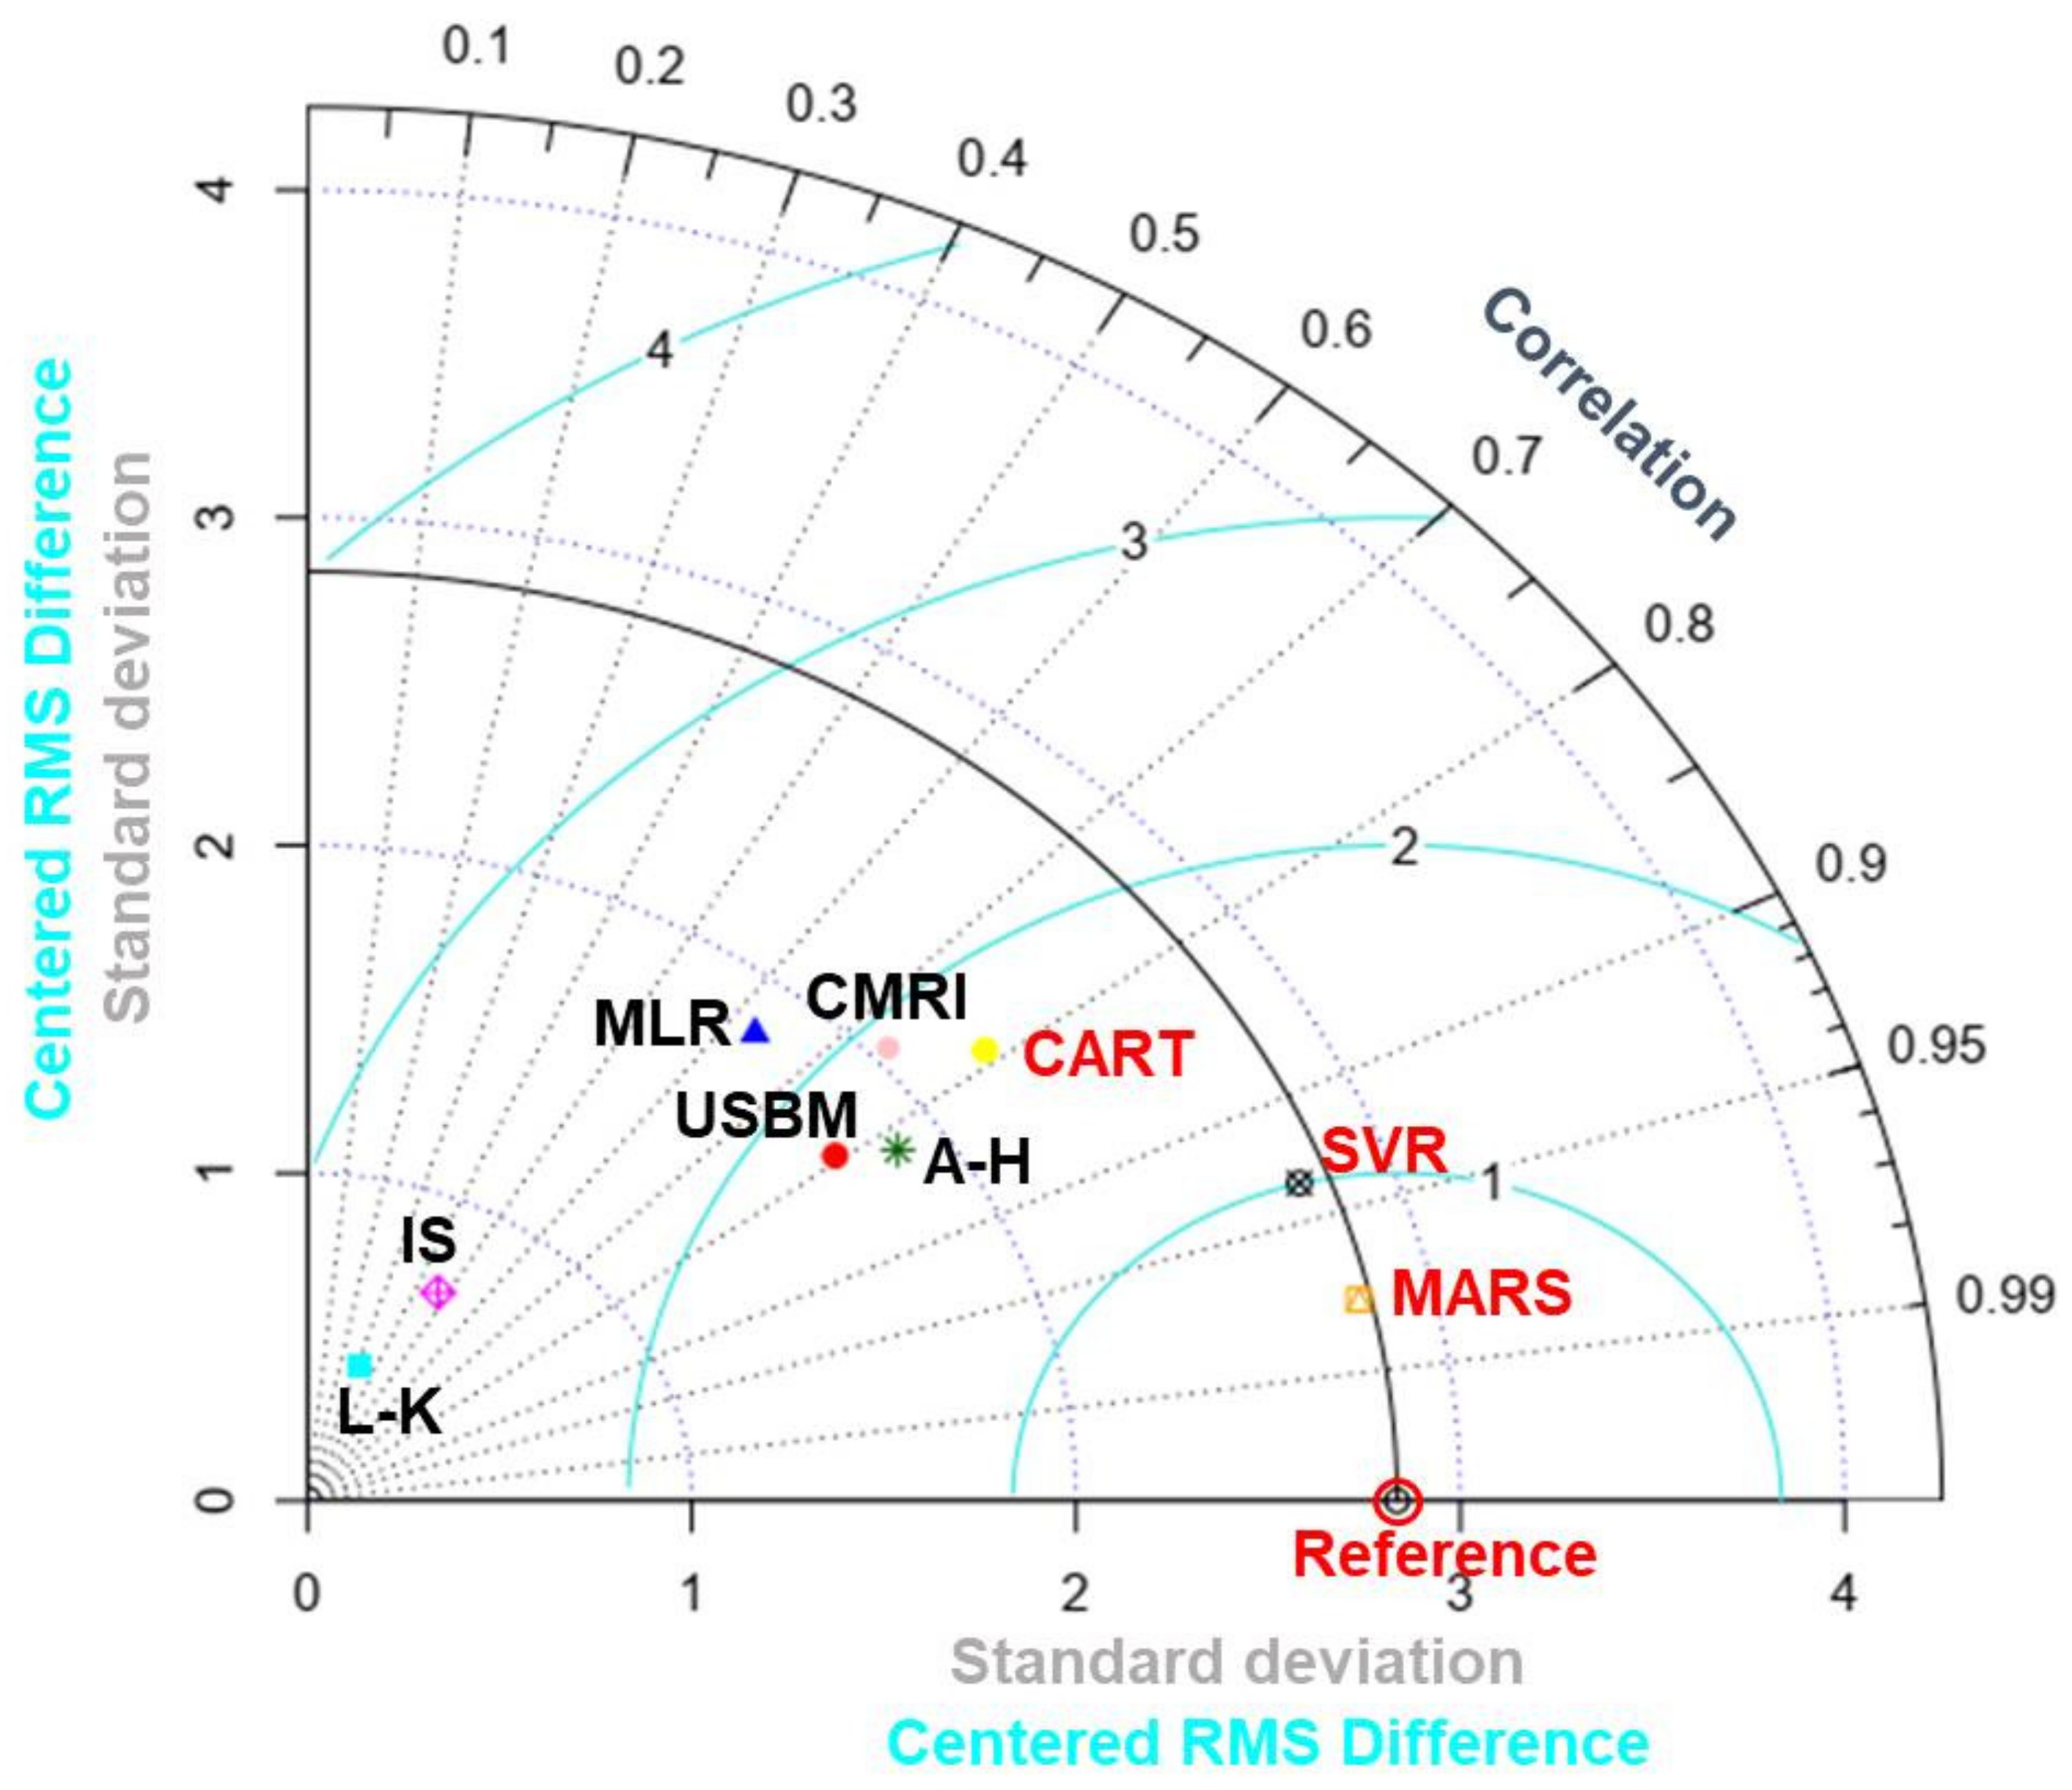
- Despite using many datasets and input variables, the study shows that the MARS model can be easily employed to estimate PPV with high prediction accuracy (R2 = 0.951; RMSE = 0.227) compared to CART and SVR.
Author Contributions
Funding
Institutional Review Board Statement
Informed Consent Statement
Data Availability Statement
Conflicts of Interest
Abbreviations
| ABS | Absorption | MCPD | Maximum charge per delay |
| AGPSO | Autonomous groups particles swarm optimization | MFA | Modified firefly algorithm |
| A–H | Ambraseys–Hendron predictors | MFA | Modified firefly algorithm |
| ANFIS | Adaptive neuro-fuzzy inference system | MFO | Moth-flame optimization algorithm |
| ANN | Artificial neural network | MIV | Mean impact value |
| B | Burden | ML | Machine learning |
| BCPRA | Blast-control point relative angle | MLPNN | Multilayer perceptrons neural network |
| BF | Basis function | MLR | Multiple linear regression; |
| BI | Blasting index | MPMR | Minimax probability machine regression |
| BIGV | Blast-induced ground vibration | MR | Multiple regression; |
| BK | Buckingham π (pi) theorem | MVRA | Multivariate regression analysis |
| BP | Backpropagation | NDS | Number of blasting groups |
| BPNN | Backpropagation neural network | NH | Number of holes |
| CART | Classification and regression tree | NHPD | Number of holes per delay |
| CL | Average charge length | NLMR | Non-linear multiple regression |
| CMRI | Central Mining Research Institute predictor | NR | Number of rows |
| CPH | Average explosive charge per hole | PF | Powder factor |
| CRANFIS | Chaos recurrent adaptive neuro-fuzzy inference system | PLI | Point load index |
| CSO | Cuckoo search optimization | PPV | Peak particle velocity |
| D | Distance | PSO | Particle swarm optimization |
| DPR | Delay per row | P-wave | P-wave velocity |
| DTS | Time delay for each group, | R2 | Co-efficient of determination |
| E | Young’s modulus | RANFIS | Recurrent adaptive neuro-fuzzy inference system |
| ELM | Extreme learning machine | RBFNN | Radial basis function neural network |
| FA | Firefly algorithm | Rdis | Radial distances |
| FRC | Fracture roughness co-efficient | RF | Random forest |
| FS | Fuzzy system | RMR | Rock mass rating |
| GA | Genetic algorithm | RMSE | Root-mean-square error |
| GCV | Generalized cross-validation | RQD | Rock quality designation |
| GEP | Gene-expression programming | S | Spacing |
| GFFN | Generalized feed-forward neural network | SCA | Sine cosine algorithm |
| G–D | Ghosh–Daemen empirical predictor | SD | Sub-drilling; |
| GMDH | Group method of data handling | SL | Steaming length |
| GOA | Grasshopper optimization algorithm | SRH | Schmidt rebound hardness value |
| GPR | Gaussian process regression | SVM | Support vector machine |
| GRNN | General regression neural network | SVR | Support vector regression |
| H | Bench height | TC | Total charge |
| Hc | Hardness co-efficient | TS | Tunnel cross-section |
| HD | Hole depth | UCS | Uniaxial compressive strength |
| Hdis | Horizontal distances | USBM | United states bureau of mines |
| HDM | Hole diameter | Ve | Volume of extracted block |
| HGS | Hunger games search | VOD | Velocity of detonation |
| HHO | Harris hawks optimization | XGBoost | Extreme gradient boosting |
| ICA | Imperialist competitive algorithm | ρe | Explosive density |
| IS | Indian standard predictor | ρr | Rock density |
| L–K | Langefors–Kihlstrom predictor | ɳ | Porosity |
| LSSVM | Least-squares support vector machine | µ | Poisson ratio |
| MARS | Multivariate adaptive regression splines |
References
- Bayat, P.; Monjezi, M.; Mehrdanesh, A.; Khandelwal, M. Blasting pattern optimization using gene expression programming and grasshopper optimization algorithm to minimise blast-induced ground vibrations. Eng. Comput. 2021, 38, 3341–3350. [Google Scholar] [CrossRef]
- Siskind, D.E.; Strachura, V.J.; Stagg, M.S.; Kopp, J.W. Structure Response and Damage Produced by Airblast from Surface Mining; US Department of the Interior, Bureau of Mines: Washington, DC, USA, 1980. [Google Scholar]
- Lawal, A.I.; Kwon, S.; Kim, G.Y. Prediction of the blast-induced ground vibration in tunnel blasting using ANN, moth-flame optimized ANN, and gene expression programming. Acta Geophys. 2021, 69, 161–174. [Google Scholar] [CrossRef]
- Dumakor-Dupey, N.; Arya, S.; Jha, A. Advances in Blast-Induced Impact Prediction—A Review of Machine Learning Applications. Minerals 2021, 11, 601. [Google Scholar] [CrossRef]
- Yan, Y.; Hou, X.; Fei, H. Review of predicting the blast-induced ground vibrations to reduce impacts on ambient urban communities. J. Clean. Prod. 2020, 260, 121135. [Google Scholar] [CrossRef]
- Ghoraba, S.; Monjezi, M.; Talebi, N.; Armaghani, D.J.; Moghaddam, M.R. Estimation of ground vibration produced by blasting operations through intelligent and empirical models. Environ. Earth Sci. 2016, 75, 1137. [Google Scholar] [CrossRef]
- Faradonbeh, R.S.; Monjezi, M. Prediction and minimization of blast-induced ground vibration using two robust meta-heuristic algorithms. Eng. Comput. 2017, 33, 835–851. [Google Scholar] [CrossRef]
- Xu, S.; Li, Y.; Liu, J.; Zhang, F. Optimization of blasting parameters for an underground mine through prediction of blasting vibration. J. Vib. Control 2019, 25, 1585–1595. [Google Scholar] [CrossRef]
- Bayat, P.; Monjezi, M.; Rezakhah, M.; Armaghani, D.J. Artificial Neural Network and Firefly Algorithm for Estimation and Minimization of Ground Vibration Induced by Blasting in a Mine. Nat. Resour. Res. 2020, 29, 4121–4132. [Google Scholar] [CrossRef]
- Giustolisi, O. Using genetic programming to determine Chezy resistance coefficient in corrugated channels. J. Hydroinform. 2004, 6, 157–173. [Google Scholar] [CrossRef]
- Rudin, C. Stop explaining black box machine learning models for high stakes decisions and use interpretable models instead. Nat. Mach. Intell. 2019, 1, 206–215. [Google Scholar] [CrossRef] [Green Version]
- Monjezi, M.; Hasanipanah, M.; Khandelwal, M. Evaluation and prediction of blast-induced ground vibration at Shur River Dam, Iran, by artificial neural network. Neural Comput. Appl. 2013, 22, 1637–1643. [Google Scholar] [CrossRef]
- Ke, B.; Nguyen, H.; Bui, X.-N.; Costache, R. Estimation of Ground Vibration Intensity Induced by Mine Blasting using a State-of-the-Art Hybrid Autoencoder Neural Network and Support Vector Regression Model. Nat. Resour. Res. 2021, 30, 3853–3864. [Google Scholar] [CrossRef]
- Nguyen, H.; Bui, X.-N. A Novel Hunger Games Search Optimization-Based Artificial Neural Network for Predicting Ground Vibration Intensity Induced by Mine Blasting. Nat. Resour. Res. 2021, 30, 3865–3880. [Google Scholar] [CrossRef]
- Singh, T. Artificial neural network approach for prediction and control of ground vibrations in mines. Min. Technol. 2004, 113, 251–256. [Google Scholar] [CrossRef]
- Nguyen, H.; Bui, X.-N.; Tran, Q.-H.; Nguyen, H.A.; Nguyen, D.-A.; Hoa, L.T.T.; Le, Q.-T. Prediction of ground vibration intensity in mine blasting using the novel hybrid MARS–PSO–MLP model. Eng. Comput. 2021. [Google Scholar] [CrossRef]
- Singh, T.N.; Dontha, L.K.; Bhardwaj, V. Study into blast vibration and frequency using ANFIS and MVRA. Min. Technol. 2008, 117, 116–121. [Google Scholar] [CrossRef]
- Lawal, A.I.; Olajuyi, S.I.; Kwon, S.; Onifade, M. A comparative application of the Buckingham π (pi) theorem, white-box ANN, gene expression programming, and multilinear regression approaches for blast-induced ground vibration prediction. Arab. J. Geosci. 2021, 14, 1073. [Google Scholar] [CrossRef]
- Singh, T.N.; Verma, A.K. Sensitivity of total charge and maximum charge per delay on ground vibration. Geomat. Nat. Hazards Risk 2010, 1, 259–272. [Google Scholar] [CrossRef]
- Monjezi, M.; Ghafurikalajahi, M.; Bahrami, A. Prediction of blast-induced ground vibration using artificial neural networks. Tunn. Undergr. Space Technol. 2011, 26, 46–50. [Google Scholar] [CrossRef]
- Khandelwal, M.; Singh, T. Prediction of blast-induced ground vibration using artificial neural network. Int. J. Rock Mech. Min. Sci. 2009, 46, 1214–1222. [Google Scholar] [CrossRef]
- Khandelwal, M. Evaluation and prediction of blast-induced ground vibration using support vector machine. Int. J. Rock Mech. Min. Sci. 2010, 47, 509–516. [Google Scholar] [CrossRef]
- Khandelwal, M.; Singh, T. Evaluation of blast-induced ground vibration predictors. Soil Dyn. Earthq. Eng. 2007, 27, 116–125. [Google Scholar] [CrossRef]
- Monjezi, M.; Ahmadi, M.; Sheikhan, M.; Bahrami, A.; Salimi, A. Predicting blast-induced ground vibration using various types of neural networks. Soil Dyn. Earthq. Eng. 2010, 30, 1233–1236. [Google Scholar] [CrossRef]
- Yu, C.; Koopialipoor, M.; Murlidhar, B.R.; Mohammed, A.S.; Armaghani, D.J.; Mohamad, E.T.; Wang, Z. Optimal ELM–Harris Hawks Optimization and ELM–Grasshopper Optimization Models to Forecast Peak Particle Velocity Resulting from Mine Blasting. Nat. Resour. Res. 2021, 30, 2647–2662. [Google Scholar] [CrossRef]
- Mohamed, M.T. Performance of fuzzy logic and artificial neural network in prediction of ground and air vibrations. Int. J. Rock Mech. Min. Sci. 2011, 48, 845–851. [Google Scholar] [CrossRef]
- Khandelwal, M.; Kumar, D.L.; Yellishetty, M. Application of soft computing to predict blast-induced ground vibration. Eng. Comput. 2011, 27, 117–125. [Google Scholar] [CrossRef]
- Singh, J.; Verma, A.K.; Banka, H.; Singh, T.N.; Maheshwar, S. A study of soft computing models for prediction of longitudinal wave velocity. Arab. J. Geosci. 2016, 9, 224. [Google Scholar] [CrossRef]
- Zhou, J.; Qiu, Y.; Khandelwal, M.; Zhu, S.; Zhang, X. Developing a hybrid model of Jaya algorithm-based extreme gradient boosting machine to estimate blast-induced ground vibrations. Int. J. Rock Mech. Min. Sci. 2021, 145, 104856. [Google Scholar] [CrossRef]
- Mohamed, M.T. Artificial neural network for prediction and control of blasting vibrations in Assiut (Egypt) limestone quarry. Int. J. Rock Mech. Min. Sci. 2009, 46, 426–431. [Google Scholar] [CrossRef]
- Rana, A.; Bhagat, N.K.; Jadaun, G.P.; Rukhaiyar, S.; Pain, A.; Singh, P.K. Predicting Blast-Induced Ground Vibrations in Some Indian Tunnels: A Comparison of Decision Tree, Artificial Neural Network and Multivariate Regression Methods. Min. Met. Explor. 2020, 37, 1039–1053. [Google Scholar] [CrossRef]
- Verma, A.; Singh, T.N. Comparative study of cognitive systems for ground vibration measurements. Neural Comput. Appl. 2013, 22, 341–350. [Google Scholar] [CrossRef]
- Verma, A.K.; Singh, T.N. Intelligent systems for ground vibration measurement: A comparative study. Eng. Comput. 2011, 27, 225–233. [Google Scholar] [CrossRef]
- Ghasemi, E.; Ataei, M.; Hashemolhosseini, H. Development of a fuzzy model for predicting ground vibration caused by rock blasting in surface mining. J. Vib. Control 2013, 19, 755–770. [Google Scholar] [CrossRef]
- Ghasemi, E.; Kalhori, H.; Bagherpour, R. A new hybrid ANFIS–PSO model for prediction of peak particle velocity due to bench blasting. Eng. Comput. 2016, 32, 607–614. [Google Scholar] [CrossRef]
- Bui, X.-N.; Nguyen, H.; Tran, Q.-H.; Nguyen, D.-A.; Bui, H.-B. Predicting Ground Vibrations Due to Mine Blasting Using a Novel Artificial Neural Network-Based Cuckoo Search Optimization. Nat. Resour. Res. 2021, 30, 2663–2685. [Google Scholar] [CrossRef]
- Dehghani, H.; Ataee-Pour, M. Development of a model to predict peak particle velocity in a blasting operation. Int. J. Rock Mech. Min. Sci. 2011, 48, 51–58. [Google Scholar] [CrossRef]
- Zhongya, Z.; Xiaoguang, J. Prediction of Peak Velocity of Blasting Vibration Based on Artificial Neural Network Optimized by Dimensionality Reduction of FA-MIV. Math. Probl. Eng. 2018, 2018, 8473547. [Google Scholar] [CrossRef]
- Armaghani, D.J.; Kumar, D.; Samui, P.; Hasanipanah, M.; Roy, B. A novel approach for forecasting of ground vibrations resulting from blasting: Modified particle swarm optimization coupled extreme learning machine. Eng. Comput. 2021, 37, 3221–3235. [Google Scholar] [CrossRef]
- Faradonbeh, R.S.; Armaghani, D.J.; Monjezi, M.; Mohamad, E.T. Genetic programming and gene expression programming for flyrock assessment due to mine blasting. Int. J. Rock Mech. Min. Sci. 2016, 88, 254–264. [Google Scholar] [CrossRef]
- Mokfi, T.; Shahnazar, A.; Bakhshayeshi, I.; Derakhsh, A.M.; Tabrizi, O. Proposing of a new soft computing-based model to predict peak particle velocity induced by blasting. Eng. Comput. 2018, 34, 881–888. [Google Scholar] [CrossRef]
- Lawal, A.I.; Kwon, S.; Hammed, O.S.; Idris, M.A. Blast-induced ground vibration prediction in granite quarries: An application of gene expression programming, ANFIS, and sine cosine algorithm optimized ANN. Int. J. Min. Sci. Technol. 2021, 31, 265–277. [Google Scholar] [CrossRef]
- Hajihassani, M.; Armaghani, D.J.; Marto, A.; Mohamad, E.T. Vibrations au sol prédiction dans quarry dynamitage à travers un réseau neural artificiel optimisé par une concurrence impérialiste algorithme. Bull. Eng. Geol. Environ. 2015, 74, 873–886. [Google Scholar] [CrossRef]
- Chen, W.; Hasanipanah, M.; Rad, H.N.; Armaghani, D.J.; Tahir, M.M. A new design of evolutionary hybrid optimization of SVR model in predicting the blast-induced ground vibration. Eng. Comput. 2021, 37, 1455–1471. [Google Scholar] [CrossRef]
- Peng, K.; Zeng, J.; Armaghani, D.J.; Hasanipanah, M.; Chen, Q. A Novel Combination of Gradient Boosted Tree and Optimized ANN Models for Forecasting Ground Vibration Due to Quarry Blasting. Nat. Resour. Res. 2021, 30, 4657–4671. [Google Scholar] [CrossRef]
- Hasanipanah, M.; Faradonbeh, R.S.; Amnieh, H.B.; Armaghani, D.J.; Monjezi, M. Forecasting blast-induced ground vibration developing a CART model. Eng. Comput. 2016, 33, 307–316. [Google Scholar] [CrossRef]
- Hudaverdi, T.; Akyildiz, O. Prediction and evaluation of blast-induced ground vibrations for structural damage and human response. Arab. J. Geosci. 2021, 14, 378. [Google Scholar] [CrossRef]
- Zhu, W.; Rad, H.N.; Hasanipanah, M. A chaos recurrent ANFIS optimized by PSO to predict ground vibration generated in rock blasting. Appl. Soft Comput. 2021, 108, 107434. [Google Scholar] [CrossRef]
- Shahnazar, A.; Rad, H.N.; Hasanipanah, M.; Tahir, M.M.; Jahed Armaghani, D.; Ghoroqi, M. A new developed approach for the prediction of ground vibration using a hybrid PSO-optimized ANFIS-based model. Environ. Earth Sci. 2017, 76, 527. [Google Scholar] [CrossRef]
- Hasanipanah, M.; Monjezi, M.; Shahnazar, A.; Jahed Armaghani, D.; Farazmand, A. Feasibility of indirect determination of blast induced ground vibration based on support vector machine. Meas. J. Int. Meas. Confed. 2015, 75, 289–297. [Google Scholar] [CrossRef]
- Shahri, A.A.; Pashamohammadi, F.; Asheghi, R.; Shahri, H.A. Automated intelligent hybrid computing schemes to predict blasting induced ground vibration. Eng. Comput. 2021, 1–5. [Google Scholar] [CrossRef]
- Saadat, M.; Khandelwal, M.; Monjezi, M. An ANN-based approach to predict blast-induced ground vibration of Gol-E-Gohar iron ore mine, Iran. J. Rock Mech. Geotech. Eng. 2014, 6, 67–76. [Google Scholar] [CrossRef]
- Álvarez-Vigil, A.E.; González-Nicieza, C.; López Gayarre, F.; Álvarez-Fernández, M.I. Predicting blasting propagation velocity and vibration frequency using artificial neural networks. Int. J. Rock Mech. Min. Sci. 2012, 55, 108–116. [Google Scholar] [CrossRef]
- Amini, H.; Gholami, R.; Monjezi, M.; Torabi, S.R.; Zadhesh, J. Evaluation of flyrock phenomenon due to blasting operation by support vector machine. Neural Comput. Appl. 2012, 21, 2077–2085. [Google Scholar] [CrossRef]
- Khandelwal, M.; Armaghani, D.J.; Faradonbeh, R.S.; Yellishetty, M.; Majid, M.Z.A.; Monjezi, M. Classification and regression tree technique in estimating peak particle velocity caused by blasting. Eng. Comput. 2017, 33, 45–53. [Google Scholar] [CrossRef]
- Iphar, M.; Yavuz, M.; Ak, H. Prediction of ground vibrations resulting from the blasting operations in an open-pit mine by adaptive neuro-fuzzy inference system. Environ. Earth Sci. 2008, 56, 97–107. [Google Scholar] [CrossRef]
- Armaghani, D.J.; Hajihassani, M.; Mohamad, E.T.; Marto, A.; Noorani, S.A. Blasting-induced flyrock and ground vibration prediction through an expert artificial neural network based on particle swarm optimization. Arab. J. Geosci. 2013, 7, 5383–5396. [Google Scholar] [CrossRef]
- Lapčević, R.; Kostić, S.; Pantović, R.; Vasović, N. Prediction of blast-induced ground motion in a copper mine. Int. J. Rock Mech. Min. Sci. 2014, 69, 19–25. [Google Scholar] [CrossRef]
- Mohamadnejad, M.; Gholami, R.; Ataei, M. Comparison of intelligence science techniques and empirical methods for prediction of blasting vibrations. Tunn. Undergr. Space Technol. 2012, 28, 238–244. [Google Scholar] [CrossRef]
- Monjezi, M.; Baghestani, M.; Faradonbeh, R.S.; Saghand, M.P.; Armaghani, D.J. Modification and prediction of blast-induced ground vibrations based on both empirical and computational techniques. Eng. Comput. 2016, 32, 717–728. [Google Scholar] [CrossRef]
- Li, D.T.; Yan, J.L.; Zhang, L. Prediction of Blast-Induced Ground Vibration Using Support Vector Machine by Tunnel Excavation. Appl. Mech. Mater. 2012, 170–173, 1414–1418. [Google Scholar] [CrossRef]
- Vasović, D.; Kostić, S.; Ravilić, M.; Trajković, S. Environmental impact of blasting at Drenovac limestone quarry (Serbia). Environ. Earth Sci. 2014, 72, 3915–3928. [Google Scholar] [CrossRef]
- Ragam, P.; Nimaje, D.S. Assessment of blast-induced ground vibration using different predictor approaches—A comparison. Chem. Eng. Trans. 2018, 66, 487–492. [Google Scholar] [CrossRef]
- Yang, Y.; Zhang, Q. A hierarchical analysis for rock engineering using artificial neural networks. Rock Mech. Rock Eng. 1997, 30, 207–222. [Google Scholar] [CrossRef]
- Breiman, L.; Friedman, J.H.; Olshen, R.A.; Stone, C.J. Classification and Regression Trees; Routledge: London, UK, 1984. [Google Scholar]
- Hastie, T.; Jerome, F.; Tibshirani, R. The Elements of Statistical Learning Data Mining, Inference, and Prediction, 2nd ed.; Springer: Stanford, CA, USA, 2008. [Google Scholar]
- Ramesh Murlidhar, B.; Yazdani Bejarbaneh, B.; Jahed Armaghani, D.; Mohammed, A.S.; Tonnizam Mohamad, E. Application of tree-based predictive models to forecast air overpressure induced by mine blasting. Nat. Resources Res. 2021, 30, 1865–1887. [Google Scholar] [CrossRef]
- Cortes, C.; Vladimir, V. Support-vector networks. Machine learning. IEEE Expert Syst. Appl. 1995, 20, 273–297. [Google Scholar] [CrossRef]
- Zhang, W.; Goh, A. Multivariate adaptive regression splines for analysis of geotechnical engineering systems. Comput. Geotech. 2013, 48, 82–95. [Google Scholar] [CrossRef]
- Friedman, J.H.T. Multivariate adaptive regression splines. Ann. Stat. 1991, 19, 1–67. [Google Scholar] [CrossRef]
- Gharineiat, Z.; Deng, X. Application of the Multi-Adaptive Regression Splines to Integrate Sea Level Data from Altimetry and Tide Gauges for Monitoring Extreme Sea Level Events. Mar. Geod. 2015, 38, 261–276. [Google Scholar] [CrossRef]
- Al-Sudani, Z.A.; Salih, S.Q.; Sharafati, A.; Yaseen, Z.M. Development of multivariate adaptive regression spline integrated with differential evolution model for streamflow simulation. J. Hydrol. 2019, 573, 1–12. [Google Scholar] [CrossRef]
- Chen, Z.; Li, H.; Goh, A.; Wu, C.; Zhang, W. Soil Liquefaction Assessment Using Soft Computing Approaches Based on Capacity Energy Concept. Geosciences 2020, 10, 330. [Google Scholar] [CrossRef]
- Jimeno, C.L.; Jimeno, E.L.; Carcedo, F.J.A.; De Ramiro, Y.V. Drilling and Blasting of Rocks; Routledge: London, UK, 2017. [Google Scholar]
- Choi, Y.-H.; Lee, S.S. Predictive Modelling for Blasting-Induced Vibrations from Open-Pit Excavations. Appl. Sci. 2021, 11, 7487. [Google Scholar] [CrossRef]
- Taylor, K.E. Summarizing multiple aspects of model performance in a single diagram. J. Geophys. Res. Atmos. 2001, 106, 7183–7192. [Google Scholar] [CrossRef]
- He, Z.; Armaghani, D.J.; Masoumnezhad, M.; Khandelwal, M.; Zhou, J.; Murlidhar, B.R. A Combination of Expert-Based System and Advanced Decision-Tree Algorithms to Predict Air-Overpressure Resulting from Quarry Blasting. Nat. Resour. Res. 2021, 30, 1889–1903. [Google Scholar] [CrossRef]


| No. | Mines | Company |
|---|---|---|
| 1 | Chandan Coal Mine, Jharia | Bharat Cooking Coal Limited |
| 2 | Patherdih Coal Mine, Jharia | Bharat Cooking Coal Limited |
| 3 | Bera Coal Mine, Bastacola | Bharat Cooking Coal Limited |
| 4 | Golakdih Coal Mine, Bastacola | Bharat Cooking Coal Limited |
| 5 | Jogidih Coal Mine, Govindpur | Bharat Cooking Coal Limited |
| 6 | Dahibari Coal Mine, Chanch Victoria Area | Bharat Cooking Coal Limited |
| 7 | Gopalichuk Coal Mine, Pootkee Balihari Area | Bharat Cooking Coal Limited |
| 8 | Bagdigi Coal Mine, Lodna | Bharat Cooking Coal Limited |
| 9 | Tetulmari Coal Mine, Sijua Area | Bharat Cooking Coal Limited |
| 10 | Kujama Coal Mine, Bastacola | Bharat Cooking Coal Limited |
| 11 | Bhanora Coal Mine, Sripur area | Eastern Coalfields Limited |
| 12 | Magadh Coal Mine, Magadh Amrapali Area | Central Coalfields Limited |
| 13 | Pakri Barwadih Coal Mine, Barakagaon | National Thermal Power Corporation |
| 14 | Tasra Coal Mine, Jharia | Steel Authority of India Limited |
| 15 | Bermo Coal Mine, Bokaro | Damodar Valley Corporation |
| 16 | Jamuna Coal Mine, Jamuna and Kotma Area | South Eastern Coalfields Limited |
| 17 | Ramagundam-III Area Coal Mine, Peddapalli | Singareni Collieries Company Limited |
| 18 | Aditya Cement Limestone Mine, Shambhupura | M/S Ultratech Cement |
| 19 | Adhunik Cement Limestone Mine, Meghalaya | Adhunik Cement Limestone Mine |
| 20 | Manal Limestone Mine, Rajban | Cement Corporation of India Limited |
| 21 | Daroli Limestone Mine, Udaipur | Daroli Limestone Mines |
| 22 | SK2 Block Vikram Limestone Mine, Khor | Vikram Cement works |
| 23 | Karunda Limestone Mine, Chittorgarh | J K Cement |
| 24 | Malikhera Limestone Mine, Chittorgarh | J K Cement |
| 25 | Murlia Block Limestone Mine, Chandrapur | Murli Industries Limited |
| 26 | Jhamarkotra Rock Phosphate Mine, Udaipur | Rajasthan State Mines and Minerals Limited |
| 27 | Sanchali Calcite Mine, Udaipur | M/s Wollmine India Pvt. Limited |
| 28 | Guali Iron Ore Mine, Topadihi | M/s R. Sao |
| 29 | Narayanposhi Iron and Manganese Ore Mine Koria, Sundergarh | M/s Aryan Mining and Trending Corp. Limited |
| 30 | Balda Block Iron Ore Mine, Keonjhar | M/s Serajuddin and Company, Orissa |
| 31 | Banduhurang Opencast Uranium Mines | Uranium Corporation of India Limited |
| 32 | Obra Stone Mine (Dolomite quarry) | M/s B. Agarwal Stone Products Limited, Sonebhadra |
| 33 | Pachami Hatgacha Stone Mining, Birbhum | West Bengal Mineral Development and Trading Corporation Limited |
| 34 | Granite aggregate quarry, Setto, Benin republic | OKOUTA CARRIERES SA |
| Parameters | Unit | Symbol | Category | Min | Max | Mean | Median | Sd. Dev |
|---|---|---|---|---|---|---|---|---|
| Hole diameter | mm | HDM | Input | 32 | 269 | 126.5 | 115 | 32.04 |
| Hole depth | m | HD | Input | 0.7 | 13.5 | 6.59 | 6.2 | 2.28 |
| Number of holes | - | NH | Input | 1 | 199 | 31.52 | 21 | 33.06 |
| Burden | m | B | Input | 0.6 | 9 | 3.13 | 3 | 1.05 |
| Spacing | m | S | Input | 0.6 | 10 | 4.04 | 3.5 | 1.52 |
| stemming length | m | SL | Input | 0.5 | 7 | 3.04 | 3 | 0.94 |
| Charge per hole | kg | CPH | Input | 0.17 | 400.75 | 39.2 | 32.14 | 36.49 |
| Total charge | kg | TC | Input | 5.56 | 41294 | 1390.86 | 544.46 | 2767.81 |
| Maximum charge per delay | kg | MCPD | Input | 2.19 | 2545.5 | 85.92 | 45.5 | 169.98 |
| Monitoring distance | m | D | Input | 25 | 1500 | 321.36 | 293 | 185.45 |
| Peak particle velocity | mm/s | PPV | Output | 0.22 | 43.59 | 3.37 | 2.44 | 3.12 |
| Name | Equations |
|---|---|
| USBM | |
| Langefors–Kihlstrom (L–K) | |
| Ambraseys–Hendron (A–H) | |
| IS | |
| CMRI |
| Parameters | Coefficients | Standard Error | t Stat | p-Value |
|---|---|---|---|---|
| Intercept | 1.9830 | 0.5470 | 3.6254 | 0.0003 |
| HDM | 0.0171 | 0.0044 | 3.8961 | 0.0001 |
| HD | 0.2007 | 0.0622 | 3.2266 | 0.0013 |
| NH | −0.0053 | 0.0042 | −1.2416 | 0.2148 |
| B | 0.0350 | 0.2057 | 0.1704 | 0.8648 |
| S | 0.5605 | 0.1422 | 3.9411 | 0.0001 |
| SL | −0.1010 | 0.1309 | −0.7714 | 0.4407 |
| CPH | −0.0163 | 0.0048 | −3.4138 | 0.0007 |
| TC | 0.0003 | 0.0001 | 4.2827 | 0.0000 |
| MCPD | −0.000019 | 0.0009 | −0.0205 | 0.9837 |
| D | 0.011698 | 0.0006 | −20.6706 | 0.0000 |
| Name/References | Constant Coefficients | Performance Indices | |||||
|---|---|---|---|---|---|---|---|
| Training | Testing | ||||||
| K | B | n | RMSE | R2 | RMSE | R2 | |
| USBM | 66.676 | 0.902 | - | 2.369 | 0.467 | 0.918 | 0.630 |
| L-K | 1.567 | 0.220 | - | 2.370 | 0.062 | 1.405 | 0.096 |
| A-H | 211.910 | 1.034 | - | 2.328 | 0.513 | 0.855 | 0.673 |
| IS | 2.313 | 0.346 | - | 3.213 | 0.150 | 1.324 | 0.223 |
| CMRI | 85.482 | - | 0.478 | 2.318 | 0.471 | 0.890 | 0.622 |
| ccp_alpha | Training | Testing | ||
|---|---|---|---|---|
| RMSE | R2 | RMSE | R2 | |
| 0.001 | 0.016 | 0.890 | 1.135 | 0.733 |
| 0.002 | 0.145 | 0.881 | 1.235 | 0.707 |
| 0.003 | 0.169 | 0.860 | 1.262 | 0.701 |
| 0.004 | 0.263 | 0.858 | 1.278 | 0.693 |
| 0.005 | 0.384 | 0.854 | 1.284 | 0.688 |
| 0.006 | 0.454 | 0.851 | 1.284 | 0.680 |
| 0.007 | 0.484 | 0.844 | 1.284 | 0.690 |
| 0.008 | 0.483 | 0.845 | 1.270 | 0.690 |
| 0.009 | 0.531 | 0.834 | 1.170 | 0.680 |
| 0.01 | 0.524 | 0.834 | 1.139 | 0.744 |
| 0.011 | 0.536 | 0.833 | 1.141 | 0.742 |
| 0.012 | 0.550 | 0.813 | 1.268 | 0.694 |
| 0.013 | 0.584 | 0.823 | 1.273 | 0.692 |
| 0.014 | 0.599 | 0.821 | 1.212 | 0.716 |
| 0.015 | 0.623 | 0.816 | 1.258 | 0.698 |
| 0.016 | 0.664 | 0.809 | 1.280 | 0.689 |
| 0.017 | 0.681 | 0.805 | 1.283 | 0.689 |
| 0.018 | 0.690 | 0.804 | 1.291 | 0.704 |
| 0.019 | 0.690 | 0.804 | 1.243 | 0.704 |
| 0.02 | 0.709 | 0.800 | 1.247 | 0.702 |
| 0.021 | 0.730 | 0.796 | 1.294 | 0.684 |
| 0.022 | 0.740 | 0.794 | 1.295 | 0.683 |
| 0.023 | 0.740 | 0.794 | 1.247 | 0.702 |
| 0.024 | 0.773 | 0.787 | 1.295 | 0.684 |
| 0.025 | 0.796 | 0.782 | 1.308 | 0.678 |
| c | Training | Testing | c | Training | Testing | ||||
|---|---|---|---|---|---|---|---|---|---|
| RMSE | R2 | RMSE | R2 | RMSE | R2 | RMSE | R2 | ||
| 1 | 2.2819 | 0.4879 | 1.619 | 0.6739 | 120 | 0.7502 | 0.9446 | 1.0437 | 0.8644 |
| 2 | 2.0996 | 0.5664 | 1.4207 | 0.7489 | 128 | 0.7367 | 0.9462 | 1.0424 | 0.8648 |
| 4 | 1.8943 | 0.647 | 1.2273 | 0.8126 | 130 | 0.7367 | 0.9466 | 1.0423 | 0.8648 |
| 8 | 1.6598 | 0.729 | 1.0635 | 0.8592 | 140 | 0.7247 | 0.9483 | 1.0441 | 0.8643 |
| 10 | 1.5724 | 0.7568 | 1.0266 | 0.8688 | 150 | 0.7169 | 0.9494 | 1.0488 | 0.8631 |
| 16 | 1.3689 | 0.8157 | 0.9896 | 0.8781 | 160 | 0.7054 | 0.951 | 1.0555 | 0.8614 |
| 20 | 1.25 | 0.8452 | 0.9966 | 0.8764 | 170 | 0.6945 | 0.9525 | 1.0608 | 0.86 |
| 30 | 1.0378 | 0.894 | 0.9967 | 0.8764 | 180 | 0.6844 | 0.9539 | 1.0642 | 0.8591 |
| 32 | 1.0047 | 0.9007 | 0.9981 | 0.876 | 190 | 0.6749 | 0.9551 | 1.0665 | 0.8584 |
| 40 | 0.9122 | 0.9181 | 0.9931 | 0.8773 | 200 | 0.6666 | 0.9562 | 1.0685 | 0.8579 |
| 50 | 0.8694 | 0.9256 | 0.9964 | 0.8764 | 300 | 0.6064 | 0.9638 | 1.0894 | 0.8523 |
| 60 | 0.8445 | 0.9298 | 1.0073 | 0.8737 | 500 | 0.5691 | 0.9681 | 1.1134 | 0.8457 |
| 64 | 0.8366 | 0.9311 | 1.0097 | 0.8731 | 1000 | 0.533 | 0.972 | 1.166 | 0.8308 |
| 70 | 0.8267 | 0.9327 | 1.0146 | 0.8719 | 5000 | 0.4513 | 0.9799 | 1.3085 | 0.7869 |
| 80 | 0.8115 | 0.9352 | 1.0289 | 0.8682 | 10000 | 0.4189 | 0.9827 | 1.3823 | 0.7622 |
| 90 | 0.7951 | 0.9378 | 1.0344 | 0.8668 | 50000 | 0.347 | 0.9881 | 2.0686 | 0.4677 |
| 100 | 0.7789 | 0.94033 | 1.0394 | 0.8656 | 100000 | 0.3258 | 0.9895 | 2.786 | 0.3681 |
| 110 | 0.7643 | 0.9425 | 1.0431 | 0.8646 |
| Minispan/Endspan Alpha | Training | Testing | ||
|---|---|---|---|---|
| RMSE | R2 | RMSE | R2 | |
| 0.01 | 0.413 | 0.935 | 0.601 | 0.875 |
| 0.05 | 0.463 | 0.927 | 0.227 | 0.951 |
| 0.1 | 0.439 | 0.931 | 0.476 | 0.905 |
| 0.15 | 0.440 | 0.931 | 0.523 | 0.894 |
| 0.2 | 0.440 | 0.931 | 0.523 | 0.894 |
| 0.25 | 0.468 | 0.926 | 0.559 | 0.886 |
| 0.3 | 0.468 | 0.926 | 0.559 | 0.886 |
| 0.35 | 0.468 | 0.926 | 0.559 | 0.886 |
| 0.4 | 0.468 | 0.926 | 0.559 | 0.886 |
| 0.45 | 0.440 | 0.931 | 0.499 | 0.899 |
| 0.5 | 0.440 | 0.931 | 0.499 | 0.899 |
| 0.55 | 0.440 | 0.931 | 0.499 | 0.899 |
| 0.6 | 0.425 | 0.933 | 0.577 | 0.881 |
| 0.65 | 0.457 | 0.928 | 0.494 | 0.901 |
| 0.7 | 0.430 | 0.932 | 0.599 | 0.876 |
| 0.75 | 0.456 | 0.928 | 0.583 | 0.880 |
| 0.8 | 0.456 | 0.928 | 0.583 | 0.880 |
| 0.85 | 0.456 | 0.928 | 0.583 | 0.880 |
| 0.9 | 0.488 | 0.923 | 0.538 | 0.891 |
| 0.95 | 0.488 | 0.923 | 0.538 | 0.891 |
| 1 | 0.334 | 0.947 | 0.628 | 0.869 |
| Basis Function | Co-Efficient | Basis Function | Co-Efficient |
|---|---|---|---|
| Intercept () | 1.960120000 | BF17 = h(145−NH)*B*h(341−D) | −0.000145193 |
| BF1 = h(D−341) | −0.002770310 | BF18 = SL*TC*h(1130−TC) | −0.000002270 |
| BF2 = h(S−7.5)*h(341−D) | 0.402890000 | BF19 = MCPD*h(408−D)*h(156.25−CPH) | 0.000001079 |
| BF3 = h(10000−TC)*h(341−D) | 0.000003126 | BF20 = h(NH−145)*B*h(12.25−HD) | 0.001295930 |
| BF4 = D*h(341−D) | −0.000149723 | BF21 = h(HDM−260)*h(CPH−156.25) | 0.001648200 |
| BF5 = TC*h(10000−TC)*h(341−D) | 0.000000001 | BF22 = h(408−D) | −0.023060800 |
| BF6 = B*h(341−D) | 0.018892700 | BF23 = D*D*h(341−D) | 0.000000465 |
| BF7 = MCPD*h(7.5−S)*h(341−D) | −0.000095901 | BF24 = h(S−7.5)*HDM*h(12.25−HD) | −0.002203750 |
| BF8 = MCPD*B*h(341−D) | −0.000123622 | BF25 = h(7.5−S)*HDM*h(12.25−HD) | −0.000569359 |
| BF9 = S*h(10000−TC)*h(341−D) | 0.000001058 | BF26 = HDM*B*h(341−D) | 0.000183443 |
| BF10 = h(408−D)*h(156.25−CPH) | −0.000181658 | BF27 = SL*HDM*h(12.25−HD) | 0.000580015 |
| BF11 = HD*h(408−D)*h(156.25−CPH) | 0.000017127 | BF28 = MCPD*h(341−D) | 0.000683227 |
| BF12 = h(145−NH)*h(408−D)*h(156.25−CPH) | 0.000002181 | BF29 = SL*B*h(341−D) | −0.002187630 |
| BF13 = TC*h(1130−TC) | 0.000008631 | BF30 = B*B*h(341−D) | −0.003844060 |
| BF14 = HDM*h(1130−TC) | −0.000025563 | BF31 = HDM*h(10000−TC)*h(341−D) | −0.000000028 |
| BF15 = HDM*HDM*h(1130−TC) | 0.000000146 | BF32 = HDM*D*h(341−D) | −0.000001313 |
| BF16 = h(NH−145)*B*h(341−D) | −0.001396160 | ||
| Resulting expression | |||
| Model | Training | Testing | ||
|---|---|---|---|---|
| RMSE | R2 | RMSE | R2 | |
| USBM | 2.369 | 0.489 | 0.918 | 0.630 |
| Langefors–Kihlstrom | 2.370 | 0.001 | 1.405 | 0.096 |
| Ambraseys–Hendron | 2.328 | 0.493 | 0.855 | 0.673 |
| ISI | 3.213 | 0.144 | 1.324 | 0.223 |
| CMRI predictor | 2.318 | 0.482 | 0.890 | 0.621 |
| MLR | 2.503 | 0.384 | 1.095 | 0.400 |
| CART | 0.524 | 0.834 | 1.138 | 0.744 |
| SVR | 1.005 | 0.90 | 0.998 | 0.876 |
| MARS | 0.463 | 0.927 | 0.227 | 0.951 |
Publisher’s Note: MDPI stays neutral with regard to jurisdictional claims in published maps and institutional affiliations. |
© 2022 by the authors. Licensee MDPI, Basel, Switzerland. This article is an open access article distributed under the terms and conditions of the Creative Commons Attribution (CC BY) license (https://creativecommons.org/licenses/by/4.0/).
Share and Cite
Komadja, G.C.; Rana, A.; Glodji, L.A.; Anye, V.; Jadaun, G.; Onwualu, P.A.; Sawmliana, C. Assessing Ground Vibration Caused by Rock Blasting in Surface Mines Using Machine-Learning Approaches: A Comparison of CART, SVR and MARS. Sustainability 2022, 14, 11060. https://doi.org/10.3390/su141711060
Komadja GC, Rana A, Glodji LA, Anye V, Jadaun G, Onwualu PA, Sawmliana C. Assessing Ground Vibration Caused by Rock Blasting in Surface Mines Using Machine-Learning Approaches: A Comparison of CART, SVR and MARS. Sustainability. 2022; 14(17):11060. https://doi.org/10.3390/su141711060
Chicago/Turabian StyleKomadja, Gbétoglo Charles, Aditya Rana, Luc Adissin Glodji, Vitalis Anye, Gajendra Jadaun, Peter Azikiwe Onwualu, and Chhangte Sawmliana. 2022. "Assessing Ground Vibration Caused by Rock Blasting in Surface Mines Using Machine-Learning Approaches: A Comparison of CART, SVR and MARS" Sustainability 14, no. 17: 11060. https://doi.org/10.3390/su141711060