
Impact of Heterogeneous Spatial Structure on Regional Innovation—From the Perspectives of Efficiency and Gap
1
School of Business, Hohai University, Nanjing 211100, China
2
Collaborative Innovation Center between World Water Valley and Water Ecological Civilization, Nanjing 211100, China
*
Author to whom correspondence should be addressed.
Sustainability 2022, 14(19), 12095; https://doi.org/10.3390/su141912095
Submission received: 7 August 2022
/
Revised: 19 September 2022
/
Accepted: 20 September 2022
/
Published: 24 September 2022
(This article belongs to the Collection Technological Innovation and Economic Growth)
Abstract
:Reasonable spatial system distribution is the prerequisite for the optimization of resource and spatial allocation and the coordinated development of the regional economy. Therefore, correctly identifying the impact of different types of spatial structures on scientific and technological innovation is an important way to promote the rational layout of regional spatial structures and enhance the strength of regional scientific and technological innovation. Based on the theory of regional spatial structure and panel data of 26 provinces and autonomous regions in China from 2005 to 2019, this paper tested the impact of regional spatial structure on innovation efficiency and gap by constructing the regional spatial structure index, the innovation efficiency index, and the innovation gap index. The research results show that: First, the agglomeration effect produced by a single-center spatial structure is conducive to improving the efficiency of scientific and technological innovation, whereas the spillover effect generated by a multi-center spatial structure is more favorable for narrowing the gap in scientific and technological innovation. Second, the single-center spatial structure is more suitable for provinces and cities in the western region with relatively low levels of economic development, whereas the multi-center spatial structure is more beneficial to the achievement of innovative and high-quality development in the eastern region. Third, the moderating effect analysis shows that with an increase in cultural diversity and inter-city distance, the partial effects of the single-center spatial structure on innovation efficiency present an “N” shape and an “inverted-U” shape, respectively, whereas the partial effects of the multi-center spatial structure on the innovation gap exhibit “inverted-U” shapes. This research not only provides theoretical support for the impact of regional spatial structure on innovation efficiency and gap but also offers empirical evidence for future regional development path choices.
1. Introduction
Since 2010, China’s economic growth rate has shown a clear trend of fluctuation and decline. From 2010 to 2019, the annual growth rate of China’s GDP dropped from 10.64% to 6.11%. It can be seen that although China has realized its new normal of transition from high-speed growth to medium-high growth in the current stage of economic development, the problem of a conversion fault between old and new kinetic energy caused by the rapid decline in traditional kinetic energy and the insufficient growth of emerging kinetic energy is still serious. Technological innovation is the primary driving force for development and implementing an innovation-driven development strategy is conducive to accelerating the conversion from old kinetic energy into new kinetic energy. In fact, the CPC and the Chinese government have always been committed to improving the level of regional innovation and have achieved remarkable results. As shown in the 2019 World Intellectual Property Report, Shanghai and Beijing have become two of the top ten global innovation hotspot cities, whereas the regional innovation capabilities of Guangdong, Zhejiang, and Jiangsu in the eastern coastal area have also been significantly improved. At the same time, some cities in the central and western areas are gradually converging toward high-level innovation cities. The 2019 China Regional Innovation Capability Evaluation Report shows that the innovation and development capabilities of Chongqing, Hubei, and Anhui have ranked among the top 10 in China. However, in the current stage, there is still a lot of room for improvement in the development of China’s scientific and technological innovation. In addition, with the further escalation and proliferation of Sino–US trade frictions, as well as the restriction and suppression of China’s high-tech enterprises and technologies by the US, there is a more urgent need for China to accelerate scientific and technological innovation.
The adjustment of regional spatial structure has always been considered one of the important ways to promote regional development, namely allocating and combining scattered resources and elements through a spatial organization to improve the utilization efficiency of elements and resources (Zheng, 2014) [1]. In general, from the perspectives of morphology and function, regional spatial structure can be divided into two types: single-center spatial structure and multi-center spatial structure (Yu et al., 2022) [2]. As a model for implementing spatial structure-driven strategies (Spyra et al., 2021; Dembińska et al., 2022) [3,4], the EU has been continuously promoting the project process of spatial structure-driven regional sustainable development, from the European Spatial Development Planning Network (ESDP), Sustainable Development Management of European Polycentric Mega-City Regions (POLYNET), to the European Spatial Planning Observation Network (ESPON). Similarly, whether it is the construction of large-scale urban agglomerations, such as the Beijing-Tianjin-Hebei region, the Yangtze River Delta, and the Guangdong-Hong Kong-Macao Greater Bay Area, or the establishment of nine national central cities, such as Beijing, Shanghai, and Guangzhou on a small scale, it is clear that both central and local governments in China are trying to seek spatial balance with the strategy of spatial structure and promote the coordinated development of different regions (Wu et al., 2021; Ma et al., 2022) [5,6].
Meanwhile, active explorations have long been conducted in academia to promote the development of the urban agglomeration economy and identify the appropriate urban development model through the optimization of spatial structure. Despite lacking a unified definition, monocentricity and polycentricity are a group of close-to-intuitive and well-understood concepts that express two different distribution states (Zhang et al., 2018) [7]. In simple terms, a single center describes that most of the population or employment is concentrated in a certain center within a certain area, whereas a multi-center spatial structure describes that the population or employment is distributed to a “comparable strength” in multiple centers within a certain range (Arribas and Sanz, 2014) [8]. In addition, it should be noted that single- and multi-center have no definite dividing line. In theory, they are a series of continuous states, where the spatial structure, in reality, is mostly located (Wu, 2021) [9]. Moreover, they are a debate on the way of urban expansion or spatial growth. In particular, the spatial distribution pattern of population/employment is of crucial importance when urban population size reaches a certain threshold (Brezzi and Veneri, 2014; Rauhut, 2017; Sun and Lv, 2020) [10,11,12].
With the growing status of regional spatial structure in regional development, the economic, social, and ecological environmental effects of different spatial structures have gradually drawn the attention of the academic community. Firstly, the regional spatial structure has economic effects. Existing literature argues that different types of spatial structures have heterogeneous effects on regional economic performance (Sun et al., 2019) [13]. Some scholars believe that a single-center structure has a higher possibility of generating agglomeration economies (Burger et al., 2014) [14], which can accelerate the agglomeration and exchange of population, knowledge, and information (Zhang et al., 2020) [15] so as to take advantage of the continuous improvement of transportation, network, etc. infrastructure realizes agglomeration externalities (Li and Liu, 2018; David et al., 2022) [16,17], and then promotes the economic development of the entire region through a “point-to-surface” approach. Some scholars also maintain that the excessive agglomeration effect of a single center will bring about congestion, pollution, high housing prices, public health crises, and other agglomeration uneconomic phenomena (Chen et al., 2021) [18], and even produce agglomeration shadows (Krugman, 1993; Volgmann and Rusche, 2020) [19,20]. One of the important ways to solve the above problems is to decentralize agglomeration and give play to the scale borrowing effect (Meijers and Burge, 2017) [21]. That is to say, multiple centers are set up in a larger space (Lin, 2015) [22], which can achieve the economic benefits of scale and agglomeration through the close connection and division of labor among spatial units (Zou et al., 2020; Jun, 2020) [23,24] in order to promote high-quality regional development (Mukim, 2015; Haider et al., 2018) [25,26]. Secondly, the regional spatial structure has social effects. Existing research on the social effects of spatial structure mainly focuses on what type of spatial structure can solve social problems like income and land prices. First, a large number of scholars’ studies have shown that a single-center spatial structure is more inclined to form market segmentation under the effect of local protection, reducing employment opportunities for workers in other regions (Duranton, 2015) [27] and thus lowering income levels and widening income gaps (Garcia-López and Moreno-Monroy, 2018) [28]. Second, some scholars believe that a multi-center spatial structure may accelerate traffic congestion (Li et al., 2019) [29] and significantly inhibit high urban land price levels (Sun and Lv, 2020) [12], which however will increase the level of land prices in low sections of a city and the overall average land prices in the city (Wen and Tao, 2015) [30]. Third, the regional spatial structure has environmental effects. With the continuously deepening status of the ecological environment in regional development, some scholars have begun to probe into the impact of different types of spatial structures on the ecological environment. The research results of some scholars have suggested that urban spatial structure has a significant impact on environmental quality and energy consumption (Guo et al., 2019) [31]. Among them, the multi-center spatial structure has a more balanced job-housing distribution (Chen et al., 2021; Liu et al., 2022) [32,33], and residents have less demand for commuting (Sun et al., 2020) [34], giving rise to less environmental pollution (Xu et al., 2022) [35]. Nevertheless, some scholars hold that multi-center spatial structure may lead to urban sprawl and development (Bereitschaft and Debbage, 2013) [36], resulting in a large amount of smog and harmful gas emissions (Bai et al., 2019) [37] and thereby aggravating air pollution (Han et al., 2020) [38].
Although the impact of urban spatial structure on various aspects, such as urban economic growth, traffic congestion, and the ecological environment, has been analyzed in existing research, which provides inspiration and effective methods for this study, there are still some limitations. Firstly, few studies have explored the relationship between spatial structure and technological innovation, which is the core driving force of regional development. Secondly, there is a lack of research results on which spatial structure is more conducive to regional innovation and development. Thirdly, most existing studies have been conducted from a single dimension of efficiency or fairness rather than systematically evaluating the performance of regional spatial structure from multiple dimensions.
To sum up, the issues that this paper focuses on are: At present, under the guidance of the development strategy of building an innovative country, local governments in China are committed to formulating corresponding policies to promote the improvement of regional innovation levels. Hence, can the win-win situation of the rational development of urban spatial layout and the rapid growth of scientific and technological innovation be achieved through the adjustment of spatial structure? That is to say, which form of spatial structure is more conducive to promoting the efficiency of scientific and technological innovation? In addition, the spatial development patterns and the distribution of innovation factors across China are highly different. Is there any heterogeneity in the impact of different spatial structures on technological innovation?
To explain the above problems, this paper used the panel data of 26 Chinese provinces and autonomous regions from 2005 to 2019 and tested the effects of regional spatial structure on the efficiency and gap of technological innovation by constructing regional spatial structure, innovation efficiency, and innovation difference indices. On this basis, the moderating role of culture and inter-city distance in the impact of regional spatial structure on technological innovation was further discussed. Compared with previous studies, this research has the following possible contributions: First of all, it analyzes the impact of different spatial structures on technological innovation from the two aspects of efficiency and gap, deepening the related research on regional spatial structure effects. Secondly, it studies the moderating effects of cultural diversity and inter-city distance, revealing the boundary of the influence of different spatial structures on innovation and providing a reference for different regional governments to formulate appropriate spatial planning and innovation planning. Finally, this paper explores the regional heterogeneity of the innovation effect of spatial structure, showing that single-center spatial structures in underdeveloped areas have higher innovation efficiency but smaller innovation gaps than multi-center ones.
2. Characteristic Facts and Theoretical Analysis
2.1. Basic Characteristic Facts
The population Pareto index calculated in 2020 was used as the measurement index of the regional spatial structure index, and 26 provinces and cities across the country were divided into single- and multi-center spatial structures according to the calculation results. On this basis, the technological innovation strength, efficiency, and gap of the top 10 provinces and cities in monocentric and polycentric spatial structures were calculated, respectively.
2.1.1. Stronger Sci-Tech Innovation Capabilities of Provinces and Cities with a Single-Center Spatial Structure
As shown in Figure 1, the technological innovation input or output of provinces and cities with a single-center spatial structure is much higher than that of those with a multi-center spatial structure. From the perspective of sci-tech innovation investment, the average full-time equivalent of R&D personnel and internal expenditure of R&D funds in the top 10 provinces and cities with a single-center spatial structure in 2020 are 7.39 and 10.11 times the average of those with a multi-center spatial structure, respectively. From the perspective of sci-tech innovation output, the average number of patent grants and the main business income of high-tech industries in the top 10 provinces and cities with a single-center spatial structure are 16.25 and 29.11 times the average of those with a multi-center spatial structure, respectively. This means that a single-center spatial structure tends to have more sci-tech innovation resources with greater density compared to a multi-center spatial structure, leading to a larger agglomeration effect and higher efficiency brought about by the shared division of labor and specialization in technology. A single-center spatial structure is conducive to strengthening sci-tech innovation strength. With the reallocation of innovation resources across the country, a single-center spatial structure will be more beneficial to absorbing high-quality innovation resources, thereby enhancing the strength of regional sci-tech innovation.
2.1.2. Smaller Internal Innovation Gap between Provinces and Cities with a Multi-Center Spatial Structure
As presented in Figure 2, the innovation efficiency of regions with different spatial structures and the innovation gap between inner cities are different. Specifically, the two spatial structures are basically the same in the aspect of technological innovation efficiency. The average innovation efficiency of the top 10 provinces and cities with a single-center structure is slightly higher than that of those with a multi-center structure. This phenomenon further illustrates the agglomeration effect and scale effect brought by a single-center structure, which can promote the rational use of innovation resources, and thus better contribute to improving innovation efficiency. In terms of the innovation gap, the average innovation gap within provinces and cities with a multi-center structure is much smaller than that within those with a single-center structure. This result is basically in line with the cognition of the authors in this paper. That is, a multi-center spatial structure will promote the equal distribution of innovation resources, which is of use to the coordinated and balanced development of a region. Besides, the technological innovation network formed by a multi-center spatial structure can promote the flow of innovation elements to expedite the spillover effect of innovation, which is more conducive to narrowing the regional innovation gap.
2.2. Theoretical Analysis and Research Assumptions
2.2.1. Impact of Spatial Structure on Innovation Efficiency
Generally speaking, the innovation output of the regional innovation sector is formed by the joint action of capital, labor, and factors. In the free market without considering income distribution, therefore, its production function was assumed to conform to the standard Cobb–Douglas production function:
where A is the total factor productivity in the innovation process, which can represent innovation efficiency (Hsieh and Klenow, 2009) [39]; Y represents the output of sci-tech innovation; K denotes the capital stock of sci-tech innovation; L refers to the labor of sci-tech innovation; c and d stand for the output elasticity coefficients of innovation capital and labor, respectively. The depreciation rate of all innovative equipment was assumed to be 100%. Under the condition of constant return to scale (), the average salary of the innovation sector in city i in period t was:
where is the relative price of innovative products in period t. The region was assumed to have j cities and a first one, which can be divided into the sum of all other cities (a city) and the first one (b city). Then, the innovation production functions of a and b were: and . The total number of innovators in the region was the sum of the number of innovators in a and b, and the regional spatial structure () was the proportion of the population of the first city () to the total population in the region. The larger the index was, the higher the degree of monocentricity would be, and vice versa, the more the region tended to be polycentric:
Referring to the method of Zheng (2014) [1], the utility function of innovative talents was assumed to conform to the Cobb–Douglas production function. In the case of constant returns to scale, their income was mainly used for the consumption of sci-tech and other commodities with a unit of 1. The formula was:
where is the utility function of innovative talents in city i; represents the consumption of other commodities by innovative talents in city i; denotes the consumption of sci-tech commodities by innovative talents in city i; stands for the input of innovative labor force in city i; refers to the innovation resources of city i; is a constant; y means the elasticity of substitution between the consumption of technology and other commodities for innovative talents, with a value range of (0, 1).
Referring to the relevant research of Zou et al. (2022) [40], all the income of innovative talents in period t was assumed to come from the remuneration of labor in period t and the interest earned from savings in period t − 1. These incomes were mainly spent on technology and general consumption as well as savings. The budget constraint of the utility function of innovative talents was:
where is the salary income of innovative talents in city i at time t; represents the savings rate in city i at time t − 1; denotes the inflation rate in city i at time t; refers to the consumption of sci-tech goods in city i at time t; and are the amount of money stored in city i at time t − 1 and t, respectively.
No unemployment and population growth was assumed to occur. The only way for regional spatial structure to evolve was population flow. Whether innovative talents in city b chose to flow to city a mainly depended on the wage difference between the two cities and various costs brought about by mobility. When liquidity costs were taken into consideration, the equilibrium conditions for the innovative labor market were:
where and represent the utility function of innovative talents in cities a and b, respectively; stands for the sum of various intangible costs brought by the flow from city b to a. According to the research of Cao and Birchenall (2013) [41], the above formula can be expressed by the average salary of innovative talents:
where , is the wage gap between cities a and b, and is the discount factor. Under free market conditions, the equilibrium formula of the labor market can be expressed as:
Formulas (2) and (9) were combined to get:
where , . It can be seen from formula (11) that c, d, and are constant and the value range is between (0, 1), is the wage gap between cities a and b, and its value is greater than 1. is the relative price of an innovative product and its value is greater than 0. Hence, H is a constant and its value is positive. The value of is between (−1, 1), and the value range of is (−1, 0). To sum up, innovation efficiency (A) and regional spatial structure (S) had a positive nonlinear effect. That is, the larger the regional spatial structure index was, the higher the innovation efficiency would be under the condition of controlling innovation labor and innovation capital investment.
Hypothesis 1 (H1).
Single-center spatial structure can better promote the efficiency of regional sci-tech innovation.
2.2.2. Impact of Spatial Structure on Innovation Gap
However, previous studies have not considered the innovation gap between cities. Starting from the calculation method of spatial structure, this study believed that regions can be divided into the first city (a city) and the sum of all other cities (b city). The innovation gap is mainly composed of three aspects, namely the innovation gap within the first city, that among all other cities, and the gap between the first city and all other cities. According to the research of Shorrock and Wan (2005) [42], therefore, the overall regional innovation gap () can be expressed as:
where is the average salary of innovators in the region as a whole. Equations (8) and (12) were combined to get:
where , and are the innovation gap within the first city, that of all other cities, and the gap between all cities, respectively. Since the innovation gap considered in this study was mainly reflected in regional differences, Formula (13) can be adjusted as:
In order to further study the relationship between the innovation gap and urban spatial structure, a social welfare function was proposed according to Sen and Foster (1997) [43]:
The constraints for maximizing the social welfare function were:
where is the ratio of innovative products in city a to the total number of regional innovative products. Equation (16) can be substituted into Equation (15) to get:
where is the range of values (0, 1). The logarithm of both sides of formula (17) can be taken to get:
Equation (20) can be converted to:
where ; is a constant with a value of (0, 1). It can be seen that formula (21) can be regarded as a function of the regional spatial structure as the independent variable and the innovation difference as the dependent variable. At this time, the first derivative function of innovation difference with respect to the regional spatial structure was:
where since is within the value range of (0, 1). That is, formula (21) is a monotonically increasing function. when and when . It can be seen that the innovation gap (I) was positively correlated with the regional spatial structure (S). That is, the greater the regional spatial structure index was, the greater the innovation gap would be under the condition of controlling the innovation labor input unchanged. This result is basically in line with cognition. That is, the technological innovation network formed by multiple centers can promote the flow of innovation elements, and the innovation spillover effect is significant, which is more conducive to narrowing the regional innovation gap.
Hypothesis 2 (H2).
Multi-center spatial structure is more conducive to narrowing the technological innovation gap between regions.
3. Research Methods and Data Sources
3.1. Measurement of Key Variables
3.1.1. Measurement of the Regional Spatial Structure Index
- (1)
- Pareto Index (PI)where PI is the Pareto index, R is the ranking of each city in the province in descending order of the number of residents, S is the number of residents in each city in the province, and C is a constant. The larger the PI is, the more the regional spatial structure will be inclined to be a single-center one. The smaller the PI is, the more the regional spatial structure is likely to be a multi-center one.
- (2)
- Herfindahl–Hirschman Index (HHI)where HHI is the Herfindahl–Hirschman index, and S and Si are the total population of a province and the population of i city in the province, respectively. Consistent with the Pareto index, the larger the Herfindahl–Hirschman index is, the more the regional spatial structure is inclined to be a single-center one.
3.1.2. Measurement of the Technological Innovation Efficiency Index
DEA method is a common nonparametric statistical estimation method for multi-input and multi-output effectiveness evaluation. However, both the traditional CCR and BCC models may have multiple effective decision-making units with an efficiency value of 1, which results in failure to compare these decision-making units. Therefore, this paper draws on the practice of Wang and Ren (2022) [44] and Song and Han (2022) [45] to select the full-time equivalent of R&D staff and the internal expenditure of R&D as the personnel and economic input of scientific and technological innovation, respectively, and the number of patent applications authorized and the main business income of high-tech industries as the direct and indirect output of scientific and technological innovation, respectively. Then the super-efficiency DEA model is adopted to realize the comparative analysis of the scientific and technological innovation efficiency of each decision-making unit. Its formula is as follows:
where n represents the number of decision-making units, and are the input and output values of unit, respectively, and is the input reduction ratio.
3.1.3. Measurement of the Technological Innovation Gap Index
This paper draws on the practice of Kong et al. (2017) and Ahn and Yoon (2020) [46,47], using the total number of patent applications authorized as the core indicator and the coefficient of variation (CV) to measure the technological innovation gap of provincial spatial units. Its formula is as follows:
where CV represents the coefficient of variation of the technological innovation gap in province a, is the average number of patent applications authorized in province a, and SD is the standard deviation of the numbers of patent applications authorized in all cities in province a.
3.2. Research Methods
Based on previous theoretical analysis, this paper attempted to establish the empirical functions of regional spatial structure and innovation efficiency and gap as follows:
where Stru is the spatial structure measured by PI. The larger the index was, the more the regional spatial structure tended to be single-center, and vice versa, it tended to be multi-center. Effi represents the efficiency of sci-tech innovation using the full-time equivalent of R&D personnel and the internal expenditure of R&D funds as input indicators, and the number of patent applications authorized and the main business income of high-tech industries as output indicators calculated using the super-efficiency data envelopment analysis (DEA) model. Diff represents the sci-tech innovation gap, with the total number of patent authorizations as the core indicator. The coefficient of variation (CV) was used to measure the sci-tech innovation gap of provincial spatial units. Pcap stands for the innovation capital per labor (expressed as the ratio of social fixed asset investment in scientific research and technical service industries to gross domestic product), and Phum denotes the human capital per labor (expressed as the proportion of graduates or above in all employees). X refers to other factors that may affect the efficiency and gap in technological innovation, mainly including the economic development level measured by per capita GDP (Pgdp), the information infrastructure measured by the number of Internet broadband access users (Info), the government expenditure on science and technology measured by the proportion of science and technology expenditure in government fiscal expenditure (Gove), the local market demand measured by the proportion of total retail sales of social consumer goods in GDP (Mark), and the openness level measured by the proportion of actually utilized foreign investment in GDP (Open). represents the regional fixed effect that does not change with time, is the time fixed effect that does not change with the individual, and is the random error.
3.3. Data Sources
Given that the focus of this paper, regional spatial structure, is morphological, whereas the administrative structure within the municipality is special, the spatial structure division of which is functional, the four municipalities of Beijing, Shanghai, Tianjin, and Chongqing were excluded. In addition, due to the almost total lack of relevant data in the Tibet Autonomous Region, it was also eliminated. In this study, indicators such as spatial structure, innovation efficiency, and innovation gap were calculated by relevant formulas, and the data for other variables were collected from the 2006–2020 China Statistical Yearbook, China Urban Statistical Yearbook, and China Science and Technology Statistical Yearbook Data. Some missing data were filled up by the interpolation method. The statistical description of the relevant variables is shown in Table 1.
4. Results Analysis
4.1. Analysis of Benchmark Results
According to formula (27), the spatial structure and sci-tech innovation efficiency index were regressed. The specific results are shown in Table 2. Model (1) was the regression result after the addition of two variables, namely capital per labor and human capital per labor. Model (2) was the regression result after the addition of other control variables. It can be seen from the benchmark regression results that the regression coefficient of the spatial structure index was significantly positive whether it was regression alone or after the addition of control variables. At the provincial level, therefore, the spatial organization form in which elements were mainly concentrated in a large city can better exert an agglomeration effect, and the uneconomic phenomenon brought about by the agglomeration of such elements was not serious. Hence, the overall allocation of sci-tech innovation resources in the region was more efficient with the expansion of the scale of agglomeration. The possible reasons are as follows: Firstly, central cities with a single-center spatial structure often have the highest economic and political status. Thus, the resulting agglomeration effect can quickly gather relevant technological innovation elements such as technological innovators and innovation funds in central cities, contributing to the higher efficiency of technological innovation. Secondly, central cities with a single-center spatial structure are more capable of gathering large-scale and high-efficiency scientific and technological innovation entities, which often have the advantages of resource absorption and allocation and can benefit from the scale effect in the process of scientific and technological innovation. It is conducive to the allocation and reorganization of scientific and technological innovation resources. Finally, with a single-center spatial structure, central cities tend to have stronger market control capabilities, as well as less competition and repulsion from other cities (Meijers and Burger, 2017) [21]. Thus, they are more likely to accelerate the spillover and diffusion of innovation elements and achievements, thereby contributing to higher scientific and technological innovation efficiency.
After the addition of other control variables, the regression coefficients of the spatial structure index remained significantly positive, and the regression results of the main control variables were basically consistent with expectations. The coefficients of innovation capital stock per labor (Pcap) representing the scale of sci-tech innovation and human capital stock per labor (Phum) representing the quality of sci-tech personnel were both significantly positive, indicating that both economic and human capital accumulations are conducive to improving technological innovation efficiency. Khalifa et al. (2022) consider that technological innovation will require financial resources [48]. The coefficient of government intervention (Gove) was significantly negative, indicating that the investment of the government in technological innovation cannot improve the efficiency of regional innovation. In addition, improving the level of regional economic development, improving the construction of regional information infrastructure, expanding the demand of the local market, and strengthening opening to the outside world will all contribute to improving the efficiency of sci-tech innovation.
According to formula (28), the population Pareto index and technological innovation gap index were regressed separately, and the results are reported in columns (3) and (4) of Table 1. It can be seen from the benchmark regression results that the regression coefficient of the spatial structure index was significantly positive whether it was a separate regression or after the addition of a control variable. That is, the regional technological innovation gap decreased with the decrease in the spatial structure index. At the provincial level, therefore, the formation of a polycentric city network can fully display the effect of mutual borrowing of scale. The existence of such network externalities would accelerate the technological innovation of small- and medium-sized cities, thereby narrowing the technological innovation gap between regions. The possible reasons are as follows. First of all, it is easier for small- and medium-sized cities to realize the effect of mutual borrowing of scale under a multi-center structure. That is to say, small- and medium-sized cities can burden the diffusion and spillover effects of large cities through spatial proximity or functional connection with large cities, relying on the construction of complete transportation and information infrastructure in the region (Meijers and Burger, 2017) [21], so as to narrow the regional technological innovation gap. Secondly, a multi-center spatial structure often has stricter dislocation development principles, thus having a more reasonable industrial labor division system (Arribas and Sanz, 2014) [8]. This is conducive to the division of labor and cooperation among different types of scientific and technological innovation entities between cities, which narrows the technological innovation gap between regions. Finally, under a multi-center structure, the levels of each central city are close, whereas the flow of innovation elements is more convenient, with lower costs. This is favorable for the formation of a close scientific and technological innovation network between cities so that the regional scientific and technological innovation gap becomes smaller.
After the addition of other control variables, the regression coefficient of the spatial structure index was still significantly positive, and the regression results of the main control variables were basically consistent with expectations. The influence coefficients of economic development level (Pgdp), information infrastructure (Info), market demand (Mark), and opening to the outside world (Open) were all significantly negative, indicating that the promotion of economic development, the improvement of infrastructure construction, the expansion of local market demand, and the strengthening of external opening up will help narrow the technological innovation gap between cities in a province. The coefficients of government intervention (Gove) and human capital stock (Huma) were significantly positive mainly because government spending on science and technology and talent flow tended to agglomerate in cities with high economic levels and strong innovation capabilities, thereby increasing inter-regional economic growth and the innovation gap.
4.2. Robustness Check
In this paper, two methods of replacing explanatory and explained variables were adopted to test the robustness of the benchmark regression results. First, the number of patents granted per 10,000 people (Ppat) and the Gini coefficient of the number of granted patent applications (Gini) were used as surrogate variables for the innovation efficiency and innovation gap. Secondly, in view of the adjustment of administrative divisions in some areas during the study and the possible differences in demographic methods in the statistical yearbook, PI and HHI of nighttime lights were used as the surrogate variables for regional spatial structure in this study. DSMP/OLS nighttime light data covers the distribution of population, cities, and other information in the area, which can comprehensively reflect the density of human habitation and activities. Meanwhile, the boundary definition of nighttime light data is not completely based on administrative divisions but according to thresholds. Thus, the continuity and integrity of the interior space can be guaranteed (Gao and Yuan, 2022) [49]. The results show that the single-center spatial structure had a positive impact on innovation efficiency and passed the test at least at the 10% significance level (Table 3). Meanwhile, a multi-center spatial structure can significantly reduce the innovation gap, indicating that the conclusions of the benchmark results in this paper have better results.
5. Further Analysis
According to the analysis above, it can be found that at the provincial level, a single-center spatial structure is conducive to improving the efficiency of scientific and technological innovation, whereas a multi-center spatial structure is favorable for narrowing the gap in scientific and technological innovation between cities in the province. However, there are several issues worthy of further exploration. First, Brezzi and Veneri (2014) argued that regional spatial structure has different effects on economic development in different regions and at different scales [10]. Hence, is there regional heterogeneity in the impact of regional spatial structure on scientific and technological innovation? That is, are the above two conclusions applicable to China’s four major eastern, central, western, and northeastern regions? Second, will the effect of regional spatial structure on technological innovation be affected by the degree of cultural diversity within the region? Third, will the impact of regional spatial structure on technological innovation be influenced by the distance between cities?
5.1. Regional Heterogeneity
The benchmark regression results show that a single-center spatial structure can improve innovation efficiency, whereas a multi-center development is beneficial to narrowing regional innovation gaps. However, it is undeniable that there must be applicable boundary conditions for this result in real situations. The impact of regional spatial structure on innovation will inevitably be constrained by the level of regional economic development. For example, in the case of a very low level of economic development, multi-center development will inevitably fail to narrow the regional gap. Therefore, for China, the above research conclusions will be affected by regional heterogeneity. This paper calculated the spatial structure and technological innovation efficiency and gap indices of the three major regions of the east, middle, and west, respectively, and explored the influence of spatial structure on the efficiency of technological innovation and technological innovation gap by region.
From the quantitative regression results in Table 4, it can be seen that multi-center spatial structure can effectively improve the efficiency of sci-tech innovation, and help to narrow the gap of sci-tech innovation between cities in a province for the eastern region. This is not difficult to understand. In economically developed regions, it has become increasingly demanding for cities to focus on their rooted technological innovation and development. Therefore, it is particularly important to strengthen the division of labor and connections between cities and build a close multi-center innovation network. On the one hand, the eastern provinces in China have an excellent innovation environment and strong scientific and technological innovation strength. If they continue to agglomerate innovation resources, it will not only lead to the waste of a large number of innovation resources but also be detrimental to the improvement of the innovation capabilities of each city, which thus impairs the efficiency of scientific and technological innovation in the entire province. On the other hand, as a region with a relatively high level of economic development in China, by constructing a multi-center innovation network, the eastern region can not only accelerate the flow of innovation elements and results and narrow the innovation gap between cities but also give full play to the effect of mutual borrowing of scale to have an agglomeration economy shared among cities, thereby promoting the improvement of the efficiency of scientific and technological innovation across the province.
For the western region, a single-center spatial structure is more conducive to developing regional sci-tech innovation, which can not only improve the efficiency of sci-tech innovation but also play a role in narrowing the gap of sci-tech innovation. The main reason is that the current level of economic development and technological innovation in the western region is still relatively low, and it is even more necessary to effectively integrate limited innovation resources and give full play to the agglomeration and scale effects of cities with high-tech innovation capabilities (Camagni et al., 2016) [50]. For one thing, restricted by its weak comprehensive economic strength, China’s western region lacks adequate innovation conditions, innovation resources, and innovation capabilities. Thus, how to agglomerate limited and relatively low-quality innovation elements to realize the integration of innovation knowledge and resources is particularly important, which has also become the main way to improve the efficiency of innovation. For another, the western region tends to pay more attention to the rapid growth of its economy. As the primary driving force of economic development, technological innovation will inevitably become the main field of competition in most regions. Therefore, the implementation of a single-center spatial structure can not only break the development pattern of “separate management” but also realize the common development of other cities in the region in terms of innovation through the innovation spillover effect of the central city. The influence of the spatial structure of the central region on sci-tech innovation is consistent with that of the whole country. In other words, a single-center spatial structure is conducive to improving the efficiency of sci-tech innovation, whereas a multi-center spatial structure is beneficial to narrowing the gap in sci-tech innovation.
5.2. Analysis of the Moderating Effect of Cultural Diversity
As an important indicator of urban diversity, cultural diversity has received increasing attention from scholars in terms of its impact on innovation, which has been strongly supported by a large number of theoretical and empirical studies. Ottaviano and Peri (2006) pointed out that immigrants from different cultural backgrounds constitute the cultural diversity of American cities [51]. Due to differences in cultural backgrounds, immigrants have skills and abilities different from those of the Native American workforce. Thus, innovation and economic growth can be promoted through their skills complementary to each other. In fact, people from different geographical and cultural backgrounds also have different cognitive abilities, thus having different views, perceptions, and solutions to problems. Therefore, under a multicultural background, people will communicate more frequently, and innovation exchanges and innovation competition will be more intense, which can give full play to the spillover effect of cultural knowledge and promote scientific and technological innovation (Gennaioli et al., 2012; Guo et al., 2016; Burlea-Schiopoiu and Mihai, 2019) [52,53,54].
The dialect diversity data compiled by Zhu and Grigoriadis (2022) [55] were used in this paper to represent cultural diversity (Cult) with the provincial dialect diversity index, with a view to testing whether regional cultural diversity can regulate the impact of spatial structure on innovation. Its multiplication term with the spatial structure index and that of spatial structure and cultural diversity quadratic and cubic were introduced into Equations (27) and (28) as independent variables, and the results are shown in Table 5.
From the perspective of the influence of regional spatial structure on innovation efficiency, the result after adding the multiplication term of the spatial structure index and cultural diversity on innovation efficiency was positive, but it failed the significance test. Besides, quadratic and cubic multiplication terms were added. The results show that the relationship between the partial effect of single-center spatial structure on innovation efficiency and cultural diversity roughly presents an “N” type. To be specific, it is easier to form a single-center spatial structure when the culture in a province is relatively simple, and the resulting cultural identity will strengthen the connection between innovation subjects, which is more conducive to improving the efficiency of regional sci-tech innovation. The gradual increase in cultural diversity will gradually deepen the cultural conflict and increase the contradiction in the process of innovation exchange. Therefore, the promotion effect of a single-center spatial structure on innovation will gradually weaken and even inhibit the improvement of innovation efficiency. However, the collision of diverse cultures and ideas under a single-center spatial structure will be of greater use to breaking conventions and traditions and accelerating the output of innovation achievements with the further increase in cultural diversity. Therefore, the single-center spatial structure can also improve the efficiency of sci-tech innovation. From the perspective of the influence of regional spatial structure on innovation gap, the result after adding the quadratic multiplication term of the spatial structure index and cultural diversity was the most significant, indicating that the influence of multi-center spatial structure on innovation gap is affected by the nonlinearity of cultural diversity. The regulatory effect is more significant as well, roughly showing an “inverted U” type. That is, with the gradual increase in cultural diversity, multiculturalism will promote innovation exchanges, better contribute to the spillover of innovation knowledge and skills, and step up the effect of scale mutual borrowing and factor flow. Therefore, a multi-center spatial structure is more conducive to narrowing the innovation gap. When the level is further improved, the fragmentation of multiple cultures may limit innovation linkages between cities, thus leading to a larger innovation gap on the right side of the optimal scale.
To sum up, it can be found that when there are fewer cultural types within the province, an increase in the level of cultural diversity is not only conducive to the positive impact of a single-center spatial structure on innovation efficiency but also favorable for aggravating the weakening effect of a multi-center spatial structure on the innovation gap. This is different from the findings of Fassio et al. (2019) [56]. The possible reasons are as follows. Firstly, when the level of cultural diversity is low, people’s cognitive differences in culture are small, and the agglomeration effect in a single-center spatial structure is stronger, which is conducive to the integration of innovation resources and the improvement of innovation efficiency. Secondly, when the level of cultural diversity is low, the cross-cultural communication between individuals from different cultural backgrounds is smoother, and the region is more inclusive, with less ineffective competition in cities under a multi-center spatial structure, which is conducive to the spillover of innovative talents, knowledge, and skills, and thus narrows the innovation gap. When there are various cultural types within a province, an increase in the level of cultural diversity will inhibit the improvement of innovation efficiency and widen the innovation gap between regions. This is consistent with the findings of Eeckhout et al. (2014) [57]. Their research results show that under a single-center spatial structure, the more cultural types there are, the greater the differences in people’s innovative abilities and ideas will be. Diversified ways of thinking are prone to divergence, which often takes more time and energy to coordinate and thereby affects the efficiency of regional innovation. On the other hand, people from different cultural backgrounds may find it difficult to recognize other cultural concepts, which may lead to conflicts between different cultures. As a result, differences in innovative concepts and “intergroup distance” emerge, which makes it difficult to efficiently and quickly disseminate useful information about innovation in the region and hinders the innovation gap from being narrowed.
5.3. Analysis of the Moderating Effect of the Distance between Cities
According to experience and intuition, if the distances between cities within a region are very long, the flow of innovation elements between cities will undoubtedly be restricted, which may impair the role of regional spatial structure in enhancing innovation efficiency and narrowing the innovation gap. The Learning Region Theory posits that innovation, as a kind of tacit knowledge, has the characteristics of experience, cognition, and situation. Therefore, innovation spillover will be attenuated with an increase in the spatial distance, becoming zero when reaching a certain boundary point (Lundvall and Maskell, 2000; Bloom et al., 2013) [58,59]. To explore whether the influence of regional spatial structure on sci-tech innovation is moderated by inter-city traffic distance, this paper calculated the average distance between cities in a province based on the shortest traffic distance between cities in the AutoNavi map (Dist) and introduced its multiplication term with the spatial structure index into the regression equation as an independent variable (Table 6). The results show that the influence of regional spatial structure on the efficiency of technological innovation and the gap in technological innovation has a significant nonlinear effect on the distance between cities.
First of all, the relationship between the partial effect of a single-center spatial structure on innovation efficiency and the distance between cities roughly presents an “inverted-U” shape. Specifically, when the distance between cities is relatively short, there will be an agglomeration effect, which is conducive to improving the efficiency of regional scientific and technological innovation. As the distance between cities increases, the promotion effect of a single-center spatial structure on innovation will gradually weaken, which will even inhibit the improvement of innovation efficiency. This is consistent with the findings of Keller (2002) [60] who found that in a single-center spatial structure, when the distance between the central city and its surrounding cities is short, the central city tends to have stronger market control capabilities and exert the agglomeration effect more easily, so as to gather the innovation resources of its surrounding cities and improve regional overall innovation efficiency. However, as the distance between cities continues to increase, the agglomeration effect of the central city gradually weakens, followed by an increase in the difficulty and cost of innovation exchanges in the surrounding cities. In addition, the weak siphon effect of the central city will lead to fierce competition for innovation resources among other cities, thus restricting the improvement of the overall innovation efficiency of the region.
Secondly, the influence of a multi-center spatial structure on the innovation gap is also significantly affected by the non-linear moderating effect of the distance between cities, which shows an appropriately “inverted-U” trend. This is consistent with the findings of Bottazzi and Peri (2003) [61]. They studied innovation spillover in 86 regions in 15 European countries between 1977 and 1995 and found that innovation spillover only existed within 300 km. Specifically, when the distance between cities is relatively short, it is helpful to strengthen the connection between regions and is more favorable for narrowing the gap in regional scientific and technological innovation between regions. As the distance between cities increases, it is not conducive to the flow of innovative talents and elements. Therefore, the role of a multi-center spatial structure in narrowing the innovation gap will gradually weaken. The possible reason for this phenomenon is as follows. In a multi-center spatial structure, when the distance between cities is short, the costs of urban innovation cooperation and knowledge spillover are lower. Thus, the radiation ability of the central city becomes stronger, and it is also easier for the surrounding small- and medium-sized cities to exert a “scale-borrowing” effect, which is conducive to narrowing the innovation gap between cities (Xiang et al., 2020) [62]. However, with a continuous increase in the average distance between cities, the radiation capacity of the central city gradually weakens, and the costs of innovation elements and innovation achievement spillover rise. After the surrounding small- and medium-sized cities exceed a certain boundary, it is difficult for them to benefit from innovation spillover (Camagni et al., 2016) [50]. Consequently, the innovation advantages retained by the central city continue to increase, which further enlarges the innovation gap between cities.
6. Main Conclusions and Countermeasures
In its spatial development, the EU emphasizes the role of a multi-center spatial structure at the regional level in improving economic efficiency and maintaining balanced regional development. China, which has just entered an innovative stage, also faces a similar problem of identifying the appropriate spatial development model. However, no consensus about whether a single-center spatial structure or a multi-center spatial structure is more conducive to China’s regional innovation and development has been reached in academia. The focal debate is mainly about whether China should adopt a single-center structure dominated by large cities or a multi-center structure focusing on small- and medium-sized cities. With the help of the classical agglomeration economic theory, some scholars have indicated that since the population of China’s big cities is far from being saturated and their scales have not yet reached the optimal level, the scale expansion of big cities should be further encouraged (Au and Henderson, 2006) [63]. However, some scholars hold the opposite view. Their agglomeration economic theory based on a regional perspective believes that the agglomeration effect is not limited to the interior of a single city but has a spatial spillover effect on the surrounding small cities. In particular, considering China’s vast territory and large population base, the distribution of cities should be more balanced, which is more suitable for a multi-center urban system dominated by small- and medium-sized cities. Admittedly, the above viewpoints all have their rationality, but from the perspectives of efficiency and fairness, the literature on the comprehensive assessment of the impact of different types of spatial structures on technological innovation is relatively insufficient. Therefore, this paper attempts to link regional spatial structure, the focus of policy-making, with scientific and technological innovation to explore which form of spatial structure is more conducive to promoting the efficiency of scientific and technological innovation and which form of spatial structure is more favorable for narrowing the regional innovation gap.
6.1. Main Conclusions
This paper drew on the relevant theories of new economic geography and regional economics and used the panel data of 26 Chinese provinces and autonomous regions from 2005 to 2019. The influence of technological innovation efficiency and gap and its internal mechanism was explored. On this basis, this paper further analyzed and discussed the moderating role of regional heterogeneity, cultural diversity, and inter-city distance in the impact of regional spatial structure on technological innovation. The main research conclusions are as follows: First, at the provincial level, a single-center spatial structure is conducive to improving the efficiency of sci-tech innovation, and a multi-center spatial structure is beneficial to narrowing the gap in sci-tech innovation. The robustness test was carried out on the replacement of explanatory and explained variables. After that, the above results still hold. Second, a single center is of greater help to improve the efficiency of innovation and the reduction in innovation differences in regions with low levels of economic development. With the continuous development of the economy, a multi-center spatial structure can solve the problem of unbalanced regional development, and it is more conducive to the equal and high-quality development of regions. Third, the partial effects of a single-center spatial structure on innovation efficiency present “N” and “inverted U” types with the increase in cultural diversity and the distance between cities, whereas those of a multi-center one on innovation gap are both “inverted U” types.
6.2. Policy Recommendations
“Single- and multi-center” urban spatial structure layouts have their advantages and disadvantages, and making choices based on the stage of regional economic development is necessary. Therefore, China should improve the regional policy system in accordance with objective economic laws, exploit the comparative advantages of each region, promote the rational flow and efficient aggregation of innovation elements, strengthen regional innovation and development momentum, and form a regional structure layout with complementary advantages and high-quality development. The findings of this paper have several implications for adjusting the provincial spatial structure of China and developing sci-tech innovation:
The first is to clarify the important role of a regional spatial structure in developing sci-tech innovation. The adjustment of regional spatial structure is one of the important ways to promote the development of sci-tech innovation. As an important carrier of sci-tech innovation, city scale and the relationship between cities directly affect the efficiency of sci-tech innovation, which thus highlights the necessity of clarifying the functional positioning and mutual relationship of cities in a province, rationally arranging the spatial structure within the province and building a regional innovation chain with close cooperation. For one thing, this is conducive to fully displaying the comparative advantages of innovation in each city, promoting the division of labor in regional innovation, advancing the rational allocation of innovation resources, and improving innovation efficiency. For another thing, the agglomeration and scale mutual loan effects brought by a reasonable spatial structure and innovation spillover effect are useful to realize the flow spillover of innovation elements and results, thus the realization of the innovation gap can be narrowed.
The second is to promote the diversified development of regional spatial structure layout according to local conditions. As the main concept of alleviating uneconomical agglomeration, multi-centrality has been widely used in the spatial structure layout of provinces in China. However, the research results of this paper show that in the provinces and cities pursuing the improvement of innovation efficiency and the development of multiple centers, blindly following the trend will harm the improvement of innovation efficiency. Thus, each region should adopt a reasonable spatial structure according to the actual situation of its technological innovation and development. For provinces and cities in the eastern region, they are supposed to accelerate the construction of small- and medium-sized cities, create a certain number of sub-central cities and promote the formation of a multi-center and multi-level spatial structure while appropriately controlling the development scale of central cities. For the central and western regions with limited innovation resources, improving the efficiency of innovation and development is the primary task as far as regions, provinces, and cities are concerned. Therefore, the construction of central cities should be reasonably promoted to avoid blindly “spreading the pie” of development, giving rise to resource waste and low-level balanced development.
Third, the development of sci-tech innovation should not only focus on efficiency but also reflect fairness. With the continuous advancement of the innovation-driven development strategy and the strategy of building a world sci-tech power, the core position of sci-tech innovation in the overall situation of the modernization drive of China has become increasingly consolidated. However, whether it is building a sci-tech innovation center or laying out a comprehensive national science center, special emphasis is placed on improving the overall efficiency of the innovation chain. The strength and efficiency of sci-tech innovation in China indeed have a lot of room for improvement. Therefore, the allocation efficiency of sci-tech resources is the focus and primary issue of the reform of the sci-tech system, but the large gap in sci-tech innovation has gradually become an important problem that cannot be ignored. Either the sci-tech innovation resources represented by sci-tech personnel and funds or the sci-tech innovation achievements represented by the number of patent applications and foreign retrieved papers show an obvious pattern of “more east and less west”, which is conducive to the improvement of innovation efficiency. Therefore, the fairness of sci-tech innovation should also be fully considered while the allocation efficiency of sci-tech innovation resources is improved.
It should be pointed out that some content can still be further analyzed and expanded although this paper elaborated on the relationship and mechanism of regional spatial structure at the provincial level on technological innovation:
1. The effect mechanism of regional spatial structure on technological innovation at different spatial levels like cities and urban agglomerations can be analyzed and compared.
2. Typical areas with spatial structure transformation can be selected and tested over a long time span, and the effect of regional spatial structure on technological innovation can be explored.
Author Contributions
Conceptualization, Z.Y.; methodology, Z.Y. and C.Z.; software, C.Z.; validation, Z.Y. and C.Z.; formal analysis, Z.Y.; investigation, Z.Y. and C.Z.; resources, Y.H.; data curation, C.Z.; writing—original draft preparation, Z.Y.; writing—review and editing, Z.Y. and C.Z.; supervision, Y.H.; project administration, Z.Y.; funding acquisition, Y.H. All authors have read and agreed to the published version of the manuscript.
Funding
This work was supported by the National Social Science Foundation of China (No. 21BGL016), the Major Project of Philosophy and Social Science Research in Colleges and Universities in Jiangsu Province (No. 2021SJZDA027).
Institutional Review Board Statement
Not applicable.
Informed Consent Statement
Not applicable.
Data Availability Statement
Not applicable.
Conflicts of Interest
The authors declare no conflict of interest.
References
- Zheng, L. What city amenities matter in attracting smart people? Pap. Reg. Sci. 2014, 95, 309–327. [Google Scholar] [CrossRef]
- Yang, J.; Yu, H.; Li, T.; Jin, Y.; Sun, D. Morphological and functional polycentric structure assessment of megacity: An integrated approach with spatial distribution and interaction. Sustain. Cities Soc. 2022, 80, 103800. [Google Scholar]
- Spyra, M.; Kleemann, J.; Calò, N.C.; Schürmann, A.; Fürst, C. Protection of peri-urban open spaces at the level of regional policy-making: Examples from six European regions. Land Use Policy 2021, 107, 105480. [Google Scholar] [CrossRef]
- Dembińska, I.; Kauf, S.; Tłuczak, A.; Szopik-Depczyńska, K.; Marzantowicz, Ł.; Ioppolo, G. The impact of space development structure on the level of ecological footprint—Shift share analysis for European Union countries. Sci. Total Environ. 2022, 851, 157936. [Google Scholar] [CrossRef] [PubMed]
- Wu, S.; Cheng, J.; Lo, S.; Chen, C.C.; Bai, Y. Coordinating urban construction and district-level population density for balanced development: An explorative structural equation modeling analysis on Shanghai. J. Clean. Prod. 2021, 312, 127646. [Google Scholar] [CrossRef]
- Ma, S.; Cai, Y.; Xie, D.; Zhang, X.; Zhao, Y. Towards balanced development stage: Regulating the spatial pattern of agglomeration with collaborative optimal allocation of urban land. Cities 2022, 126, 103645. [Google Scholar] [CrossRef]
- Zhang, T.; Sun, B.; Cai, Y.; Wang, R. Government fragmentation and economic growth in China’s cities. Urban Stud. 2018, 56, 1–15. [Google Scholar] [CrossRef]
- Arribas, B.D.; Sanz, G.F. The validity of the monocentric city model in a polycentric age: US metropolitan areas in 1990, 2000 and 2010. Urban Geogr. 2014, 35, 980–997. [Google Scholar] [CrossRef]
- Wu, C.; Smith, D.C.; Wang, M.S. Simulating the urban spatial structure with spatial interaction: A case study of urban polycentricity under different scenarios. Comput. Environ. Urban Syst. 2021, 89, 103667. [Google Scholar] [CrossRef]
- Brezzi, M.; Veneri, P. Assessing Polycentric Urban Systems in the OECD: Country, Regional and Metropolitan Perspectives. Eur. Plan. Stud. 2014, 23, 1128–1145. [Google Scholar] [CrossRef]
- Rauhut, D. Polycentricity–one concept or many? Eur. Plan. Stud. 2017, 25, 332–348. [Google Scholar] [CrossRef]
- Sun, T.S.; Lv, Y.Q. Employment centers and polycentric spatial development in Chinese cities: A multi-scale analysis. Cities 2020, 99, 102617. [Google Scholar] [CrossRef]
- Sun, B.; Li, W.; Zhang, Z.; Zhang, T. Is polycentricity a promising tool to reduce regional economic disparities? Evidence from China’s prefectural regions. Landsc. Urban Plan. 2019, 192, 103667. [Google Scholar] [CrossRef]
- Burger, M.J.; Meijers, E.J.; Van Oort, F.G. Regional spatial structure and retail amenities in the Netherlands. Reg. Stud. 2014, 48, 1972–1992. [Google Scholar] [CrossRef]
- Zhang, Y.; Wang, T.; Supriyadi, A.; Zhang, K.; Tang, Z. Evolution and optimization of urban network spatial structure: A case study of financial enterprise network in Yangtze River Delta, China. ISPRS Int. J. Geo-Inf. 2020, 9, 611. [Google Scholar] [CrossRef]
- Li, Y.C.; Liu, X.J. How did urban polycentricity and dispersion affect economic productivity? A case study of 306 Chinese cities. Landsc. Urban Plan. 2018, 173, 51–59. [Google Scholar] [CrossRef]
- David, C.; Klaus, D.; Jordan, R. Urban Growth Shadows. J. Urban Econ. 2021, 123, 103334. [Google Scholar]
- Chen, X.; Qiu, B.; Sun, S.Q. Polycentric spatial structure and energy efficiency: Evidence from China’s provincial panel data. Energy Policy 2021, 149, 112012. [Google Scholar]
- Krugman, P. First nature, second nature, and metropolitan location. J. Reg. Sci. 1993, 33, 129–144. [Google Scholar] [CrossRef]
- Volgmann, K.; Rusche, K. The Geography of Borrowing Size: Exploring Spatial Distributions for German Urban Regions. Tijdschr. Voor Econ. En Soc. Geogr. 2020, 111, 60–79. [Google Scholar] [CrossRef]
- Meijers, E.J.; Burger, M.J. Stretching the concept of ‘borrowed size’. Urban Stud. 2017, 54, 269–291. [Google Scholar] [CrossRef]
- Lin, D.; Allan, A.; Cui, J.Q. The impact of polycentric urban development on commuting behaviour in urban China: Evidence from four sub-centres of Beijing. Habitat Int. 2015, 50, 195–205. [Google Scholar] [CrossRef]
- Zou, Y.F.; Lu, Y.H.; Cheng, Y. The impact of polycentric development on regional gap of energy efficiency: A Chinese provincial perspective. J. Clean. Prod. 2020, 224, 838–851. [Google Scholar] [CrossRef]
- Jun, M.J. The effects of polycentric evolution on commute times in a polycentric compact city: A case of the Seoul Metropolitan Area. Cities 2020, 98, 102587. [Google Scholar] [CrossRef]
- Mukim, M. Coagglomeration of formal and informal industry: Evidence from India. J. Econ. 2015, 15, 329–351. [Google Scholar]
- Haider, H.; Hewage, K.; Umer, A.; Ruparathna, R.; Chhipi-Shrestha, G.; Culver, K.; Holland, M.; Kay, J.; Sadiq, R. Sustainability assessment framework for small-sized urban neighbourhoods: An application of Fuzzy Synthetic Evaluation. Sustain. Cities Soc. 2018, 36, 21–32. [Google Scholar] [CrossRef]
- Duranton, G. Delineating Metropolitan Areas: Measuring Spatial Labour Market Networks Through Commuting Patterns. Adv. Jpn. Bus. Econ. 2015, 4, 107–133. [Google Scholar]
- Garcia-López, M.À.; Moreno-Monroy, A.I. Income segregation in monocentric and polycentric cities: Does urban form really matter? Reg. Sci. Urban Econ. 2018, 71, 62–79. [Google Scholar] [CrossRef]
- Li, Y.C.; Xiong, W.T.; Wang, X.P. Does polycentric and compact development alleviate urban traffic congestion? A case study of 98 Chinese cities. Eur. Plan. Stud. 2019, 88, 100–111. [Google Scholar] [CrossRef]
- Wen, H.Z.; Tao, Y.L. Polycentric urban structure and housing price in the transitional China: Evidence from Hangzhou. Habitat Int. 2015, 46, 138–146. [Google Scholar] [CrossRef]
- Guo, L.; Luo, J.; Yuan, M.; Huang, Y.; Shen, H.; Li, T. The influence of urban planning factors on PM 2.5pollution exposure and implications: A case study in China based on remote sensing, LBS, and GIS data. Sci. Total Environ. 2019, 659, 1585–1596. [Google Scholar] [CrossRef] [PubMed]
- Chen, X.; Zhang, S.; Ruan, S.M. Polycentric structure and carbon dioxide emissions: Empirical analysis from provincial data in China. J. Clean. Prod. 2021, 278, 123411. [Google Scholar] [CrossRef]
- Liu, P.; Zhong, F.; Yang, C.; Jiang, D.; Luo, X.; Song, X.; Guo, J. Influence mechanism of urban polycentric spatial structure on PM emissions in the Yangtze River Economic Belt, China2.5. J. Clean. Prod. 2022, 365, 132721. [Google Scholar] [CrossRef]
- Sun, B.D.; Han, S.S.; Li, W. Effects of the polycentric spatial structures of Chinese city regions on CO concentrations2. Transp. Res. Part D Transp. Environ. 2020, 82, 102333. [Google Scholar] [CrossRef]
- Xu, Z.; Cai, Z.; Su, S.; Kang, M.; Ge, Y. Unraveling the association between the urban polycentric structure and urban surface thermal environment in urbanizing China. Sustain. Cities Soc. 2022, 76, 103490. [Google Scholar] [CrossRef]
- Bereitschaft, B.; Debbage, K. Urban Form, Air Pollution, and CO2 Emissions in Large U.S. Metropolitan Areas. Prof. Geogr. 2013, 65, 612–635. [Google Scholar] [CrossRef]
- Bai, J.H.; Lu, J.Y.; Li, S.J. Fiscal Pressure, Tax Competition and Environmental Pollution. Environ. Resour. Econ. 2019, 73, 431–447. [Google Scholar] [CrossRef]
- Han, S.S.; Sun, B.D.; Zhang, T.L. Mono- and polycentric urban spatial structure and PM concentrations: Regarding the dependence on population density2.5. Habitat Int. 2020, 145, 102257. [Google Scholar] [CrossRef]
- Hsieh, C.T.; Klenow, P.J. Misallocation and Manufacturing TFP in China and India. Q. J. Econ. 2009, 124, 1403–1448. [Google Scholar] [CrossRef]
- Zou, C.; Huang, Y.; Wu, S.; Hu, S. Does “low-carbon city” accelerate urban innovation? Evidence from China. Sustain. Cities Soc. 2022, 83, 103954. [Google Scholar] [CrossRef]
- Cao, K.H.; Birchenall, J.A. Agricultural Productivity, Structural Change, and Economic Growth in Post-reform China. J. Dev. Econ. 2013, 104, 165–180. [Google Scholar] [CrossRef]
- Shorrocks, A.F.; Wan, G.H. Spatial Decomposition of Inequality. J. Econ. Geogr. 2005, 5, 59–82. [Google Scholar] [CrossRef]
- Sen, A.; Foster, J. On Economic Inequality, Expanded Edition with Annexe; Oxford University Press: London, UK, 1997. [Google Scholar]
- Wang, Q.; Ren, S.M. Evaluation of green technology innovation efficiency in a regional context: A dynamic network slacks-based measuring approach. Technol. Forecast. Soc. Chang. 2022, 182, 121836. [Google Scholar] [CrossRef]
- Song, W.F.; Han, X.F. The bilateral effects of foreign direct investment on green innovation efficiency: Evidence from 30 Chinese provinces. Energy 2022, 261, 125332. [Google Scholar] [CrossRef]
- Kong, D.; Zhou, Y.; Liu, Y.; Xue, L. Using the data mining method to assess the innovation gap: A case of industrial robotics in a catching-up country. Technol. Forecast. Soc. Chang. 2017, 119, 80–97. [Google Scholar] [CrossRef]
- Ahn, S.J.; Yoon, H.Y. ‘Green chasm’ in clean-tech for air pollution: Patent evidence of a long innovation cycle and a technological level gap. J. Clean. Prod. 2020, 272, 122726. [Google Scholar] [CrossRef]
- Khalifa, A.A.; Ibrahim, A.-J.; Amhamed, A.I.; El-Naas, M.H. Accelerating the Transition to a Circular Economy for Net-Zero Emissions by 2050: A Systematic Review. Sustainability 2022, 14, 11656. [Google Scholar] [CrossRef]
- Gao, K.; Yuan, Y.J. Spatiotemporal pattern assessment of China’s industrial green productivity and its spatial drivers: Evidence from city-level data over 2000–2017. Appl. Energy 2022, 307, 118248. [Google Scholar] [CrossRef]
- Camagni, R.; Capello, R.; Caragliu, A. Static vs. dynamic agglomeration economies. Spatial context and structural evolution behind urban growth. Pap. Reg. Sci. 2016, 95, 133–158. [Google Scholar] [CrossRef]
- Ottaviano, G.I.; Peri, G. The Economic Value of Cultural Diversity: Evidence from US Cities. J. Econ. Geogr. 2006, 6, 9–44. [Google Scholar] [CrossRef]
- Gennaioli, N.; Porta, R.L.; Lopez-De-Silanes, F.; Shleifer, A. Human Capital and Regional Development. Q. J. Econ. 2012, 128, 105–164. [Google Scholar] [CrossRef]
- Guo, Q.; He, C.; Li, D. Entrepreneurship in China: The role of localization and urbanisation economies. Urban Stud. 2016, 53, 2584–2606. [Google Scholar] [CrossRef]
- Burlea-Schiopoiu, A.; Mihai, L.S. An Integrated Framework on the Sustainability of SMEs. Sustainability 2019, 11, 6026. [Google Scholar] [CrossRef]
- Zhu, J.B.; Grigoriadis, T.N. Chinese dialects, culture & economic performance. China Econ. Rev. 2022, 73, 101783. [Google Scholar]
- Fassio, C.; Montobbio, F.; Venturini, A. Skilled Migration and Innovation in European Industries. Res. Policy 2019, 48, 706–718. [Google Scholar] [CrossRef]
- Eeckhout, J.; Pinheiro, R.; Schmidheiny, K. Spatial Sorting. J. Political Econ. 2014, 122, 554–620. [Google Scholar] [CrossRef] [Green Version]
- Lundvall, B.-Å.; Maskell, P. Nation States and Economic Development: From National Systems of Production to National Systems of Knowledge Creation and Learning. In The Oxford Handbook of Economic Geography; Oxford University Press: Oxford, UK, 2000; pp. 353–372. [Google Scholar]
- Bloom, N.; Schankerman, M.; Van Reenen, J. Identifying Technology Spillovers and Product Market Rivalry. Econometrica 2013, 81, 1347–1393. [Google Scholar]
- Keller, W. Geographic Localization of International Technology Diffusion. Am. Econ. Rev. 2002, 92, 120–142. [Google Scholar] [CrossRef]
- Bottazzi, L.; Peri, G. Innovation and Spillovers in Regions: Evidence from European Patent Data. Eur. Econ. Rev. 2003, 47, 687–710. [Google Scholar] [CrossRef]
- Xiang, G.C.; Xiong, Y.J.; Liu, J.J.; Zhong, S.H.; Jiang, X. How far is the optimal intercity distance? Evidence from China. Int. Reg. Sci. Rev. 2020, 43, 344–369. [Google Scholar] [CrossRef]
- Au, C.C.; Henderson, V. Are Chinese Cities Too Small? Rev. Econ. Stud. 2006, 73, 549–576. [Google Scholar] [CrossRef] [Green Version]
Figure 1.
Comparison of innovation strength in different spatial structure regions.

Figure 2.
Comparison of innovation efficiency and innovation gap between regions with different spatial structures.
Figure 2.
Comparison of innovation efficiency and innovation gap between regions with different spatial structures.
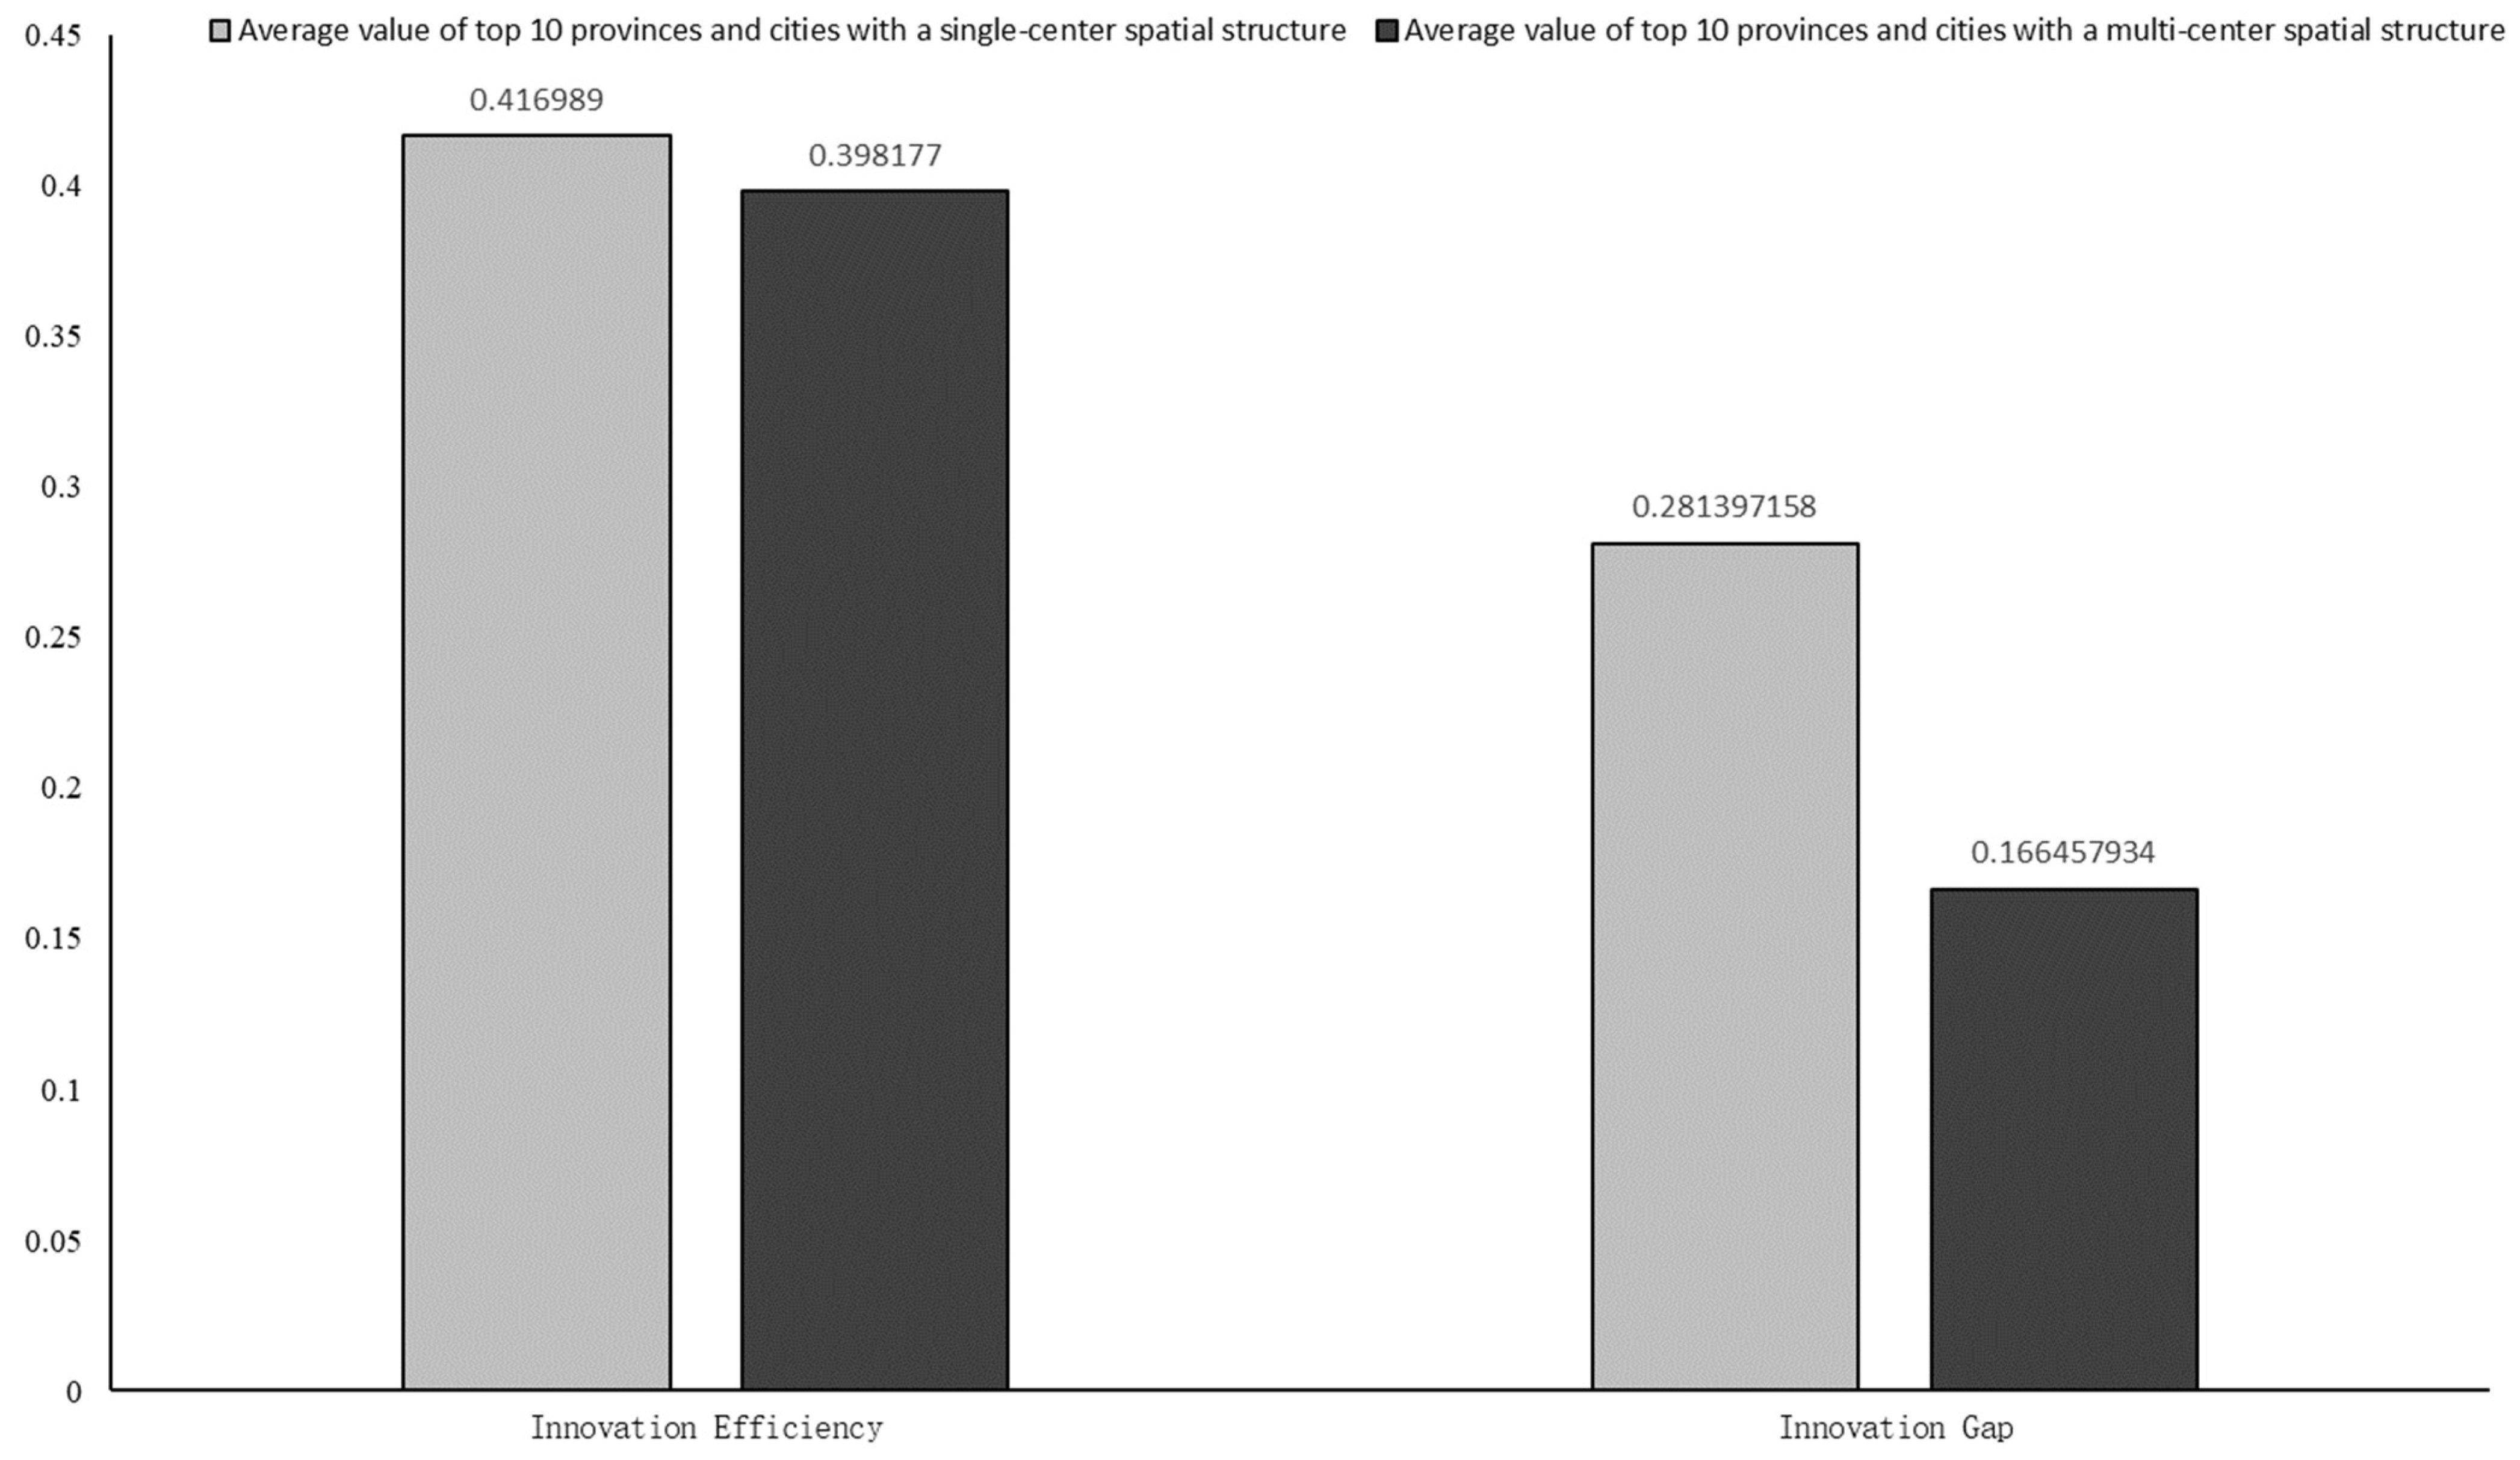

Table 1.
Statistical description of the relevant variables.
| Variable | Obs | Mean | Std. Dev. | Min | Max |
|---|---|---|---|---|---|
| PI | 390 | 1.353 | 0.518 | 0.394 | 2.480 |
| HHI | 390 | 1.975 | 1.938 | 0.030 | 6.091 |
| Effi | 390 | 0.423 | 0.302 | 0.070 | 1.230 |
| Gini | 390 | 0.644 | 0.155 | 0.375 | 0.930 |
| CV | 390 | 0.190 | 0.290 | 0.044 | 1.683 |
| Pcap | 390 | 0.317 | 0.186 | 0.083 | 0.802 |
| Phum | 390 | 0.517 | 0.954 | 0.122 | 5.082 |
| Pgdp | 390 | 3.343 | 1.731 | 1.312 | 7.607 |
| Info | 390 | 0.066 | 0.095 | 0.002 | 0.517 |
| Gove | 390 | 1.820 | 1.501 | 0.492 | 6.584 |
| Mark | 390 | 34.636 | 4.716 | 23.887 | 44.137 |
| Open | 390 | 2.358 | 2.028 | 0.049 | 7.961 |
Table 2.
Benchmark regression results.
| Variable | M (1) | M (2) | M (3) | M (4) |
|---|---|---|---|---|
| PI | 0.078 * | 0.087 ** | 0.072 * | 0.132 * |
| (1.78) | (2.14) | (1.90) | (1.90) | |
| ln_Pcap | 0.114 ** | 0.128 ** | ||
| (2.12) | (2.16) | |||
| ln_Phum | 0.395 ** | 0.389 ** | ||
| (2.32) | (2.72) | |||
| ln_Pgdp | 0.249 *** | −0.300 ** | ||
| (2.98) | (−2.67) | |||
| ln_Info | 0.446 *** | −0.421 *** | ||
| (3.32) | (−3.30) | |||
| ln_Gove | −0.484 ** | 0.078 * | ||
| (−2.32) | (1.85) | |||
| ln_Mark | 0.823 * | −0.381 ** | ||
| (1.90) | (−2.56) | |||
| ln_Open | 0.208 ** | −0.154 * | ||
| (2.27) | (−1.76) | |||
| _cons | −1.211 *** | −2.774 | −2.174 *** | −3.394 |
| (−3.77) | (−0.34) | (−10.49) | (−0.48) | |
| Adj R2 | 0.533 | 0.605 | 0.668 | 0.663 |
Notes: 1. The value of t is in parentheses; 2. ***, ** and * indicate significance at 1%, 5%, and 10% significance levels, respectively.
Table 3.
Robustness test.
| Variable | M (1) | M (2) | M (3) | M (4) | M (5) | M (6) |
|---|---|---|---|---|---|---|
| Ppat | Gini | Effi | CV | Effi | CV | |
| PI | 0.088 * | 0.215 ** | ||||
| (1.91) | (2.04) | |||||
| PI | 0.083 * | 0.315 * | ||||
| (1.93) | (1.72) | |||||
| HHI | 0.089 ** | 0.127 ** | ||||
| (2.17) | (2.73) | |||||
| control variable | YES | YES | YES | YES | YES | YES |
| _cons | −5.325 *** | −5.696 *** | −4.861 *** | −3.276 ** | −5.649 *** | −2.155 *** |
| (−2.95) | (−3.15) | (−3.60) | (−2.42) | (−4.96) | (−3.41) | |
| Adj R2 | 0.603 | 0.622 | 0.873 | 0.643 | 0.813 | 0.653 |
Notes: 1. The value of t is in parentheses; 2. ***, ** and * indicate significance at 1%, 5%, and 10% significance levels, respectively.
Table 4.
Analysis of regional heterogeneity.
| Variable | ln_Effi | ln_CV | ||||
|---|---|---|---|---|---|---|
| East | Central | West | East | Central | West | |
| M (1) | M (2) | M (3) | M (4) | M (5) | M (6) | |
| PI | −0.312 * | 0.482 ** | 0.831 * | 0.046 ** | 0.251 ** | −0.147 ** |
| (−2.10) | (2.91) | (1.85) | (3.04) | (3.13) | (−3.36) | |
| Control variable | YES | YES | YES | YES | YES | YES |
| _cons | 0.440 *** | 0.707 ** | 0.236 *** | −3.4727 | −6.422 *** | −2.071 ** |
| (5.22) | (2.49) | (3.69) | (−1.47) | (−7.91) | (−3.84) | |
| Adj R2 | 0.618 | 0.585 | 0.672 | 0.524 | 0.999 | 0.606 |
Notes: 1. The value of t is in parentheses; 2. ***, ** and * indicate significance at 1%, 5%, and 10% significance levels, respectively.
Table 5.
Moderating role of cultural diversity.
| Variable | Innovation Efficiency (ln_Effi) | Innovation Gap (ln_CV) | ||||
|---|---|---|---|---|---|---|
| M (1) | M (2) | M (3) | M (4) | M (5) | M (6) | |
| PI | −0.260 (−0.41) | 3.641 *** (2.85) | 7.500 *** (2.98) | 0.080 * (1.72) | −0.312 * (−2.01) | −2.803 (−0.75) |
| PI × Cult | 1.791 (1.09) | 21.186 *** (3.02) | 55.212 ** (2.68) | 0.063 (0.04) | 2.248 ** (2.23) | 24.213 (0.80) |
| PI × Cult2 | −28.620 *** (−3.34) | −122.469 ** (−2.25) | −2.879 ** (−2.24) | −63.460 (−0.79) | ||
| PI × Cult3 | 79.289 * (1.75) | 51.183 (0.76) | ||||
| Control variable | YES | YES | YES | YES | YES | YES |
| _cons | 2.586 (0.52) | −2.242 * (−1.73) | −3.995 (−0.96) | −5.805 (−1.08) | −5.319 * (−1.90) | −4.188 (−0.68) |
| Adj R2 | 0.624 | 0.755 | 0.780 | 0.583 | 0.667 | 0.551 |
Notes: 1. the value of t is in parentheses; 2. ***, ** and * indicate significance at 1%, 5%, and 10% significance levels, respectively.
Table 6.
Adjustment effect of the distance between cities.
| Variable | Technological Innovation Efficiency (ln_Effi) | Technological Innovation Gap (ln_CV) | ||||
|---|---|---|---|---|---|---|
| M (1) | M (2) | M (3) | M (4) | M (5) | M (6) | |
| PI | 0.408 ** (2.66) | 0.605 ** (2.16) | −16.207 ** (−2.30) | −0.036 ** (−2.06) | −1.331 *** (−3.28) | −9.195 (−1.49) |
| PI × Dist | 0.001 ** (2.24) | 0.006 * (1.92) | 0.145 (0.66) | 0.001 * (2.02) | 0.008 * (1.84) | 0.078 * (1.76) |
| PI × Dist2 | −6.34 × 10⁻⁶ * (−1.76) | −3.10 × 10⁻⁴ * (−1.77) | −8.559 × 10⁻⁶ ** (−2.05) | −1.62 × 10⁻⁴ (−1.56) | ||
| PI × Dist3 | −4.892 × 10⁻¹⁶ (−0.77) | 2.465 × 10⁻¹⁶ (1.51) | ||||
| Control variable | YES | YES | YES | YES | YES | YES |
| _cons | 2.882 (0.36) | 2.066 ** (2.23) | 6.559 (1.07) | −2.340 (−0.32) | −3.441 ** (−2.43) | −1.777 (−0.15) |
| Adj R2 | 0.619 | 0.587 | 0.812 | 0.512 | 0.667 | 0.633 |
Notes: 1. The value of t is in parentheses; 2. ***, ** and * indicate significance at 1%, 5%, and 10% significance levels, respectively.
Publisher’s Note: MDPI stays neutral with regard to jurisdictional claims in published maps and institutional affiliations. |
© 2022 by the authors. Licensee MDPI, Basel, Switzerland. This article is an open access article distributed under the terms and conditions of the Creative Commons Attribution (CC BY) license (https://creativecommons.org/licenses/by/4.0/).
Share and Cite
MDPI and ACS Style
Ye, Z.; Zou, C.; Huang, Y. Impact of Heterogeneous Spatial Structure on Regional Innovation—From the Perspectives of Efficiency and Gap. Sustainability 2022, 14, 12095. https://doi.org/10.3390/su141912095
AMA Style
Ye Z, Zou C, Huang Y. Impact of Heterogeneous Spatial Structure on Regional Innovation—From the Perspectives of Efficiency and Gap. Sustainability. 2022; 14(19):12095. https://doi.org/10.3390/su141912095
Chicago/Turabian StyleYe, Zi, Chen Zou, and Yongchun Huang. 2022. "Impact of Heterogeneous Spatial Structure on Regional Innovation—From the Perspectives of Efficiency and Gap" Sustainability 14, no. 19: 12095. https://doi.org/10.3390/su141912095
Note that from the first issue of 2016, this journal uses article numbers instead of page numbers. See further details here.