Article

A Case Study of Initial Vegetation Restoration Affecting the Occurrence Characteristics of Phosphorus in Karst Geomorphology in Southwest China

College of Eco-Environmental Engineering/The Institute of Karst Wetland Ecology, Guizhou Minzu University, Guiyang 550025, China
*
Author to whom correspondence should be addressed.
Sustainability 2022, 14(19), 12277; https://doi.org/10.3390/su141912277
Submission received: 8 August 2022 / Revised: 22 September 2022 / Accepted: 26 September 2022 / Published: 27 September 2022

Abstract

:
Phosphorus (P) is one of the necessary nutrient elements in the process of plant growth and development. The temporal and spatial distribution characteristics of phosphorus content can not only reflect the soil structure and availability, but also affect the growth of wetland vegetation, the formation of the environment, and the process of vegetation succession. In this paper, taking Guizhou Caohai Nature Reserve as the research object, the temporal and spatial substitution method was used to study the distribution and influencing factors of soil total phosphorus (TP) and soil available phosphorus (AP) under different geomorphological environments (non-karst landforms, karst landforms, and geomorphology after vegetation restoration (5 years)). The results showed that (1) the TP content in the topsoil of the restored vegetation landform was generally higher than that in the topsoil of the karst landform and non-karst landform, and the distribution difference of the AP content in the three areas was slight. At the top, hillside, and foot of the mountain, the contents of TP and AP in the non-karst landform and karst landform decreased with increasing soil depth and accumulated at the foot of the mountain. (2) The results of the correlation analysis showed that the interpretation rates of TP and AP by each soil physicochemical factor were the highest, reaching 64–86%, while the interpretation rate of TP and AP by the combined action of multiple physicochemical factors was relatively small; in addition, there was a significant correlation between environmental factors and soil TP and AP (p < 0.05). (3) Compared with unrepaired karst landforms, in the process of vegetation restoration (5 years), TP content has convergence between geomorphology after vegetation restoration and non-karst landforms, while AP content fluctuates greatly. The analysis showed that the changes in soil TP and AP contents were mainly affected by vegetation communities, while the changes in soil TP and AP contents in mountain areas were also affected by soil organic matter, pH, soil particle size, and climatic conditions.

1. Introduction

Karst landforms account for approximately 12% of the total land area of the world [1]. The southwestern karst area, with the Guizhou Plateau at its center and an area of more than 5.5 × 10⁵ km2, is one of the three major concentrated karst areas in the world [2]. This area is characterized by a small environmental capacity, weak water holding capacity, very slow soil formation, weak anti-interference ability, and easy soil texture degradation [3]. At the same time, due to the interference and destruction of human activities, the soil in the karst area is seriously eroded, the bedrock is exposed in a large area, a large amount of nutrients is lost, the supply of soil water and nutrients is insufficient, the conservation capacity is poor, and the fertility is seriously reduced, thus limiting the productivity of karst mountain vegetation [4,5,6]. In recent years, governments at all levels have implemented a series of rocky desertification control measures, such as “returning farmland to forest and grassland”, to adjust the land use patterns in karst areas in southwestern China on a large scale. Soil quality has been effectively improved [7,8]. Soil erosion and rocky desertification have also been controlled over time, but the situation is still grim [9,10,11]. At present, the restoration problems in the southwestern karst area are mainly focused on and related to the selection of vegetation restoration methods and the evaluation of the effects before and after vegetation restoration, such as the effects of land use types and succession processes on plant community structure [12,13], soil physical and chemical properties [14], microbial communities, and ecostoichiometric characteristics [15]. However, the driving mechanism of vegetation restoration on the change in soil’s physical and chemical properties is not clear [16]. Soil phosphorus is one of the important limiting factors of karst plant growth. The temporal and spatial distributions of phosphorus content can not only reflect the soil structure and availability but also affect the growth of wetland vegetation, the formation of the environment, and the process of vegetation succession [11,17,18,19,20]. Therefore, the above problems can be addressed by studying the change characteristics of soil phosphorus and their inherent correlation with soil nutrients in the Caohai Nature Reserve before and after vegetation restoration.
Phosphorus (P) is an indispensable nutrient element for plant growth and metabolism and an important part of the ecosystem’s nutrient cycle, playing a key role in plant growth, development, and reproduction [21]. P deficiency limits ecosystem net primary productivity, nitrogen fixation, and carbon storage [22,23]. The P element in the ecosystem mainly comes from the weathering of minerals and rocks, while the most common primary phosphate mineral is apatite, including various calcium phosphates and amorphous aluminum and iron phosphates [24,25]. Due to the slow weathering rate and deposition of rocks, the P cycle is slow on a global scale, reaching approximately 108 years [26]. Therefore, in a short time, the P in the soil mainly comes from the migration and transformation between plants and soil and the output process in the ecosystem [27,28]. Among them, total phosphorus (TP) is not only an important part of promoting the soil P cycle but also an important index for evaluating soil fertility, physical and chemical properties, biological properties, etc. [29,30,31]. However, most P in the soil exists in a delayed state. A high TP content does not indicate a sufficient P supply, but when the TP content is lower than a certain level, it may indicate an insufficient P supply. Therefore, the TP content as a single index cannot reflect the supply state of soil P, and the change in soil TP content under the karst landform is weak, which makes it difficult to reflect the relationship with short-term soil remediation. Available phosphorus (AP) is a commonly used index in the study of soil TP that can reflect the slight changes in the soil before the change in soil TP. Although it accounts for a small proportion of soil TP, as one of the most important energy sources in the ecosystem, it can reflect the availability of soil P and soil quality to varying degrees.
Guizhou Weining Caohai National Nature Reserve, located in the southwest of Weining County in the west of Guizhou Province, is a representative karst rocky desertification area in southwest China. In this study, the spatiotemporal substitution method was used to select three kinds of geomorphological landforms (non-karst landform, karst landform, and geomorphology after vegetation restoration (vegetation restoration)) in the Guizhou Caohai Nature Reserve as the research objects [32].
Through the analysis of the internal correlation between soil P and environmental factors and the role of vegetation restoration in different geomorphological environments in the Guizhou Caohai Nature Reserve, the vegetation restoration effect mechanism on soil P was discussed. This study provides a specific theoretical basis for improving the function of vegetation restoration and the rational utilization of soil P resources.

2. General Regional Characteristics and Research Methods

2.1. General Characteristics of the Research Area

The study area is located in Guizhou Weining Caohai National Nature Reserve (26°49′–26°53′ N, 104°12′–104°18′ E). It is located in the center of Wumeng Mountain in the middle of the Yunnan-Guizhou Plateau. It contains the largest freshwater natural wetland lake in Guizhou. The local topography is formed by the gentle hills of the western, southern, and eastern plateaus [33]. The area belongs to the mountain warm temperate zone with a humid monsoon climate and the characteristics of a warm winter and cool summer and dry winter and wet summer. Precipitation is mainly concentrated in the summer, which is the wetland recharge period. The winter is relatively dry, the annual average temperature is 10.69 °C, the annual average rainfall is 950.9 mm, the frost-free period is 208.6 d, the dry and wet seasons are obvious, the soil type is mainly yellow soil lime soil, the forest coverage is less than 15%, and the rock exposure rate is more than 75%. With a well-developed soil surface, stone pits, and other niches, it is a typical well-developed plateau wetland ecosystem [34].

2.2. Research Methods

(1)
Sample collection
Based on the geomorphological investigation of Caohai Nature Reserve, three sample landforms were set up as experimental plots, of which the karst and vegetation restoration geomorphological zones are located in Jiangjiawan in the Caohai Nature Reserve, and these zones have the same habitat and are used for vegetation restoration and comparative study, respectively. The basic situation is shown in Table 1: The years of vegetation restoration were 3–4 years, mainly artificial vegetation (elm + herb); before restoration, the soil type was lime soil, and the shrub community was mainly Artemisia and sedge [35,36]. At the same time, the non-karst geomorphological landform (located in Yangguan Mountain) was added for comparative study. Samples were collected in August 2019, and the soil P content of the three sample zones was studied by the “spatiotemporal substitution method”. From top to bottom, there were 5 sampling sites: Mountaintop (MT), hillside (HS), hillside (BM), shore (SS), and wetland (WL) in each landform, and 3 groups of parallel plots were set up at the same time, for a total of 39 sites (Figure 1). The soil samples were collected, and the plant community characteristics of the corresponding sites were recorded. The depth of the sampling profile was 50 cm, and the depth interval was 10 cm. The soil samples collected in each sample plot were fully mixed after removing litter, and 1 kg of soil was retained to represent the soil samples of the sample plot. A total of 195 soil samples were obtained in this study. The soil samples were sealed and marked in a self-sealed bag and brought back to the laboratory after cryopreservation. The collected samples were air-dried, crushed, screened, marked, and stored in a cool and dry place.
(2)
Treatment and determination of samples
TP content was determined by melt-molybdenum, antimony, and scandium colorimetry [37], Briefly, we put 1 g of the soil sample through a 100-mesh sieve (pore diameter 0.25 mm) in a 50 mL flask, wet it with a small amount of water, added concentrated H2SO4 8 mL, shook it well, added 10 drops of perchloric acid (HClO4) 70–72%, and shook it well. It was heated in a sand bath for 40–60 min (GWSY-2, China). Finally, it was rinsed with deionized in a 100 mL volumetric flask. Then, 5 mL of the filtrate was absorbed and it was placed in a 50 mL volumetric bottle, to which the display agent was added. After fixing the volume, an ultraviolet spectrophotometer (UV-5100PC, China) was used for colorimetric determination at the wavelength of 700 nm.
AP content was determined by the Olsen method [38]. We put 2.5 g of the soil sample through a 100-mesh sieve (pore diameter 0.25 mm) in a 150 mL flask, added a 0.5 mol/L NaHCO3 solution in a volume of 50 mL, oscillated it for 30 min (SHA-C, China), allowed 5 mL of the filtrate to be absorbed, and put it in a 50 mL volumetric bottle. We then added 0.5 mol L−1 NaHCO3 solution to 10 mL and, finally, fixed the volume with deionized water. After being placed at room temperature at 25 ℃ for 30 min, a UV spectrophotometer (UV-5100PC, China) was used for colorimetric determination at the wavelength of 880 nm.
Nitrate nitrogen (NO3-N), ammonium nitrogen (NH4+-N), soil organic carbon (SOC), readily oxidizable carbon (ROC), dissolved organic carbon (DOC), pH, soil bulk density (BD), electrical conductivity (EC), and soil moisture (SWC) were measured as described previously [39]. Chemicals, including Sulfuric acid, hydrochloric acid, and Sodium hydroxide, were ordered from Sinopharm Chemical Reagent Co., Ltd. (Shanghai, China). of reagent grade or higher purity. The physical and chemical properties of the soil are shown in Table 2.
(3)
Data analysis and processing
The data were analyzed using Excel 2007 and SPSS 26.0. Redundancy analysis (RDA) of the P content and physicochemical properties of the soil was performed by Canoco Software 5.0. The drawing was performed in Origin 9.1 software.

3. Results

3.1. Distribution Characteristics of P Content in the Topsoil of Different Landforms

(1)
Distribution characteristics of TP with different particle sizes in topsoil
The spatial distribution of the TP content in soils with different particle sizes in the three sample zones is shown in Figure 2. In the non-karst landform, the soil TP content increased gradually from MT to WL, and there was a significant difference between the soil TP content in the MT-BM region and the soil TP content in the SS-WL region. In the karst landform, the soil TP of different particle sizes in each region showed a gradual decrease, and the soil TP content of 0.15 mm and 0.12 mm particles in the HS, BM, and WL regions was significantly different from that in the SS regions. In the geomorphology after vegetation restoration landforms, the distribution of soil TP content was similar to that in non-karst landforms, and the soil TP content in the MT region was significantly different from that in other areas.
(2)
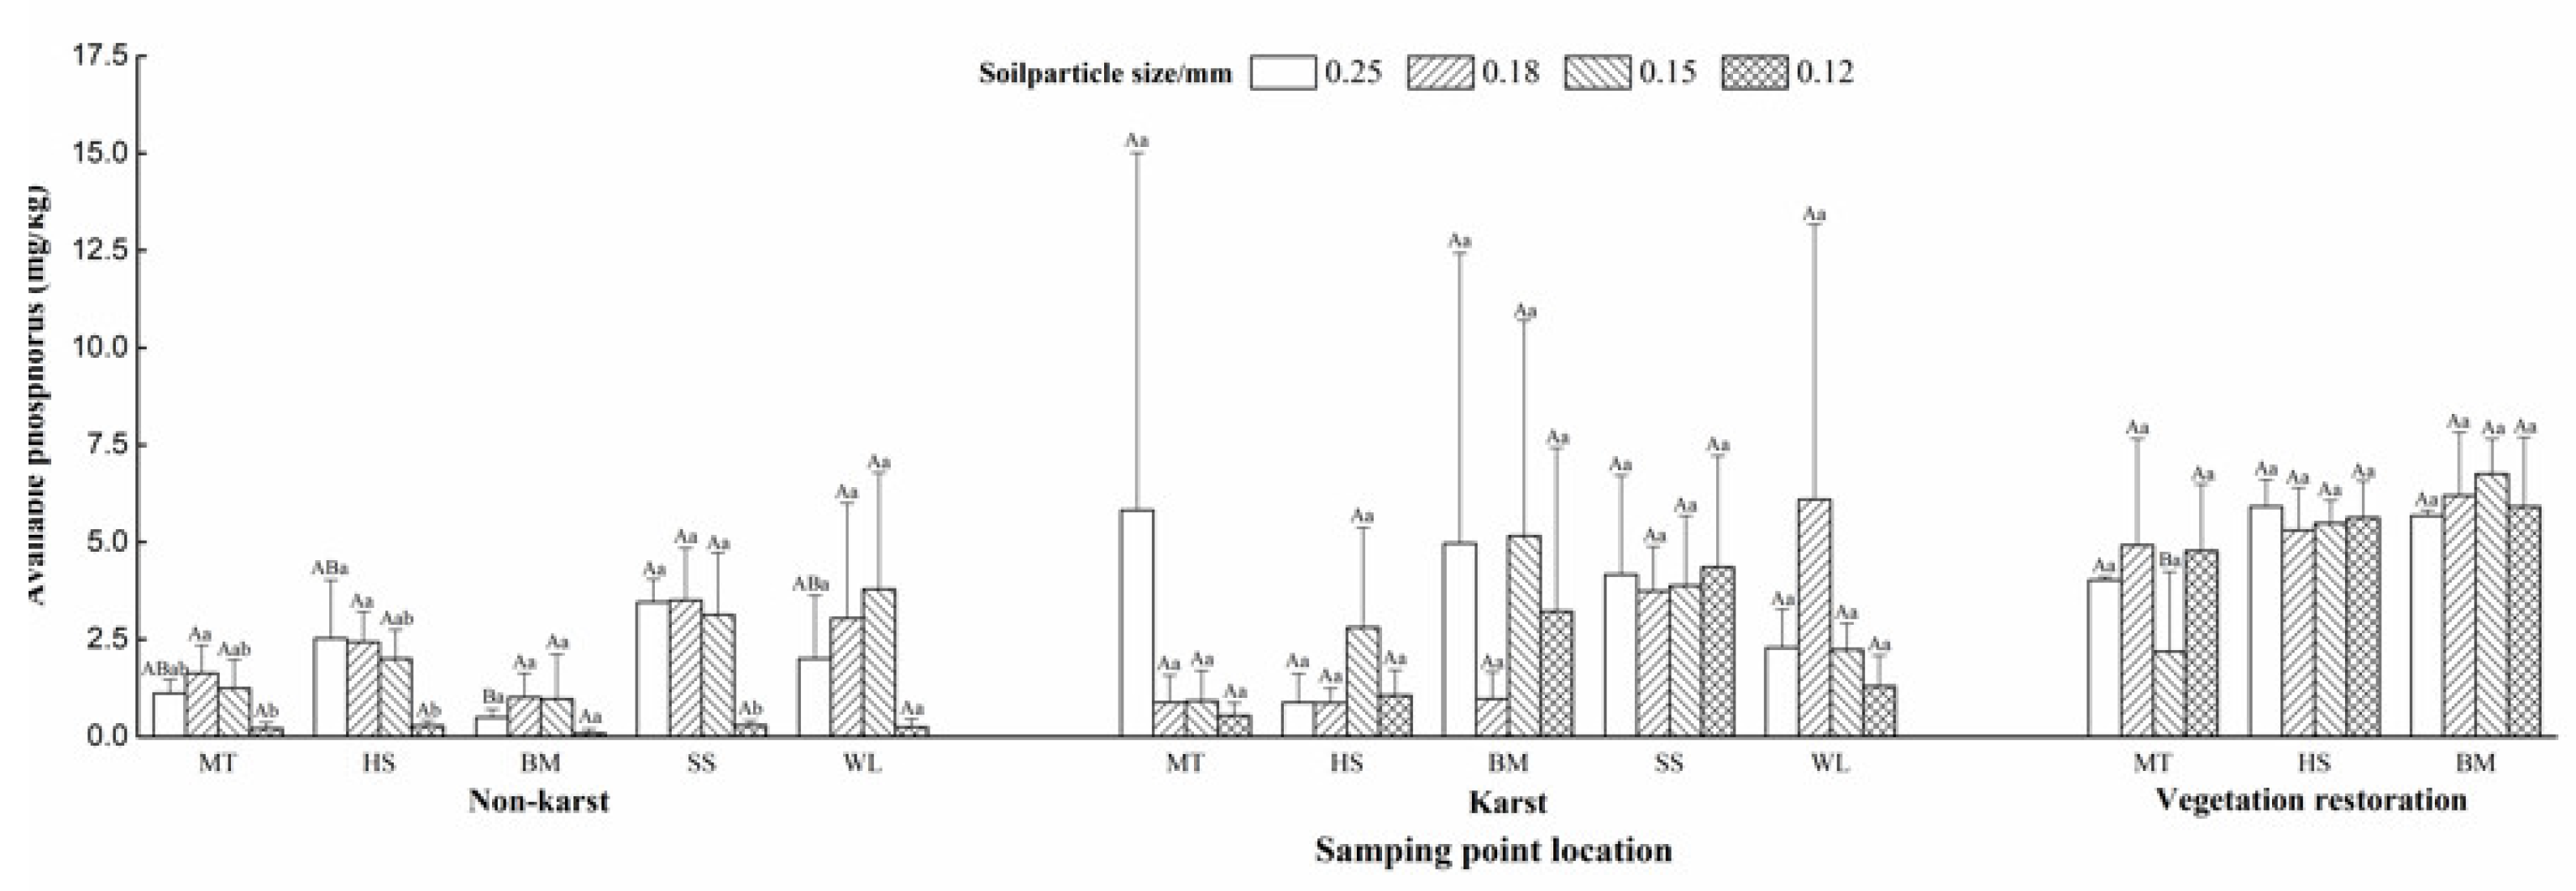
Distribution characteristics of AP in different soil particle sizes
The spatial distribution of the soil AP content in soils with different particle sizes in the three sample zones is shown in Figure 3. In the non-karst landform, the soil AP content of the 0.25 mm particle size in the BM region was significantly different from that in other regions. In the same region, the soil AP content of the 0.12 mm particle size in the BM region was not significantly different from that of the other particle size soils. The soil AP content of the 0.12 mm particle size in the other regions was significantly different from that of other particle size soils. In the karst and geomorphology after vegetation restoration, the soil AP content of 0.15 mm particles in the MT region with vegetation restoration was significantly different from that of 0.15 mm particles in other regions. There was no significant difference in the soil AP content among the other particle sizes in each region.

3.2. Vertical Distribution Characteristics of Soil P Content in Different Landforms

(1)
Distribution characteristics of the TP content in soils of different landforms
The spatial distribution of soil TP content in the three sample zones is shown in Figure 4. Vertically, the soil TP showed deep accumulation in the MT, HS, and BM regions with karst landform and the HS region with geomorphology after vegetation restoration. The soil TP in the other regions of the three zones showed an overall decreasing trend in soil TP with an increasing soil depth. In the horizontal direction, the overall trend of the TP content in the non-karst landform and geomorphology after vegetation restoration was MT < HS < BM < SS, WL. Among the regions in the karst landform, the SS region had the highest TP content, and the WL region had the lowest TP content.
(2)
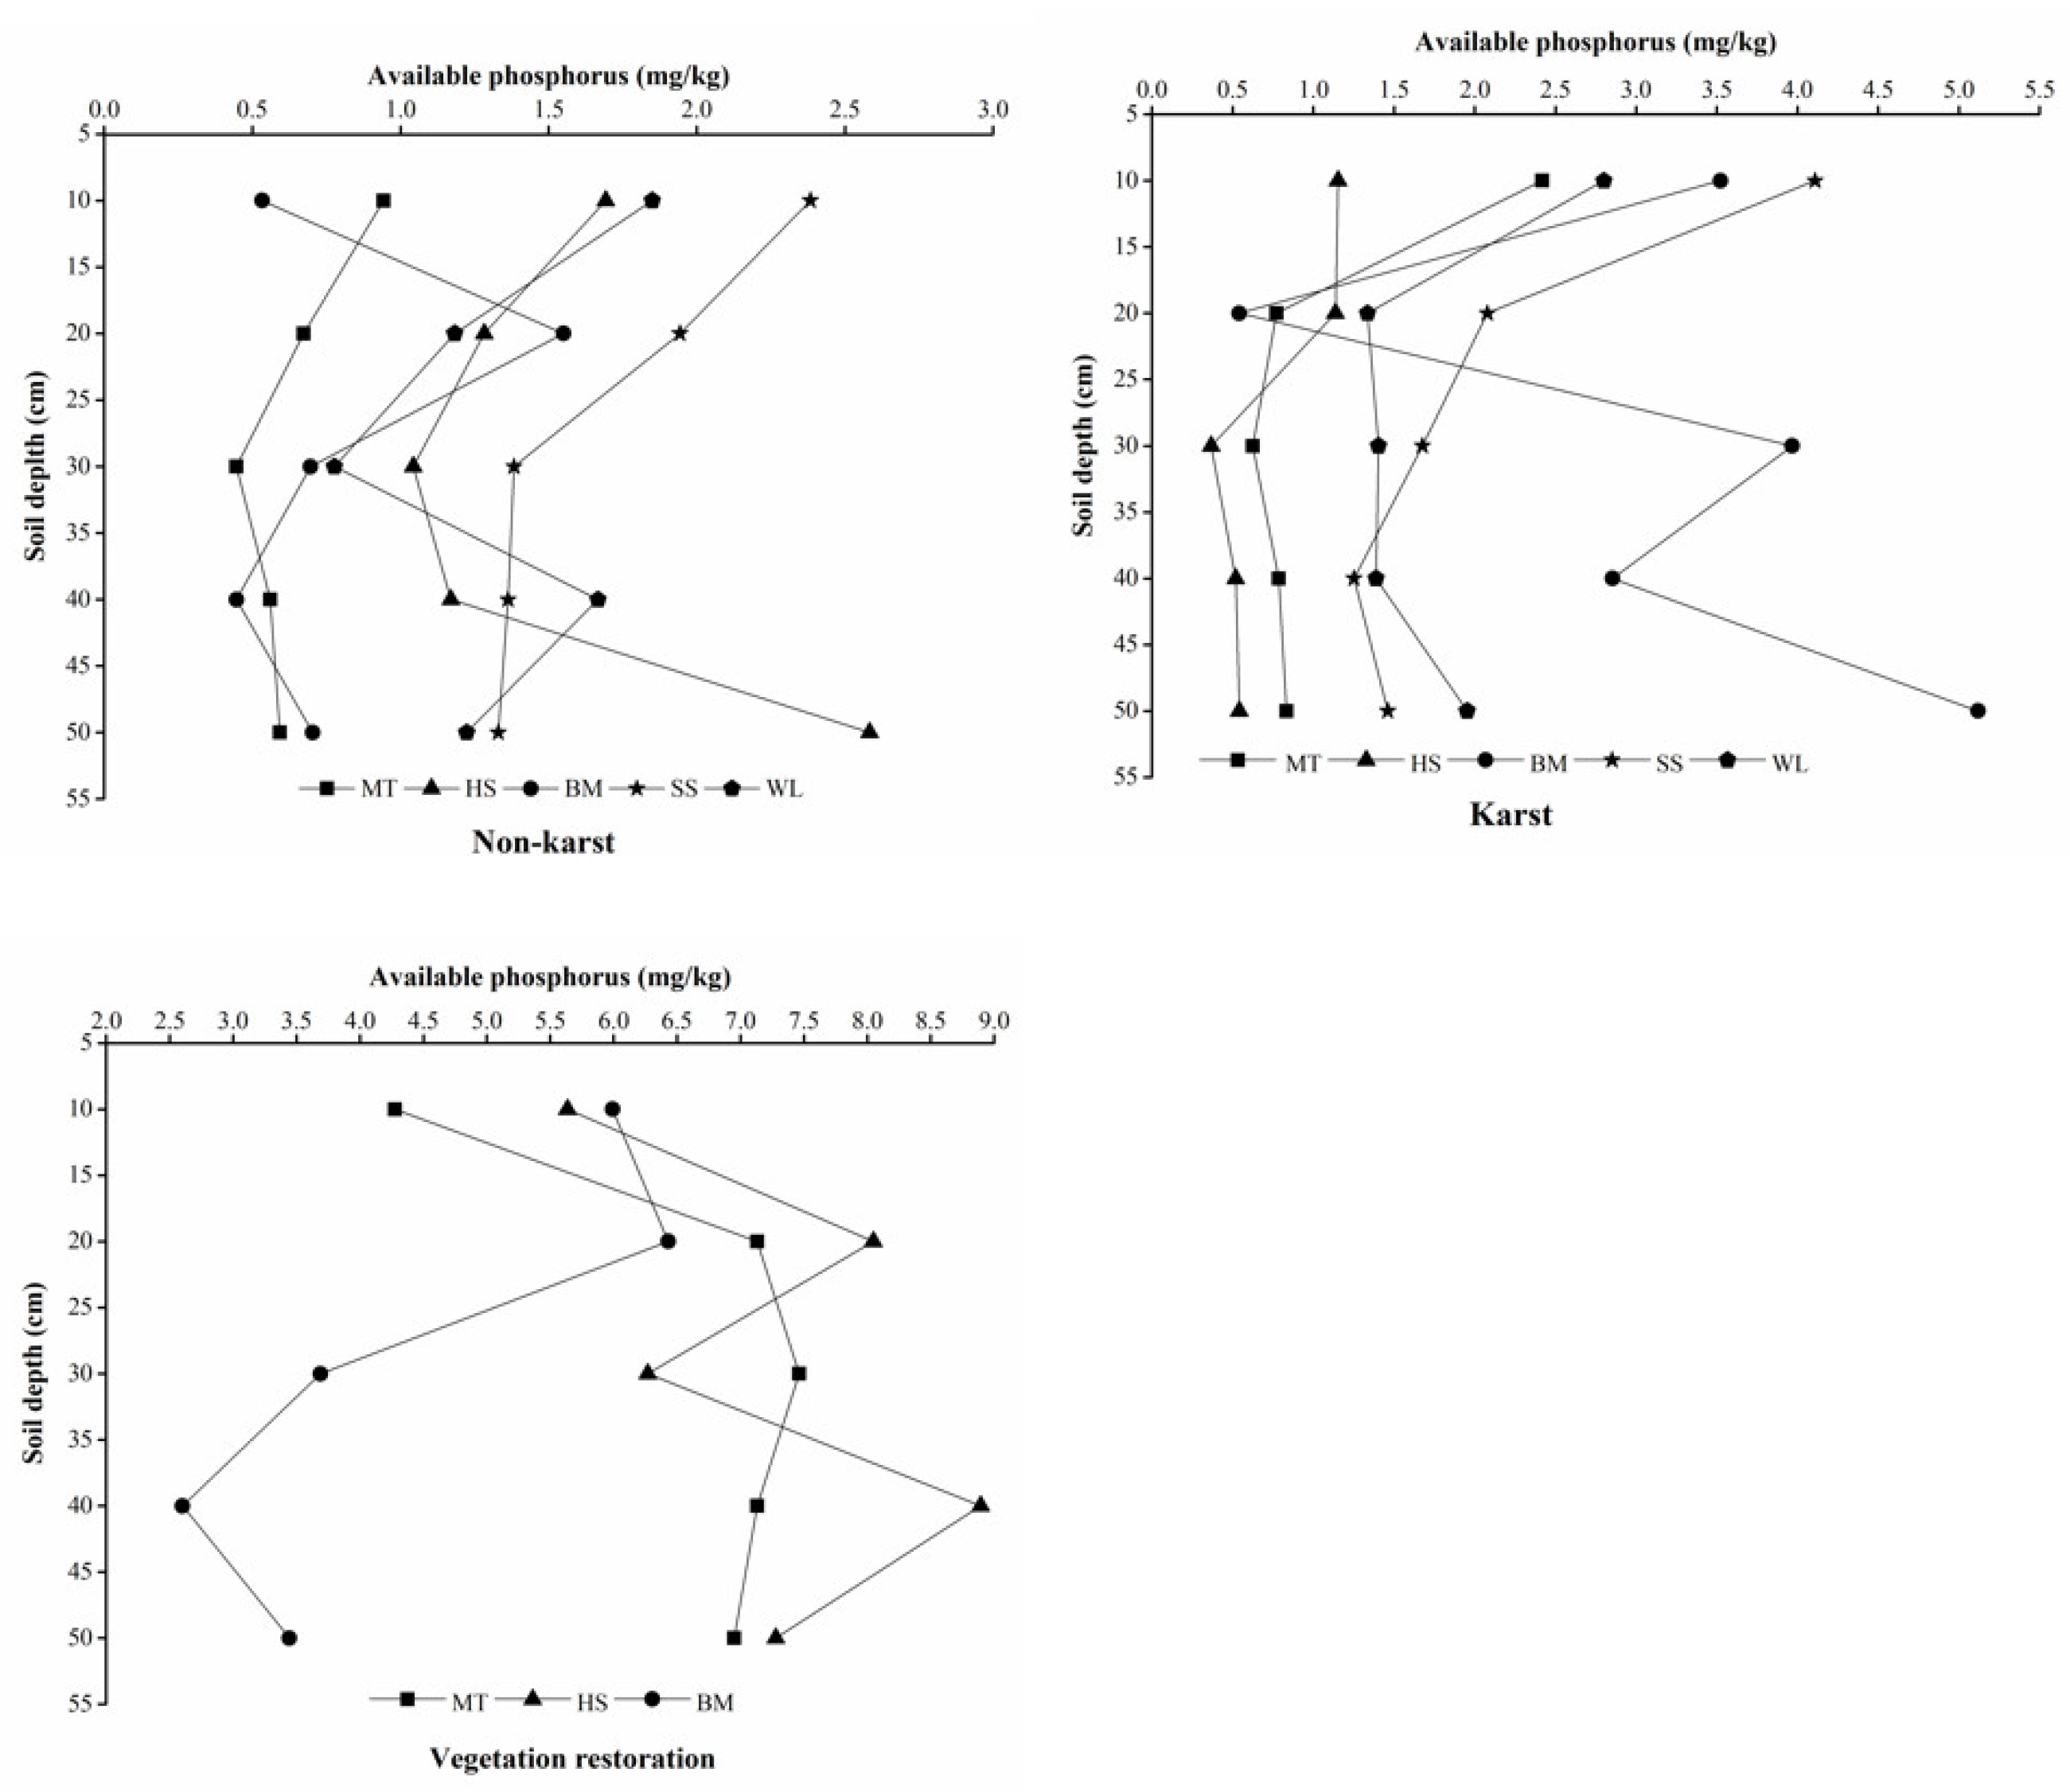
Distribution characteristics of AP content in soils of different landforms
The spatial distribution of the soil AP content in the three sample zones is shown in Figure 5. Vertically, the AP content in the three landforms was concentrated in the surface layer. With increasing soil depth, the AP content decreased gradually. In the non-karst landform, HS and BM accumulated in the deep soil layer. In the karst landform, the AP content in the BM region accumulated in not only the surface layer but also the deep layer. In the geomorphology after vegetation restoration, there was deep accumulation in only MT and HS. Horizontally, the content of AP in the surface layer of soil increased gradually from MT to SS in the non-karst landform, and the content of AP in SS and WL was the highest. In the karst landform, the content of AP in the surface layer of soil first decreased and then increased from MT to SS. The AP content decreased gradually in the HS region and increased gradually in the SS region. However, the AP content decreased gradually from MT to BM in the geomorphology after vegetation restoration.

3.3. Correlation Analysis between P Content and Soil Physical and Chemical Properties

(1)
Principal coordinate analysis (PCA) of soil physical and chemical properties in different geomorphological landforms
The principal component analysis (PCA) of the soil’s physical and chemical properties under three sample bands is shown in Figure 6. The physical and chemical properties of the soils in the different regions of the three zones were mainly controlled by two principal coordinate (PC) components. Among them, the PC1 axis explained 31.572% of the data variation, and the PC2 axis explained 22.666% of the data variation, with a cumulative total variance of 54.238%. Figure 6 shows that the non-karst landform was obviously separated from the karst landform and the geomorphology after vegetation restoration, indicating that there are differences in physical and chemical properties in different landforms. In contrast, the karst landform and geomorphology after vegetation restoration were relatively close and overlapped, indicating that they had similar physical and chemical properties.
(2)
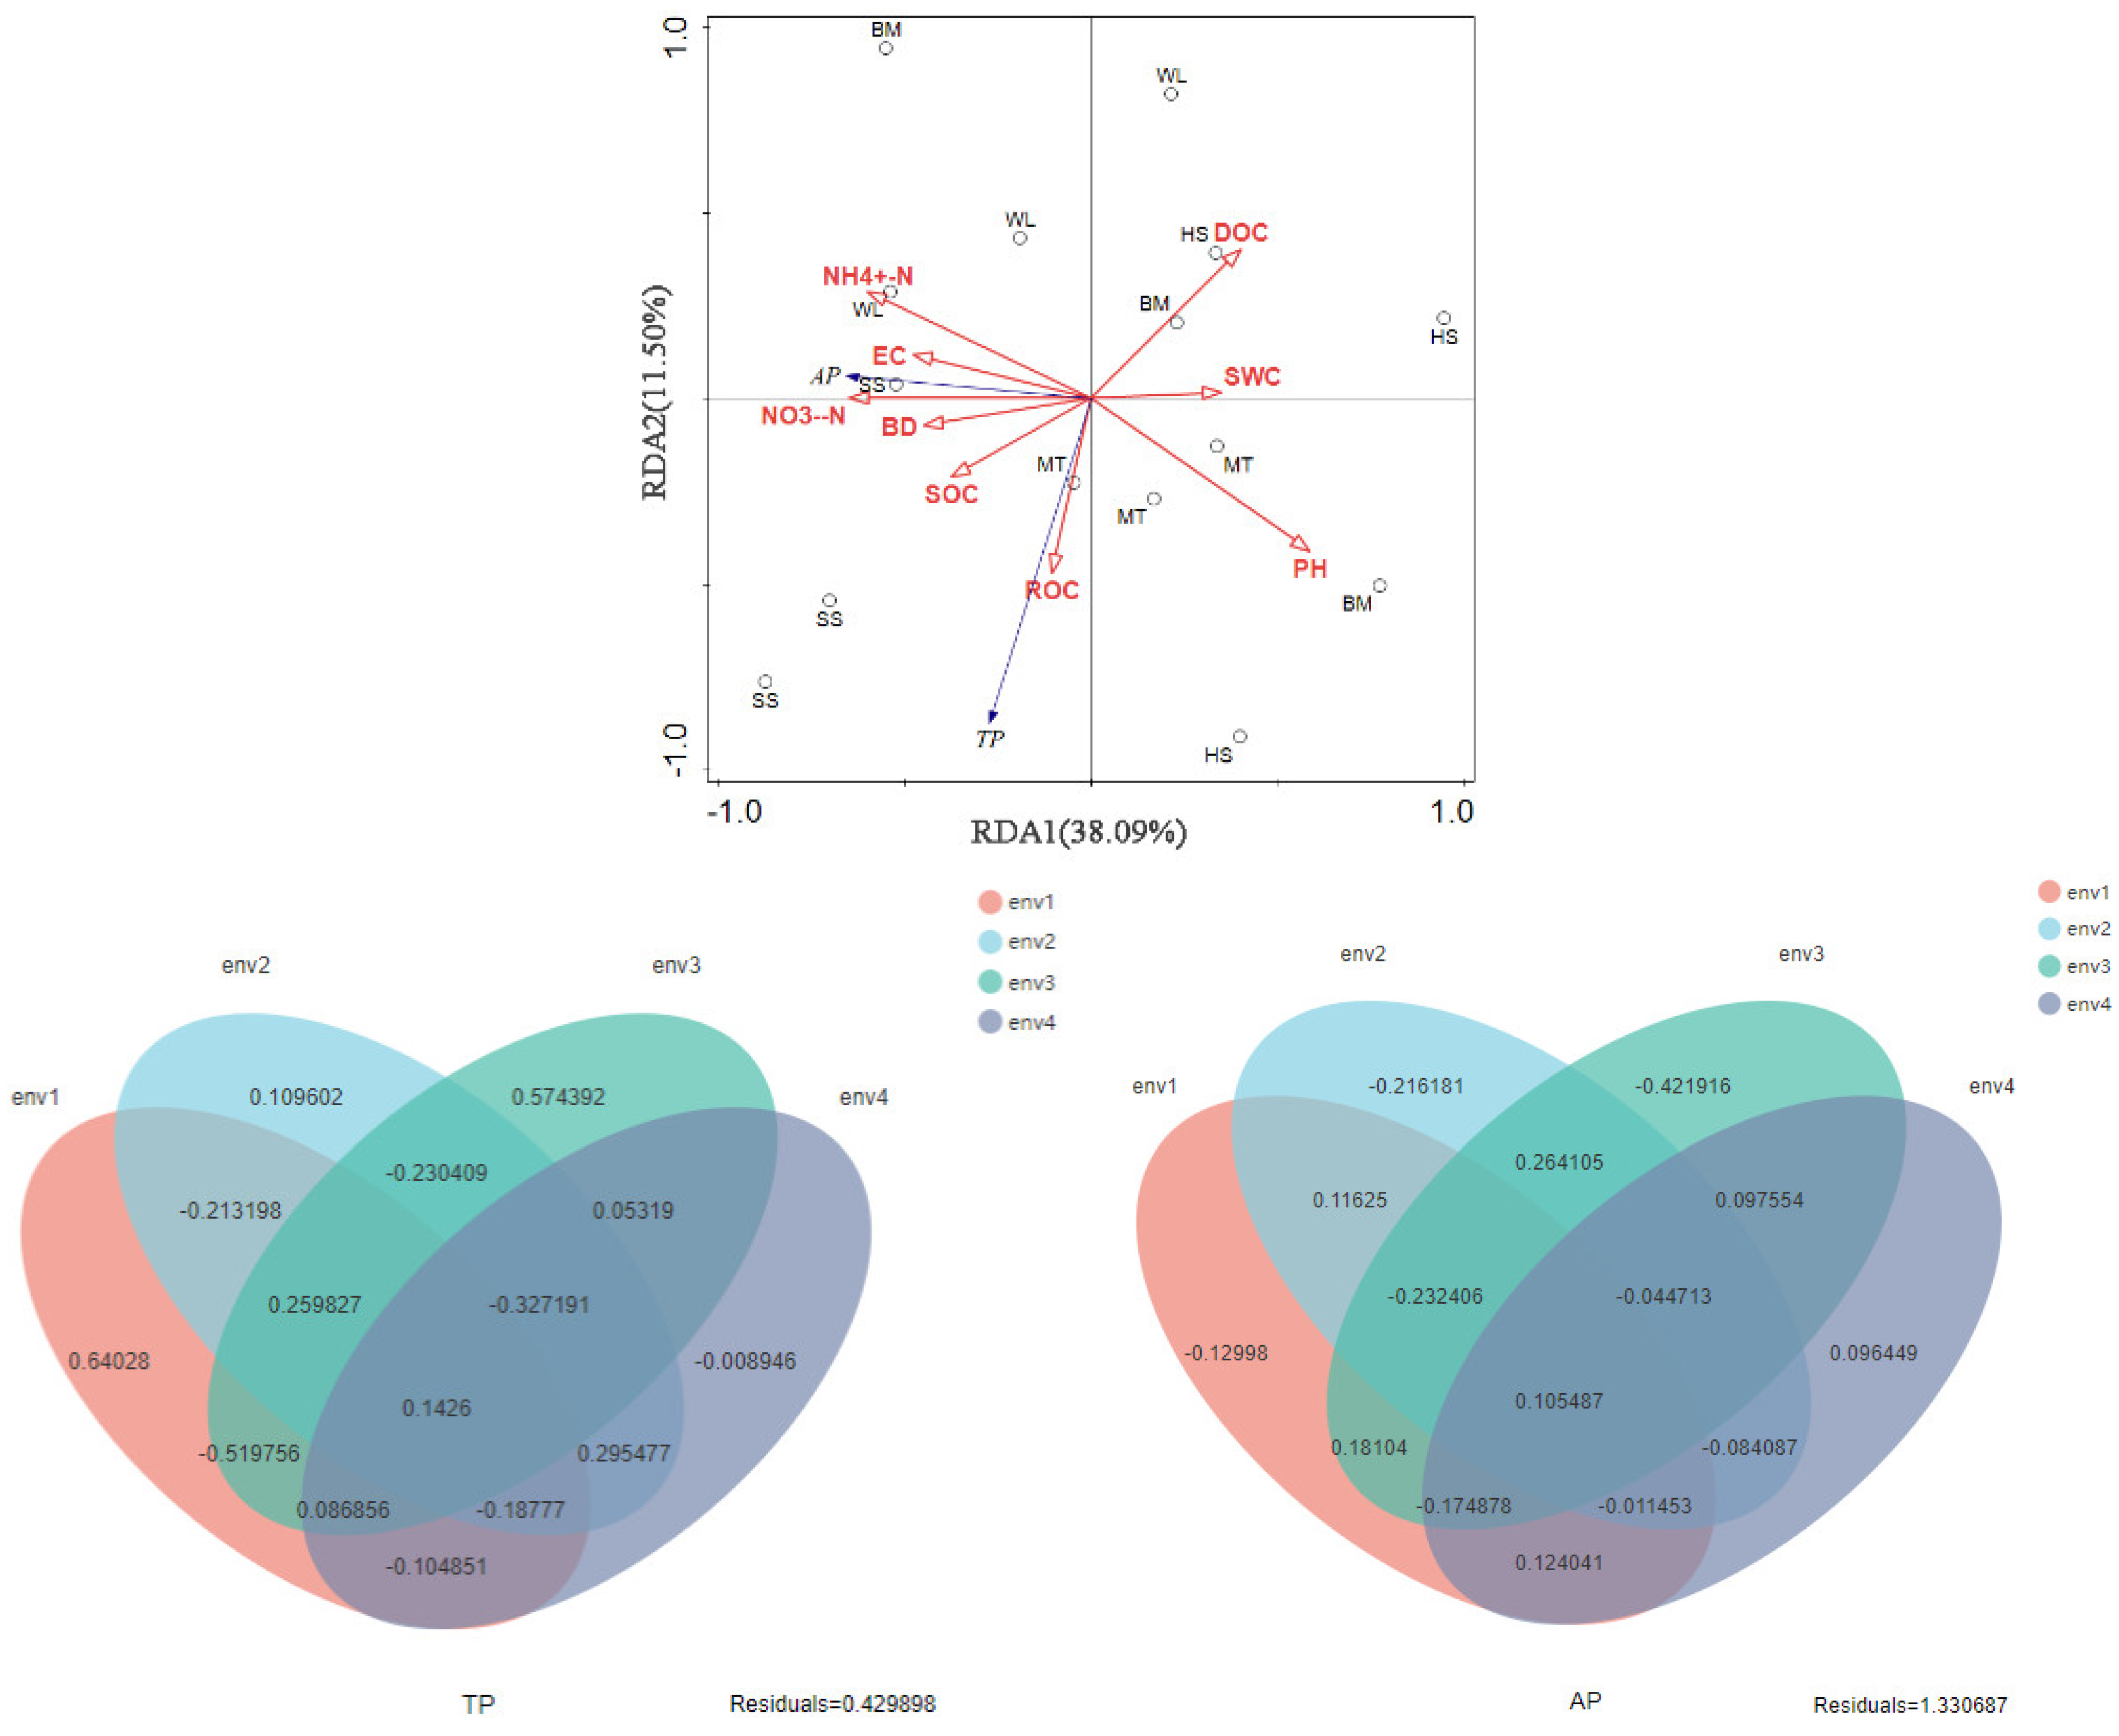
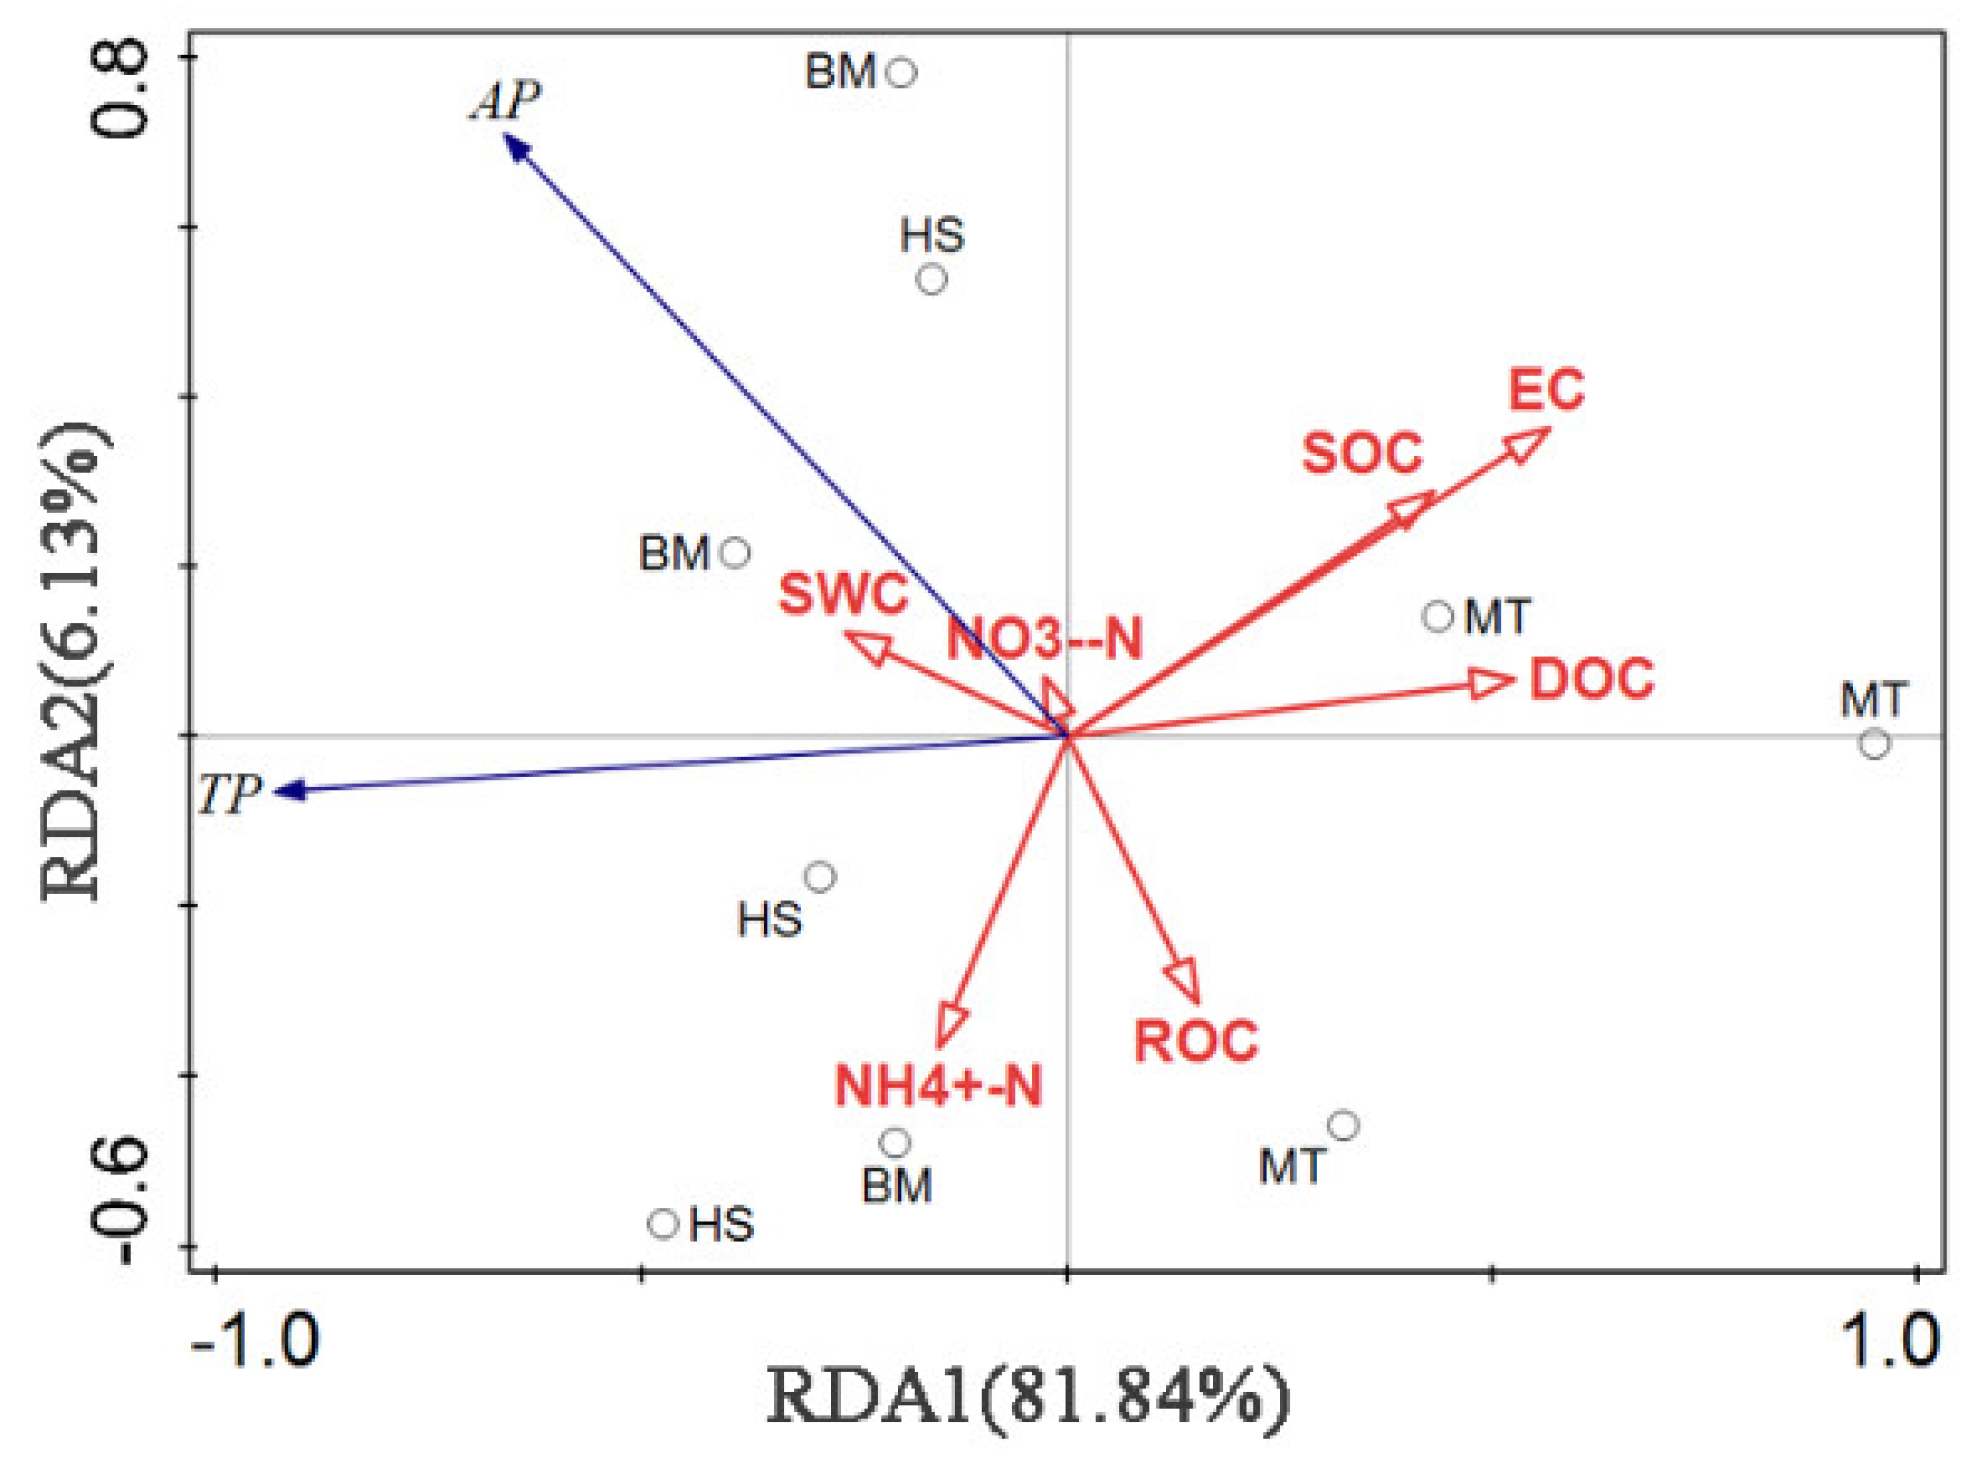
Interpretation of soil P elements and soil physical and chemical factors in different landforms
The DCA sorting results show that the gradient length values in the sorting axis are all less than 3.0. Therefore, this study uses redundancy analysis (RDA), and variance decomposition analysis (VPA) was used to explore the correlation between soil P and soil physical and chemical factors. The correlation between nine soil environmental factors and P (TP, AP) was analyzed by RDA. The results showed that the degrees of interpretation of the first two ranking axes in the non-karst landform, karst landform, and geomorphology after vegetation restoration were 82.05% (RDA1: 64.04% and RDA2: 18.01%), 49.59% (RDA1: 38.09% and RDA2: 11.50%), and 87.97% (RDA1: 81.84% and RDA2: 6.13%), respectively (Figure 7, Figure 8 and Figure 9). At the same time, the variance decomposition analysis of soil environmental factors on soil TP and AP showed that the proportion of variables in which soil TP could not be explained by the above environmental factors was more than 0.36 (that is, the residual degree of explanation). The proportion of variables in which soil AP could not be explained by the above environmental factors was more than 0.51. This result shows that there were some other factors that had a great influence on the content of soil TP and AP in the sample landforms, which need to be further studied.

4. Discussion

4.1. Effect of Karst Geomorphology on the Content of Soil P Components

Some studies have shown that the source of soil P is determined by soil-forming factors such as soil parent material, climate, and time [26,40]. In addition, different erosive hydrological environments caused by changes in land-use patterns and topographic characteristics can also affect the content and distribution of soil P [27]. From the point of view of soil spatial distribution, the content of soil TP in karst and non-karst landforms tends to be enriched in coastal areas. First, the reason may be that the shore area is close to the riverbank, and there is almost no plant cover on the soil surface, which makes TP easily dissolved by river tides; thus, the soil nutrient mineralization rate is faster, the soil TP conversion rate is high, the soil AP capacity and supply are large, and there is more P that can be directly absorbed and utilized by plants, benefiting plant growth and increasing the availability of soil P [41]. Second, the soil TP content of thee karst landform was significantly lower than that of the non-karst landform in the same horizontal space, and the soil TP content was less affected by vertical spatial variation. On the one hand, this may have been due to the relatively minimal vegetation coverage, few plant species, loose soil, and rock weathering of karst landform, as well as a large amount of scouring by rain year-round, which causes the surface TP content of karst landform to gradually decrease [19,42]. On the other hand, because the karst landform is very complex, the surface is rugged and broken [43], and the P element mainly comes from rock weathering and soil formation, which is affected by geological background [44]. As a result, the content of soil TP in th karst landform is significantly lower than that in the same horizontal space of the non-karst landform. The content of soil TP in non-karst landform was mainly concentrated in the surface layer where most of the roots of plants are located and soil microorganism activity is strongest, which has a strong effect on the activation of P, thus increasing the availability and mobility of soil TP [8]. Because the plant root system decreased with increasing soil depth, the availability of P in topsoil was the highest in the research area, and it decreased with increasing soil depth [1,6]. This is consistent with the results that Zhang Qian and others found that the contents of soil TP and AP decreased with the increase in soil depth in karst rocky desertification areas [45].
Soil AP is not only the most effective part of soil available phosphorus storage for crops but also an important index to evaluate the level of soil P supply [46]. The results showed that there were significant differences in the soil AP distribution between the different zones. The soil AP content in the non-karst and karst landforms was concentrated in the surface layer, and the soil AP content in the karst landform was significantly higher than that in the non-karst landform. On the one hand, in the karst landform, the vegetation community is mainly herbaceous, the vegetation coverage is low, and there are few plant roots that are mainly distributed in the surface layer of the soil. However, the plant communities in non-karst landforms are mainly tree and shrub communities. Compared with herb communities, tree and shrub communities have plant roots that are abundant, and microorganisms are abundant [6], which reduces soil erosion and weathering on the surface of the soil and reduces the source of P. At the same time, P is an indispensable part of the plant growth process [47]. With the increase in plant species and microbial biomass, AP in the soil is absorbed by plant roots and microorganisms, which reduces soil AP in non-karst landforms. On the other hand, because karst landforms are affected by soil erosion, the soil AP content migrates to a lower depth through physical transfer so that the soil AP content is reduced by the soil space [27]. At the same time, this scenario also explains why the P content in the foot and shore areas of the karst landform is obviously higher than that in other areas.

4.2. Effect of Vegetation Restoration on Soil P Content

The soil P cycle is part of the sedimentary cycle, and the main source of P in the soil is the release of minerals by weathering and decomposition. The weathered inorganic P is easily soluble in weak acids and then absorbed by plant roots [27]. In the early stage of vegetation restoration, vegetation is an important part of the energy and material flow in ecosystems, and the type of vegetation and root activity affect the spatial distribution of soil nutrients [48]. The results of this study show that the soil TP content in the karst landform was less affected by soil spatial variation, while the TP content in the geomorphology after vegetation restoration was inversely proportional to soil depth, which is similar to that in non-karst landform; this result may be due to the gradual increase in vegetation coverage and animal and plant diversity at the initial stage of vegetation restoration. P in the soil is returned to the soil in the form of organic P through the litter on the soil surface and the remains of animals and plants, which makes the soil TP content accumulate gradually [49]. At the same time, due to the increased growth of aboveground plants and abundant litter, microorganisms and nutrients enter the soil through roots, and hyphae and microorganisms decompose to form cement, which is conducive to the formation of large aggregates on the soil surface [50]. The large specific surface areas of large aggregates can absorb more P, thus promoting the distribution of soil P in large aggregates and increasing the content of TP in the surface soil [51]. After vegetation restoration, the plant roots in the soil increased the content of soil organic matter and provided more energy for soil microorganisms, thus increasing soil phosphatase activity and promoting the mineralization of soil organic P compounds, thus increasing soil TP storage [52,53].
Some studies have shown that in the early stage of natural vegetation restoration (< 5 years), the initial stage of vegetation growth significantly promoted the accumulation of soil AP [54,55]. The results of this study show that there were significant differences in the distribution characteristics of soil AP content among different landforms. The soil AP content in the karst landform was mainly concentrated in the surface layer, the soil AP content in the geomorphology after vegetation restoration was less affected by soil spatial change, and the soil AP content in the karst landform was significantly higher than that in geomorphology after vegetation restoration, which may have been due to the rich vegetation diversity and high organic matter content on the surface of geomorphology after vegetation restoration. As a result, the soil AP in the geomorphology after vegetation restoration dissolved and was absorbed by plants; thus, the content of soil AP in the geomorphology after vegetation restoration decreased [10]. Other studies have pointed out that, in alkaline soil with a pH > 8, the content of organic matter was more abundant, which is beneficial to the growth of phosphorus-solubilizing microorganisms; phosphorus-solubilizing microorganisms improve the ability of plants to obtain P from thee soil by inducing metabolism, which strongly affects the availability of P [56,57]. The pH value of topsoil in the study area fluctuated greatly among the different geomorphological zones, and the pH of the karst landform was significantly higher than that of geomorphology after vegetation restoration. The reason is that alkaline soil with higher pH can promote the release of certain forms of phosphorus [58], thus increasing the AP content of karst landforms in the topsoil. However, alkaline soil strongly adsorbs and fixes water-soluble phosphate [58]; thus, the pH value of soil in the karst landform was higher, and the average content of soil AP was slightly higher than that of the soil in the geomorphology after vegetation restoration, which was related to the adsorption and fixation of water-soluble phosphate.
In addition, although this study discussed the spatial heterogeneity of soil TP and AP under different geomorphological types, the deeper mechanisms, such as the acquisition of vegetation litter, microbial decomposition, and phosphorus stability of other components, need to be further studied in the future.

5. Conclusions

(1)
The content of soil phosphorus in the non-karst landform was significantly lower than that in the karst landform. In the vertical direction, the phosphorus content in the non-karst landform decreased gradually with increasing depth, showing the phenomenon of surface enrichment, while the karst landform did not show surface enrichment. The TP content in the topsoil of the geomorphology after vegetation restoration is generally higher than that of the karst landform and non-karst landform, and the AP content has no obvious distribution. After vegetation restoration, the contents of TP and AP in the surface soil of the karst landform are generally higher than those of karst landform and non-karst landform, indicating that the soil after vegetation restoration can intercept more phosphorus so that plants can absorb and utilize it.
(2)
In the process of vegetation restoration, soil TP content converges between geomorphology after vegetation restoration and non-karst landform, while the soil AP content fluctuates greatly. The analysis shows that the change in soil TP and AP contents is mainly affected by the vegetation community, while the change in soil TP and AP contents in mountain areas is also affected by soil organic matter, pH, soil particle size, and climatic conditions. This shows that vegetation restoration has played a certain role in the control of karst rocky desertification, and this is the first time the distribution of single phosphorus in karst landform has been evaluated through a vegetation restoration model, which has certain research significance.
(3)
After vegetation restoration under karst landform, the increase in vegetation coverage can promote the absorption of phosphorus in topsoil. Although the content of TP and AP is slightly higher than that of karst landform, the difference is small. Due to the short restoration years, further research is needed to further verify the effect mechanism of vegetation restoration on soil phosphorus.

Author Contributions

Y.W. conceived, designed, and conducted the experiment; X.T. analyzed the data and wrote the manuscript; M.Z. and S.W. performed the experiments and sorted data; R.W. assisted in the modification. All authors have read and agreed to the published version of the manuscript.

Funding

This research received funding from the Project funding of Guizhou Provincial Science and Technology Projects (No. [2021] 099).

Institutional Review Board Statement

Not applicable.

Informed Consent Statement

Not applicable.

Data Availability Statement

Not applicable.

Conflicts of Interest

The authors declare no competing financial interests.

References

  1. Wang, S.J. Karst Rocky Desertification—The most serious Eco-geological Environmental problem in Southwest China. Bull. Mineral. Petrol. Geochem. 2003, 22, 120–126. [Google Scholar]
  2. Liu, C.C.; Wei, Y.F.; Liu, Y.G.; Guo, K. Biomass of canopy and shrub layers of Karst forests in Puding, Guizhou, China. Chin. J. Plant Ecol. 2009, 33, 698–705. [Google Scholar]
  3. Sheng, M.Y.; Xiong, K.N.; Wang, L.J.; Li, R.; Tian, X.J. Response of soil physical and chemical properties to Rocky desertification succession in South China Karst. Carbonates Evaporites 2018, 33, 15–28. [Google Scholar] [CrossRef]
  4. Cao, J.H.; Yuan, D.X.; Tong, L.Q.; Azim, M.A.L.L.I.K.; Yang, H.; Huang, F. An Overview of Karst Ecosystem in Southwest China: Current State and Future Management. J. Resour. Ecol. 2015, 6, 247–256. [Google Scholar]
  5. Wang, K.L.; Yue, Y.M.; Ma, Z.L.; Lei, T.W.; Li, D.J.; Song, T.Q. Research and demonstration on technologies for rocky desertification treatment and ecosystem services enhancement in karst peak-cluster depression regions. Acta Ecol. Sin. 2016, 36, 7098–7102. [Google Scholar]
  6. Yan, X.J.; Yang, W.H.; Chen, X.H.; Wang, M.K.; Wang, W.Q.; Ye, D.L.; Wu, L.Q. Soil Phosphorus Pools, Bioavailability and Environmental Risk in Response to the Phosphorus Supply in the Red Soil of Southern China. Int. J. Environ. Res. Public Health 2020, 17, 7384. [Google Scholar] [CrossRef]
  7. Lu, X.Q.; Hiroto, T.; Ding, F.J.; Fang, S.G.; Yang, W.X.; Xu, H.G. Effect of vegetation types on chemical and biological properties of soils of karst ecosystems. Eur. J. Soil Biol. 2014, 61, 49–57. [Google Scholar] [CrossRef]
  8. Hu, P.L.; Xiao, J.; Zhang, W.; Xiao, L.M.; Yang, R.; Xiao, D.; Zhao, J.; Wang, K.L. Response of soil microbial communities to natural and managed vegetation restoration in a subtropical karst region. Catena 2020, 195, 104849. [Google Scholar] [CrossRef]
  9. Yang, S.F.; Wang, C.J.; Sun, Q.Z.; Wang, Y. Analysis on the effectiveness and Countermeasures of Comprehensive Control of Rocky Desertification in Guizhou Province. Soil Water Conserv. China 2021, 6, 8–11. [Google Scholar]
  10. Yu, P.; Zhang, X.; Gu, H.Y.; Pan, J.P.; Chen, X.W. Soil phosphorus fractions and their availability over natural succession from clear-cut of a mixed broadleaved and Korean pine forest in northeast China. J. For. Res. 2022, 33, 253–260. [Google Scholar] [CrossRef]
  11. Cheng, S.D.; Ke, G.G.; Li, Z.B.; Cheng, Y.T.; Wu, H. Soil Available Phosphorus Investigated for Spatial Distribution and Effect Indicators Resulting from Ecological Construction on the Loess Plateau, China. Sustainability 2021, 13, 12572. [Google Scholar] [CrossRef]
  12. Zhang, Y.N.; Zhou, X.G.; Wen, Y.G.; Zhu, H.G.; Wang, L.; Shao, W.Z.; Chen, Q.H. Characteristics of soil microbial community structure of three plantations in a karst region. Guihaia 2021, 42, 1–17. [Google Scholar]
  13. Wang, D.G.; Zhang, Q.Y.; Cao, W.C.; Zhou, G.F.; Wang, J.C. Effects of Different Land Use Types on Soil Phosphorous Availability and Phosphate-solubilizing Bacterial Community Structure. Cin. J. Trop. Crops 2021, 42, 3646–3654. [Google Scholar]
  14. He, Y.; Sheng, M.Y.; Wang, K.; Wang, L.J. Effect of Land Use Change to Constitution, Stability, and C, N, P Stoichiometric Characteristics of Soil Aggregates in Southwest China Karst. Environ. Sci. 2022, 43, 3752–3762. [Google Scholar]
  15. Zhang, J.; Chen, H.S.; Fu, Z.Y.; Wang, K. Effects of vegetation restoration on soil properties along an elevation gradient in the karst region of southwest China. Agric. Ecosyst. Environ. 2021, 320, 107572. [Google Scholar] [CrossRef]
  16. Zhou, X.G.; Wen, Y.G.; Wang, L.; Sun, D.Q.; Ming, A.G. Changes of vegetation and Plant Diversity under different remediation stands of Karst Rocky Desertification. Guangxi Sci. 2022, 29, 71–87. [Google Scholar]
  17. Ding, Q.W.; Bai, J.H.; Gao, H.F.; Xiao, R.; Cui, B.S. Soil Nutrient Contents in Yellow River Delta Wetlands with Different Plant Communities. J. Agro-Environ. Sci. 2009, 28, 2092–2097. [Google Scholar]
  18. Han, Y.; Byoungkoo Choi Chen, X.W. Adsorption and Desorption of Phosphorus in Biochar-Amended Black Soil as Affected by Freeze-Thaw Cycles in Northeast China. Sustainability 2018, 10, 1574. [Google Scholar] [CrossRef]
  19. Zhou, L.Q.; Wu, Y.H.; Cai, Y.; Min, S.X. Coupling Mechanism of Phosphorus and Nitrogen, Carbon Cycles in Critical Zone of Wetland. J. Earth Sci. Environ. 2022, 44, 91–101. [Google Scholar]
  20. Liu, C.Q.; Lang, Y.C.; Li, S.L.; Piao, H.C.; Tu, C.L.; Liu, T.Z.; Zhang, W.; Zhu, S.F. Researches on biogeochemical processes and nutrient cycling in karstic ecologi-cal systems southwest China: A review. Earth Sci. Front. 2009, 16, 1. [Google Scholar]
  21. Yin, X.X.; Hua, L.; Zhang, Z.X.; Hua, L.P.; Gao, J. Study on the Effectiveness of Phosphorus and Mechanism of its Circle in Soil. J. Cap. Norm. Univ. (Nat. Sci. Ed.) 2005, 26, 95–101. [Google Scholar]
  22. Lu, Y.M.; Wu, D.M.; Xu, E.L.; Lu, S.X.; Liu, X.F.; Liu, C.H.; Jiang, Z.K.; Guo, J.F. Effects of Chinese Fir Interplanting with Broadleaved Trees on Soil Phosphorus F ractions. J. Soil Water Conserv. 2020, 34, 275–282. [Google Scholar]
  23. Wang, Y.P.; Law, R.M.; Pak, B. A global model of carbonnitrogen, and phosphorus cycles for the terrestrial biosphere. Biogeosciences 2010, 7, 2261–2282. [Google Scholar] [CrossRef]
  24. Zhou, Q.; Jiang, Y.B.; Hao, J.H.; Ji, J.F.; Li, W. Advances in the Study of Biogeochemical Cycles of Phosphorus. Geol. J. China Univ. 2021, 27, 183–199. [Google Scholar]
  25. Chen, M.L.; Chen, H.; Mao, Q.G.; Zhu, X.M.; Mo, J.M. Effect of nitrogen deposition on the soil phosphorus cycle in forest ecosystems: A review. Acta Ecol. Sin. 2016, 36, 4965–4976. [Google Scholar]
  26. Zhang, H.; Wu, L.N.; Ouyang, K.C.; Feng, Z.W. Responses of riparian soil carbon and phosphorus to land use evolution in karst area. Yangtze River. 2022, 53, 50–57. [Google Scholar]
  27. Xue, X.H.; Xiong, J.S.; Wang, Y.L. Distribution and Residue of Soil Total P and Available P under Different Land Use Types in Northwest Guizhou. J. Henan Agric. Sci. 2017, 46, 44–48. [Google Scholar]
  28. Yang, X.T.; Fan, J.; Ge, J.M.; Du, M.G.; Jin, M. Soil physical and chemical properties and vegetation characteristics of different types of grassland in Qilian Mountains, China. Chin. J. Appl. Ecol. 2022, 33, 878–886. [Google Scholar]
  29. Christine, H.; Alfons, W.; Marie, S. Soil microbial biomass C:N:P stoichiometry and microbial use of organic phosphorus. Soil Biol. Biochem. 2015, 85, 119–129. [Google Scholar]
  30. Li, D.W.; Wang, Z.Q.; Tian, H.X.; He, W.X.; Geng, Z.C. Carbon, Nitrogen and Phosphorus Contents in Soils on Taibai Mountain and Their Ecological Stoichiometry relative to Elevation. Acta Pedol. Sin. 2017, 54, 160–170. [Google Scholar]
  31. Chavarro-Bermeo, J.P.; Arruda, B.; Mora-Motta, D.A.; Bejarano-Herrera, W.; Ortiz-Morea, F.A.; Somenahally, A.; Silva-Olaya, A.M. Responses of Soil Phosphorus Fractions to Land-Use Change in Colombian Amazon. Sustainability 2022, 14, 2285. [Google Scholar] [CrossRef]
  32. Sun, C.L.; Wang, Y.W.; Wang, C.J.; Li, Q.J.; Wu, Z.H.; Yuan, D.S.; Zhang, J.L. Effects of land use conversion on soil extracellular enzyme activity and its stoichiometric characteristics in karst mountainous areas. Acta Ecol. Sin. 2021, 41, 4140–4149. [Google Scholar]
  33. Qi, J.W.; Li, K.M.; Li, Y.C.; Lei, J.H. Restoration Strategies of Caohai Wetland in Guizhou Province. Cent. South For. Inventory Plan. 2012, 31, 39–40. [Google Scholar]
  34. Wang, X.F.; Huang, X.F.; Hu, J.W.; Zhang, Z.M. Relationship Among Soil Organic Carbon and Small Environment and Lithology in the Rocky Desertification Process in Different Karst Landforms. J. Soil Water Conserv. 2020, 34, 295–303. [Google Scholar]
  35. Wu, H.; Zhang, J.L.; Fan, Y.W.; Yu, L.F.; Yan, L.B.; Yuan, C.J. Numerical classification and ordination of forest communities in Caohai basin. J. Nanjing For. Univ. (Nat. Sci. Ed.) 2013, 37, 47–52. [Google Scholar]
  36. Zhang, J.L.; Wu, H.; Yu, L.F.; Yan, L.B.; Yuan, C.J.; Cai, G.J. Grass sea wetland basin is a typical karst forest community α, β diversity analysis. For. Sci. Technol. 2013, 9, 7–11. [Google Scholar]
  37. Murphy, J.; Riley, J.P. A modified single solution method for the determination of phosphate in natural waters. Anal. Chim. Acta 1962, 27, 31–36. [Google Scholar] [CrossRef]
  38. Olsen, S.R.; Sommers, L.E. Phosphorous. In Methods of Soil Analysis: Chemical andMicrobial Properties, Part 2; Page, A.L., Miller, R.H., Keeney, D.R., Eds.; Agronomy Society of America: Madison, WI, USA, 1982; pp. 403–430. [Google Scholar]
  39. Wu, Y.J.; Tian, X.; Zhang, M.Y.; Wang, S. Influence of vegetation restoration on carbon in the lakeside zone of Karst Wetland in Guizhou Plateau. Acta Ecol. Simica 2022, 42, 1–11. [Google Scholar]
  40. Zhao, W.J.; Liu, X.D.; Jin, M.; Zhang, X.L. Ecological Stoichiometric Characteristics of Carbon, Nitrogen and Phosphorus in Leaf-Litter-Soil System of Picea Crassifolia Forest in the Qilian Mountains. Acta Pedol. Sin. 2016, 53, 477–489. [Google Scholar]
  41. Xi, M.; Sun, X.L.; Kong, F.L.; Li, R. Spatial Distribution Characteristics of Phosphorus in Soil and Availability Analysis in Mudflat and Salt Marshes in the Jiaozhou Bay. Wetl. Sci. 2018, 16, 17–23. [Google Scholar]
  42. Zhou, C.Y.; Chen, X.; Yang, P.; Peng, X.; Wu, K.H.; Tang, J.G. Soil Nutrient Content of Different Land-use Types in Karst Rocky Desertification Area in Central Guizhou Province. J. Anhui Agric. Sci. 2008, 36, 15071–15073. [Google Scholar]
  43. Liu, F.; Wang, S.J.; Liu, Y.S.; He, T.B.; Luo, H.B.; Long, J. Changes of soil quality in the process of karst rocky desertification and evaluation of impact on ecological environment. Acta Ecol. Simica 2005, 25, 639–644. [Google Scholar]
  44. Gao, Y.; He, N.P.; Yu, G.R.; Chen, W.L.; Wang, Q.F. Long-term effects of different land use types on C, N, and P stoichiometry and storage in, subtropical ecosystems: A case study in China. Ecol. Eng. 2014, 67, 171–181. [Google Scholar] [CrossRef]
  45. Zhang, Q.; Han, G.L.; Liu, M.; Yang, K.Y.; Liu, Q. Spatial distribution of soil phosphorus and controlling factors from Puding karst critical zone, Guizhou Province, Southwest China. Chin. J. Ecol. 2019, 38, 321–328. [Google Scholar]
  46. Zhao, Q.; Zeng, D.H. Phosphorus Cycling in Terrestrial Ecosystems and its Controlling Factors. Chin. J. Plant Ecol. 2005, 29, 153–163. [Google Scholar]
  47. Kong, J.J.; Zhang, H.Y.; Jing, S. Dynamic characteristics of forest soil phosphorus in the early succession after fire in Great Xing’an Mountains. Chin. J. Ecol. 2017, 36, 1515–1523. [Google Scholar]
  48. Zhou, S.G.; Li, N.; Margenot, A.J. Soil meets stream: Vertical distribution of soil phosphorus in streambanks. Geoderma 2022, 424, 115989. [Google Scholar] [CrossRef]
  49. Fang, X.; Chen, J.L.; Wang, L.F.; Li, S.N.; Lei, P.F. Research progress on soil phosphorus availability and its influential factors in subtropical forests. J. Cent. South Univ. For. Technol. 2018, 38, 1–12. [Google Scholar]
  50. Zhang, J.; Zheng, T.H.; Xiao, S.S.; Liao, K.T. Effects of different vegetative restoration patterns on soil chemical properties and corrosion resistance of soils derived from red sandstone. Trans. Chin. Soc. Agric. Eng. (Trans. CSAE) 2018, 34, 115–122. [Google Scholar]
  51. Han, F.; Wang, B.Q.; Zhang, S.P.; Yu, L.J. Driving Effects of Vegetation on the Distributions of Soil Aggregates and Phosphorus in Ziwuling Mountain. Res. Soil Water Conserv. 2019, 26, 118–122. [Google Scholar]
  52. Allison, S.D.; Peter, M. Vitousek Responses of extracellular enzymes to simple and complex nutrient inputs. Soil Biol. Biochem. 2005, 37, 937–944. [Google Scholar] [CrossRef]
  53. Chai, Y.X.; Diao, S.Q. The characters and effects of available phosphorus in dahurian larch-Manchurica ash mixed seedling stand. J. Northeast. For. Univ. 1996, 6, 109–113. [Google Scholar]
  54. Zhou, F.Y.; Zhang, X.Y.; Zhao, Z.H.; Wu, Y.L.; Lei, Z.Y. Effects of sand-fixing forest growth of Mongolian pine on soil phosphorus change. Acta Ecol. Sin. 2022, 42, 635–645. [Google Scholar]
  55. Chen, Y.R.; Yang, Y.; Zhang, X.T.; Yang, Y.B.; Wang, H.H.; Wang, W.J. Effects of after-burning rehabilitation times on soil phosphorus and its availability in the Daxing’anling forests. Acta Ecol. Sin. 2019, 39, 7977–7986. [Google Scholar]
  56. Chen, Y.L.; Han, S.J.; Zou, C.J.; Zhou, Y.M.; Yu, X. The pH change in rhizosphere ofPinus koraiensis seedlings as affected by different nitrogen sources and its effect on phosphorus availability. J. For. Res. 2001, 12, 247–249. [Google Scholar]
  57. Jiang, H.H.; Li, J.Q.; Chen, G.; Wang, T.; Chi, X.Y.; Qi, P.S. Phosphate Solubilizing Microorganisms and Application Progress in Saline-alkaline Soil. Soils 2021, 53, 1125–1131. [Google Scholar]
  58. Charles, A.A. Comparison of the Contributions of Clay, Silt, and Organic Matter to the Effective Cec of Soils of Subsaharan Africa. Soil Sci. 1998, 163, 508. [Google Scholar]
Figure 1. Location of the study area. MT: Mountaintop; HS: Hillside; BM: Bukit Mertajam; SS: Shoreside; WL: Wetland.
Sustainability 14 12277 g001
Figure 2. Distribution characteristics of TP particle size in surface soil of different landforms. Capital letters represent significant differences between different regions of the same particle size, and small letters represent significant differences between different particle sizes in the same region (Similarly hereinafter).
Sustainability 14 12277 g002
Figure 3. Distribution characteristics of AP particle size in surface soil of different landforms.
Sustainability 14 12277 g003
Figure 4. Distribution characteristics of TP in different geomorphic soils.
Sustainability 14 12277 g004
Figure 5. Distribution characteristics of AP in different geomorphic soils.
Sustainability 14 12277 g005
Figure 6. Principal coordinate analysis of soil physical and chemical properties. PC1: Major coordinates of the largest possible explain data changes; PC2: The rest of the degree of change in the proportion of the largest main coordinate components. Y: Non−karst landform, J: karst landform, X: Geomorphology after vegetation restoration.
Sustainability 14 12277 g006
Figure 7. Redundant analysis of pure and common effects of soil physical and chemical factors on TP and AP in non-karst landforms. env1: The environmental cause of the first quadrant (pH, EC, SWC); env2: The environmental cause of the second quadrant (BD, DOC); env3: The environmental cause of the third quadrant (NH4+−N, NO3−N); env4: The environmental cause of the fourth quadrant (ROC, SOC); Residuals: Represents the remaining degree of explanation. SWC: Soil water content; BD: Bulk density; EC: Electric conductivity; NO3−N: Nitric nitrogen; NH4+−N: Ammonium nitrogen; TP: Total phosphorus; AP: Available phosphorus (similarly hereinafter).
Sustainability 14 12277 g007
Figure 8. Redundant analysis of pure and common effects of soil physical and chemical factors on TP and AP in karst landforms. env1: The environmental cause of the first quadrant (DOC, SWC); env2: The environmental cause of the second quadrant (NH4+−N, NO3−N, EC); env3: The environmental cause of the third quadrant (BD, SOC, ROC); env4: The environmental cause of the fourth quadrant (pH); Residuals: Represents the remaining degree of explanation.
Sustainability 14 12277 g008
Figure 9. Redundancy analysis of soil physicochemical factors on TP and AP under geomorphology after vegetation restoration. env1: The environmental cause of the first quadrant (DOC, EC, SOC); env2: The environmental cause of the second quadrant (SWC, NO3−N); env3: The environmental cause of the third quadrant (NH4+−N); env4: The environmental cause of the fourth quadrant (ROC); Residuals: Represents the remaining degree of explanation.
Sustainability 14 12277 g009aSustainability 14 12277 g009b
Table 1. Location and vegetation status of the transect.
TransectLatitude LongitudePhytocoenosiumAltitude/mVegetation Coverage/
%
Soil TypeAverage Plant Heigh/mPlant Density Plant/m2
Non-karst104°12′1.82″–104°13′1.82″ E 26°52′3.10″–26°52′20.60″ NArbor community: With Locust tree (Sophora japonica L.), Cypress (Sabina chinensis (L.), fir (Cunninghamia lanceolata (Lamb.) Hook) and so on primarily;2174–219685Yellow soilArbor community: 8 Arbor community: 0.02
Shrub community: With Juniperus rigida (Juniperus rigida S. et Z) and firethorn (Pyracantha fortuneana (Maxim.) Li) primarily; Shrub community: 2.5 Shrub community: 0.07
Herb community: With artemisia argyi (Eleusine indica (L.) Gaertn), water celery (Oenanthe javanica (Bl.) DC.) and rushes primarily (Juncus effusus). Herb community: 0.5 Herb community:12
Karst104°14′0.33″–104°14′2.81″ E 26°51′51.11″–26°52′0.38″ NHerb community: Take Trifolium (Trifolium Linn), rushes (Juncus effusus) and Artemisia the dominant factor.2179–220240Calcareous soilcommunity: 0.7 community: 40
Vegetation restoration104°13′53.40″–104°13′7.0″ E 26°51′56.86″–26°52′0.81″ NArbor community: Take elm tree (Ulmus pumila L.) the dominant factor; 2179–220260Calcareous soilArbor community: 5 Arbor community: 0.04
Shrub community: Take pepper wood (Zanthoxylum piperitum Benn) the dominant factor;Shrub community: 1.5 Shrub community: 0.06
Herb community: Golden Rooster Chrysanthemum (Coreopsis drummondii Torr. et Gray) and Artemisia (Artemisia carvifolia) the dominant factor. Herb community: 0.6 Herb community: 25
Table 2. Physical and chemical properties of surface soil from the different transects.
TransectPointpHSWC/%BDEC(μs/cm)NO3-N (mg/kg)NH4+-N (mg/kg)SOC (g/kg)ROC (mg/kg)DOC (mg/kg)
MT4.19 ± 0.11 b25.15 ± 6.57 b1.41 ± 0.11 a42.77 ± 12.23 c3.04 ± 2.17 a14.81 ± 2.2 a16.59 ± 2.662.30 ± 0.26 a2.61 ± 0.42 a
Non -HS4.41 ± 0.29 b27.56 ± 3.65 b1.39 ± 0.02 a38.87 ± 15.42 c3.20 ± 3.35 a11.61 ± 1.1 c18.07 ± 4.0 bc2.26 ± 0.26 ab2.16 ± 0.35 a
karstBM4.44 ± 0.23 b30.8 ± 4.27 ab1.36 ± 0.14 a36.03 ± 11.44 c4.51 ± 4.32 a10.9 ± 1.1 bc11.16 ± 5.29 c2.38 ± 0.43 a2.18 ± 0.29 a
SS7.40 ± 0.30 a26.62 ± 1.57 b1.51 ± 0.02 a75.90 ± 15.40 b3.76 ± 1.49 a11.21 ± 1.1 b18.57 ± 1.83 b2.35 ± 0.30 b2.03 ± 0.39 b
WL7.16 ± 0.43 a36.95 ± 0.93 a1.32 ± 0.02 a125.63 ± 17.25 a2.67 ± 1.26 a10.62 ± 1.3 b19.47 ± 1.54 b2.16 ± 0.19 a2.64 ± 0.37 ab
MT8.26 ± 0.10 a31.66 ± 0.06 a1.37 ± 0.06 a137.37 ± 13.69 a1.08 ± 1.43 c2.81 ± 2.05 b12.36 ± 1.75 c1.60 ± 0.34 a1.62 ± 0.33 a
HS8.22 ± 0.09 a37.61 ± 0.09 a1.30 ± 0.09 a81.10 ± 24.47 b1.34 ± 1.05 c3.19 ± 2.25 b9.37 ± 6.23 b1.74 ± 0.41 a1.73 ± 0.17 a
KarstBM7.77 ± 0.08 a38.67 ± 0.09 a1.26 ± 0.09 a59.70 ± 18.93 b1.44 ± 1.05 c4.73 ± 0.1 ab4.52 ± 2.19 c1.16 ± 0.43 a1.25 ± 0.21 a
SS7.81 ± 0.13 ab30.67 ± 0.18 a1.49 ± 0.18 a116.67 ± 8.61 b7.09 ± 2.26 a8.44 ± 0.09 a19.81 ± 0.77 b2.38 ± 0.51 b1.33 ± 0.40 ab
WL7.82 ± 0.13 ab29.28 ± 0.17 a1.48 ± 0.17 a214.03 ± 34.70 a4.54 ± 0.88 b8.58 ± 0.10 a26.52 ± 4.37 a1.46 ± 0.40 b1.96 ± 0.49 b
MT7.99 ± 0.10 a22.02 ± 0.19 a1.59 ± 0.19 a99.20 ± 32.72 bc2.61 ± 0.67 a6.77 ± 0.33 a8.77 ± 2.15 c1.58 ± 0.57 a2.00 ± 0.49 a
Vegetation restorationHS6.47 ± 0.33 b29.06 ± 0.06 a1.22 ± 0.06 a36.63 ± 11.87 c3.17 ± 1.45 a5.21 ± 0.61 a5.83 ± 1.57 b1.40 ± 0.37 a1.74 ± 0.27 a
BM7.38 ± 0.61 ab25.42 ± 0.16 a1.41 ± 0.16 a89.83 ± 47.55 bc2.70 ± 0.45 a6.43 ± 0.06 a7.24 ± 2.81 a1.23 ± 0.32 a1.25 ± 0.12 ab
Note: MT: Mountaintop; HS: Hillside; BM: Bukit Mertajam; SS: Shoreside; WL: Wetland. The number of samples per point is 5 (n = 5). Lowercase letters represent significant differences between different regions of the same band (p < 0.05).
Publisher’s Note: MDPI stays neutral with regard to jurisdictional claims in published maps and institutional affiliations.

