Article

Energy-Economic Assessment of Islanded Microgrid with Wind Turbine, Photovoltaic Field, Wood Gasifier, Battery, and Hydrogen Energy Storage

by
Maciej Żołądek
1,
Alexandros Kafetzis
2,
Rafał Figaj
1,* and
Kyriakos Panopoulos
2
1
Department of Sustainable Energy Development, Faculty of Energy and Fuels, AGH University of Science and Technology, 30-059 Cracow, Poland
2
Chemical Process and Energy Resources Institute, Centre for Research and Technology Hellas, 57001 Thessaloniki, Greece
*
Author to whom correspondence should be addressed.
Sustainability 2022, 14(19), 12470; https://doi.org/10.3390/su141912470
Submission received: 18 August 2022 / Revised: 15 September 2022 / Accepted: 28 September 2022 / Published: 30 September 2022

Abstract

:
Island energy systems are becoming an important part of energy transformation due to the growing needs for the penetration of renewable energy. Among the possible systems, a combination of different energy generation technologies is a viable option for local users, as long as energy storage is implemented. The presented paper describes an energy-economic assessment of an island system with a photovoltaic field, small wind turbine, wood chip gasifier, battery, and hydrogen circuit with electrolyzer and fuel cell. The system is designed to satisfy the electrical energy demand of a tourist facility in two European localizations. The operation of the system is developed and dynamically simulated in the Transient System Simulation (TRNSYS) environment, taking into account realistic user demand. The results show that in Gdansk, Poland, it is possible to satisfy 99% of user demand with renewable energy sources with excess energy equal to 31%, while in Agkistro, Greece, a similar result is possible with 43% of excess energy. Despite the high initial costs, it is possible to obtain Simple Pay Back periods of 12.5 and 22.5 years for Gdansk and Agkistro, respectively. This result points out that under a high share of renewables in the energy demand of the user, the profitability of the system is highly affected by the local cost of energy vectors. The achieved results show that the system is robust in providing energy to the users and that future development may lead to an operation based fully on renewables.

1. Introduction

Electricity generation in remote microgrids in most cases is heavily dependent on fossil fuels such as gas or oil. Such fuels, apart from creating environmental pollution, are relatively expensive due to limited availability in remote areas, and high transportation costs [1]. Attempts are being made to supply such locations with the use of Liquefied Natural Gas (LNG) powering Solid Oxide Fuel Cells (SOFC), but despite the reduced costs of generating energy with respect to conventional fossil fuels used in islanded applications, this solution is considered a transitional one [2]. Due to growing energy demand and increasing requirements for penetration of energy systems by renewables, local governments in such localizations are facing the necessity of developing energy systems based mostly on renewable energy sources with storage units, allowing to provide uninterrupted electricity supply throughout the whole year. Renewable energy can also be used in the industry sector, and especially in the manufacturing of “green” final products [3]. The environmental impact of production processes that require large energy inputs can be minimized in terms of CO2 emissions by replacing the existing power production source with renewable energy systems. In such environments, calculation of cost emission-operation is also an important issue [4]. Proper forecasting of energy load is also a crucial parameter in the restructured power market [5,6].
The most common technologies based on renewables are photovoltaic panels (PV) and photovoltaic-thermal (PVT) collectors [7,8], wind turbines [9,10], gasifiers [11], Organic Rankine Cycle (ORC) systems [12], or even thermoelectric generators [13]. To properly address the unpredictable and intermittent nature of renewable energy sources such as solar and wind, it is necessary to use medium- to long-term storage units, based on batteries and/or hydrogen loops equipped with electrolyzers and fuel cells [14]. Biofuels are also being considered as potential important alternatives to fossil fuels [15,16,17], since they allow one to limit the use of energy storage systems by using conventional generators as a backup electrical power source.
In the framework of stand-alone systems, Ogbonnaya et al. [18] presented a comprehensive literature review concerning islanded energy systems based on integrated photovoltaic-fuel cell systems. Authors found that such systems can be successfully adapted as a power source for telecommunication stations, desalination plants, residential/commercial buildings, boats and ships, and generic distributed applications. In particular, such systems appear particularly attractive in DC applications.
As regards detailed investigations about isolated systems, Khan et al. [19] presented the assessment of an off-grid wind and solar hybrid energy system for purposes of irrigation in Sudan. The energy storage taken into consideration was a lead-acid battery. The authors analyzed 12 localizations in Sudan in different climate zones and with different types of soil, which had an impact on water demand. Authors found that due to the high costs of wind generators, hybrid systems were not yet feasible in relatively small-scale applications. Excess electricity produced in described cases was in the range of 71.0–96.2%, while the cost of electricity varied between 0.36 and 1.08 EUR/kWh. A more complex system was investigated by Akter et al. [20]. The authors presented a study on the sizing of 100% renewable energy-based microgrids in remote islands of developing countries. Considerations were based on the case of St. Martin`s Island, Bangladesh. The system was based on PV installation, battery energy storage, and a fuel cell with an electrolyzer. The authors presented four different variants of the installation and compared it to a basic scenario based on a diesel generator. Depending on the load profile of the user and specific sizes of the components, it was possible to achieve payback periods in the range of 7.72 to 8.17 years. The same problem of sizing the system was analyzed by Hidalgo-Leon et al. [21], and for this purpose a simulation of a stand-alone PV-Diesel-Battery system was performed. The authors used Homer Pro software to analyze the proper sizing of energy installation used to supply energy to the Cerrito de Los Morreños community in Ecuador. The configuration presented by the authors allowed CO2 emissions to be reduced by 4.3 times, while the levelized cost of energy was reduced by 10% in comparison to a reference scenario based on a diesel generator. The cost of energy was also involved in the optimization of microgrid based on hydropower plant, photovoltaic field, diesel generator, and battery energy storage localized in the Philippines carried out by Tarife et al. [22]. Analysis based on the multi-objective particle swarm optimization algorithm made it possible to achieve a levelized cost of energy at the level of 0.19 EUR/kWh. A similar study was performed by Dimou et al. [23], presenting techno-economic analysis of an energy installation on Ai Stratis Island. The authors compared three scenarios based on the wind turbine, photovoltaic field, battery, and backup diesel generator to a base case scenario based on an 840 kW installation with diesel generators. The highest renewable energy source penetration was achieved in a case with a relatively large battery; however, the high initial costs of this solution led to choosing a solution without energy storage. The renewable energy penetration parameter was also used by Barone et al. [24] in a simulation of the possibilities of increasing renewable energy use in the island community of El Hierro on the Canary Islands carried out in TRNSYS software. The authors proposed the utilization of a wind turbine coupled with a pumped hydro storage system to satisfy the electrical load of the community and the local desalination plant based on reverse osmosis. Thermal needs were satisfied by solar thermal collectors. In the investigated scenarios, authors achieved even 85% of annual electricity demand, and about 79% of annual thermal energy needs were met by renewable energy. With a similar approach, Hoseinzadeh et al. [25] analyzed the possibilities of a renewable energy system for Catania city on Sicily Island in Italy. The authors considered a system based on PV panels and wind turbines with a hydrogen loop consisting of an electrolyzer, hydrogen tank, and fuel cell. The proposed installation made it possible to fully match the demand of the user, with 72% of the coverage achieved by photovoltaic panels. Conversely to the other presented studies, Cabrera et al. [26] analyzed a method to link the water infrastructure and the energy system of an island. The authors considered water production and treatment systems as flexible loads and combined them with an analysis of PV/wind power. Such optimization leads to an increase in the contribution of renewables to the local energy system from 5.14% to 24.60%. About 72% of the renewable energy was produced by the wind. In the scientific literature, there are also papers that focused on the reduction of electrical energy dependency from the grid by means of the adoption of renewable energy sources in the heating and cooling process. A comprehensive approach to the increase of user independency, including the direct production of electrical energy, was described in Ref. [27], where a renewable micro-scale trigeneration system with a wind turbine, photovoltaic field, and biomass steam cycle was assessed from the point of view of energy and economic performance. The analysis was carried out under climatic conditions of Gdansk, Poland, and it led to the conclusion that energy installation produced 55.9% of the electrical demand of a zootechnical farm with only 2.8% of excess energy. The study presented in Ref. [28] described a dynamic simulation of a Micro-Scale Hybrid Trigeneration System Integrating a Water Steam Cycle and Wind Turbine. Depending on the reference scenario and costs of biomass considered in the study, the authors achieved payback periods of the system even below 4.5 years.
The above-described literature review present studies dealing with different systems and approaches. A comparison between presented literature studies and the present paper is shown in Table 1.
On the basis of the presented literature review, it is possible to conclude that significant possibilities are open in the field of island energy systems based mostly on renewables, especially ones including biomass gasification process. The literature review reveals that most studies are mainly focused on systems used to provide only a part of the energy demand, with non-negligible support of generators based on fossil fuels. Installations with long-term energy storage allowing nearly fully renewable-based operation are not so numerous. In addition, most of the reviewed papers are focused on conventional hybrid systems based only on PV panels and wind turbines, instead of more complex systems that couple together also other technologies such as batteries, hydrogen storages, and gasifiers.
In general, there is a scarcity of literature studies where a complex dynamic simulation and energy-economic assessment of a stand-alone system based on several renewable energy sources and different energy storages is performed. Therefore, the motivation for the development of this study is to expand the knowledge about fully remote small-size energy installations based mostly on renewables, with different types of energy storage. The proposed system consists of a wind turbine, photovoltaic field, wood chip gasifier with an engine, battery, electrolyzer with hydrogen storage and fuel cell, and LPG backup generator. The novelty of the paper consists of the integration of all the used technologies in one system, which is rare in literature studies, as pointed out by Table 1. In addition, the novelty of the analysis is the analysis of the electrical load caused by the tourist resort in different locations.
In this context, the motivation of the paper is the necessity to deepen the knowledge of complex hybrid renewable energy systems operating in off-grid mode by presenting a comprehensive energy and economic analysis showing the performance of a selected system. The paper provides new insights about the operation characteristics of a complex hybrid system and its feasibility under different weather and energy tariff conditions. Moreover, the paper shows the possibly of achieving a relatively high share of renewables in the coverage of the user electrical energy demand with several technologies in an islanded application. The main motivation is also to show that highly hybridized and complex systems are a valid solution for applications requiring a full independency from the grid with a very marginal use of fossil fuels as auxiliary source of energy.
The system was investigated using the Transient System Simulation (TRNSYS) software, by developing a model based on user-defined models and built-in libraries. All of the components used in the simulation were previously validated with the use of experimental and/or technical data. The novelty of the presented installation is connected with the use of both medium- and long-term energy storage devices in order to provide continuous electricity supply throughout the year. The paper presents a dynamic simulation of the mentioned system conducted for two climatic zones, which allows the described installation to be adapted to any other climatic conditions. The final scope of the paper is to determine the operation characteristic of the system and to investigate its energy performance and economic feasibility.

2. Materials and Methods

In order to simulate the hybrid system, TRNSYS software was used [29]. This software is being widely used in scientific and technical applications for purposes of simulating the transient operation of energy systems [30,31,32]. The modeling of the considered system was performed using user-defined components (gasifier, control system, energy, and economic model) as well as built-in libraries (wind turbine, photovoltaic field, battery, electrolyzer, fuel cell, hydrogen storage, LPG backup generator, controllers, etc.). The considered system has no connection with the grid since it is designed to work completely in islanded mode. It is worth noting that the system model was developed adopting software library components based on manufacturers’ data and/or on experimentally validated models, which allows highly reliable simulations to be provided. The complete list of TRNSYS components used in the simulation is reported in Table 2. Models of the components are presented in the TRNSYS software reference [29], and here are omitted for sake of brevity. It is worth noting that the wind turbine model was based on manufacturers’ data [33] as well as the gasifier [34] and PV modules. Numerical models of used components were omitted for the sake of brevity; however, references to the models are presented in Table 2.

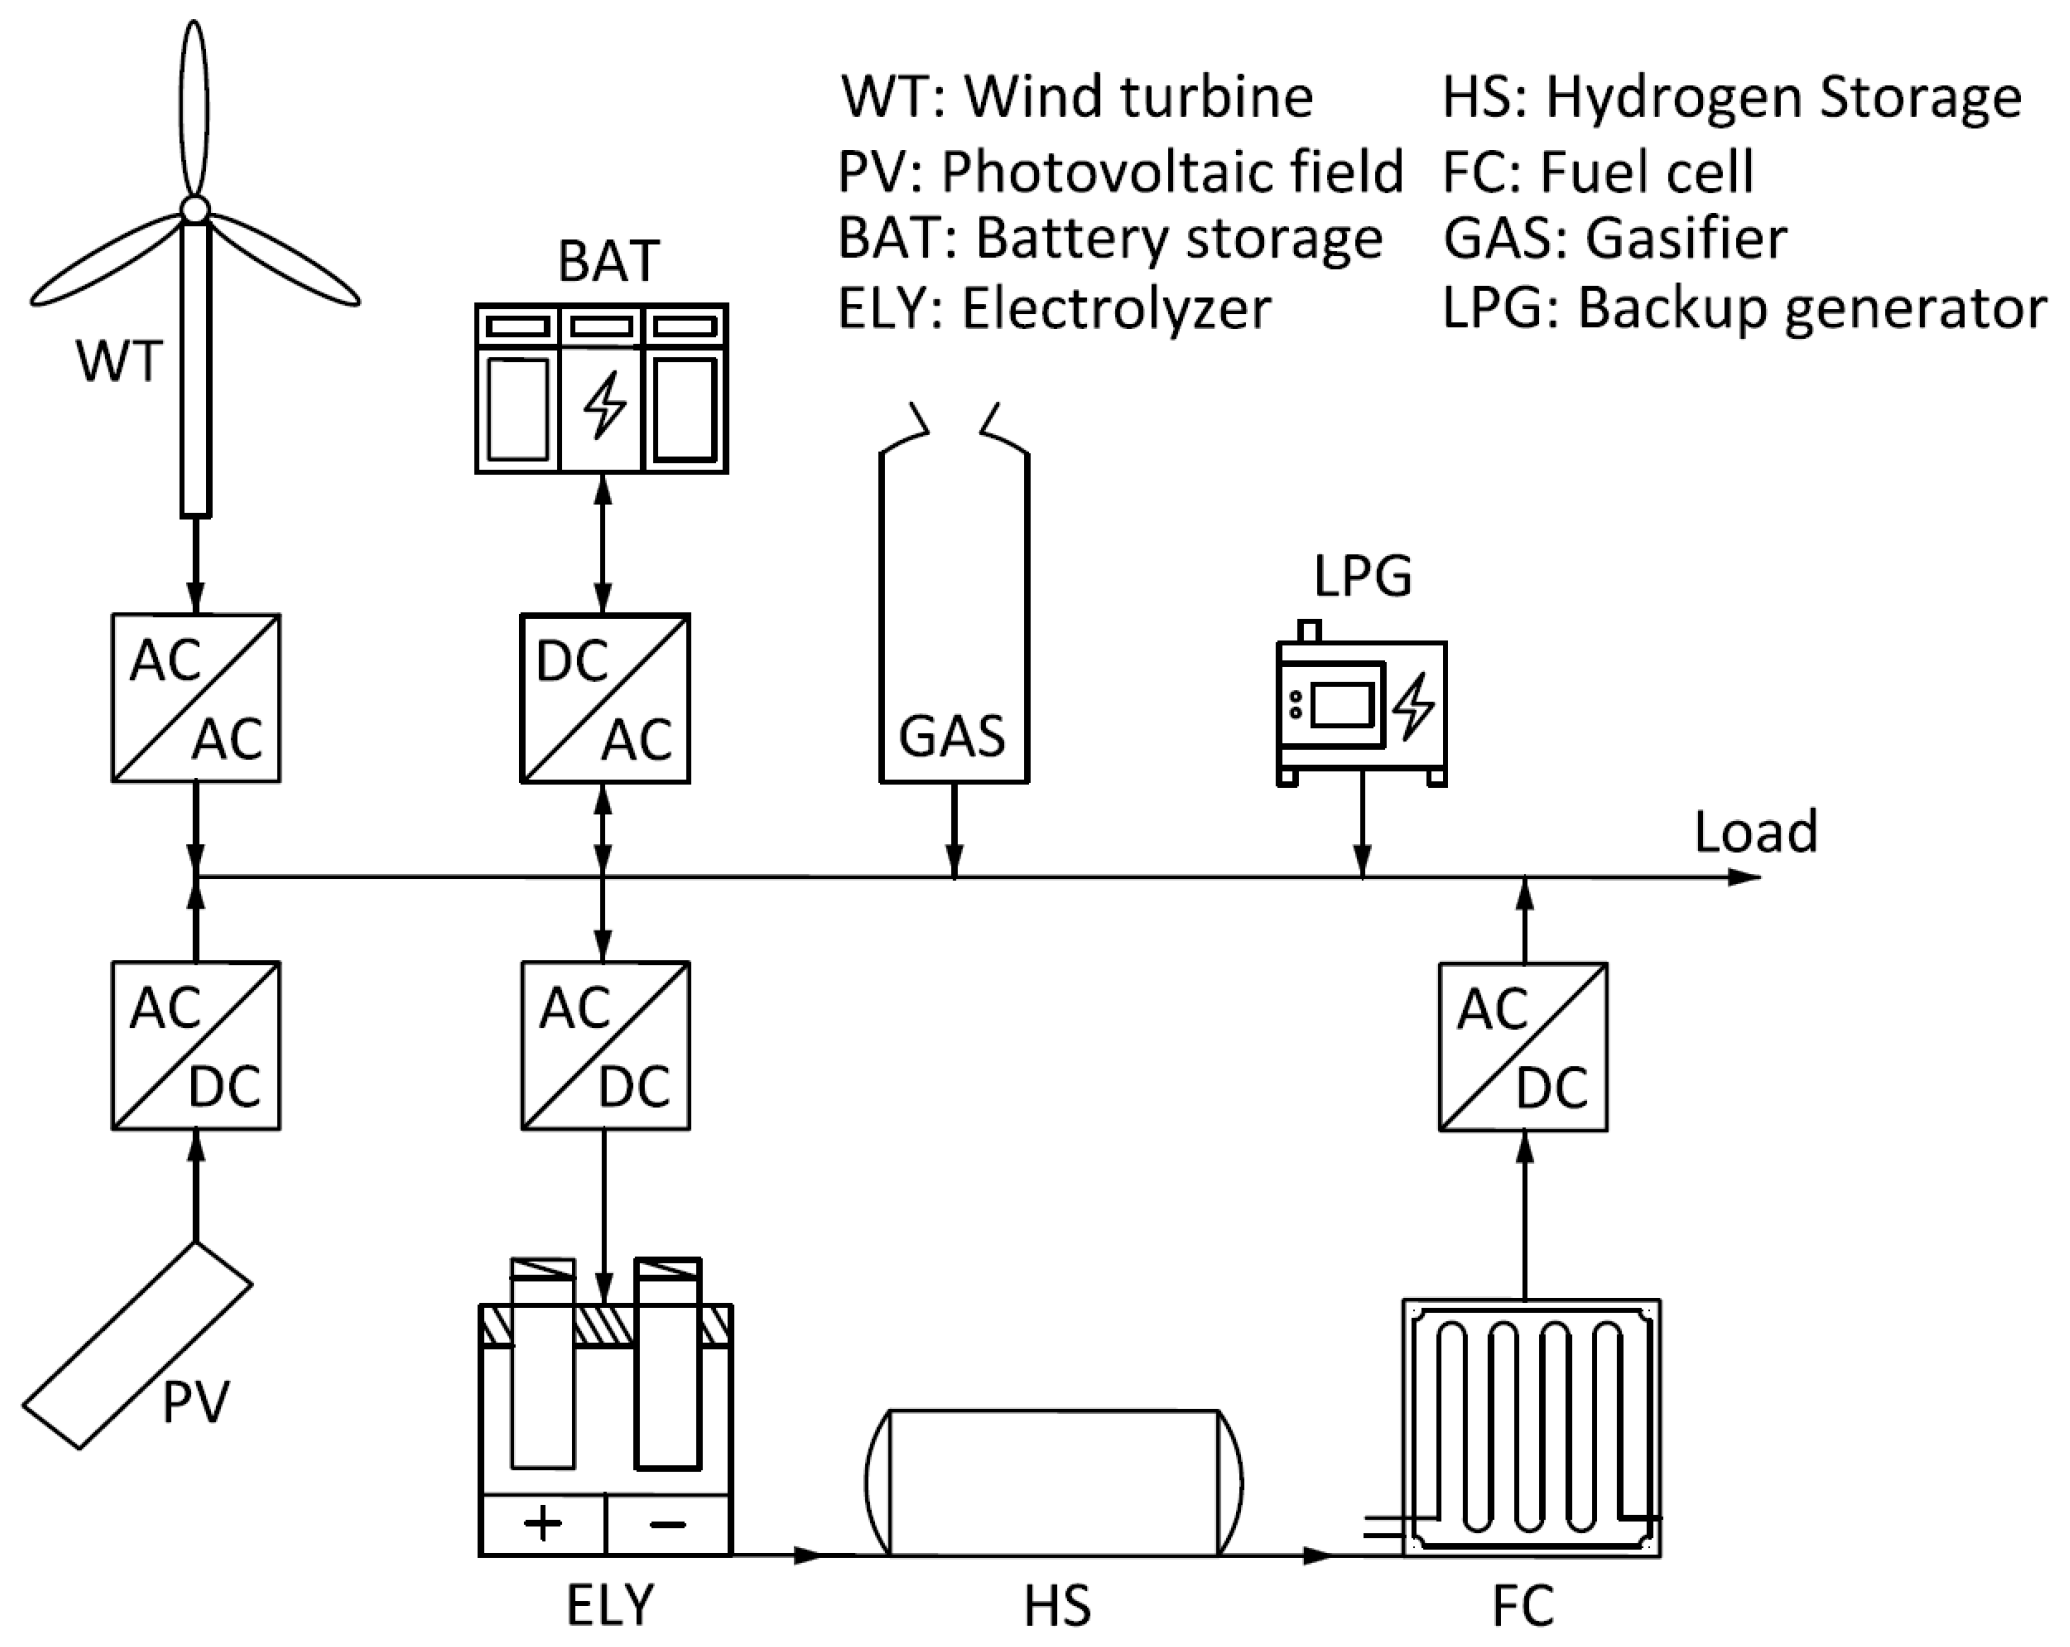
2.1. Layout and Control Strategy

The proposed system consists of a wind turbine, photovoltaic field, gasifier with an engine, LPG backup generator, battery, electrolyzer, hydrogen storage, and fuel cell, all connected to a common AC line, which is directed to the load that corresponds to the user assumed as a tourist resort. The system layout, including the main parts of the installation, is shown in Figure 1.
The proposed system consists of several parts:
  • Monocrystalline type Photovoltaic Field (PV) with a three-phase inverter, producing electrical energy from solar radiation, which is directed to the AC line;
  • Direct drive horizontal axis wind turbine with AC/AC regulator, converting the wind energy into electrical power, which is directed to the AC line;
  • Gasifier with an internal combustion engine, using a thermochemical conversion of wooden chips to produce low-heating value gas, which is directed to the turbine;
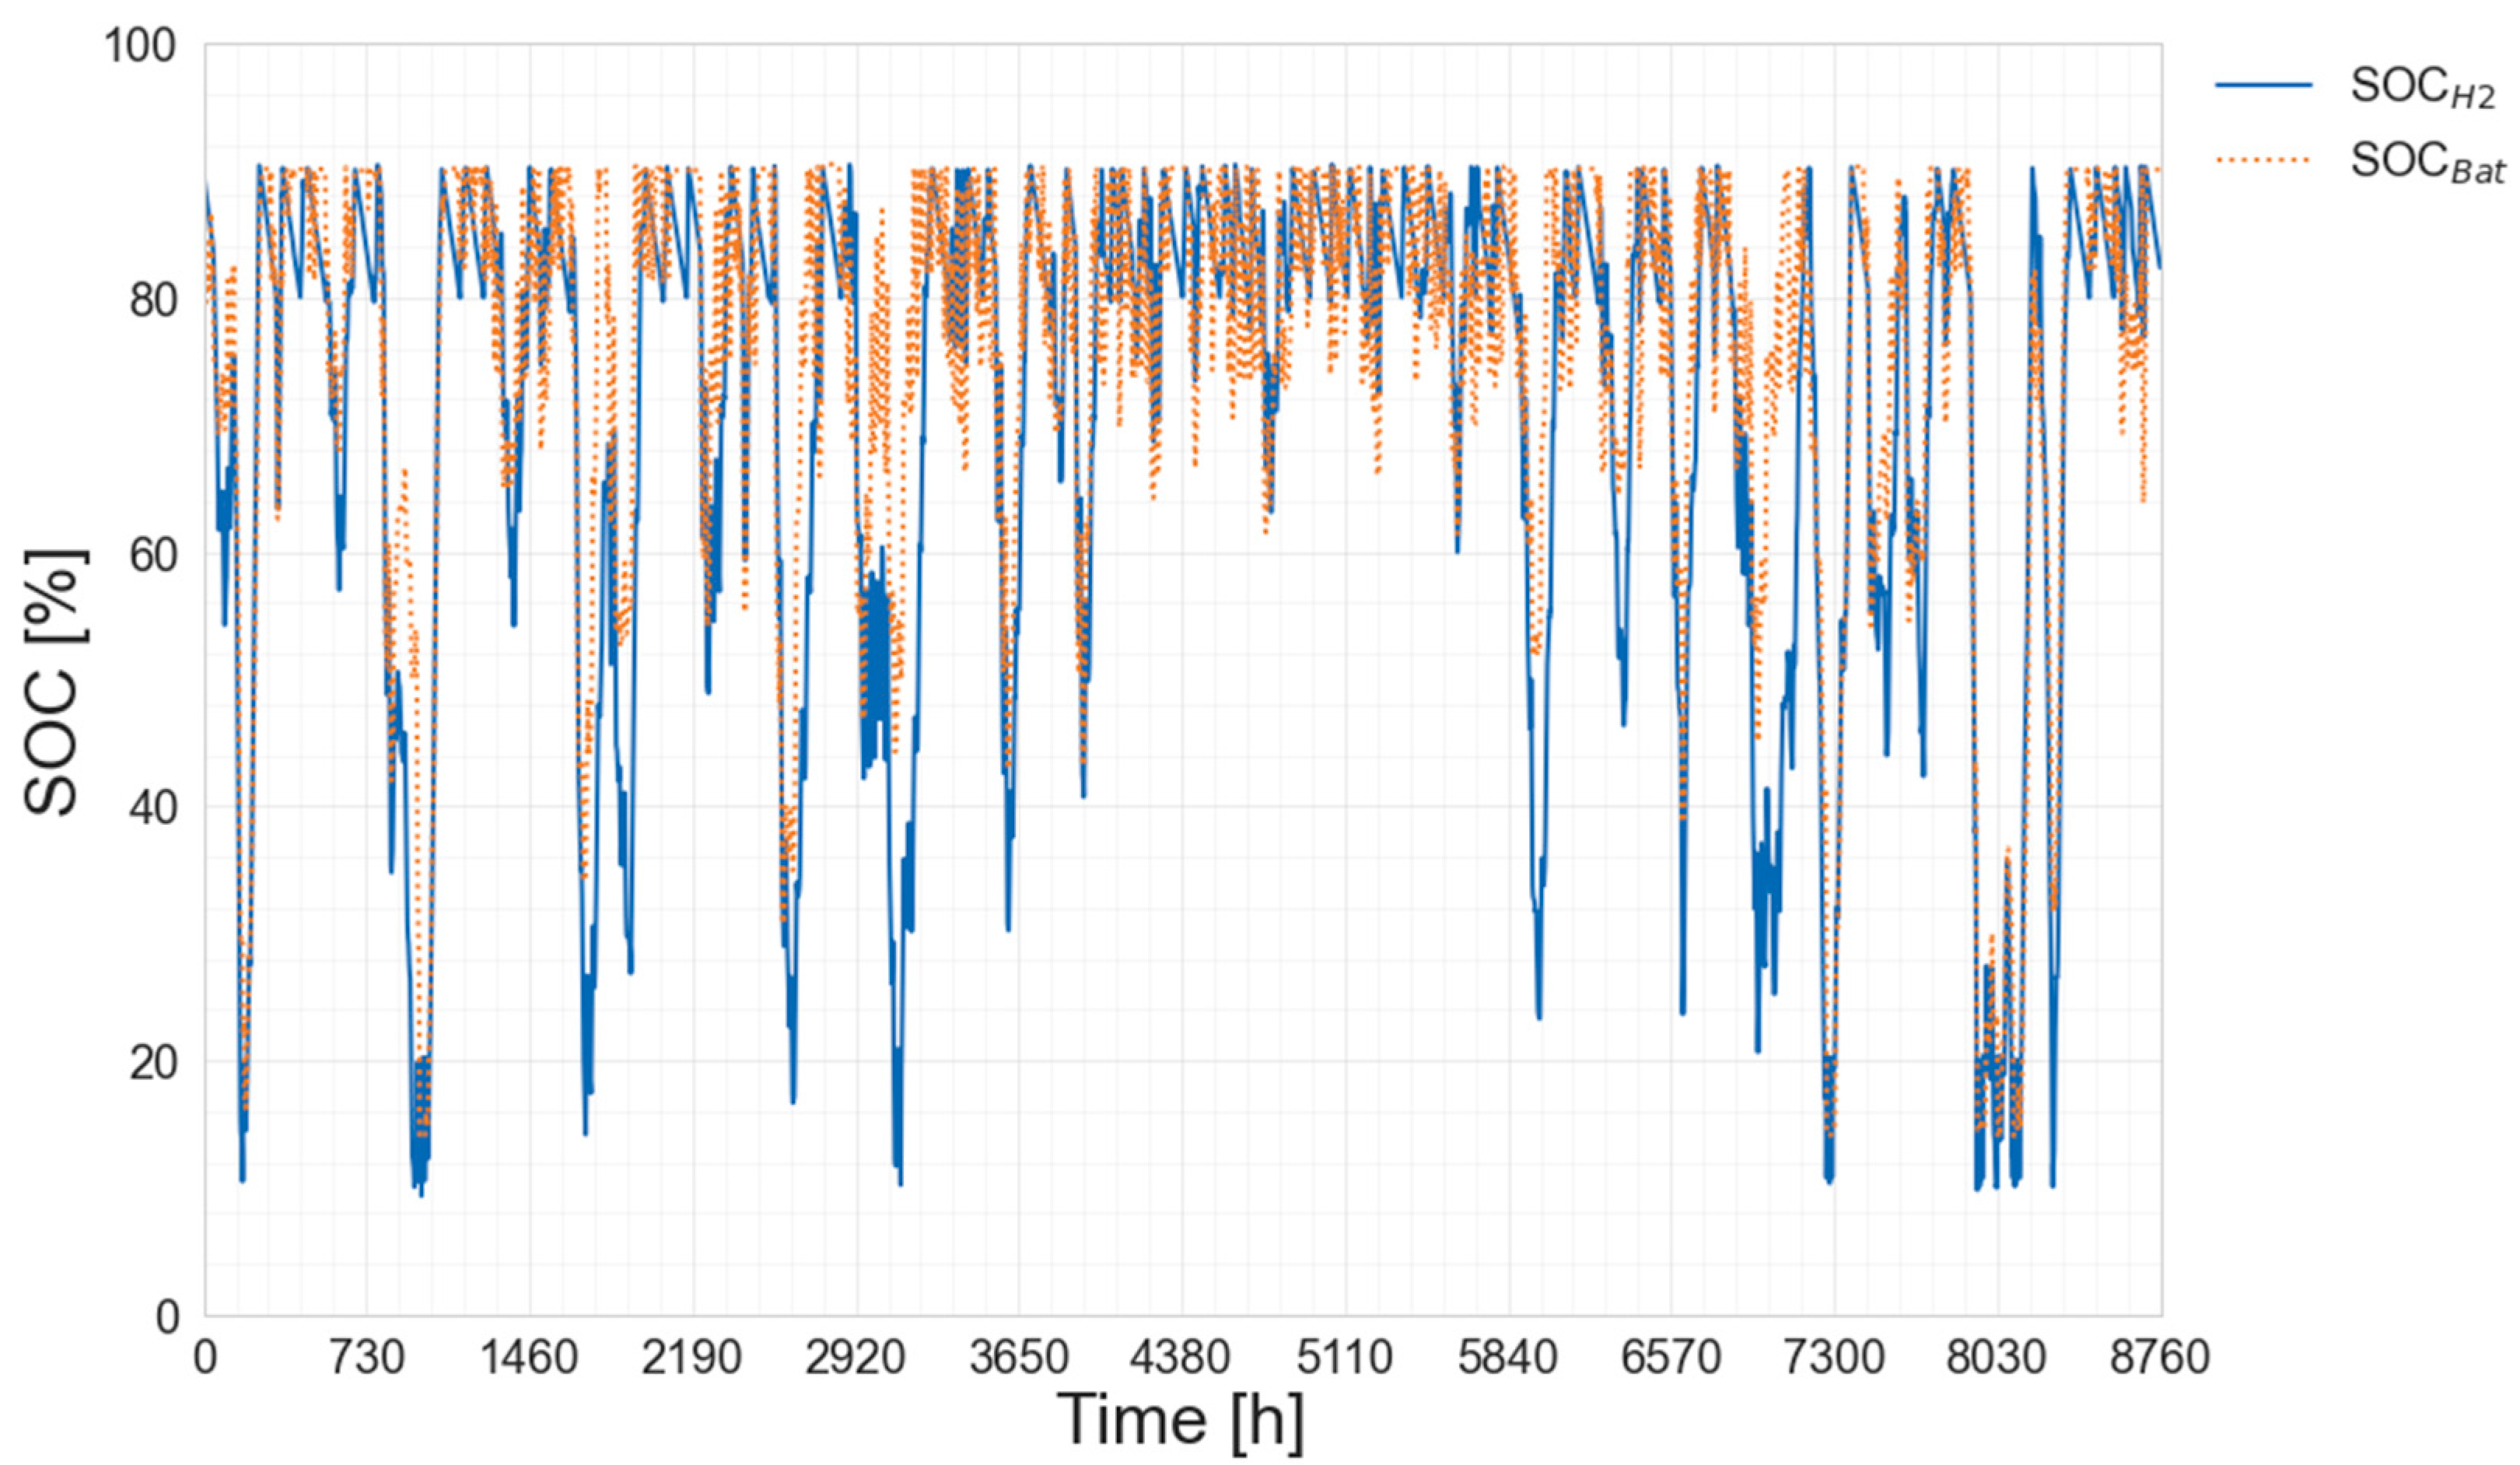
  • Lithium-ion battery with AC/DC converter used as energy storage when production from renewable energy sources exceeds the power need of the load, and as a power source when the load exceeds production from renewables;
  • Hydrogen loop with an electrolyzer, hydrogen storage, and fuel cell, which is used as energy storage when power from renewables exceeds user needs and battery possibilities, and power source when needed.
The control strategy of the system was defined as follows. The energy produced by PV and WT is in first place provided directly to the user. If production exceeds the load of the user, energy is provided to the battery. When the state of charge of the battery exceeds 90% or production exceeds load and battery charging power, energy is transferred to the electrolyzer in order to produce hydrogen for purposes of future fuel cell operation. When the hydrogen storage facility is full, excess energy is curtailed. If the load exceeds production, and the State of Charge (SOC) of the battery exceeds 15%, it is possible to match the load with the energy stored in the battery. When the SOC of the battery is lower than 80%, the gasifier receives a signal to start its operation. It needs two hours to start the production of energy, and due to hopper storage, it is capable of producing energy for 8 h after full activation. Moreover, once the SOC of the battery becomes lower than 75%, the fuel cell starts its operation in order to satisfy the user’s needs. The battery operates in an SOC range between 15% and 90%; the fuel cell, on the other hand, needs a hydrogen tank filled between 10% and 90% to operate. Finally, when the load exceeds production and all energy stores have been emptied, the control algorithm starts the backup LPG generator in order to cover the ongoing demand of the user.

2.2. Energy and Economic Model

In order to assess the global economic and energy performance of the proposed system, a comparison with a reference system was made. This approach is widely adopted in literature when dealing with energy and economic assessment of complex and novel renewable energy systems [32,41]. The methodology requires the definition of an alternative for the investigated system, which consists of typically/conventionally adopted technologies in order to match the demands of the users. The analysis was carried out assuming that both systems must supply the same amount of energy to the user. The reference system was based entirely on the production of energy from natural gas, while the proposed system was designed to diversify renewable energy sources and ensure 99% of power demand from RES. The performance of the proposed system was assessed on the basis of calculating the following parameters:
  • Energy curtailed is defined as the energy which cannot be utilized or stored in the energy system;
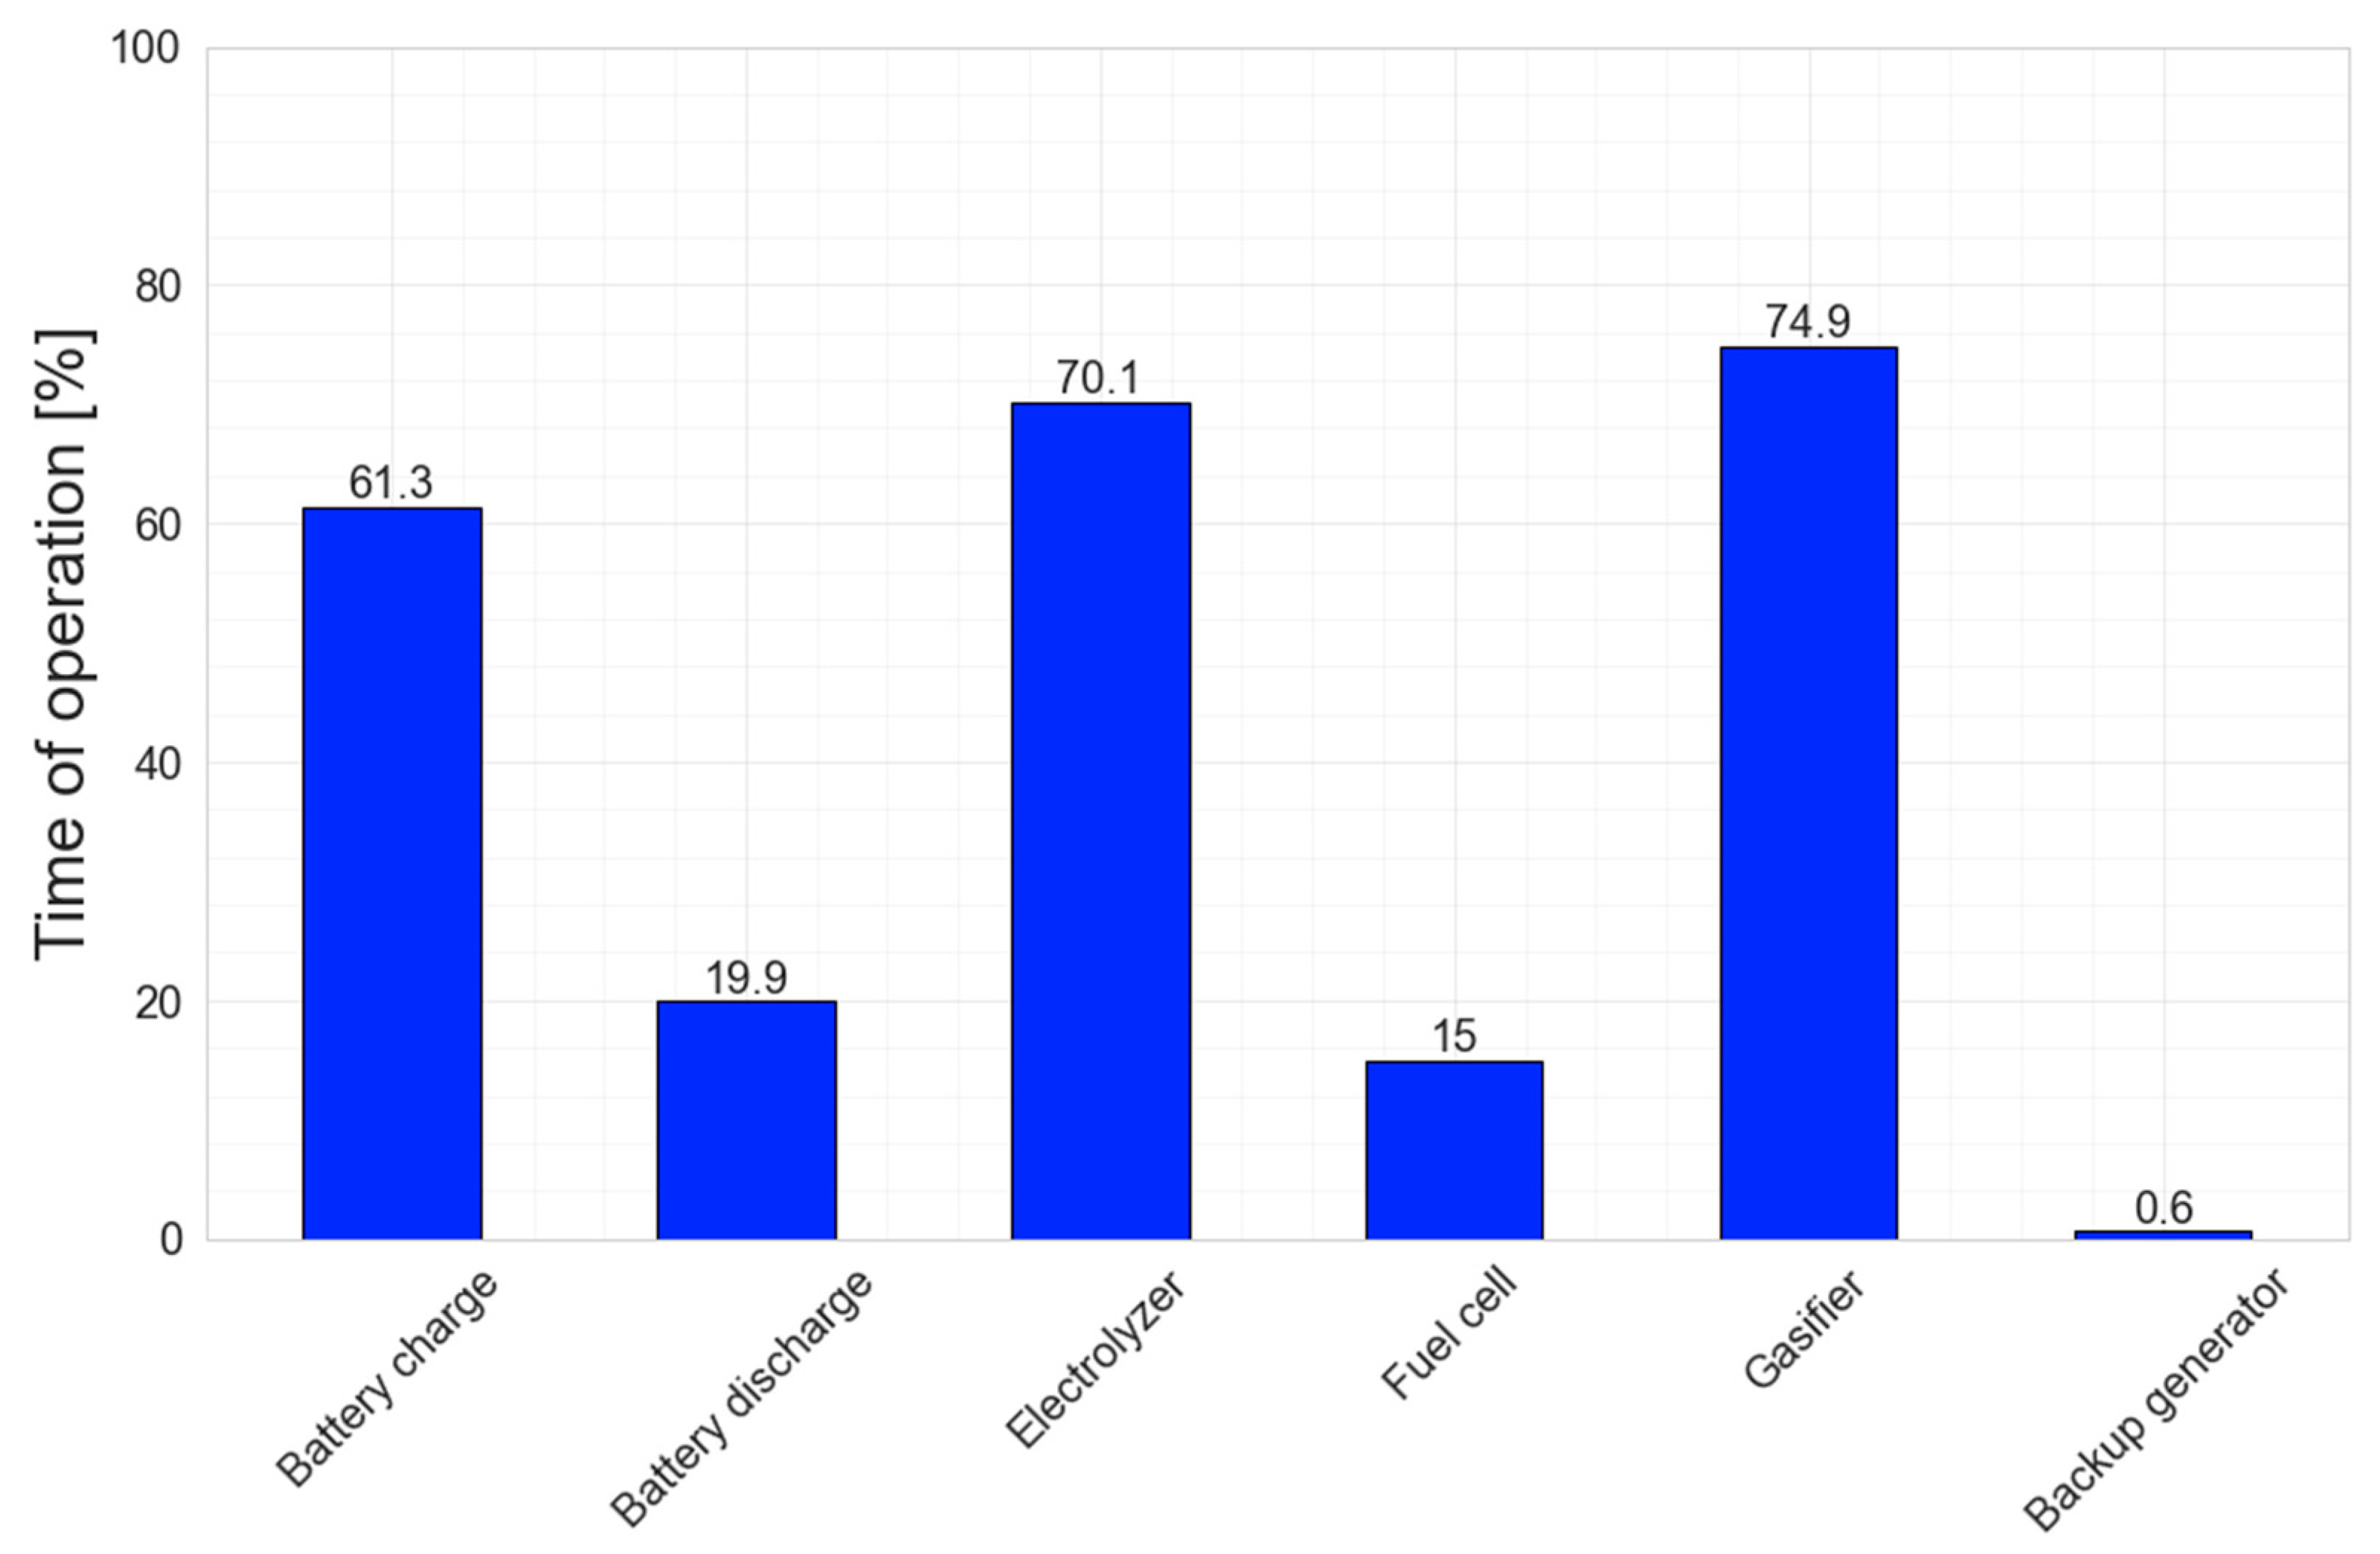
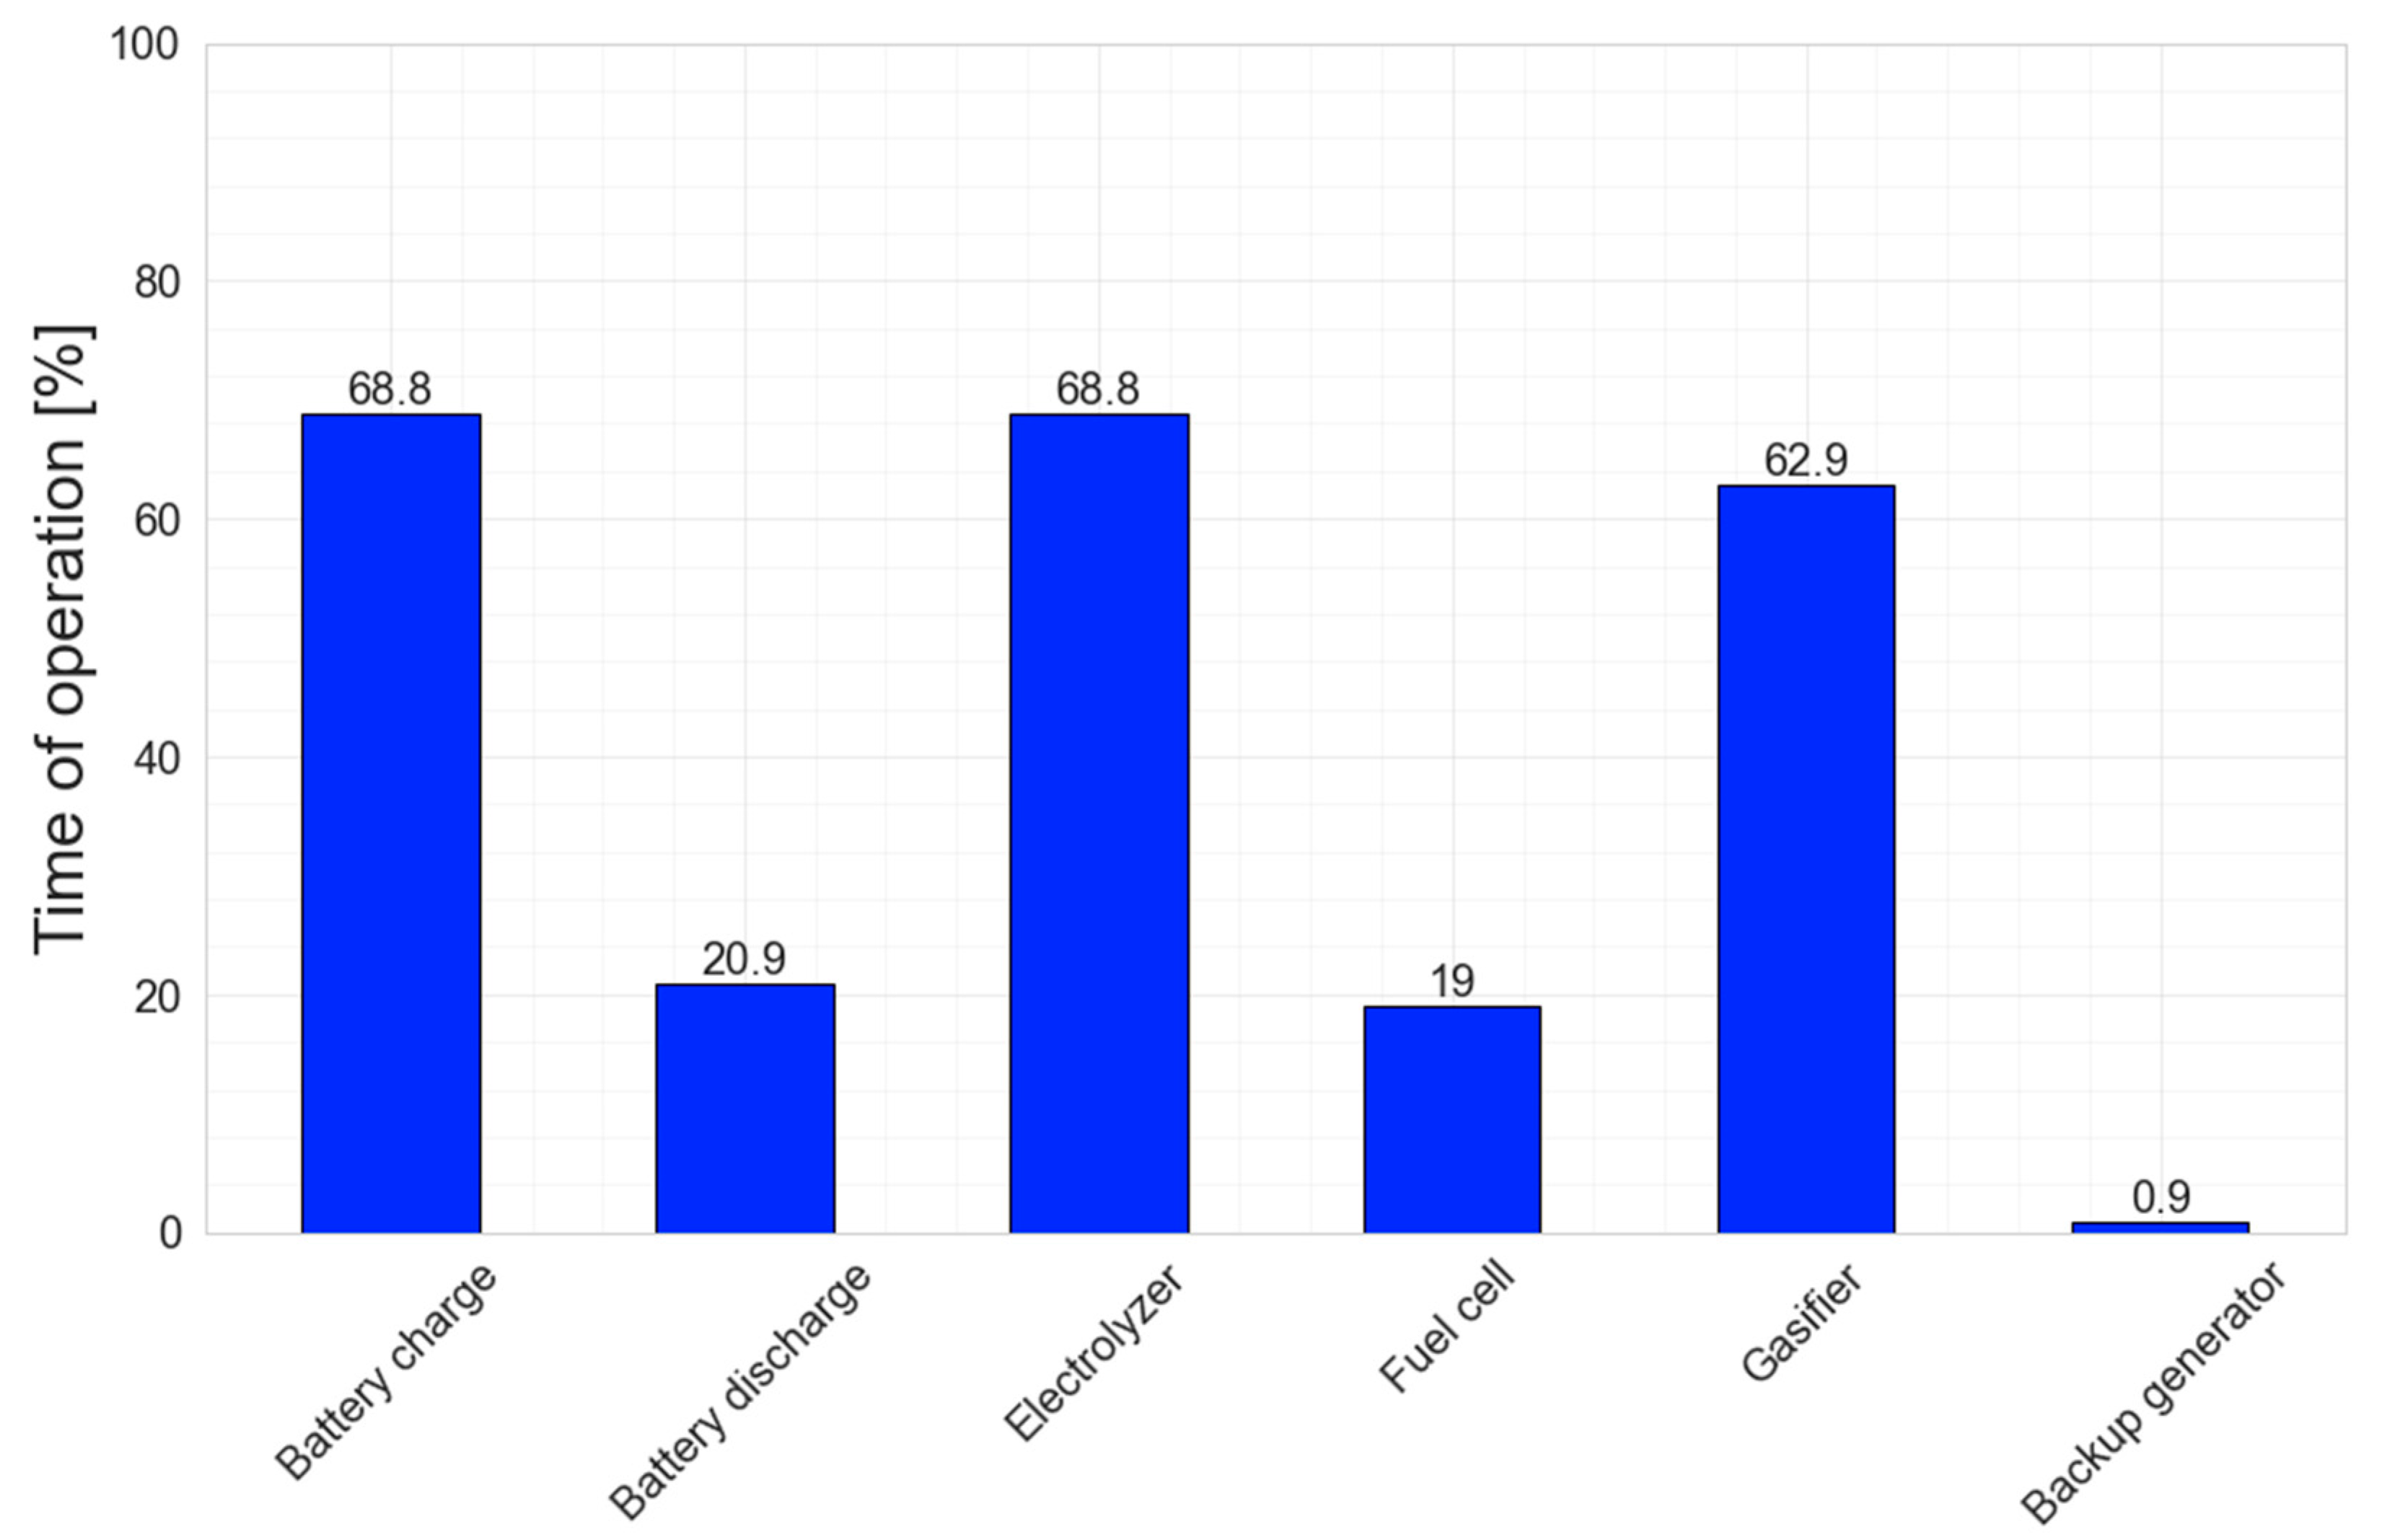
  • Time of the gasifier operation;
  • LPG consumption is equal to the number of cubic meters of natural gas utilized during backup generator operation;
  • Normalized equivalent hours of operation of WT, defined as the ratio between the sum of energy generated by the turbine annually and the amount of energy produced at the same time at nominal conditions;
  • Normalized equivalent hours of operation of PV, defined as the ratio between the sum of energy generated by the PV annually and the amount of energy produced at the same time at nominal conditions;
  • Simple payback time is defined as a period when the value of the energy produced by the system exceeds the initial costs of the system.
The payback period was evaluated by taking into account the initial costs of the PS, its maintenance, and costs of energy in the case of a reference system. For the calculation, the LNG gas price was assumed to be 0.12 EUR/kWh [42]. The maintenance costs were assumed as 10% of the gasifier costs since this part needs technical service to the greatest extent. Costs of kWh of biomass were assumed to be 0.0271 EUR/kWh [43]. The initial costs of WT were assumed as 6000 EUR/kW [44], while PV costs were assumed as 880 EUR/kW [45]. Costs of battery energy storage were assumed as 350 EUR/kWh of storage in the case of 4 h duration batteries [46], while electrolyzer 650 EUR/kW [47]. Hydrogen storage initial costs were assumed as 490 EUR/kWh [48], while costs of fuel cell on the basis of [49] were set to 6500 EUR/kW. The gasifier’s initial costs were set to 5000 EUR/kW [50], and the LPG backup—1000 EUR/kW [51]. On the basis of the presented assumptions, the Simple Pay Back (SPB) index was calculated.

2.3. Case Study

In order to investigate the system performance, the electrical load of a typical tourist resort was adopted as a case study. The energy load profile was prepared for two different localizations—Agkistro, Greece, and Gdansk, Poland. Profiles adopted for Agkistro are reported in Figure 2 and were developed on the basis of Ref. [52]. The peak load was set to 100 kW and varied for the different seasons and types of the day (weekday, weekend), on the basis of occupancy and the daily demand profile. Yearly energy consumption was 354 × 103 kWh. Load profiles for Gdansk are presented in Figure 3 and were developed based on the report “Energy in the tourist facility” developed by the Institute for Sustainable Development, Poland [53], a report on the hotel market in Poland in 2019 [54] and report “Structure of energy consumption in hotels” prepared by The Polish National Energy Conservation Agency [55]. Similar to the Agkistro case, peak load was set to 100 kW, while daily load profiles were prepared on the basis of average occupancy. Yearly consumption of the resort in the case of Gdańsk was equal to 492 × 103 kWh.
The main system parameters are reported in Table 3. They were selected in order to ensure a proper operation of the system in terms of electrical energy flows and to ensure the capability of matching the user energy demand. The assumption of the simulation was to create a system powered by 99% renewable energy. In particular, the system configurations for both locations were determined on the basis of an iterative procedure, aiming to achieve the previously mentioned goal of renewable energy share with similar system parameters for both locations.

3. Results and Discussion

The dynamic simulation of the system was carried out on a one-year basis, from 0 to 8760 h with a timestep equal to 0.25 h. The time discretization allowed one to determine during the simulation the power generated/consumed by each component and to calculate integrated variables summarizing the operation of the system in terms of energy and economic performance in the period of one year. Due to the large amount of dynamic data generated during the simulation, only the most important results were reported for the sake of brevity.
In detail, the dynamic operation of the system for both of the cities under consideration is shown for three different day cases—one for a situation when production from renewables significantly exceeds load profile and storage possibilities, a second for a situation when production from PV is complementary to wind in terms of satisfying user needs, and a third when powers produced from renewable energy sources are far below load profile. Moreover, for both cities, a simulation of a longer period of operation in conditions of limited wind availability is presented, in order to show the limits of using energy storage. The behavior of the system over the yearly operation is presented on the monthly basis in terms of energy production and on an hourly basis for the state of charge of both energy storages. The yearly results are presented to point out the global energy and economic performance of the system.
For Agkistro, the trends of the electrical energy flows of the system components for the selected day with significant energy overproduction (3 June, from 3696th to 3720th hour of the year) are shown in Figure 4. In the first hours of the day, the gasifier operation is needed to satisfy user needs since low wind power availability and no production from PV panels occur. Around 7:00 a.m., both PV and WT start to produce energy, while the gasifier is still producing energy due to its hopper capacity. Due to the high availability of solar radiation during this period, at 9:00 a.m., PV panels are producing enough energy to satisfy user needs; however, the energy produced by the wind turbine also starts to grow. In the central hours of the selected day, the power from all renewable sources exceeds the load by about 5 times, and such excess energy cannot be totally directed to the energy storage devices due to their limited powers (100 kW for the battery and 40 kW for the electrolyzer). Such an imbalance causes the necessity of energy curtailment, which achieves about 90 kW at its peak, and cannot be used.
Concerning the day selected with solar-wind complementary energy production (10 August, 5328th—5352nd hour of the year) electrical energy flows are shown in Figure 5. In the morning hours, it can be seen that production from wind turbine allows one to satisfy all of the users’ needs, while overproduced energy is being directed to the electrolyzer. It is worth noting that in the morning hours there is no energy flow directed to the battery since it is fully charged—it causes a relatively small curtailment of the power at the level of 20 kW. At 7 a.m., production from wind turbines significantly decreases, while energy load achieves its morning peak. This imbalance is appeased by growing production from PV panels and a power withdrawal of about 10 kW from battery storage. Shortly after the peak of PV production occurs, at 2 p.m., WT production starts to significantly grow and meets afternoon peak demand. A significant part of the energy overproduction is directed to the electrolyzer, while the rest is curtailed due to fully charged battery storage.
Both previously presented cases concerned the summer period when there is a general oversupply of renewable energy production. Data presented in Figure 6 for the 8 December (8208th to 8232nd hour of the year) refer to a period with limited energy production connected with the highest load due to heating needs. It can be seen that on this day there is no production from WT except from 10 p.m. to midnight when the value of produced power does not exceed 7 kW. Production from the PV field is also limited due to high cloud cover—it starts at 8 a.m., but the highest value achieved at noon does not exceed 50 kW, which is 20 kW under the load curve. In order to meet the users’ needs, the gasifier is working constantly throughout the day with its nominal capacity equal to 35 kW. In the morning hours, all of the lacking energy is produced by the fuel cell due to an empty battery. At 5 p.m., the LPG backup generator receives a signal to start its operation in order to satisfy the needs. It is working with a full load equal to 70 kW, while production exceeding energy needs is used to charge the hydrogen storage.
The main problem of energy installations based on wind turbines is unstable energy production. Figure 7 and Figure 8 are referring to a six-day-long period (11–17 October, 6816–6960 h of the year) with very limited resources of wind power for the Agkistro location. During this period, production from wind turbines is lower than 20 kW with respect to 100 kW of its nominal power with a single exception on the 15 October, when production reaches 32 kW. During most of this period, it is necessary to operate the biomass gasifier. When the morning and afternoon load peaks occur, it is necessary to use energy stored in the hydrogen loop and battery. It is worth noting that on weekdays, values of lacking power do not exceed 20 kW, whereas, on weekend days, when the tourist facility is more crowded, it is necessary to provide even 45 kW of power, which is slightly over half of the peak load. As shown in Figure 8, a 6-day period of reduced wind energy production caused a reduction of energy storage level of charge for even 50% in the case of hydrogen and 15% in the case of the battery, which suggests that the designed system is relatively resilient to short-term wind availability problems.
Monthly energy ratios for the Agkistro location are shown in Figure 9. The variation of WT energy output between months is not significant since its value ranges between 10.6 MWh in November and 14.6 MWh in June. It is worth noting that such variation is seasonal—the sum of energy produced in spring and autumn (35.5 MWh and 33.3 MWh, respectively) is significantly lower than the sum of energy produced in winter and summer periods (40.7 MWh and 41.8 MWh, respectively). Since Agkistro is visited mainly in the winter months, the load in this period is greater by about 60% than in the summer period and reaches 109.4 MWh. PV production reaches its maximum in summer, with a total production equal to 40.7 MWh. It is worth noting that the use of an LPG backup generator occurs only in winter months, where production from renewables is at the lowest level as opposed to the load, which reaches its maximum. In particular, the amount of energy produced from LPG reaches only about 2% of the load in January and February and 6% in December. Curtailment of redundant energy occurs every month, but the highest values are achieved in the summer months due to high quantities of production from renewables and high fill factor for energy storage (see Figure 10). Such values reach even 89% of the load in July, while in January it is 20%.
The state of charge of energy storage devices significantly varies in winter months due to the low availability of solar radiation and high variability of wind parameters. The rest of the analyzed period is characterized by high SOC levels, with few exceptions caused by wind instability. The variation of SOC for the hydrogen system in the summer period is meanly about 20% with respect to the value of 90.0% (fully charged), while during winter it is 70%. In the winter period, the variation of SOC of the battery system is lower than the one of the hydrogen system, since its mean is equal to 30%.
Figure 11 reports the operational time of separate parts of described energy installation in the case of Agkistro. As can be observed, only for about 20% of the year there is a demand for stored energy (including 15% for relatively high power, taken from both the battery and the fuel cell). During the rest of the year, renewable energy is used directly to meet the load, and its surplus is directed to energy storage. It is worth noting that gasifier used in this study as a peak energy source was used for about 75% of the year due to its work characteristics.
In the case of Gdansk, the selected day with significant overproduction was the 28 February (1416–1440 h of the year). The trends of the energy flows are shown in Figure 12. In the first hours of the day, the only sources of energy operating were wind turbine and the gasifier which led to little overproduction at 1 a.m. For the next 7 h, energy production was higher by 10–15 kW than the load of the user; therefore, overproduction was directed to the energy storage devices. At 8 a.m. energy generation from the PV field started growing rapidly, which led to the curtailment of energy at 9 a.m. It is important to note that during that time the gasifier was still active due to the volume of the hopper. For another 2 h gasifier was still active, while energy generation from PV was growing. The peak of overproduction was achieved at 11 a.m. when the value of curtailed power achieved 55 kW. Right after that, the gasifier was set to stop, and generation from PV began to decline which occurred in lowering the value of curtailed power to less than 6 kW. However, due to the growing amount of wind energy in the production mix, in the next 3 h, the amount of lost power varied between 10 and 20 kW.
The day selected to present solar-wind complementary renewable energy production was the 9 March (1632–1656 h of the year, see Figure 13). In the morning hours, the only source of energy provided to the system is the wind turbine, which works with its nominal power equal to 70 kW. On the other hand, the load of the user in this period slightly exceeds 60 kW. The rest of the produced energy was directed to the battery, due to an SOC lower than the nominal one. In the period between 4 a.m. and 7 a.m., the value of the load was similar to the value of energy produced by a wind turbine, slight overproduction was stored in the battery, while the energy needed to match the demand was taken from the latter. At 8 a.m. energy production from wind turbines started to rapidly decrease to 35 kW at 9 a.m., while the PV field started to produce energy with the maximum power of 33 kW. Production from both sources was nearly complementary for 5 h of this day and with the support of a battery with a power between 7 and 15 kW allowed the user’s load to be satisfied. At noon, the gasifier received a signal to start its operation due to the low SOC of the battery. Overproduction caused by the gasifier was used in order to charge the battery and for purposes of electrolyzer operation. At 4 p.m., the wind turbine once again started its operation with nominal power; however, the users’ load achieved its afternoon peak demand with a value equal to 100 kW. In such a situation, the nominal operation of WT and GAS allowed the production of 105 kW of power; thus, the overproduction of 5 kW was supplied to the energy storage.
On the 9 February, the simulation for Gdansk (presented in Figure 14) showed the necessity of using a backup LPG generator. SOC of the storage devices was at a low level, but during the first 6 h of the day, the load was met with combined energy from GAS, FC, and BAT. At 6 a.m., the load started increasing which in combination with the low SOC of the hydrogen circuit led to the activation of the LPG generator with its nominal power for another 6 h. During this period, the energy produced by LPG, GAS, WT, and PV was used for purposes of matching users’ load and supplying hydrogen to the emptied storage tank. At 11 a.m., after the morning peak demand, energy balance allowed the shutdown of LPG for the next 6 h—during this period, the load was met by GAS, WT, and PV with the support of FC. Due to afternoon peak demand, LPG had to be turned on at 5 p.m. It is worth noting that the peak power of WT this day was below 10 kW, while PV power achieved 22 kW. Such values are caused by unfavorable weather conditions that occurred on the selected day.
The weakest point of stand-alone energy systems based mostly on PV and WT from the operational point of view is the periods of low accessibility of wind during winter months, typically coupled with concurrent low availability of solar radiation. An example of such a situation for Gdansk is the period between the 25 and 28 November (7896–7968 h of the year) and as shown in Figure 15 and Figure 16. The beginning of this period is characterized by fully charged BAT and HS. In the first hours of the 25 November, production from WT is higher than the load, but the situation changes at 5 a.m. when the turbine stops its operation due to a lack of wind. In order to match the energy demand, the gasifier starts its operation. In the time it takes to start the device, the missing energy is supplied from the battery. For the next 3 days, WT produced relatively small amounts of energy, as well as PV field (reaching a 15 kW at peak of 25th, 35 kW at peak of 26th, and 34 kW at peak of 27th). Despite the constant operation of the gasifier, production from renewables is not sufficient to meet the users’ load and causes a need of using FC and BAT. Due to relatively high user needs, characterized by the electricity consumption in Gdansk, which is highest in the winter season, the storage system is able to provide power for 2 days. However, right after that, it is necessary to start the operation of the LPG backup generator.
Monthly energy ratios for the energy system in the case of Gdansk are shown in Figure 17. Energy generated by WT significantly varies between seasons, favoring winter (97 MWh) and spring (89 MWh) rather than autumn (65 MWh) or summer (56 MWh). Such a ratio is particularly convenient due to the inclusion of PV, which as is known, works better in summer conditions. The simulation data confirm this relationship since during winter, PV produces only about 11 MWh, spring and autumn have similar values (35 and 38 MWh, respectively), while summer operation of PV provides 57 MWh. Due to these complementary trends, the gasifier is being used in a pretty constant manner throughout the year, with values varying between 13 MWh in March to 20 MWh in May. Use of the LPG backup generator occurs every month between October and February, though the energy produced by this device is always below the level of 4% of the monthly load. Similar to the case of Agkistro, curtailment of energy occurs every month, but the highest values are for summer, due to relatively lower load and slightly higher production from renewables. The highest value of curtailed energy is noted in August, and is equal to 46%, while the lowest value, 17%, is achieved in October. Figure 18 shows the SOC of both energy storages. It is important to note that the values are more volatile through the year than in the case of Agkistro, which allows the amounts of curtailed energy to be reduced.
The operational time of parts of the energy system is reported in Figure 19. The battery is used as a source of energy for 20.9% of the year, while FC is used for 19% of the year. Both storage systems are charged for 68.8% of the year. The gasifier is being used significantly less frequently than in the case of Agkistro—it is working for 62.9% of the year. The LPG backup generator is operational for only 0.9% of the time.
A comprehensive approach to energy production analysis in both energy systems is shown in Figure 20 and Figure 21. The pie charts show the percentage contribution of energy sources to the total energy mix. In the case of Agkistro, the main source of energy is the gasifier, which provides 45.2% of the energy, while WT and PV deliver 29.6% and 24.2%, respectively. LPG generator is responsible for 1% of the total production. The situation differs significantly in the case of Gdansk, where 47.2% of the energy is produced by WT. It is worth noting that the size of the wind turbine chosen for Gdansk is lower than the one for Agkistro (70 kW vs. 100 kW); however, high wind parameters compensate for this difference. Gasifier produces 30% of the energy needed per year in Gdansk, which is strictly due to the lower energy needs compared to Agkistro. PV stands for 21.9% of the renewables due to the high latitude of Gdansk. Similar to Agkistro, the LPG generator is responsible for 1% of the production showing that for both locations the contribution of such a device is marginal.
Important parameters of both hybrid systems are reported in Table 4. The energy load of Gdansk was significantly higher on an annual basis than the one for Agkistro; however, both energy systems are using LPG generators rarely, which results in gas consumption of only 586 and 450 m3, respectively. Values of curtailed energy are nearly equal, with 152 × 103 kWh for Agkistro and 153 × 103 for Gdansk. These values stand for 43% and 31% of load, respectively. The wood chip gasifier operates for 6557 h per year in the case of Agkistro and for 5507 in the case of Gdansk, which makes it the main energy source in the Greece localization.
The high normalized equivalent number of operation hours of WT in the case of Gdansk, equal to 0.503, leads to the conclusion that this location is particularly suitable for installing small wind turbines. Indeed, this subsystem was the main source of energy for the case of Gdansk.
The economic results of the dynamic simulation of the system are summarized in Table 5. Due to a similar system configuration in terms of components size for both locations, the overall cost of the system is comparable in the two cases. Nevertheless, the operation cost related to the consumption of fuels (LPG and biomass) is different, mainly due to the different availability of both wind and solar energy sources and the capacity of components. The gasifier is more frequently activated in Agkistro competed to Gdansk, which leads to a 19.3% higher cost of exploitation. Conversely, the cost for LPG is higher in the case of Gdansk with respect to Agkistro (30%), but the absolute cost is marginal with respect to other operation costs, such as maintenance. Finally, the global economic performance of the proposed system is significantly better for the Polish location compared to the Greek one despite a similar investment cost. This is due to a different energy yield of the energy generation components, different energy demand, and backup system (gasifier and LPG generator) operation in both systems.

4. Conclusions

In the paper, a comprehensive investigation of the operation, energy, and economic performance of a novel stand-alone energy system for island purposes is presented under the case study of a tourist resort in two different localizations of Gdansk, Poland, and Agkistro, Greece. The study is focused on a system consisting of a photovoltaic field, wind turbine, wood chip gasifier, battery, hydrogen circuit with an electrolyzer, hydrogen storage and fuel cell, and backup generator used to provide electricity with 99% of yearly load coverage.
The adoption of gasifier as a peak energy source is investigated. The system dynamic behavior is analyzed on the daily basis for three different cases—with a high surplus of renewable energy, the case with energy from renewables similar to load, and one with a lack of renewable energy. Due to the presence of long-term energy storage, the case of the longer period without access to renewable energy from a wind turbine is also analyzed. The analysis of energy and economic parameters reveals that:
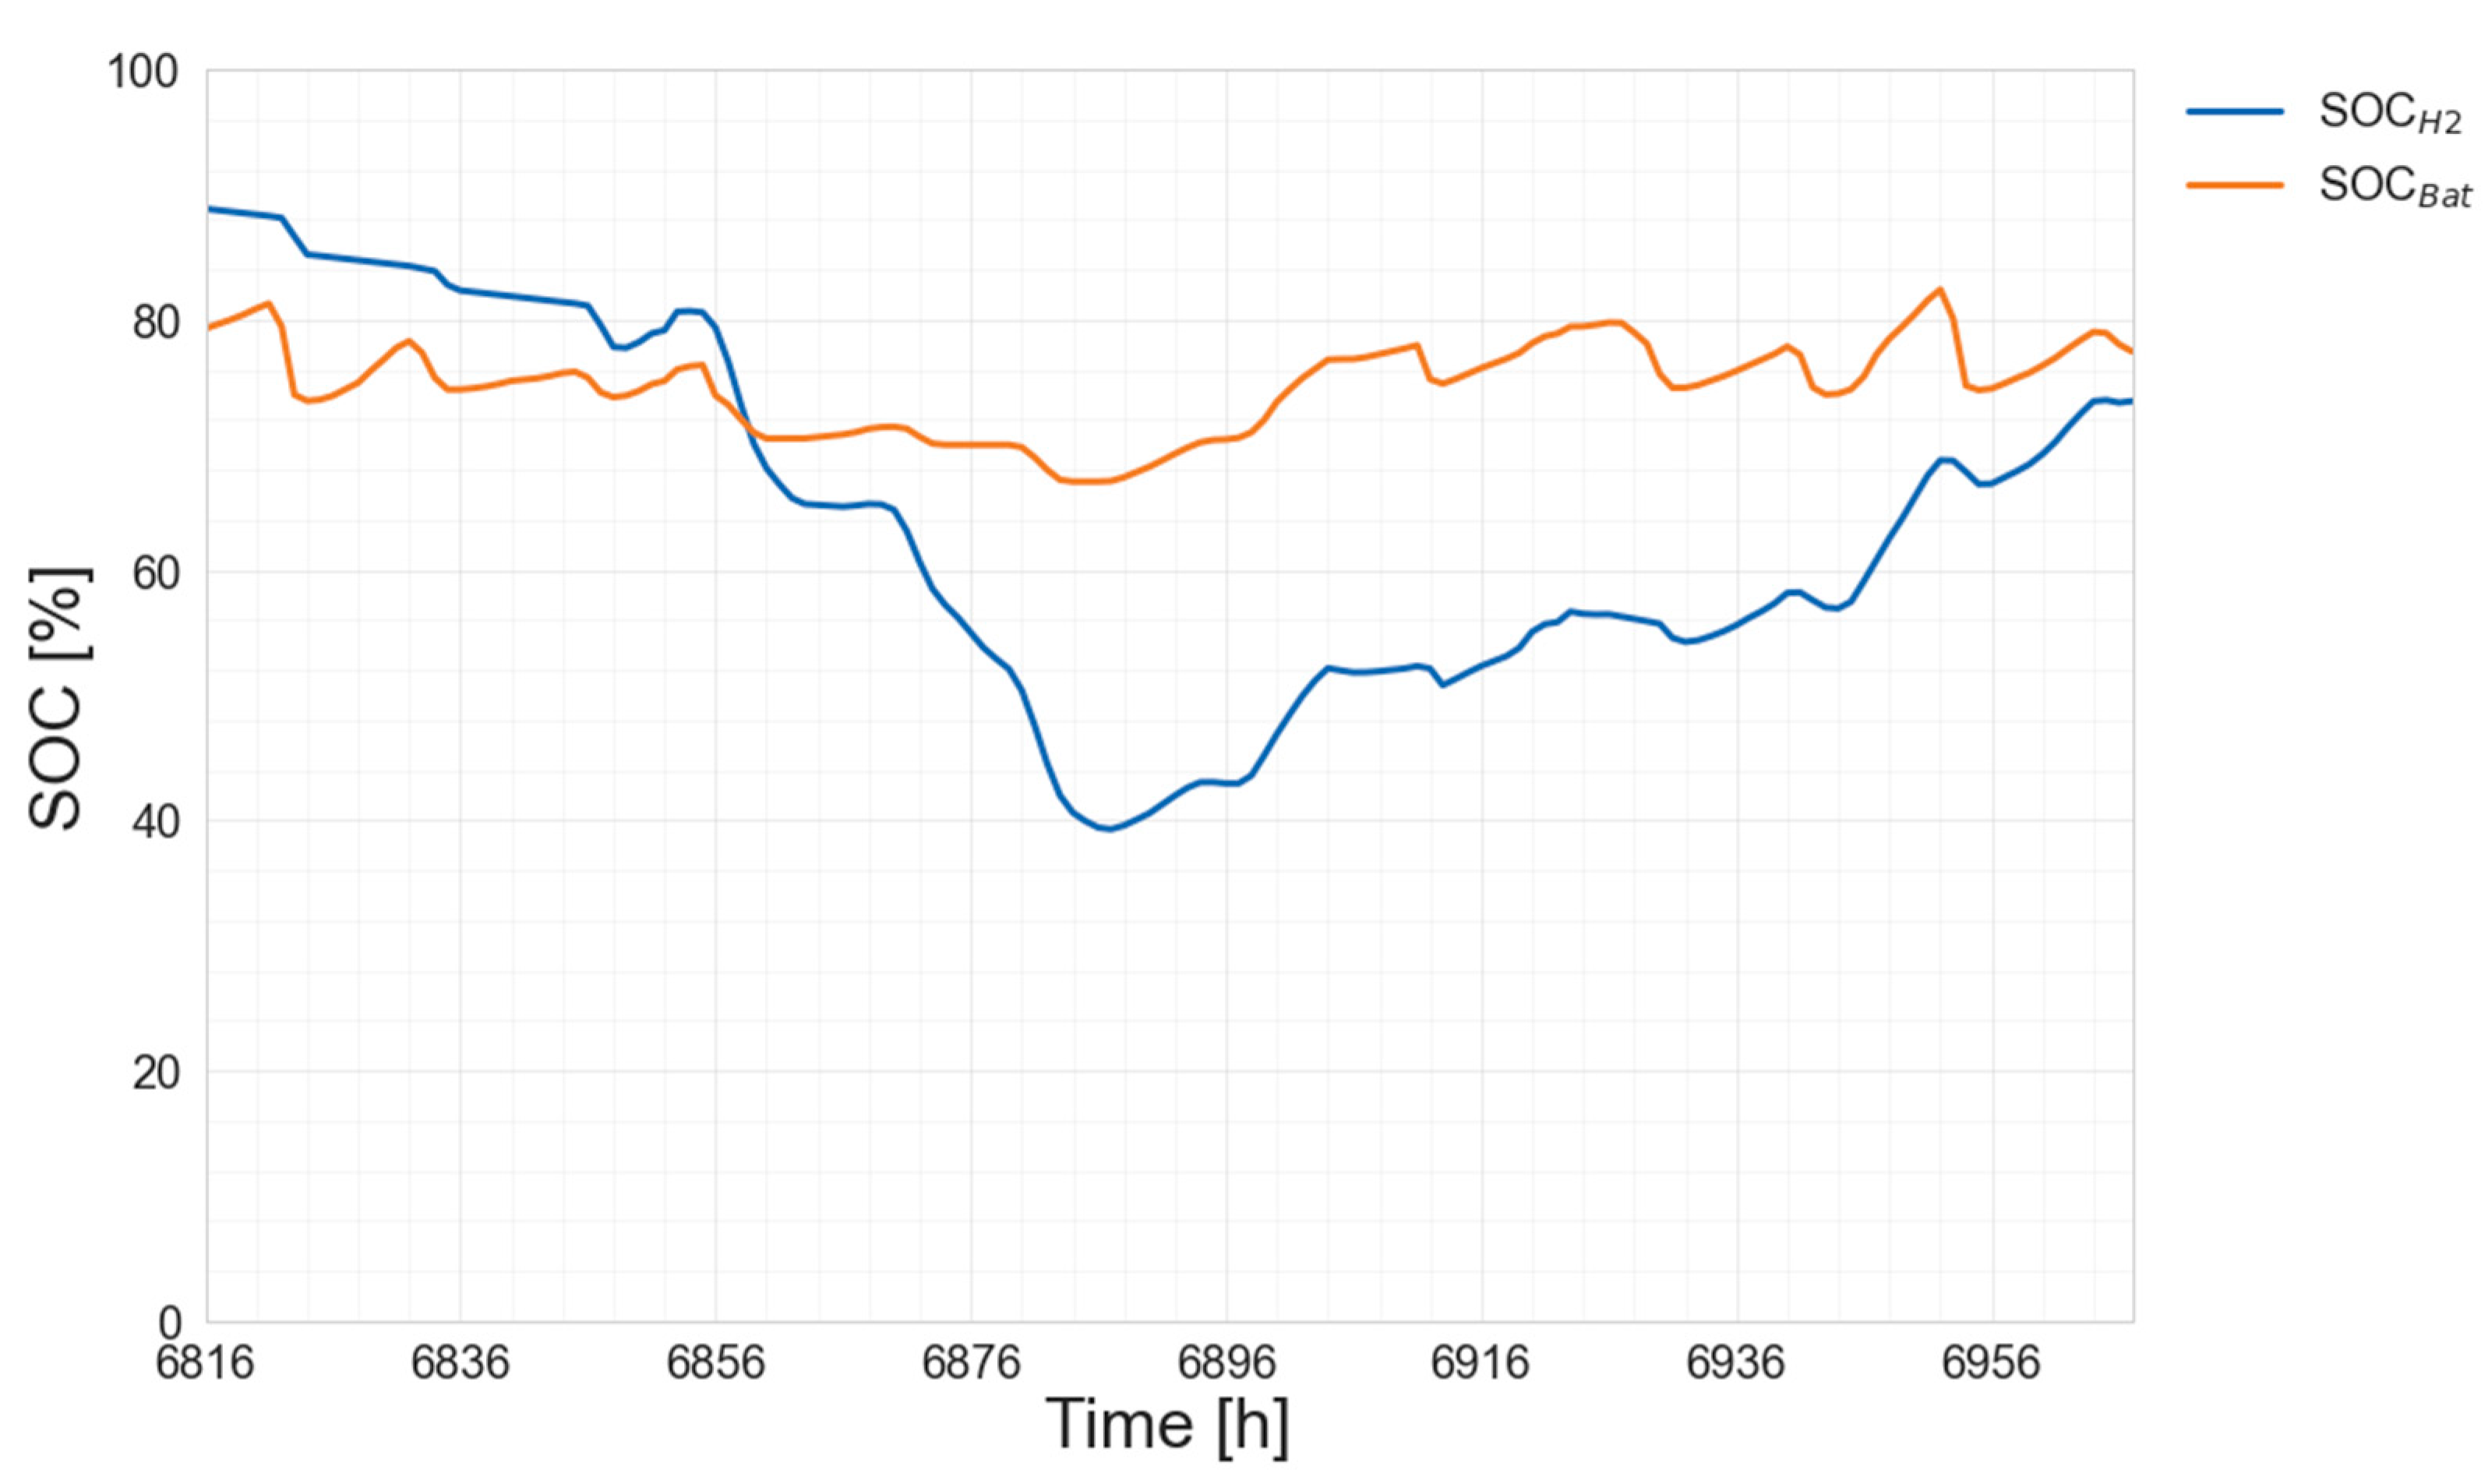
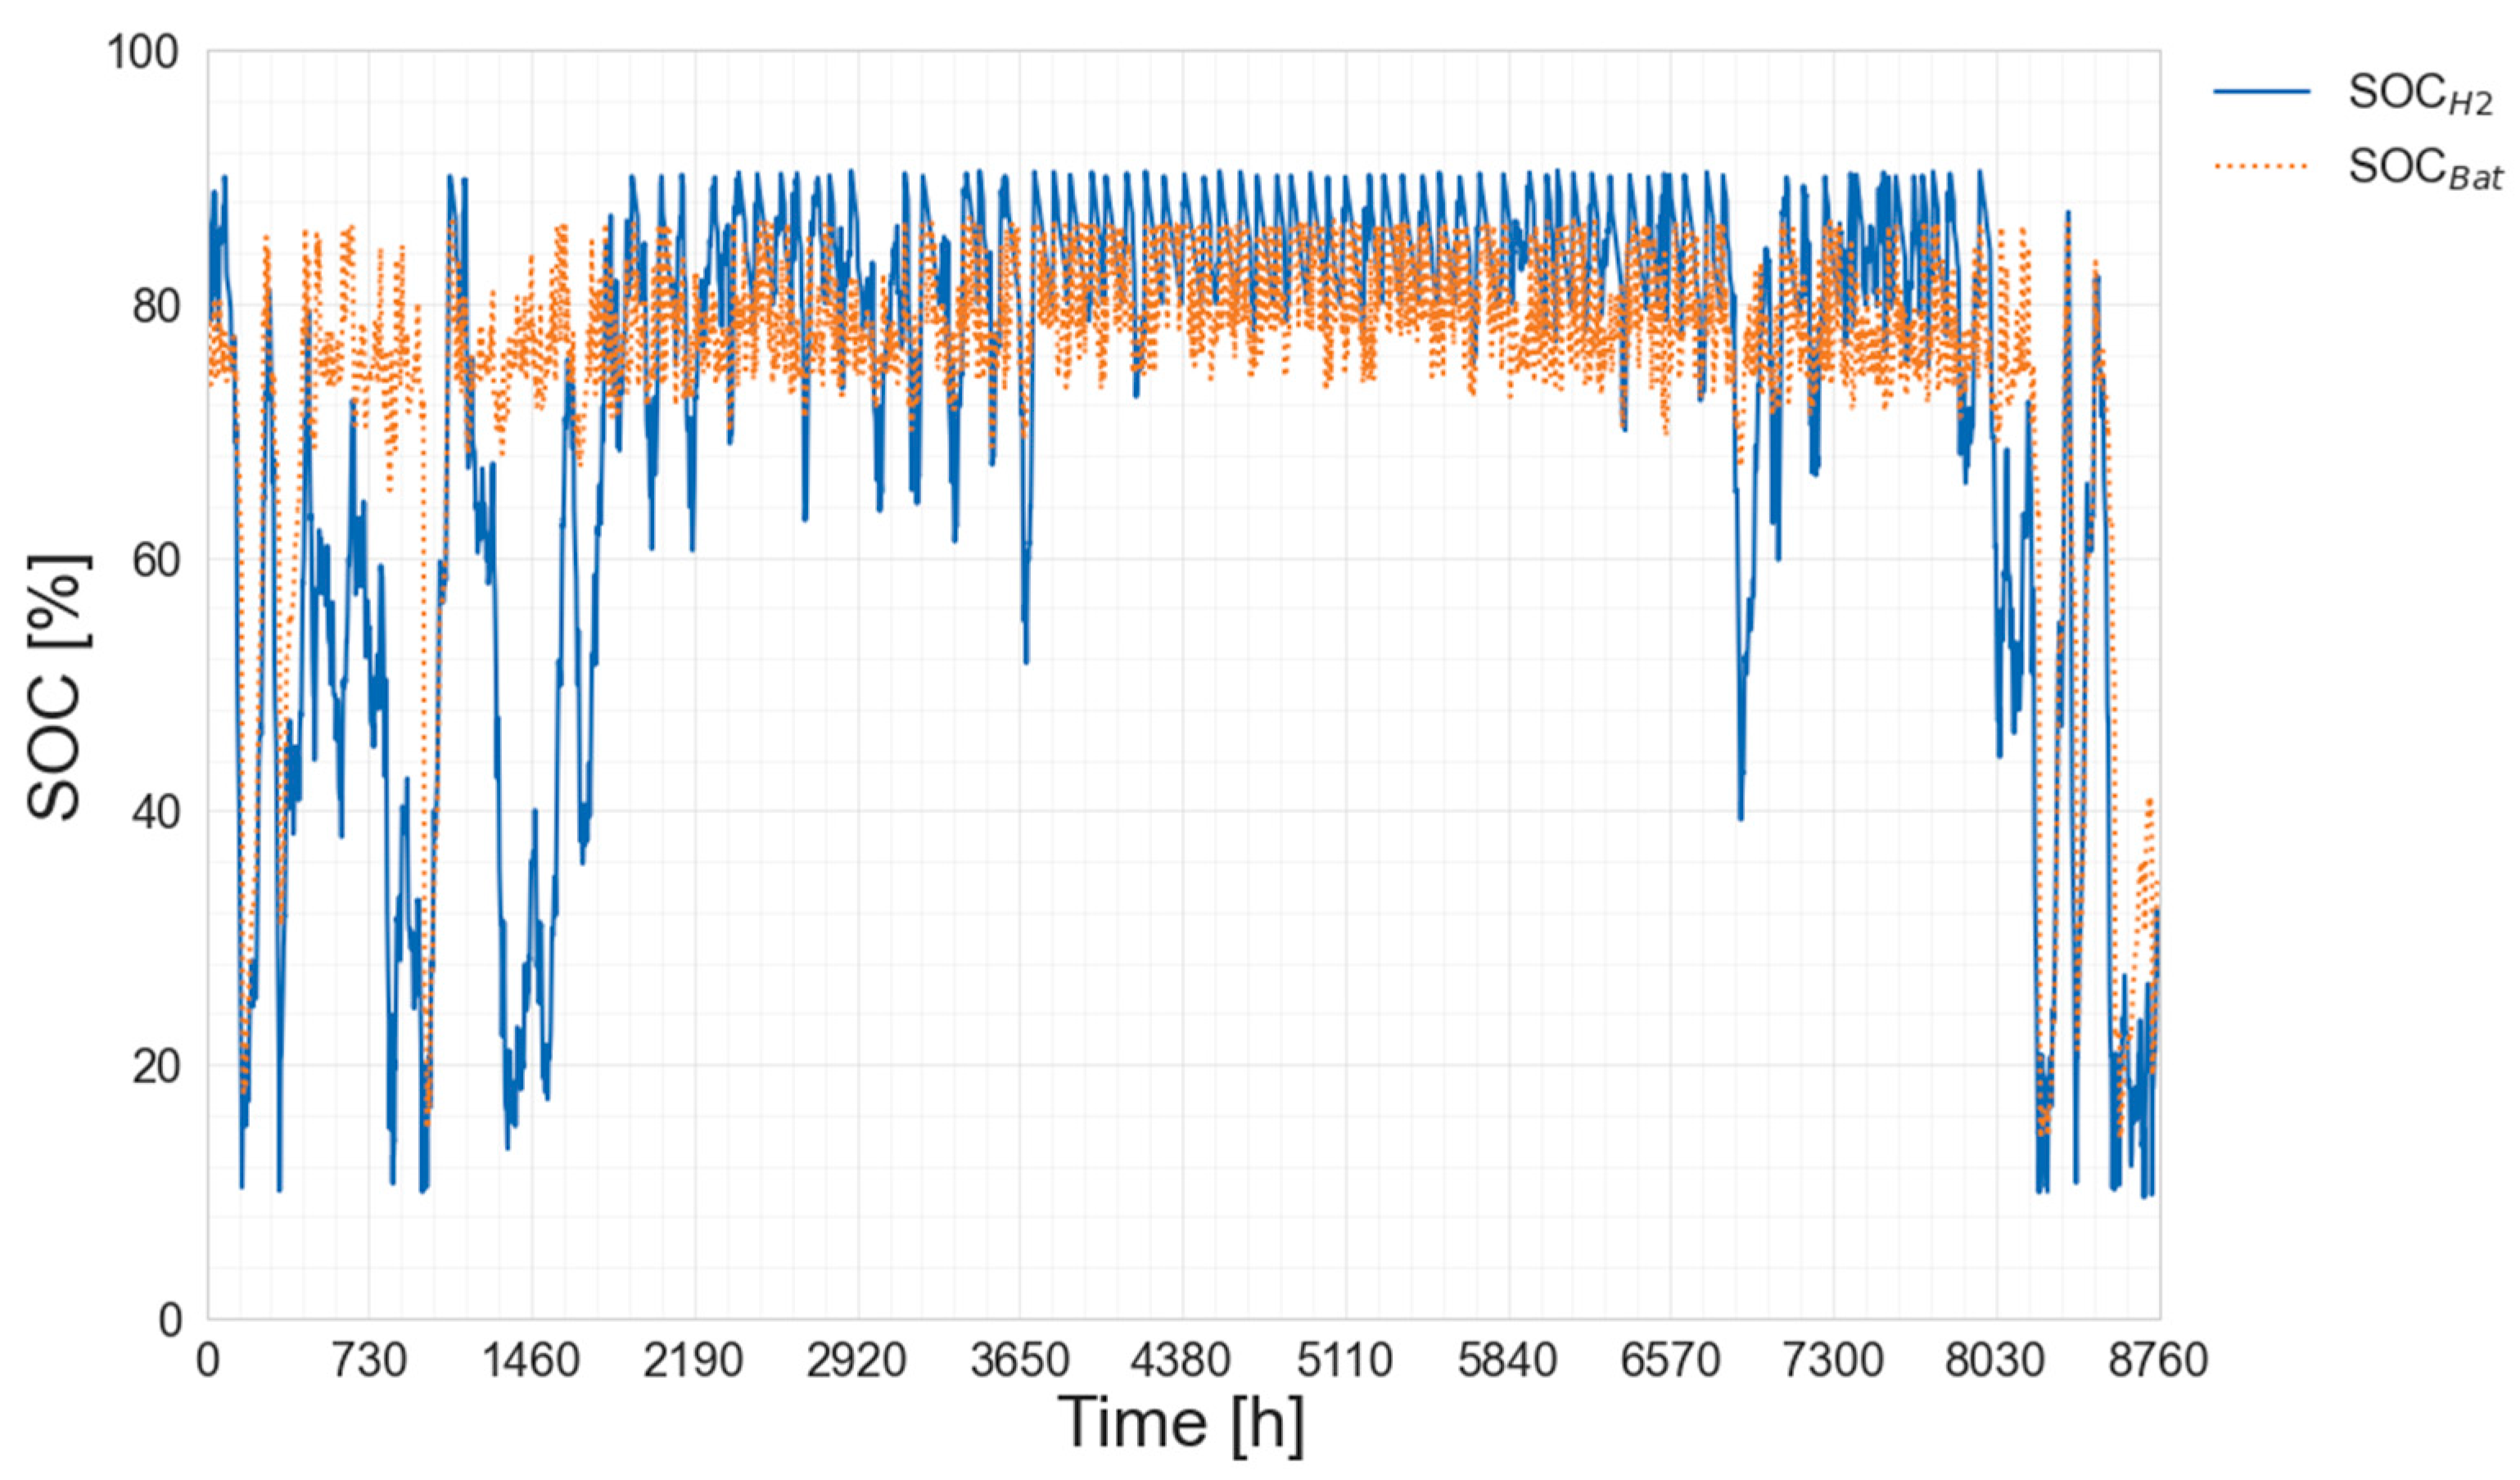
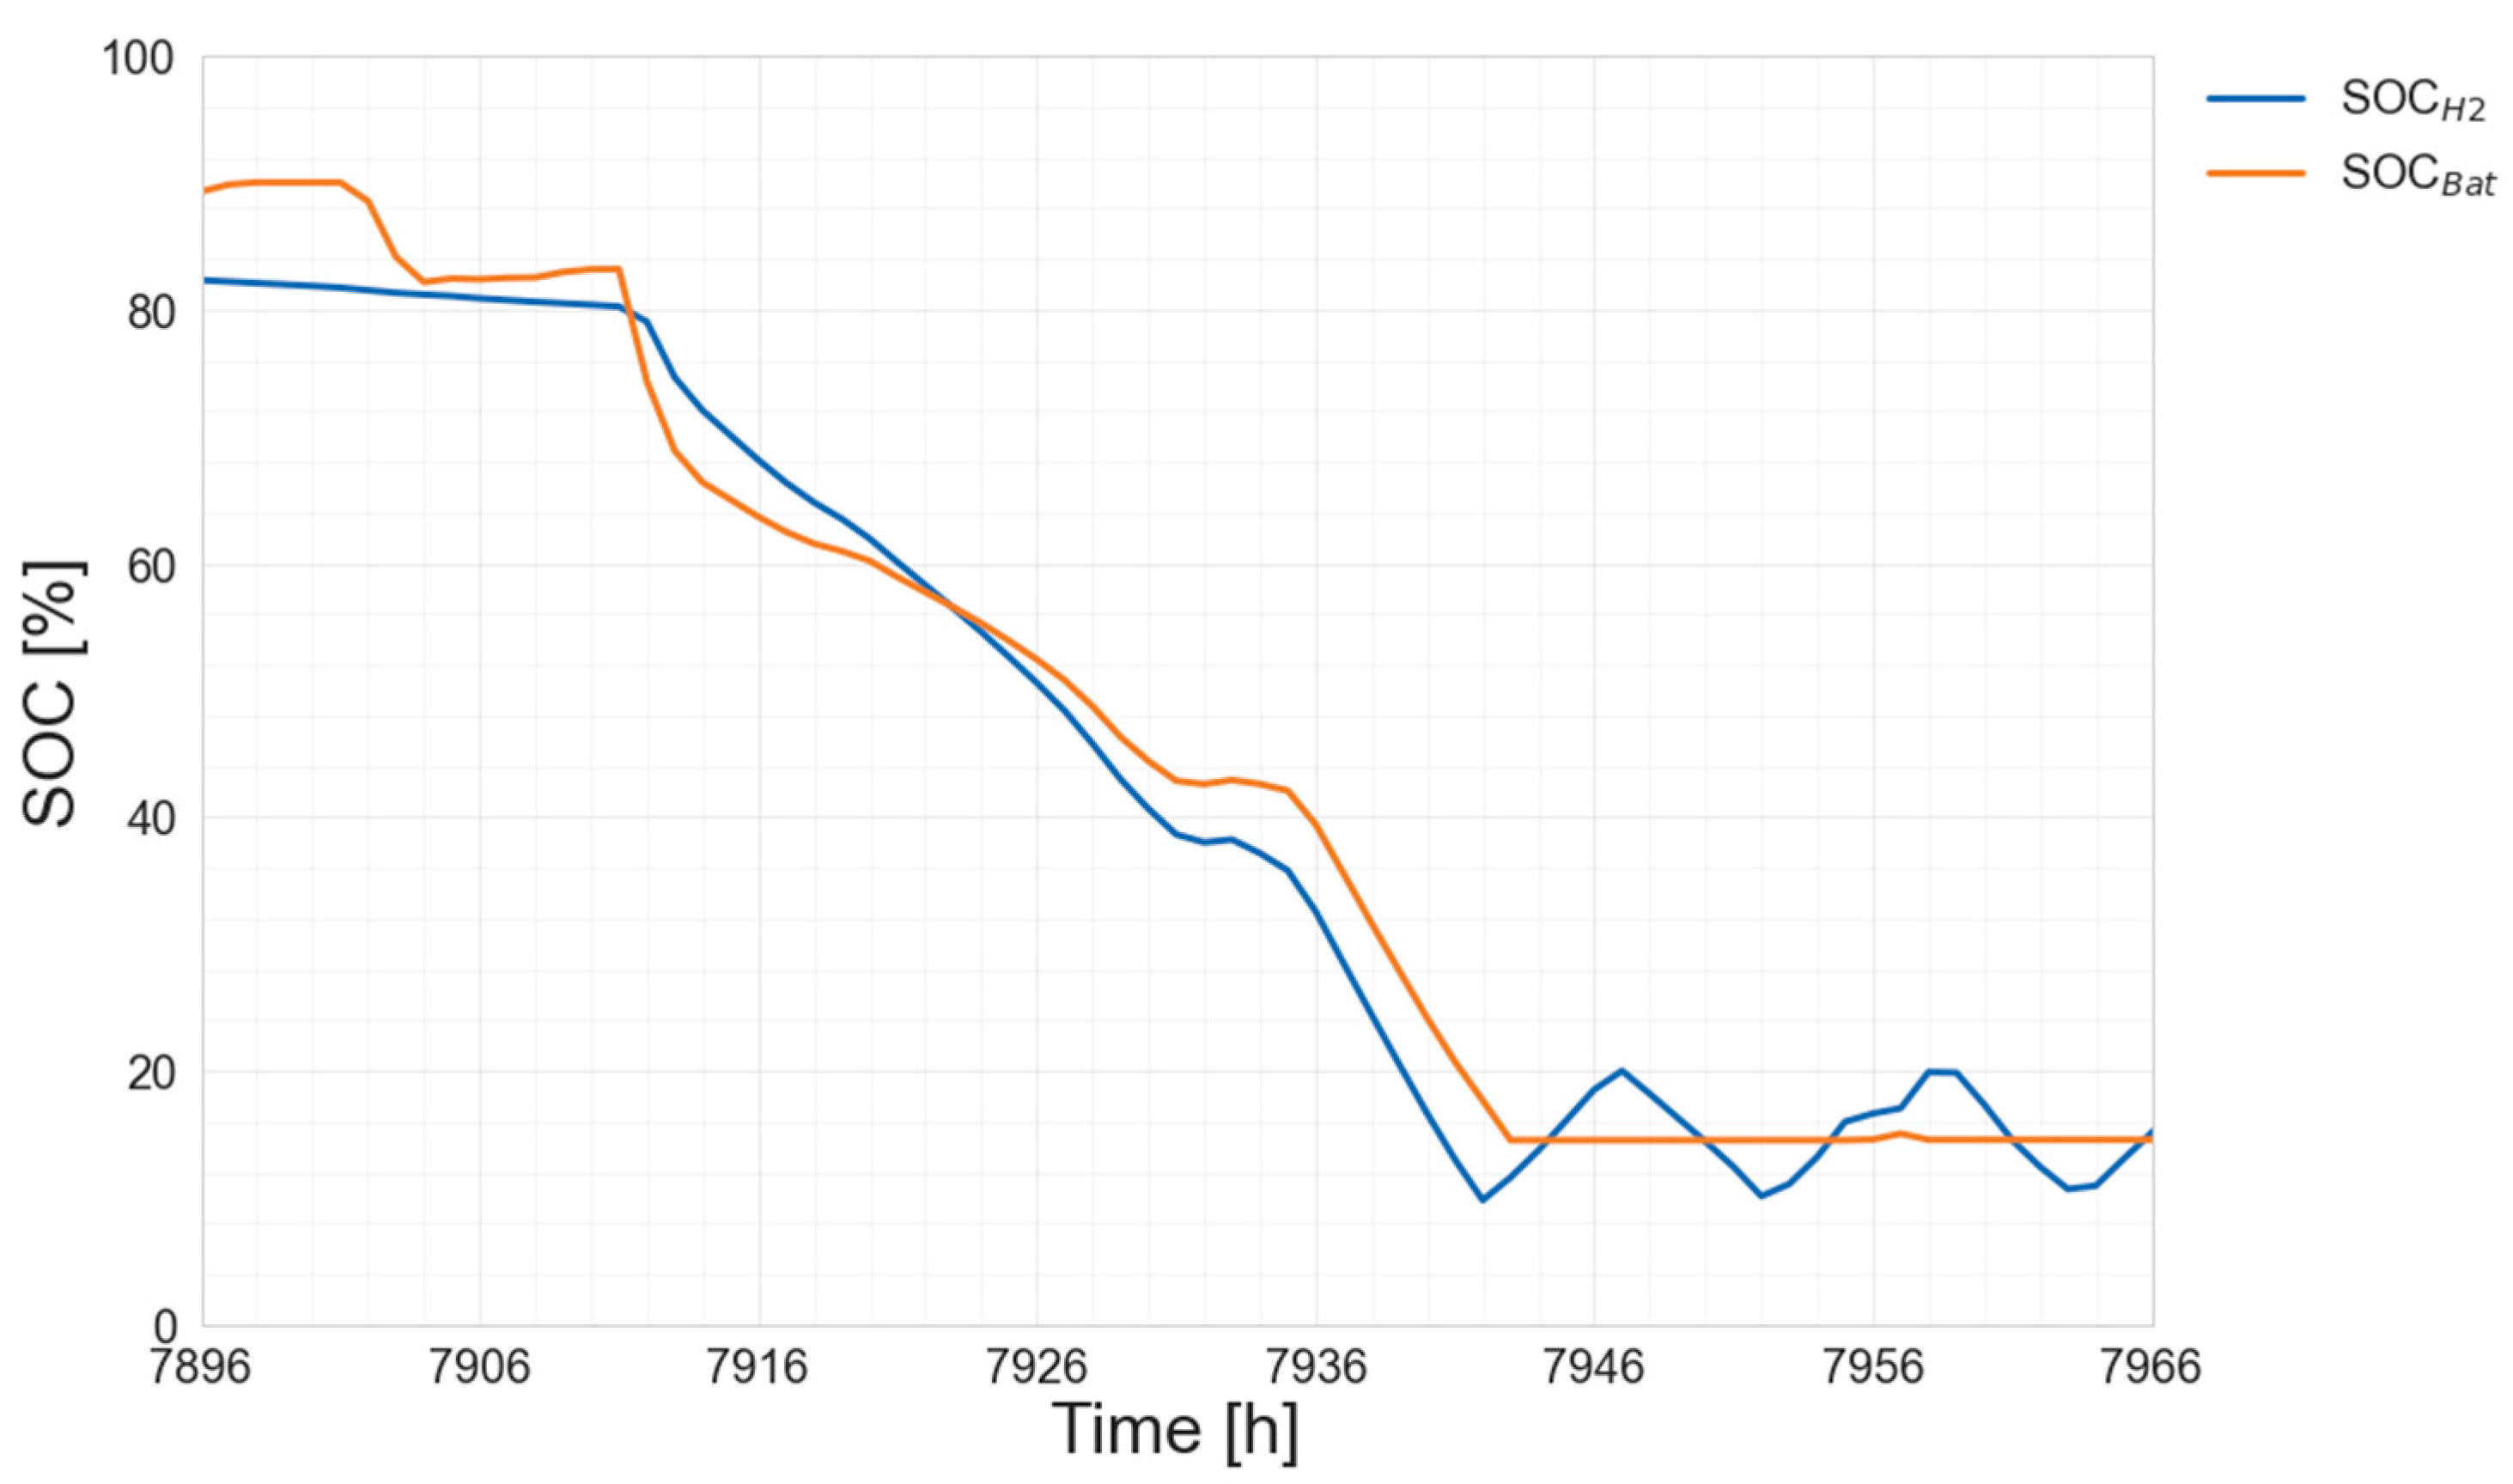
  • Despite the availability of long-term energy storage, the energy safety of the presented system is highly dependent on access to wind energy. Due to higher user demand, Gdansk is able to operate in low-wind conditions only for about 3 days, while Agkistro empties its storage in 7 days;
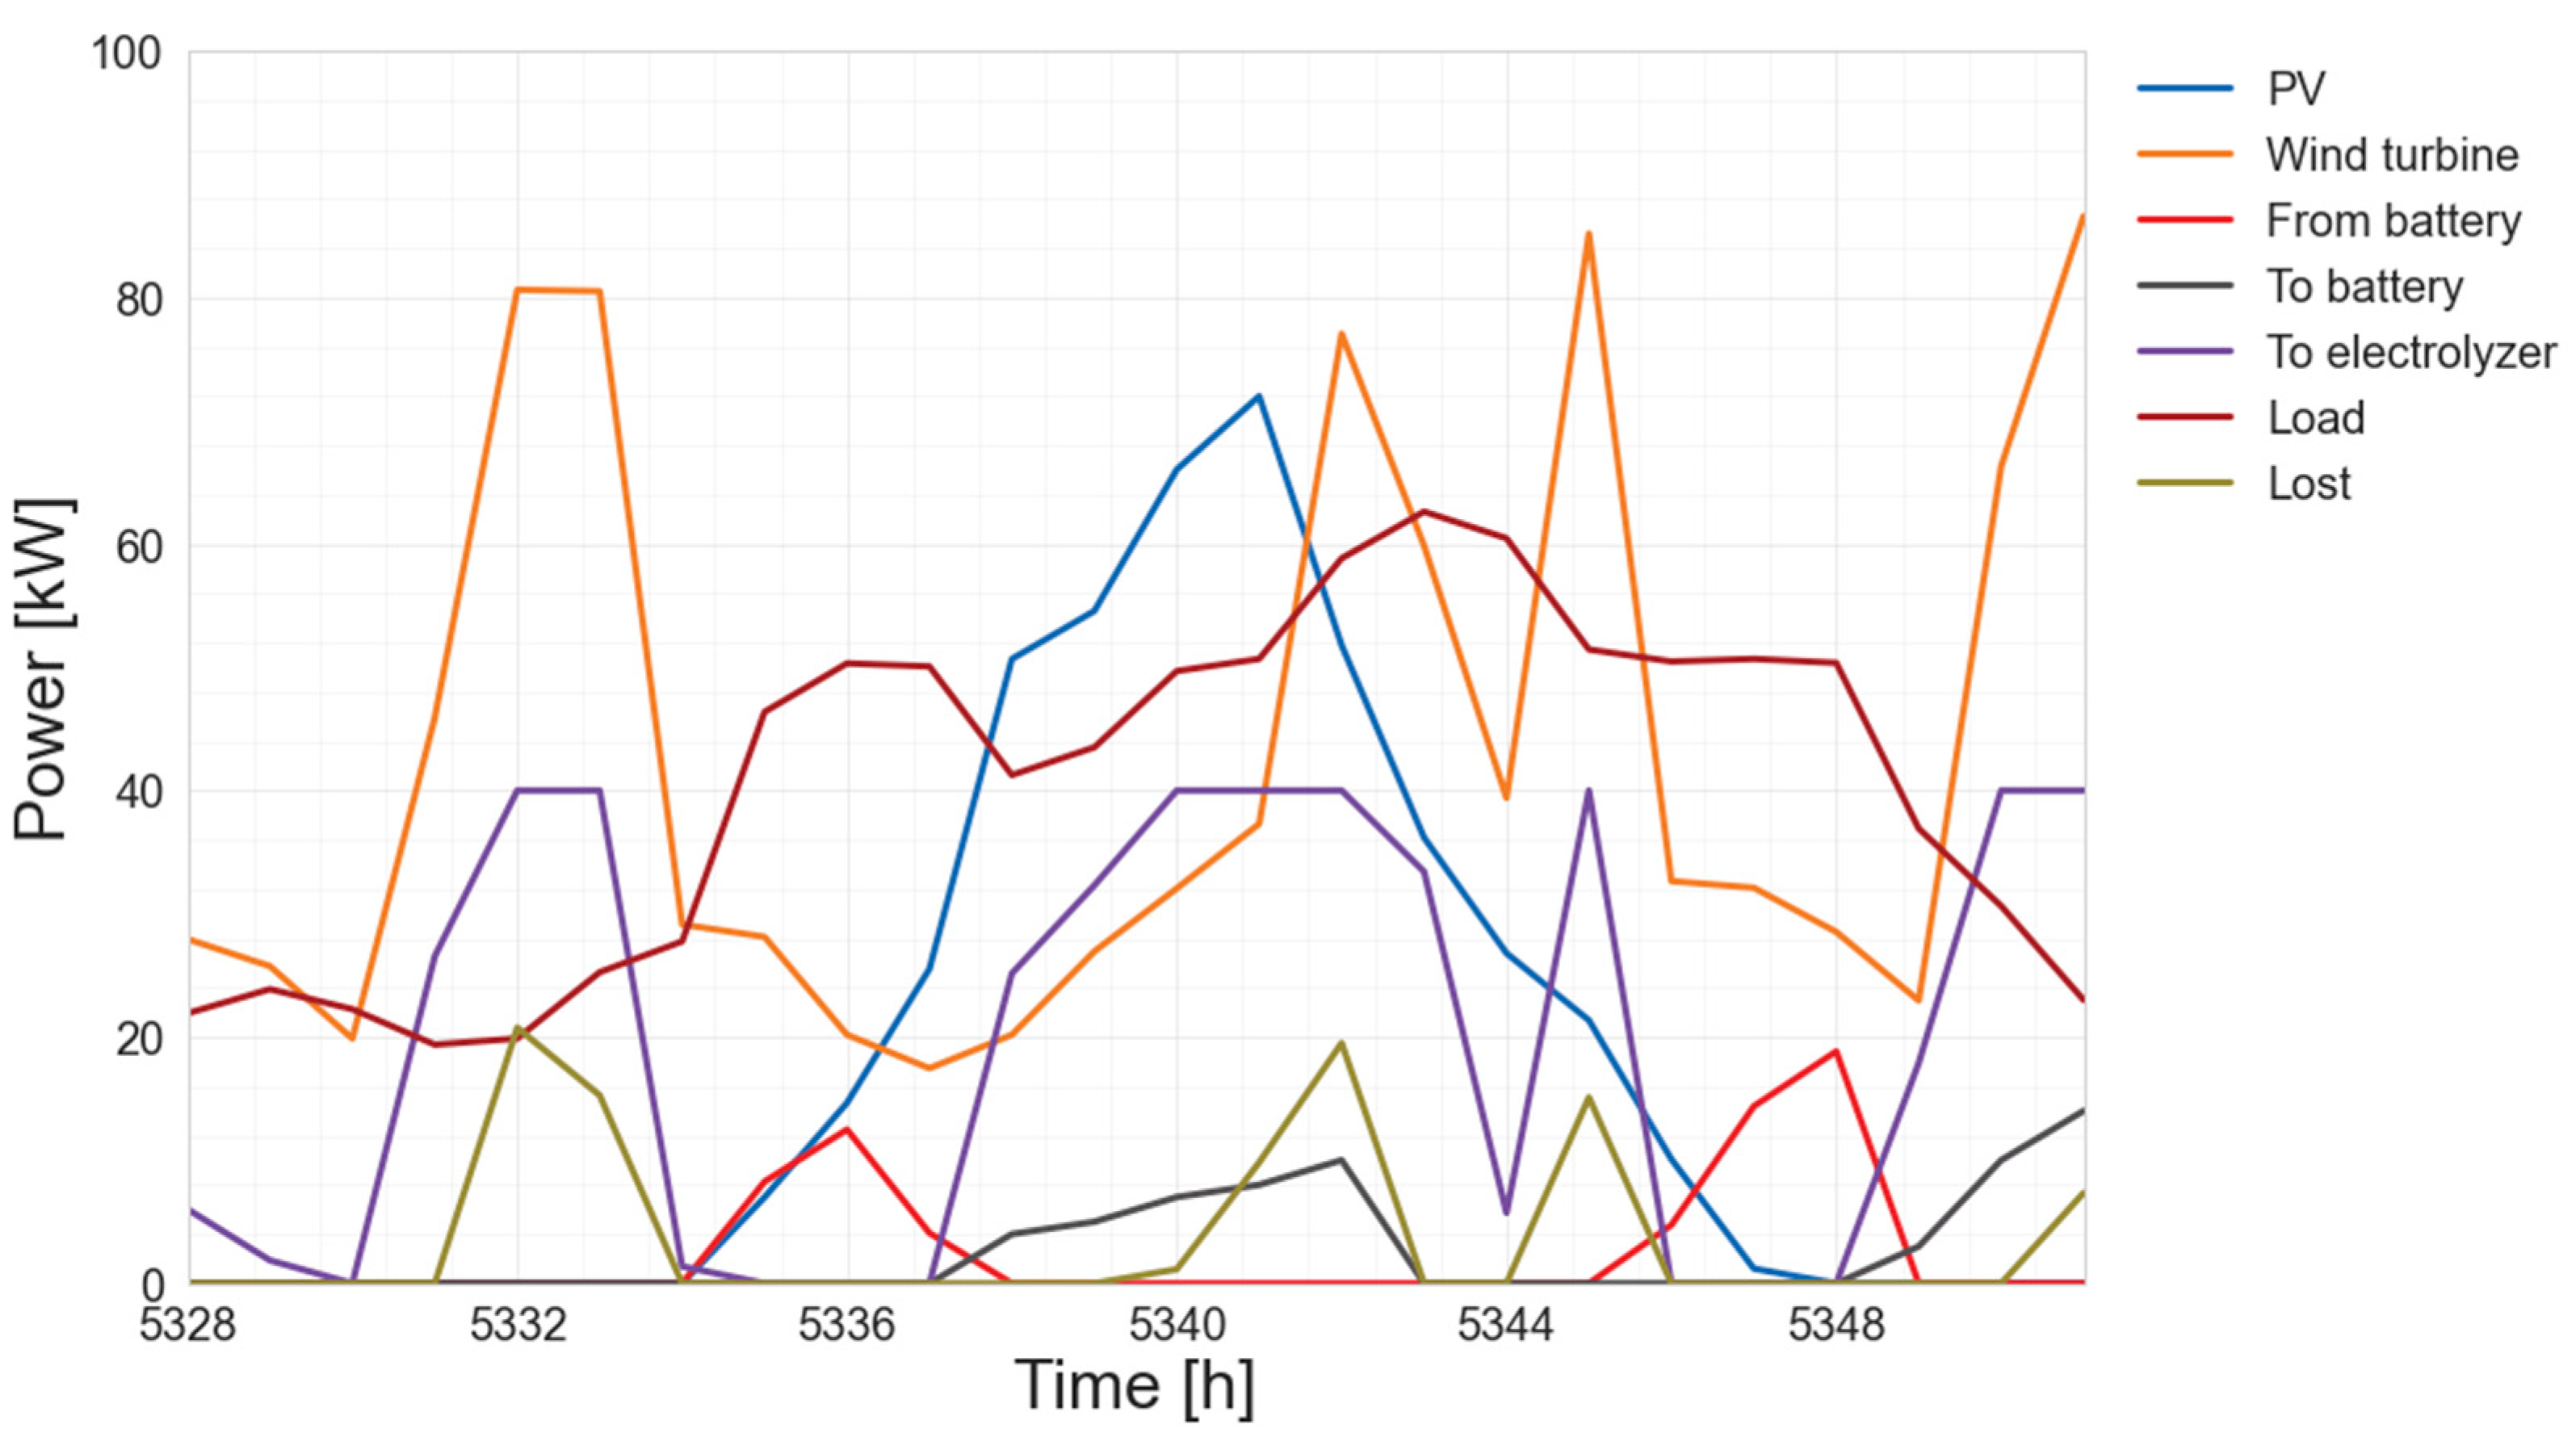
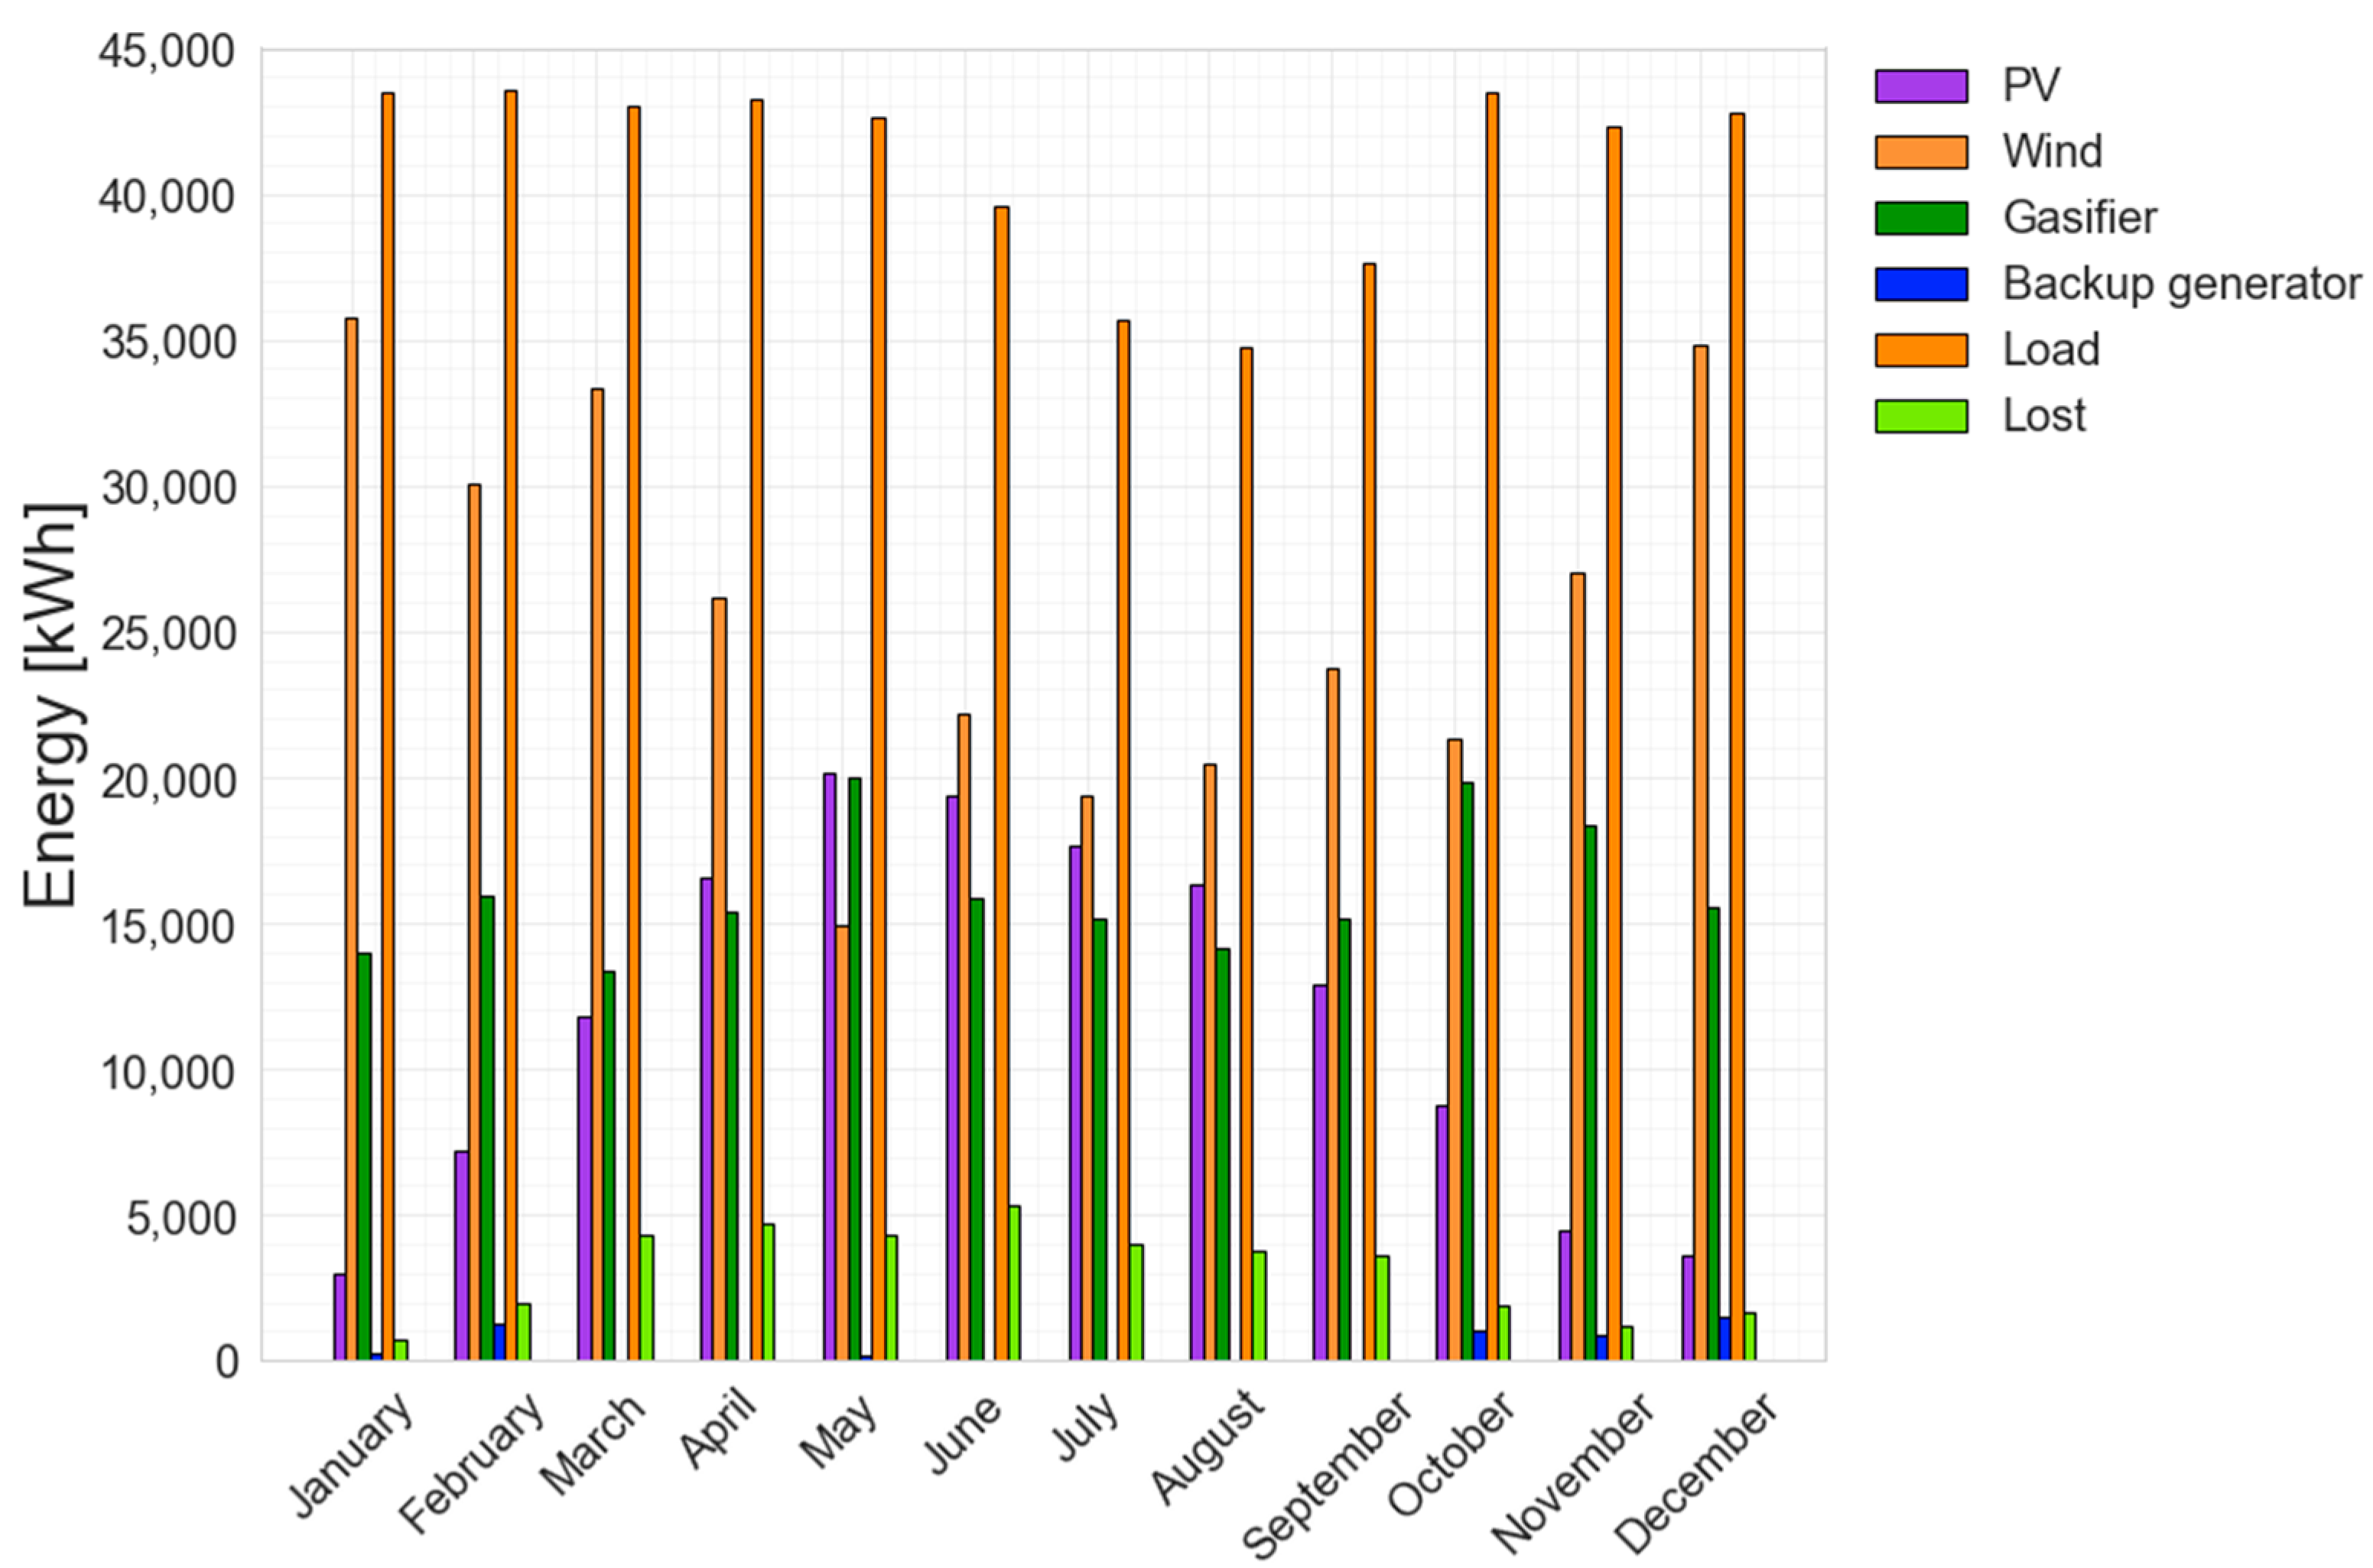
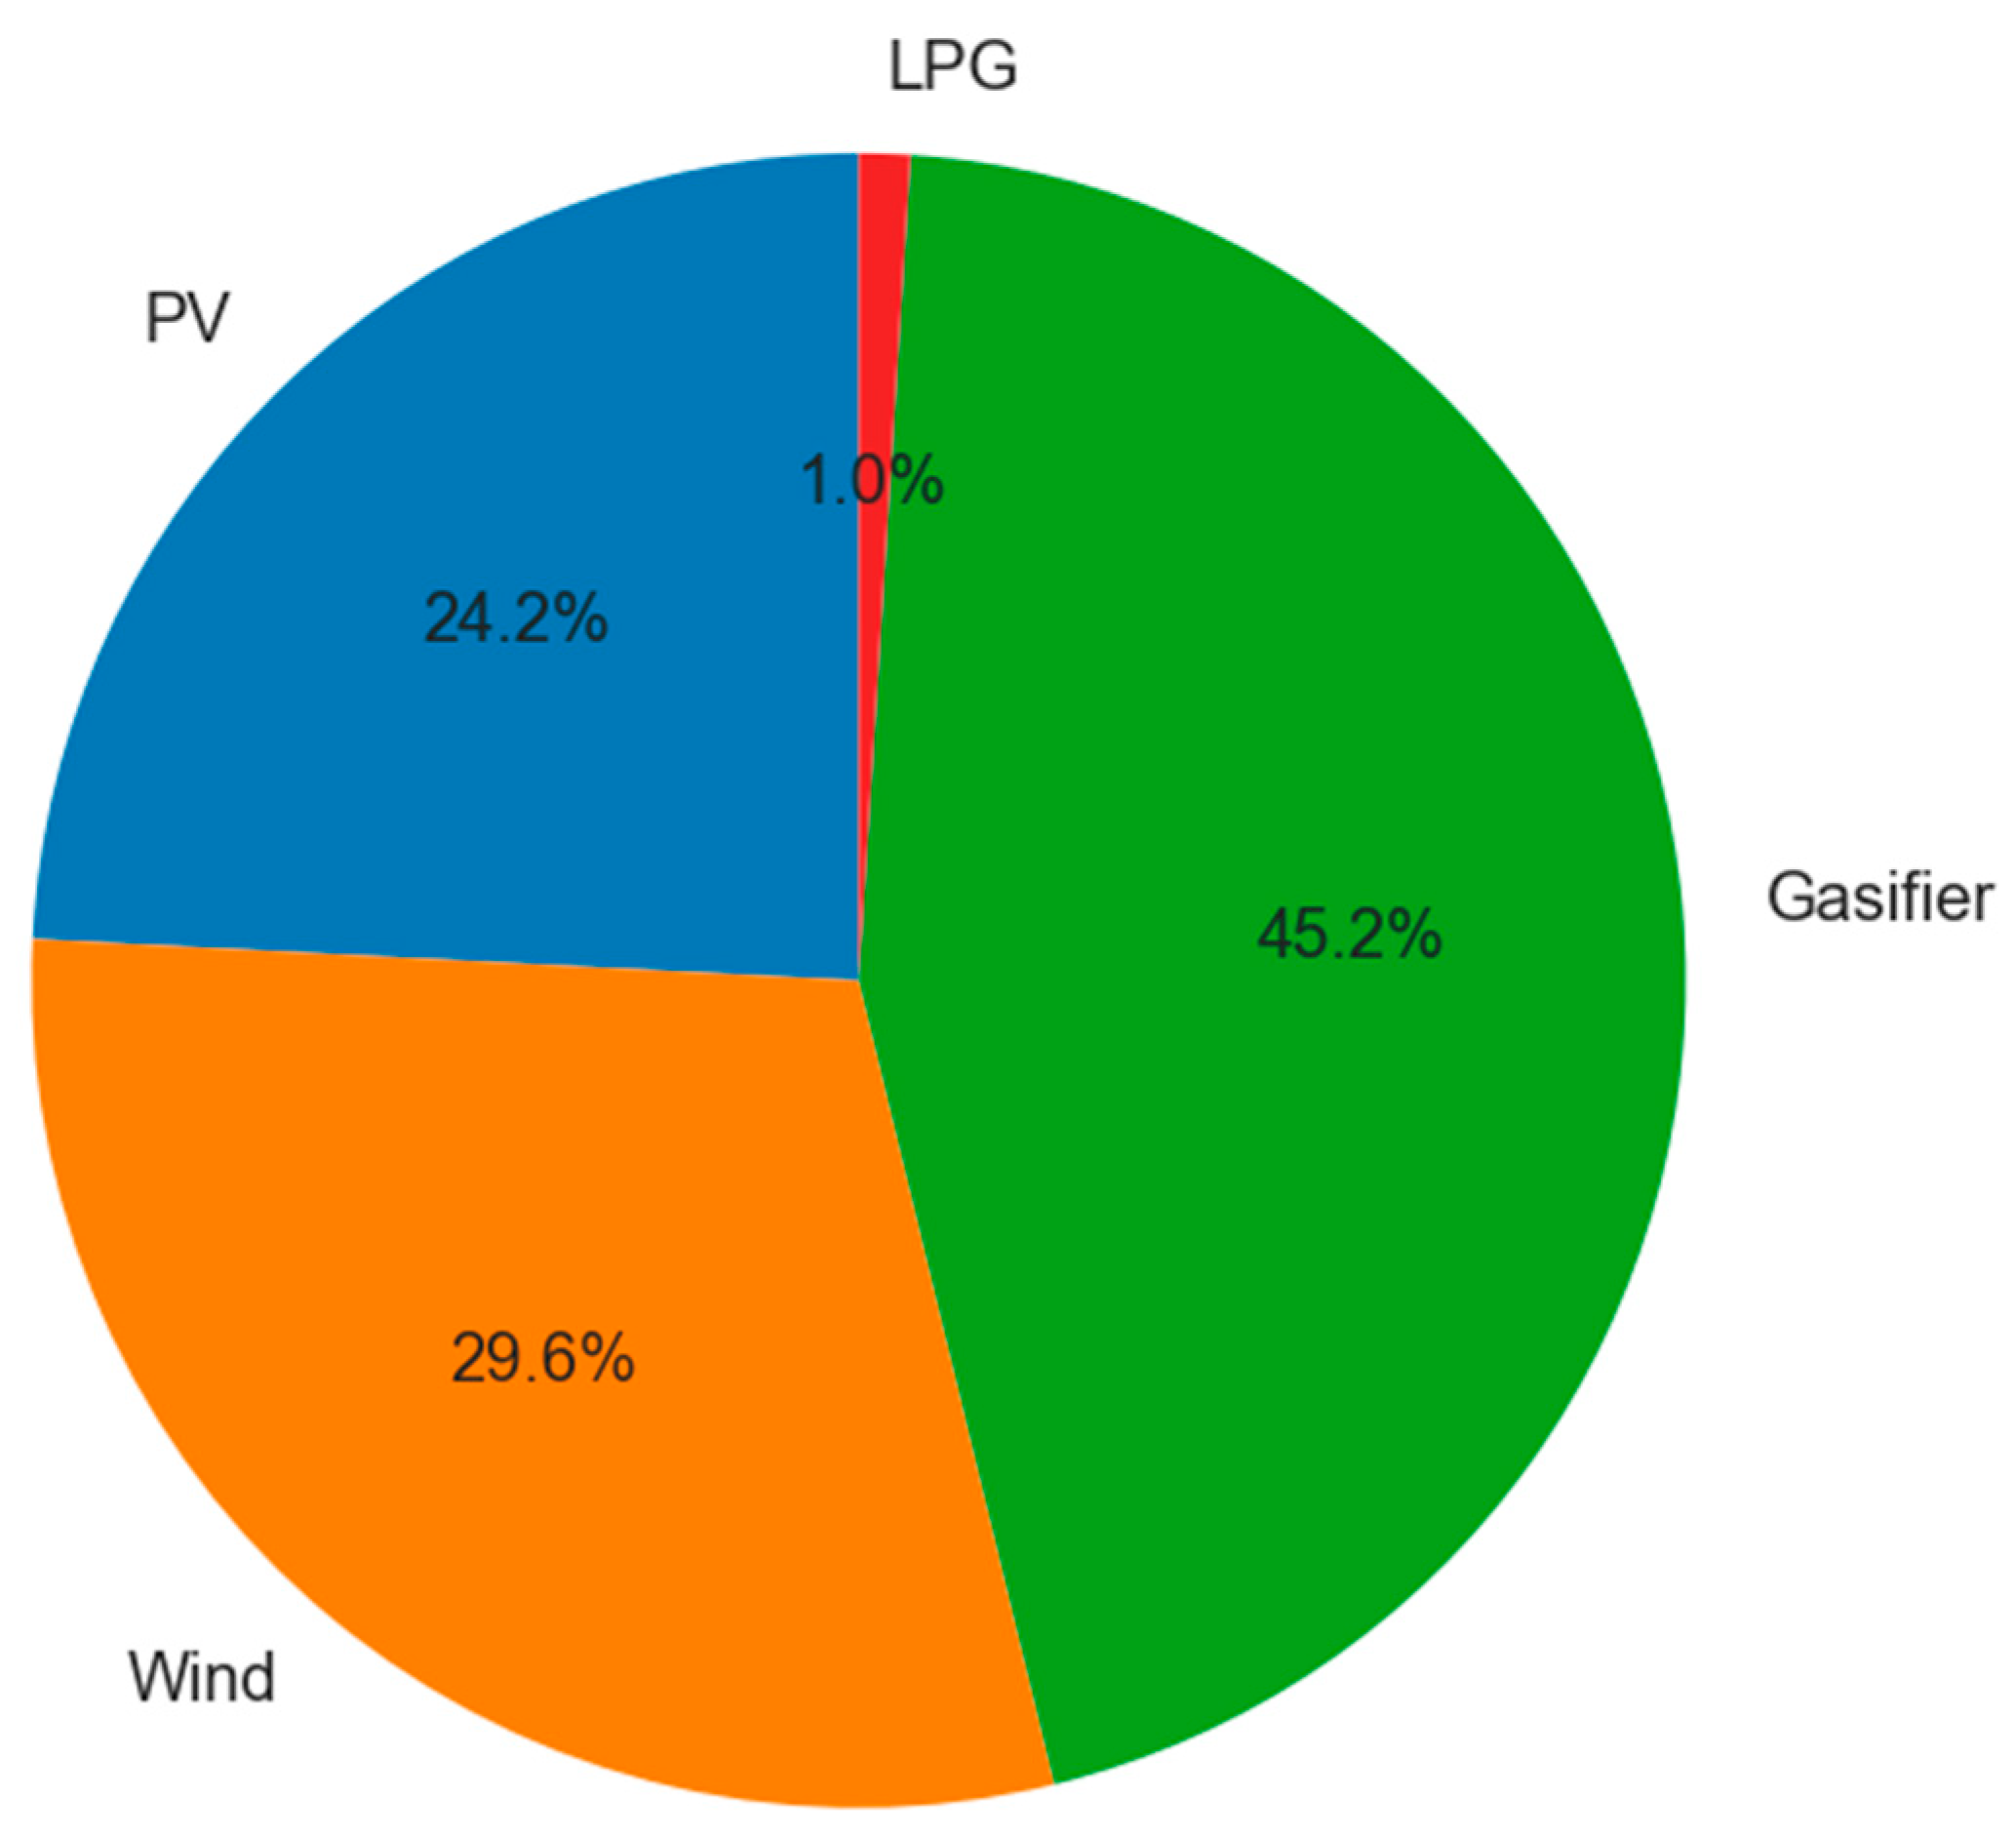
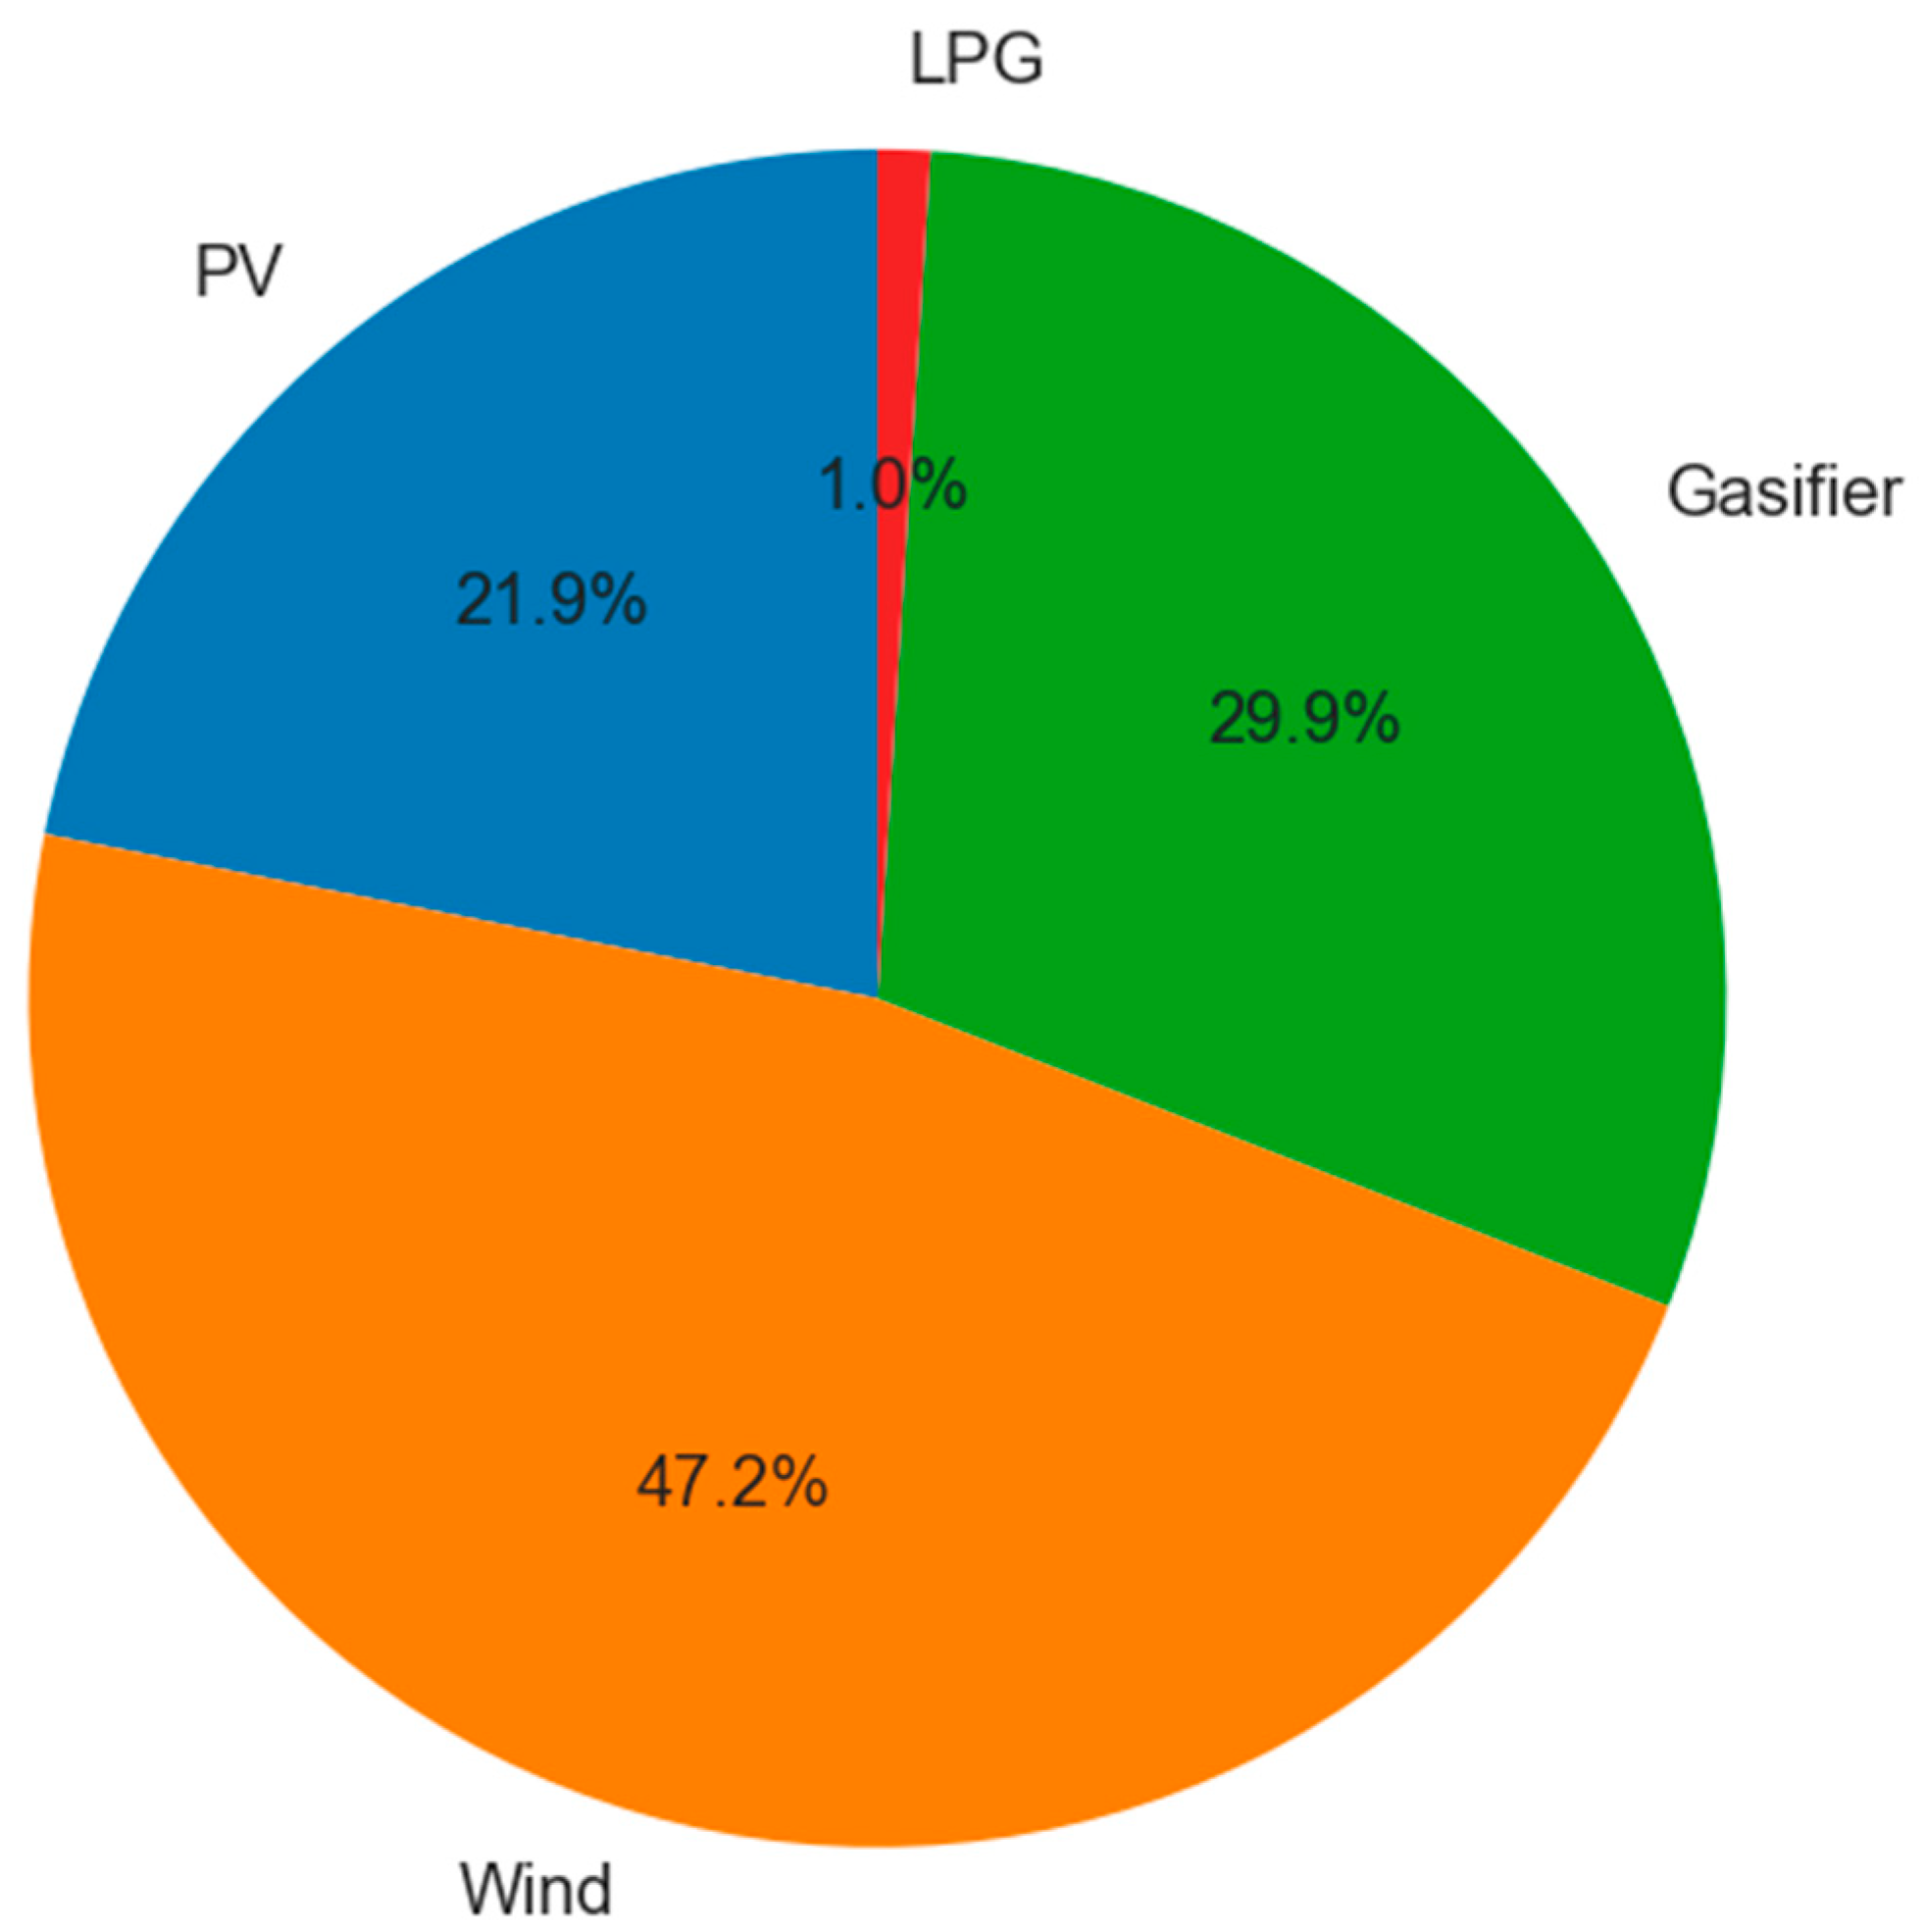
  • Presented energy systems are both producing excess energy—Gdansk 31% and Agkistro 43%. Amounts of lost energy are highest in the summer months, which justifies future research to improve the control algorithm, e.g., by disconnecting the gasifier in the summer;
  • The operation costs related to the consumption of fuels (LPG and biomass) is different among the selected locations due to the different availability of wind and solar energy sources and capacity of components. The gasifier is more frequently activated in Agkistro compared to Gdansk, which leads to a 19.3% higher cost of exploitation. Conversely, the cost for LPG is higher in the case of Gdansk with respect to Agkistro (30%);
  • The proposed system is not profitable in the case of Agkistro, since a Simple Pay Back period of over 22 years is achieved. In the case of Gdansk, this index achieves a value of 12.5 years, which shows that such investment may be profitable. It is worth noticing, that the presented system satisfies less than 1% of its needs from fossil fuels, which makes it possible to reduce initial costs in future research by omitting the gas infrastructure.
In general, systems with electrochemical cells, e.g., fuel cell and electrolyzer, benefit from stable loads because of the transient behavior that these devices exhibit. Most commonly, load profiles in the manufacturing industry show less stochasticity than residential profiles since they result from mainly iterative processes with fixed or known requirements and schedules. The methodology and control algorithm implemented in this paper can be tailored to simulate and optimize industrial processes from the energy point of view. Furthermore, renewable energy systems can totally replace fossil fuels wherever they are present in the energy mix of an industry (e.g., transportation of goods, heating/cooling, etc.), minimizing the CO2 footprint of the final product. Future research will include a technoeconomic analysis of this research aspect which can determine whether or not such implementation of renewable energy systems can be economically beneficial. Further future research dealing with the proposed system will aim to expand the knowledge regarding its operation characteristics, such as independency from fossil fuels, production of excess energy, and economic profitability, as a function of different settings for the operation strategy and size of components. Moreover, the next research step will be the development of various algorithms controlling the operation of the gasifier depending on the season. In the presented study, a relatively large amount energy is curtailed in the summer season, which can be omitted by adapting optimized control strategy.

Author Contributions

Conceptualization, K.P., A.K. and M.Ż.; methodology, M.Ż. and R.F.; software, M.Ż. and R.F.; validation, A.K. and R.F.; formal analysis, R.F.; investigation, M.Ż.; resources, A.K., M.Ż., and K.P.; data curation, A.K.; writing—original draft preparation, M.Ż., R.F. and A.K.; writing—review and editing, R.F. and A.K.; visualization, M.Ż.; supervision, R.F. and K.P.; project administration, M.Ż. and K.P.; funding acquisition, M.Ż. and K.P. All authors have read and agreed to the published version of the manuscript.

Funding

This research has been carried out with statutory research funds of the Faculty of Energy and Fuels, AGH UST in Krakow. Part of this research was funded by the Polish Ministry of Higher Education on the basis of the decision number 0086/DIA/2019/48. Part of this research was funded by the European Union HORIZON 2020 project REMOTE—Remote area Energy supply with Multiple Options for integrated hydrogen-based Technologies, under Grand Agreement Number: 779541.

Data Availability Statement

Not applicable.

Acknowledgments

This work was carried out under Subvention for Young Scientists, Faculty of Energy and Fuels, AGH University of Science and Technology, Krakow, Poland. The authors acknowledge the use of the infrastructure of the Center of Energy, AGH UST in Krakow. The research was supported by the Foundation for Polish Science (FNP).

Conflicts of Interest

The authors declare no conflict of interest.

References

  1. Hirsch, A.; Parag, Y.; Guerrero, J. Microgrids: A Review of Technologies, Key Drivers, and Outstanding Issues. Renew. Sustain. Energy Rev. 2018, 90, 402–411. [Google Scholar] [CrossRef]
  2. Baccioli, A.; Orecchini, F.; Peloriadi, K.; Iliadis, P.; Boutikos, P.; Atsonios, K.; Grammelis, P.; Nikolopoulos, A. Technoeconomic Assessment of LNG-Fueled Solid Oxide Fuel Cells in Small Island Systems: The Patmos Island Case Study. Energies 2022, 15, 3892. [Google Scholar]
  3. Yadav, D.; Singh, R.; Kumar, A.; Sarkar, B. Reduction of Pollution through Sustainable and Flexible Production by Controlling By-Products. J. Environ. Inform. 2022, in press. [Google Scholar] [CrossRef]
  4. Khodaei, H.; Hajiali, M.; Darvishan, A.; Sepehr, M.; Ghadimi, N. Fuzzy-Based Heat and Power Hub Models for Cost-Emission Operation of an Industrial Consumer Using Compromise Programming. Appl. Therm. Eng. 2018, 137, 395–405. [Google Scholar] [CrossRef]
  5. Abedinia, O.; Zareinejad, M.; Doranehgard, M.H.; Fathi, G.; Ghadimi, N. Optimal Offering and Bidding Strategies of Renewable Energy Based Large Consumer Using a Novel Hybrid Robust-Stochastic Approach. J. Clean. Prod. 2019, 215, 878–889. [Google Scholar] [CrossRef]
  6. Ghadimi, N.; Akbarimajd, A.; Shayeghi, H.; Abedinia, O. Two Stage Forecast Engine with Feature Selection Technique and Improved Meta-Heuristic Algorithm for Electricity Load Forecasting. Energy 2018, 161, 130–142. [Google Scholar] [CrossRef]
  7. Żołądek, M.; Filipowicz, M.; Sornek, K.; Figaj, R. Energy Performance of the photovoltaic system in urban area—Case study. IOP Conf. Ser. Earth Environ. Sci. 2019, 214, 012123. [Google Scholar] [CrossRef]
  8. Kasaeian, A.; Nouri, G.; Ranjbaran, P.; Wen, D. Solar Collectors and Photovoltaics as Combined Heat and Power Systems: A Critical Review. Energy Convers Manag. 2018, 156, 688–705. [Google Scholar] [CrossRef]
  9. Filipowicz, M.; Żołądek, M.; Goryl, W.; Sornek, K. Urban Ecological Energy Generation on the Example of Elevation Wind Turbines Located at Center of Energy AGH. E3S Web Conf. 2018, 49, 00023. [Google Scholar] [CrossRef]
  10. Li, H.; Campana, P.E.; Tan, Y.; Yan, J. Feasibility Study about Using a Stand-Alone Wind Power Driven Heat Pump for Space Heating. Appl. Energy 2018, 228, 1486–1498. [Google Scholar] [CrossRef]
  11. Breault, R.W. Gasification Processes Old and New: A Basic Review of the Major Technologies. Energies 2010, 3, 216–240. [Google Scholar] [CrossRef] [Green Version]
  12. Jankowski, M.; Borsukiewicz, A.; Hooman, K. Development of Decision-Making Tool and Pareto Set Analysis for Bi-Objective Optimization of an ORC Power Plant. Energies 2020, 13, 5280. [Google Scholar] [CrossRef]
  13. Sornek, K. Study of Operation of the Thermoelectric Generators Dedicated to Wood-Fired Stoves. Energies 2021, 14, 6264. [Google Scholar] [CrossRef]
  14. Tschiggerl, K.; Sledz, C.; Topic, M. Considering Environmental Impacts of Energy Storage Technologies: A Life Cycle Assessment of Power-to-Gas Business Models. Energy 2018, 160, 1091–1100. [Google Scholar] [CrossRef]
  15. Sarkar, B.; Mridha, B.; Pareek, S. A Sustainable Smart Multi-Type Biofuel Manufacturing with the Optimum Energy Utilization under Flexible Production. J. Clean. Prod. 2022, 332, 129869. [Google Scholar] [CrossRef]
  16. Habib, M.S.; Omair, M.; Ramzan, M.B.; Chaudhary, T.N.; Farooq, M.; Sarkar, B. A Robust Possibilistic Flexible Programming Approach toward a Resilient and Cost-Efficient Biodiesel Supply Chain Network. J. Clean. Prod. 2022, 366, 132752. [Google Scholar] [CrossRef]
  17. Garai, A.; Sarkar, B. Economically Independent Reverse Logistics of Customer-Centric Closed-Loop Supply Chain for Herbal Medicines and Biofuel. J. Clean. Prod. 2022, 334, 129977. [Google Scholar] [CrossRef]
  18. Ogbonnaya, C.; Abeykoon, C.; Nasser, A.; Turan, A.; Ume, C.S. Prospects of Integrated Photovoltaic-Fuel Cell Systems in a Hydrogen Economy: A Comprehensive Review. Energies 2021, 14, 6827. [Google Scholar] [CrossRef]
  19. Khan, Z.A.; Imran, M.; Altamimi, A.; Diemuodeke, O.E.; Abdelatif, A.O. Assessment of Wind and Solar Hybrid Energy for Agricultural Applications in Sudan. Energies 2021, 15, 5. [Google Scholar] [CrossRef]
  20. Akter, H.; Howlader, H.O.R.; Nakadomari, A.; Islam, M.R.; Saber, A.Y.; Senjyu, T. A Short Assessment of Renewable Energy for Optimal Sizing of 100% Renewable Energy Based Microgrids in Remote Islands of Developing Countries: A Case Study in Bangladesh. Energies 2022, 15, 1084. [Google Scholar] [CrossRef]
  21. Hidalgo-Leon, R.; Amoroso, F.; Urquizo, J.; Villavicencio, V.; Torres, M.; Singh, P.; Soriano, G. Feasibility Study for Off-Grid Hybrid Power Systems Considering an Energy Efficiency Initiative for an Island in Ecuador. Energies 2022, 15, 1776. [Google Scholar] [CrossRef]
  22. Tarife, R.; Nakanishi, Y.; Chen, Y.; Zhou, Y.; Estoperez, N.; Tahud, A. Optimization of Hybrid Renewable Energy Microgrid for Rural Agricultural Area in Southern Philippines. Energies 2022, 15, 2251. [Google Scholar] [CrossRef]
  23. Dimou, A.; Vakalis, S. Technoeconomic Analysis of Green Energy Transitions in Isolated Grids: The Case of Ai Stratis—Green Island. Renew. Energy 2022, 195, 66–75. [Google Scholar] [CrossRef]
  24. Barone, G.; Buonomano, A.; Forzano, C.; Giuzio, G.F.; Palombo, A. Increasing Renewable Energy Penetration and Energy Independence of Island Communities: A Novel Dynamic Simulation Approach for Energy, Economic, and Environmental Analysis, and Optimization. J. Clean. Prod. 2021, 311, 127558. [Google Scholar] [CrossRef]
  25. Hoseinzadeh, S.; Astiaso Garcia, D. Techno-Economic Assessment of Hybrid Energy Flexibility Systems for Islands’ Decarbonization: A Case Study in Italy. Sustain. Energy Technol. Assess. 2022, 51, 101929. [Google Scholar] [CrossRef]
  26. Cabrera, P.; Carta, J.A.; Lund, H.; Thellufsen, J.Z. Large-Scale Optimal Integration of Wind and Solar Photovoltaic Power in Water-Energy Systems on Islands. Energy Convers Manag. 2021, 235, 113982. [Google Scholar] [CrossRef]
  27. Figaj, R. Performance Assessment of a Renewable Micro-Scale Trigeneration System Based on Biomass Steam Cycle, Wind Turbine, Photovoltaic Field. Renew. Energy 2021, 177, 193–208. [Google Scholar] [CrossRef]
  28. Figaj, R.; Sornek, K.; Podlasek, S.; Żołądek, M. Operation and Sensitivity Analysis of a Micro-Scale Hybrid Trigeneration System Integrating a Water Steam Cycle and Wind Turbine under Different Reference Scenarios. Energies 2020, 13, 5697. [Google Scholar] [CrossRef]
  29. Klein, S.A. TRNSYS 18: A Transient System Simulation Program; Solar Energy Laboratory, University of Wisconsin: Madison, WI, USA, 2017. [Google Scholar]
  30. Calise, F. High Temperature Solar Heating and Cooling Systems for Different Mediterranean Climates: Dynamic Simulation and Economic Assessment. Appl. Therm. Eng. 2012, 32, 108–124. [Google Scholar] [CrossRef]
  31. Calise, F.; Figaj, R.; Vanoli, L. Energy and Economic Analysis of Energy Savings Measures in a Swimming Pool Centre by Means of Dynamic Simulations. Energies 2018, 11, 2182. [Google Scholar] [CrossRef]
  32. Figaj, R.; Żołądek, M.; Gory, W. Dynamic Simulation and Energy Economic Analysis of a Household Hybrid Ground-Solar-Wind System Using TRNSYS Software. Energies 2020, 13, 3523. [Google Scholar] [CrossRef]
  33. Hummer H25.0-100KW—100,00 KW—Wind Turbine. Available online: https://en.wind-turbine-models.com/turbines/1682-hummer-h25.0-100kw (accessed on 11 August 2022).
  34. Waste to Energy Companies—Ankur Scientific. Available online: https://www.ankurscientific.com/ (accessed on 11 August 2022).
  35. Duffie, J.A.; Beckman, W.A. Solar Engineering of Thermal Processes, 2nd ed.; Wiley-Interscience: New York, NY, USA, 1991. [Google Scholar]
  36. Hyman, E.A. Phenomenological Cell Modelling: A Tool for Planning and Analyzing Battery Testing at the BEST Facility; U. S. Department of Energy: Newark, NJ, USA, 1977.
  37. HYDROGEMS. Hydrog En E Nergy M Odel S; Institute for Energy Technology: Kjeller, Norway, 1995. [Google Scholar]
  38. Ulleberg, Ø. Modeling of Advanced Alkaline Electrolyzers: A System Simulation Approach. Int. J. Hydrogen Energy 2003, 28, 21–33. [Google Scholar] [CrossRef]
  39. Çengel, Y.A.; Boles, M.A.; Kanoğlu, M. Thermodynamics: An Engineering Approach, 9th ed.; McGraw-Hill Education: New York, NY, USA, 2019; p. 1009. [Google Scholar]
  40. Lloyd, C.R. Assessment of Diesel Use in Remote Area Power Supply; Internal report prepared for the Australian Greenhouse Office; Energy Strategies: Canberra, Australia, 1999. [Google Scholar]
  41. Figaj, R.; Żołądek, M. Experimental and Numerical Analysis of Hybrid Solar Heating and Cooling System for a Residential User. Renew. Energy 2021, 172, 955–967. [Google Scholar] [CrossRef]
  42. International LNG Prices by Select Region 2021 | Statista. Available online: https://www.statista.com/statistics/252984/landed-prices-of-liquefied-natural-gas-in-selected-regions-worldwide/ (accessed on 11 August 2022).
  43. Woodfuel Economics—Forest Research. Available online: https://www.forestresearch.gov.uk/tools-and-resources/fthr/urban-regeneration-and-greenspace-partnership/greenspace-in-practice/benefits-of-greenspace/woodfuel-economics/ (accessed on 11 August 2022).
  44. How Much Money Does a Wind Turbine Produce From Electricity It Generates?—Anemoi ServicesAnemoi Services. Available online: http://anemoiservices.com/industry-news/how-much-money-does-a-wind-turbine-produce-from-electricity-it-generates/ (accessed on 11 August 2022).
  45. Solar PV Installation Cost Worldwide 2021 | Statista. Available online: https://www.statista.com/statistics/809796/global-solar-power-installation-cost-per-kilowatt/ (accessed on 11 August 2022).
  46. Ramasamy, V.; Feldman, D.; Desai, J.; Margolis, R. U.S. Solar Photovoltaic System and Energy Storage Cost Benchmarks: Q1 2021; National Renewable Energy Lab. (NREL): Golden, CO, USA, 2021. [Google Scholar]
  47. Zauner, A.; Böhm, H.; Rosenfeld, D.; Tichler, R. Innovative Large-Scale Energy Storage Technologies and Power-to-Gas Concepts after Optimization D7.7 Analysis on Future Technology Options and on Techno-Economic Optimization. 2019. Available online: https://ec.europa.eu/research/participants/documents/downloadPublic?documentIds=080166e5c58ae3ff&appId=PPGMS (accessed on 9 June 2022).
  48. Gorre, J.; Ruoss, F.; Karjunen, H.; Schaffert, J.; Tynjälä, T. Cost Benefits of Optimizing Hydrogen Storage and Methanation Capacities for Power-to-Gas Plants in Dynamic Operation. Appl. Energy 2020, 257, 113967. [Google Scholar] [CrossRef]
  49. Cigolotti, V.; Genovese, M.; Fragiacomo, P. Comprehensive Review on Fuel Cell Technology for Stationary Applications as Sustainable and Efficient Poly-Generation Energy Systems. Energies 2021, 14, 4963. [Google Scholar] [CrossRef]
  50. Borello, D.; de Caprariis, B.; de Filippis, P.; di Carlo, A.; Marchegiani, A.; Pantaleo, A.M.; Shah, N.; Venturini, P. Thermo-Economic Assessment of a Olive Pomace Gasifier for Cogeneration Applications. Energy Procedia 2015, 75, 252–258. [Google Scholar] [CrossRef]
  51. Ericson, S.; Olis, D. A Comparison of Fuel Choice for Backup Generators; The Joint Institute for Strategic Energy Analysis: Golden, CO, USA, 2019. [Google Scholar] [CrossRef]
  52. Karagiorgas, M.; Tsoutsos, T.; Moiá-Pol, A. A Simulation of the Energy Consumption Monitoring in Mediterranean Hotels: Application in Greece. Energy Build 2007, 39, 416–426. [Google Scholar] [CrossRef]
  53. Ogrodniczuk, J.; Węglarz, A.; Kamieniecka, J. Energia w Obiekcie Turystycznym; Fundacja Instytut na rzecz Ekorozwoju: Warsaw, Poland, 2011. [Google Scholar]
  54. RYNEK HOTELARSKI W POLSCE—RAPORT 2019 by BROG B2B Sp. z o.o. S.K.—Issuu. Available online: https://issuu.com/brogmarketing/docs/rynek_hotelarski_w_polsce_-_raport_2019 (accessed on 9 June 2022).
  55. About Us | Krajowa Agencja Poszanowania Energii | KAPE S.A. Available online: https://kape.gov.pl/about-us (accessed on 9 June 2022).
Figure 1. Main components of the system and their connection to the AC bus.
Sustainability 14 12470 g001
Figure 2. Load curve for Agkistro for different reference days within the year.
Sustainability 14 12470 g002
Figure 3. Load curve for Gdansk for different reference days within the year.
Sustainability 14 12470 g003
Figure 4. Electrical powers of the system in case of overproduction—selected day of 3 June, Agkistro.
Sustainability 14 12470 g004
Figure 5. Electrical powers of the system for the case of complementary production—selected day of 10 August, Agkistro.
Sustainability 14 12470 g005
Figure 6. Electrical powers of the system for the case of underproduction—selected day of 8 December Agkistro.
Sustainability 14 12470 g006
Figure 7. Electrical powers of the system for the case of low wind availability period—11–17 October, Agkistro.
Sustainability 14 12470 g007
Figure 8. Battery and hydrogen state of charge for the case of low wind availability period—11–17 October Agkistro.
Sustainability 14 12470 g008
Figure 9. Electrical energies of the system, monthly analysis—Agkistro.
Sustainability 14 12470 g009
Figure 10. SOC of the energy storage devices—Agkistro.
Sustainability 14 12470 g010
Figure 11. The percentage time of use of individual subsystems—Agkistro.
Sustainability 14 12470 g011
Figure 12. Electrical powers of the system for the case of overproduction—selected day of 28 February, Gdansk.
Sustainability 14 12470 g012
Figure 13. Electrical powers of the system for the case of complementary production—selected day of 9 March, Gdansk.
Sustainability 14 12470 g013
Figure 14. Electrical powers of the system for the case of underproduction—selected day of 9 February, Gdansk.
Sustainability 14 12470 g014
Figure 15. Electrical powers of the system for the case of low wind availability period—25–28 November, Gdansk.
Sustainability 14 12470 g015
Figure 16. Battery and hydrogen state of charge for the case of low wind availability period—25–28 November, Gdansk.
Sustainability 14 12470 g016
Figure 17. Electrical energies of the system, monthly analysis—Gdansk.
Sustainability 14 12470 g017
Figure 18. SOC of the energy storage devices—Gdansk.
Sustainability 14 12470 g018
Figure 19. The percentage time of use of individual subsystems—Gdansk.
Sustainability 14 12470 g019
Figure 20. Percentage contribution of subsystems to total yearly energy consumption Agkistro.
Sustainability 14 12470 g020
Figure 21. Percentage contribution of subsystems to total yearly energy consumption Gdansk.
Sustainability 14 12470 g021
Table 1. Literature review.
TechnologyProject ScaleEvaluation ToolEconomic EvaluationLocationRef.
PV + wind30–480 kWh/yearHomer proLCOE = 0.36–1.28 EUR/kWhSudan[19]
PV + battery + fuel cell31 kWMatlab-Bangladesh[20]
PV + diesel + battery50 kWHomer proLCOE = 0.390–0.421 EUR/kWhEcuador[21]
PV + diesel + battery + hydroelectric plantAgriculture processing facilityMatlabLCOE = 0.197 EUR/kWhPhilippines[22]
PV + wind + battery + dieselNon-interconnected islandHomer proLCOE = 0.148–0.295 EUR/kWhGreece[23]
PV + wind-power hydro storage + battery + diesel + solar thermal collectorsNon-interconnected island + reverse osmosis plantTRNSYSSPBT = 8.9 yearsCanary Islands[24]
PV + wind + fuel cell2 MWHomer pro-Sicily, Italy[25]
PV + wind + dieselNon-interconnected island + reverse osmosis plantEnergyPLAN + Matlab-Canary Islands[26]
PV + wind + biomass RCZootechnical farmTRNSYSSPBT = 10.1 yearsPoland[27]
Biomass RC + windZootechnical farmTRNSYSSPBT = 5.92 yearsPoland[28]
PV + wind + biomass gasifier + battery + fuel cell + LPGTourist resortTRNSYSSPBT = 12.5/22.5 yearsPoland/GreeceCurrent study
Table 2. TRNSYS build-in library components used to develop the model of the system.
ComponentTypeRef.ComponentTypeRef.
WT90[33]Mini-grid controlling system105[29]
PV103b[35]Inverter, charge controller175, 48[29]
BAT47a[36]On/off differential controller911[29]
FC173[37]Data plotter25c[29]
ELY160[38]Data reader9a[29]
HS164[39]Data integrator24[29]
LPG120[40]Weather data processor15[29]
Table 3. Sizes of specific parts of the installation.
PWTPPVPGasPFCPElyCapH2PbatCapbst
Agkistro100100356040150060500
Gdansk70120355020150060400
UnitkWkWkWkWkWkWhkWkWh
Table 4. Main energy results of the system for Gdansk and Agkistro locations.
Parameter.AgkistroGdanskUnit
Eload354 × 103492 × 103kWh/year
EWT151 × 103309 × 103kWh/year
EPV126 × 103143 × 103kWh/year
EGas229 × 103192 × 103kWh/year
ERES507 × 103645 × 103kWh/year
Ebackup4 × 1035.2 × 103kWh/year
Ebackup11% load
Ecurtailed152 × 103153 × 103kWh/year
Ecurtailed4331% load
tgas65575507h/year
Normalized equivalent hours, WT0.1720.503-
Normalized equivalent hours, PV0.1440.136-
Table 5. Main economic parameters of the systems for Gdansk and Akistro locations.
ParameterAgkistroGdanskUnitCalculated on the Basis of Ref.
CostWT600,000420,000EUR[32]
CostPV88,000105,600EUR[33]
CostGAS175,000175,000EUR[38]
CostBAT35,00035,000EUR[34]
CostH2circuit1,151,0001,073,000EUR[35,36,37]
CostLPG70,00070,000EUR[39]
Costmaintanance17,50017,500EUR/year-
Biomass cost18,61815,610EUR/year[31]
LPG cost14401872EUR/year[30]
SPBT22.512.5years-
Publisher’s Note: MDPI stays neutral with regard to jurisdictional claims in published maps and institutional affiliations.

